Abstract
Elevated blood lipid levels are heritable risk factors of cardiovascular disease with varying prevalence worldwide due to differing dietary patterns and medication use1. Despite advances in prevention and treatment, particularly through the lowering of low-density lipoprotein cholesterol levels2, heart disease remains the leading cause of death worldwide3. Genome-wide association studies (GWAS) of blood lipid levels have led to important biological and clinical insights, as well as new drug targets, for cardiovascular disease. However, most previous GWAS4–23 have been conducted in European ancestry populations and may have missed genetic variants contributing to lipid level variation in other ancestry groups due to differences in allele frequencies, effect sizes, and linkage-disequilibrium (LD) patterns24. Here we conduct a multi-ancestry genome-wide genetic discovery meta-analysis of lipid levels in ~1.65 million individuals, including 350,000 of non-European ancestries. We quantify the gain in studying non-European ancestries and provide evidence to support expanding recruitment into new ancestries even with relatively smaller sample sizes. We find that increasing diversity rather than studying additional European ancestry individuals results in substantial improvements in fine-mapping functional variants and portability of polygenic prediction (evaluated in N~295,000 from 6 ancestries), with modest gains in the number of discovered loci and ancestry-specific variants. As GWAS expands its emphasis beyond identifying genes and fundamental biology towards using genetic variants for preventive and precision medicine25, we anticipate that increased participant diversity will lead to more accurate and equitable26 application of polygenic scores in clinical practice.
The Global Lipids Genetics Consortium aggregated GWAS results from 1,654,960 individuals from 201 primary studies representing five genetic ancestry groups: Admixed African or African (AdmAFR, N=99.4k, 6.0% of sample), East Asian (EAS, N=146.5k, 8.9%), European (EUR, N=1.32m, 79.8%), Hispanic (HIS, N=48.1k, 2.9%), and South Asian (SAS, N=41.0k, 2.5%) (Table 1, Supplementary Table 1, Supplementary Figure 1). We performed GWAS for five blood lipid traits: low-density lipoprotein cholesterol (LDL-C), high-density lipoprotein cholesterol (HDL-C), triglycerides (TG), total cholesterol (TC), and non-high-density lipoprotein cholesterol (nonHDL-C). Of the 91 million variants imputed from the Haplotype Reference Consortium or 1000 Genomes Phase 3 that successfully passed variant-level QC, 52 million variants were present in at least two cohorts and had sufficient minor allele counts (> 30 in the meta-analysis) to be evaluated as a potential index variant.
Table 1:
Meta-analysis sample size by ancestry group
| Ancestry Group | Sample Size | Number of Cohorts | Mean Sample Size per Cohort (range) | Number of Variants |
|---|---|---|---|---|
| European | 1,320,016 | 146 | 10,928 (173-389,344) | 47 M |
| East Asian | 146,492 | 40 | 7,448 (150-131,050) | 17 M |
| Admixed African/African | 99,432 | 19 | 5,330 (473-62,022) | 33 M |
| Hispanic | 48,057 | 10 | 6,032 (1,496-22,302) | 27 M |
| South Asian | 40,963 | 7 | 6,413 (1,796-16,110) | 17 M |
| Total | 1,654,960 | 201 | 52 M |
The present meta-analysis represents a 6-fold overall increase in sample size relative to the most recent 2018 Million Veteran Program blood lipid meta-analysis13, with a 2-fold increase in sample size of Admixed African and Hispanic individuals.
Ancestry-specific genetic discovery
We first quantified the number of genome-wide significant loci identified in at least one of the five ancestry-specific meta-analyses. We found 773 lipid-associated genomic regions containing 1,765 distinct index variants that reached genome-wide significance (p-value < 5x10⁻⁸, ±500 kb, Supplementary Tables 2–3, Supplementary Figures 2–3) for at least one ancestry group and lipid trait. Of these regions, 237 were novel based on the most-significant index variant in each region being >500 kb from variants previously reported as associated with any of the five lipid traits4–23,27. Of these loci, 76% were identified only in the European ancestry-specific analyses (N~1.3m, 80% of sample). Of the non-European ancestries, the African ancestry GWAS (N~99k, primarily African American) identified more ancestry-specific loci (15 unique to AdmAFR) than any other non-European ancestry group (six loci unique to EAS, six to HIS, one to SAS). The difference is likely attributable to allele frequencies being most different between African and European ancestry populations (Figure 1a–d) and to African populations having greater genetic diversity28.
Figure 1: Comparison of identified loci across ancestry groups.
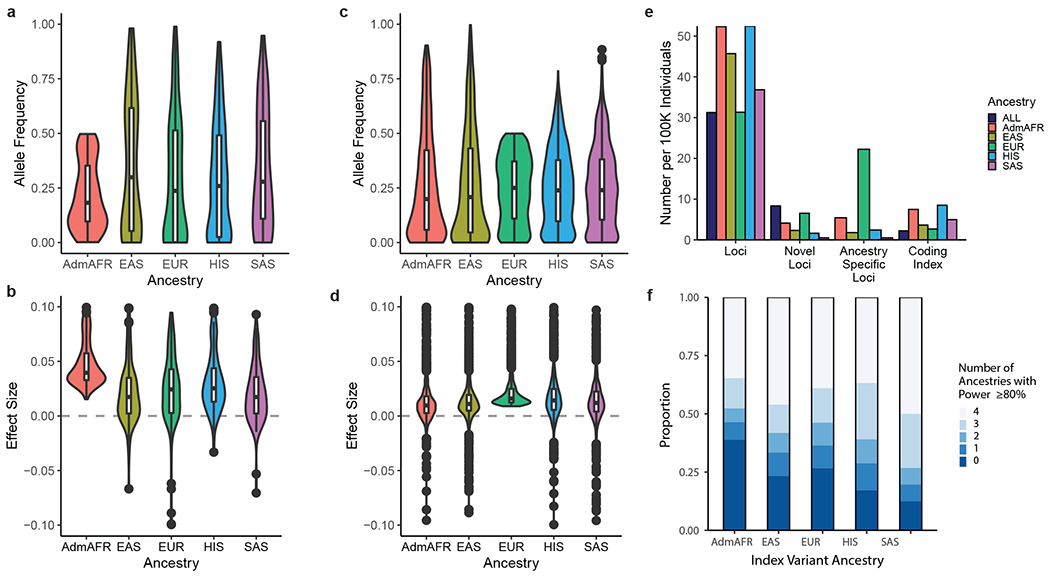
a) Allele frequency distribution and b) effect sizes of Admixed African ancestry index variants in non-African ancestry populations. c) Allele frequency distribution and d) effect sizes of European ancestry index variants in non-European ancestry populations. Boxplots depict the median value as the center, first and third quartiles as box boundaries and whiskers extending 1.5 times the inter-quartile range, with points beyond this region shown individually. Sample sizes for each ancestry are provided in Table 1. The mean effect size of Admixed African ancestry identified index variants is larger than from European ancestry analysis, reflecting the difference in power to detect an association within each group as a result of the >10-fold difference in sample size. e) Number of loci identified within each ancestry group, normalized to a constant sample size of 100,000 individuals and averaged across lipid traits. At currently available sample sizes, trans-ancestry and European ancestry analyses identify a lower proportion of loci relative to the number of individuals than analyses of other ancestry groups. However, the larger sample size of European or trans-ancestry analyses leads to a greater relative proportion of novel loci and a higher proportion of loci significant only in European ancestry analyses. f) Proportion of index variants identified from each ancestry-specific meta-analysis that would be well-powered to detect an association of the same effect size but with ancestry-specific frequencies in the other ancestry groups. Dark blue regions indicate variants likely to be detected at an equivalent sample size only in the original ancestry group (i.e. ancestry-specific). Additional comparisons of allele frequencies and effect sizes across ancestries are provided in Supplementary Figure 3.
Trans-ancestry genetic discovery
We next performed trans-ancestry meta-analyses using the meta-regression approach implemented in MR-MEGA30 to account for heterogeneity in variant effect sizes on lipids between ancestry groups. A total of 1,750 index variants at 923 loci (±500 kb regions) reached genome-wide significance for at least one lipid trait. These included 168 regions not identified by ancestry-specific analysis, 120 (71%) of which were novel (Supplementary Tables 4–5, Supplementary Figure 4, Extended Data Figure 1). Almost all (98%) index variants from the ancestry-specific analysis remained significant (p-value<5x10⁻⁸) after meta-analysis across all ancestry groups, although fifteen AdmAFR, nine EAS, three HIS, and one SAS index variants from ancestry-specific analysis did not (trans-ancestry p-value 7.7x10⁻⁶ to 5.9x10⁻⁸, Supplementary Figure 5, Supplementary Note). In total, we identified 941 lipid-associated loci including 355 novel loci from either single- or trans-ancestry analyses.
Next, we compared the number of loci identified per 100,000 participants in each ancestry group and the combined dataset (Figure 1e). African and Hispanic ancestry-specific analyses identified the most loci per genotyped individual, perhaps due to African ancestry and/or increased genetic diversity. European and trans-ancestry analyses identified slightly fewer loci per 100,000 individuals, likely reflecting a slight reduction in the benefit from new samples added to very large sample sizes (>1m). For the genome-wide significant variants discovered in each ancestry, we estimated the proportion of ancestry-enriched variants by enumerating the number of other ancestries with sufficient power to detect association (range 0 to 4). We estimated the power for discovery of each variant by assuming an equivalent discovery sample size in the other ancestries, fixed effect size, and observed allele frequencies from the other ancestries (Figure 1f). To allow for comparison at similar sample sizes across ancestry groups, we selected European ancestry index variants identified from a meta-analysis of ~100,000 individuals subsampled from the present study. African ancestry index-variants were most ancestry-enriched, with only 61% of index variants demonstrating sufficient power in at least one other ancestry group (equal N, power>80% to reach alpha=5x10⁻⁸), likely due to population-enriched allele frequencies. In comparison, 88% of South Asian index variants had estimated power >80% in at least one other ancestry.
Finally, we found that both the number of identified variants and the mean observed chi-squared values from genome-wide lipid association tests were approximately linearly related to meta-analysis sample size across ancestries (Supplementary Table 6, Extended Data Figure 2). However, in the European ancestry group the incremental increase in either the number of loci or chi-squared value was slightly attenuated at the largest sample sizes. Taken together, these results suggest that once sufficiently well-powered GWAS sample sizes are reached within a given ancestry group, assembling large sample sizes of other under-represented groups will modestly enhance variant discovery relative to increasing the sample size of the dominant ancestry.
Comparison of effects across ancestries
Differences in association signals across ancestries despite similar sample sizes could be due to variation in allele frequencies and/or effect sizes. This could reflect differing patterns of LD with the underlying causal variant or an interaction with an environmental risk factor whose prevalence varies by ancestry and/or geography. We found that effect size estimates of individual variants were largely similar based on pairwise comparison between ancestries (r2=0.93 for variants with p-value<5x10⁻⁸) (Extended Data Figure 3, Supplementary Table 7, Supplementary Figure 6). We additionally tested for genome-level differences in effect size correlation between East Asian, European, and South Asian ancestry groups using Popcorn29, which were not significantly different from 1 (p-value>0.05, Supplementary Figures 7 and 8). We tested for differences in genetic correlation between Admixed African and European ancestries in the UK Biobank and Million Veteran Program (MVP) using bivariate GREML30,31 as the Popcorn method does not account for long-range LD in admixed populations. Genetic correlation between Admixed African and European ancestries for HDL-C (r=0.84) was not significantly different from 1 in the UK Biobank (possibly due to relatively small numbers of African ancestry individuals), while correlations for the other traits ranged from 0.52-0.60 in UK Biobank and 0.47-0.69 in MVP (Supplementary Table 8). These results indicate moderately high correlation in lipid effect sizes across ancestry groups when considering all genome-wide variants.
Of the 2,286 variants that reached genome-wide significance in the trans-ancestry meta-analysis across all five lipid traits, 159 (7%) showed significant heterogeneity of effect size due to ancestry (p-value<2.2x10⁻⁵; Bonferroni correction for 2,286 variants, Supplementary Table 5). Of these 159, 31 showed the largest effect in African ancestry analyses, 24 in East Asian, 67 in European, 20 in Hispanic, and 17 in South Asian. Only 49 (2%) of these variants from trans-ancestry meta-analysis showed significant residual heterogeneity not due to ancestry, which may be attributable to differences in ascertainment or analysis strategy between cohorts (Supplementary Table 5), suggesting cohort-related factors are a less important driver of heterogeneity than genetic ancestry.
Trans-ancestry analyses aid fine-mapping
We next assessed whether trans-ancestry fine-mapping narrowed the set of likely causal variants at each of the independent trans-ancestry association signals (LD r2<0.7), assuming one shared causal variant per ±500 kb region (Supplementary Table 9). 19% of the association signals had only one variant in the 99% credible set and 55% (816/1,486) had ≤10. In contrast, 5% (73/1486) had >100. Of the 407 variants with >90% posterior probability of being the causal variant at a locus in the trans-ancestry meta-analysis, 56 (14%) were missense variants, 7 (2%) were splice-region variants, and 4 (1%) were stop-gain variants (CD36, HBB, ANGPTL8, PDE3B). (Supplementary Tables 10–12).
The median number of variants in 99% credible sets from European ancestry analysis was 13; this was reduced to 8 in the trans-ancestry analysis. Of 1,486 association signals, 825 (56%) had reduced credible set size in the trans-ancestry analysis. At these 825 loci, the number of variants in the trans-ancestry credible sets were reduced by 40% relative to the minimum credible set size in either Admixed African (the most genetically diverse group) or European ancestry analyses (Extended Data Figure 4). We estimate that increasing the sample size of European ancestry samples to that of the trans-ancestry analysis would yield a 20% reduction in credible set size, approximately half of the 40% reduction observed in trans-ancestry analysis. This suggests that sample size differences alone do not explain the reduction, rather differences in LD patterns and effect sizes across ancestries likely contribute to the improved fine-mapping (Supplementary Note). For example, rs900776, an intronic variant in the DMTN region with many high LD variants in the European ancestry group, has a posterior probability of being causal of 0.86 in the African ancestry derived credible sets, >0.99 in the trans-ancestry analysis, but only 0.51 in the European ancestry-specific analysis (Figure 2).
Figure 2: Inclusion of multiple ancestries drives improved fine-mapping.

a) Association of the DMTN intron variant rs900776 with LDL-C or b) DMTN expression. The region spanned by the 99% credible sets are shown in the center box. The LDL-C association signal significantly colocalizes with the GTEx eQTL signal of DMTN in liver. c) The LD patterns for variants in the European ancestry 99% credible set differ greatly between African and European ancestry individuals in 1000 Genomes. The lead variant has a posterior probability of 0.86 in Admixed African, 0.51 in European, and >0.99 in the trans-ancestry analysis.
Trans-ancestry PRS are most predictive
We evaluated the potential of polygenic risk scores (PRS, sometimes also called polygenic scores or PGS) to predict elevated LDL-C, a major causal risk factor of CAD, in diverse ancestry groups. We created three non-overlapping datasets to separately: i) perform ancestry-specific or trans-ancestry GWAS to estimate variant effect sizes, ii) optimize risk score parameters, and iii) evaluate the utility of the resulting scores. For each ancestry-specific or trans-ancestry GWAS we created multiple polygenic score weights -- either genome-wide with PRS-CS32 or using pruning and thresholding to select independent variants. We tested each score in the optimizing dataset, which was matched for ancestry to the GWAS (AdmAFR, EAS, EUR, SAS, ALL from UK biobank or HIS from Michigan Genomics Initiative (MGI), Extended Data Figures 5 and 6, Supplementary Tables 13–15). The top-performing score from each GWAS was selected: PRS-CS for East Asian ancestry, European ancestry, and European ancestry 2010 scores from a previous GLGC GWAS4, and an optimized pruning and threshold-based score for all others. We then evaluated the polygenic scores in 8 cohorts of individuals (N=295,577, Supplementary Table 16), not included in the discovery GWAS, from 6 ancestral groups: East Asian (146,477), European American (85,571), African American (21,730), African (2,452 East Africa, 4,972 South Africa, 7,309 West Africa), South Asian (15,242), Hispanic American (7,669), and Asian American (4,155).
The polygenic score developed from trans-ancestry meta-analysis consistently showed the best or near-best performance in each group tested, with improved or comparable prediction relative to ancestry-matched scores (adjusted R2 ~ 0.10-0.16, Figure 3, Supplementary Table 17, Extended Data Figure 7). This observation was especially evident for ancestries with smaller GWAS sample sizes, as was the case for HIS and SAS. For African Americans in MGI and MVP, polygenic prediction was similar for individuals with different levels of recent African ancestry admixture (Extended Data Figure 8) and reached the level of prediction observed for European ancestry individuals from the same dataset. The increase in LDL-C per each standard deviation increase in the polygenic score was also similar between ancestry groups in MVP: 13.2±0.22 mg/dL for African American, 8.9±0.47 mg/dL for Asian (EAS/SAS), 10.5±0.10 mg/dL for European, and 10.6±0.32 mg/dL for Hispanic ancestry individuals. We repeated the evaluation of trans-ancestry vs single-ancestry polygenic scores with a set GWAS with sample size of ~100k individuals and with fixed methodology; results were consistent with those from the full dataset (Figure 3b, Supplementary Figure 9). Thus, polygenic prediction for LDL-C in all ancestries appears to benefit the most from adding samples of diverse ancestries once relatively large numbers of European ancestry individuals have already been included. Additional studies are needed to determine if this applies to other phenotypes with different genetic architectures and heritabilities.
Figure 3: Trans-ancestry LDL-C PRS show similar performance across ancestry groups.
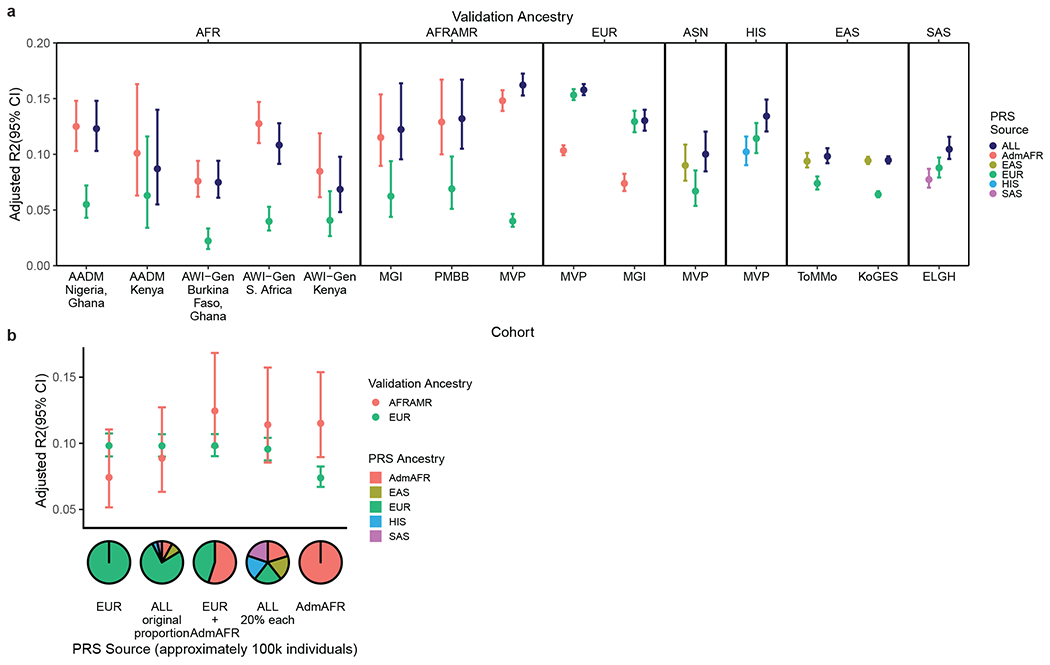
a) Polygenic scores generated from trans-ancestry meta-analysis show equivalent or better performance across most ancestry groups relative to ancestry-specific PRS within each cohort, whereas European ancestry-specific scores show less transferability. Adjusted R2 is calculated with the risk score as a predictor of LDL-C in a linear model with covariates. AFR: African, AFRAMR: African American, ASN: Asian American b) Trans-ancestry scores derived from equal proportions of each ancestry group predict LDL-C better for African Americans in MGI than predominantly European ancestry scores at constant sample size. Error bars depict 95% confidence intervals. Sample sizes for each cohort are provided in Supplementary Table 16.
Discussion
Genome-wide discovery for blood lipid traits based on ~1.65 million individuals from five ancestry groups confirmed that the contributions of common genetic variation to blood lipids are largely similar across diverse populations. First, we found that the number of significant loci relative to sample size was similar within each ancestry group, and approximately linearly related to sample size, with a small increase in ancestry-specific variants observed in African ancestry cohorts relative to the others. Second, we demonstrated that inclusion of additional ancestries through trans-ancestry fine-mapping reduces the set of candidate causal variants in credible sets and does so more rapidly than in single-ancestry analysis. Trans-ancestry GWAS should therefore facilitate identification of effector genes at GWAS loci and allow for accelerated biological insight and identification of potential drug targets. Third, we found that a polygenic score derived from ~88k African ancestry and ~830k European ancestry individuals was correlated with observed lipid levels among individuals with admixed African ancestry as well as among individuals with European ancestry. We hypothesize that the inclusion of African ancestry individuals in the GWAS yields improvement in polygenic prediction performance through the general fine-mapping of loci and the improved prioritization of trans-ancestry causal variants. Fourth, and perhaps most important, the trans-ancestry score was generally most informative across all major population groups examined. This provides useful information for other genetic discovery efforts and investigations of the utility of the polygenic scores in diverse populations.
Generalizability of these findings regarding portability of polygenic scores from the trans-ancestry meta-analysis to other traits may depend on the heritability, degree of polygenicity, level of genetic correlation, allele frequencies of causal variants across ancestry groups, gene-environment interactions, and representation of diverse populations in the GWAS33,34. While many traits show a high degree of shared genetic correlation across ancestries31,35,36 others have distinct genetic variants with large effects that are more common in specific ancestry groups33 which may limit the utility of trans-ancestry polygenic scores for particular phenotypes in some ancestries.
The benefits from genetic discovery efforts as GWAS sample sizes increase will likely not be measured just by the number of loci discovered. Rather, the focus will increasingly turn to improving our understanding of the biology at established loci, identifying potential therapeutic targets, and efficiently identifying individuals at high-risk of adverse health outcomes across population groups without exacerbating existing health disparities. Considering the results presented here, and those of related studies37–39, we believe future genetic studies will benefit substantially from meta-analysis across participants of diverse ancestries. Further gains in the depth and number of sequenced individuals of diverse ancestries40,41 may additionally improve discovery of novel variants and loci in diverse cohorts, particularly variants absent from arrays and imputation reference panels. Our results suggest that diversifying the populations under study, rather than simply increasing the sample size, is now the single most efficient approach to achieving these goals, at least for blood lipids and likely for tightly related downstream adverse health outcomes such as cardiovascular disease. However, if costs for recruitment of diverse populations are higher than recruitment of individuals from previously studied ancestry groups, and total number of genome-wide significant index variants is the goal, then continued low-cost recruitment of majority ancestry groups is expected to still provide some benefit. Taken together, our results also strongly support ongoing and future large-scale recruitment efforts targeted at the enrollment and DNA collection of non-European ancestry participants. Geneticists and those responsible for cohort development must continue diversifying genetic discovery datasets, while increasing sample size in a cost-effective manner, to ensure genetic studies reduce rather than exacerbate existing health inequities across race, ancestry, geographic region, and nationality.
Methods:
Cohort level analysis
Each cohort contributed GWAS summary statistics for HDL-C, LDL-C, nonHDL-C, TC and TG, imputation quality statistics, and analysis metrics for quality control (QC), following a detailed analysis plan (Supplementary File 1). Briefly, we requested that each cohort perform imputation to 1000 Genomes Phase 3 (1KGP3), with European ancestry cohorts additionally imputing with the Haplotype Reference Consortium (HRC) panel using the Michigan Imputation Server (https://imputationserver.sph.umich.edu/index.html#!) which uses Minimac software42. Detailed pre-imputation QC guidelines were provided; these included removing samples with call rate < 95%, samples with heterozygosity > median + 3(interquartile range), ancestry outliers from principal component analysis within each ancestry group, and variants deviating from Hardy-Weinberg equilibrium (p-value < 10−6) or with variant call rate < 98%. Analyses were carried out separately by ancestry group and were additionally stratified by cases and controls where appropriate (i.e. for a disease-focused cohort such as CAD). Residuals were generated separately in males and females adjusting for age, age2, principal components of ancestry, and any necessary study-specific covariates. Triglyceride levels were natural-log transformed before generating residuals. Inverse normalization was then done on the residual values. Individuals on cholesterol lowering medication had their pre-medication levels43 approximated by dividing the LDL-C value by 0.7 and the TC value by 0.8. Association analysis of the residuals for the majority of cohorts was carried out using a linear mixed-model approach in rvtests or with other similar software including BOLT-LMM44, SAIGE45, or deCode association software.
Quality Control
Each input file was assessed for quality control using the EasyQC software46 (www.genepi-regensburg.de/easyqc). We generated QQ plots by minor allele frequency (MAF) bins, assessed trends in standard errors relative to sample size for each cohort, and checked MAF of submitted variants relative to their expected value based on the imputation reference panel. In addition, we checked that each cohort reproduced the expected direction of effect at most known loci relative to the cohort sample size. Cohorts identified to have issues with the submitted files were contacted and corrected files were submitted or the cohort was excluded from meta-analysis. Results from either sex-stratified analysis or sex-combined analysis with sex as a covariate were used. During the QC process, within each cohort we removed poorly imputed variants (info score or r2 < 0.3), variants deviating from Hardy-Weinberg Equilibrium (HWE p-value < 10−8, except for MVP which used HWE p-value < 10−20), and variants with minor allele count < 3. An imputation info score threshold of 0.3 was selected to balance the inclusion of variants across diverse studies while removing poorly imputed variants. Summary statistics were then genomic-control (GC) corrected using the λGC value calculated from the median p-value of variants with MAF > 0.5%. To capture as many variants as possible, summary statistics from cohorts that had submitted both HRC and 1KGP3 imputed files were joined, selecting variants imputed from HRC where both imputed versions of a variant existed. For variants imputed by both panels, we observed that variants imputed from the HRC panel resulted in a higher imputation info score for 94% of variants when compared to the imputation info score from 1KGP3.
Meta-analysis
Ancestry-specific meta-analysis was performed using RAREMETAL47 (https://github.com/SailajaVeda/raremetal). Trans-ancestry meta-analysis was performed using MR-MEGA48 with 5 principal components of ancestry. The choice of 5 principal components was made after comparing the λGC values across minor allele frequency bins from meta-analysis of HDL-C with MR-MEGA using from 2 up to 10 principal components. In addition, fixed-effects meta-analysis was carried out with METAL49 to calculate effect sizes for use in the creation of polygenic scores. Study-level principal components were plotted for each cohort by ancestry group to verify that the reported ancestry for each cohort was as expected. Following meta-analysis, we identified loci based on a genome-wide significance threshold of 5x10⁻⁸ after GC correction using the λGC value calculated from the median p-value of variants with MAF > 0.5%. The choice of double-GC correction was made to be most conservative and to minimize potential false-positive findings. Observed λGC values were within the expected range for similarly sized studies and are included in Supplementary Tables 2 and 4. Variants with a cumulative minor allele count ≤ 30 and those found in a single study were excluded from index variant selection. Index variants were identified following an iterative procedure starting with the most significant variant and grouping the surrounding region into a locus based on the larger of either ± 500 kb or ± 0.25 cM. cM positions were interpolated using the genetic map distributed with Eagle v2.3.2 (genetic_map_hg19_withX.txt)50. Variants were annotated using WGSA51 including the summary of each variant from SnpEff52 and the closest genes for intergenic variants from ANNOVAR53. Annotation of variants as known or novel was done based on manual review of previously published variants and with variants reported in the GWAS catalog27 for any of the studied lipid traits (accessed May 2020, provided as Supplementary Table 18). For comparison between ancestries and lipid traits, index variants were grouped into genomic regions starting with the most significantly associated variant and grouping all surrounding index variants within ± 500 kb into a single region.
Power to detect association within each ancestry was determined using the effect size and sample size of the variant within the original discovery ancestry group and the observed allele frequency from the other ancestry groups with alpha set to 5x10⁻⁸. We excluded variants that were only successfully imputed in a single ancestry group to account for imputation panel differences between groups (ie. Haplotype Reference Consortium for European ancestry individuals and 1000 Genomes for other ancestries). Variants that were successfully imputed in 2 or more ancestries were assumed to have zero power in any other ancestry where the variant was not successfully imputed. The proportion of variance explained by each variant was estimated as 2β2(1-f)f where β is the effect size from METAL and f is the effect allele frequency (Supplementary Table 19). The proportion of variance explained within each ancestry was estimated using the trans-ancestry effect size from METAL with the ancestry-specific allele frequency. Coverage of the genome by associated genetic regions was calculated using BEDTools54 for the regions defined by the minimum and maximum position within each locus having p-value < 5x10⁻⁸.
Conditional analysis
Approximate conditional analysis was performed using rareGWAMA55 to identify index variants that were shadows of nearby, more significant associations. LD reference populations were taken from UK Biobank specific to Admixed African, European (subset of 40,000), or South Asian ancestry individuals or from the 1000 Genomes project (1KGP3) for East Asian or Hispanic ancestry individuals. Conditional analysis was carried out using the individual cohort level summary statistics as was done for meta-analysis with RAREMETAL. rareGWAMA requires imputation quality scores which were set to 1 for all variants that had previously passed quality control (pre-filtered at imputation info/r2 > 0.3). The European ancestry subset of UK Biobank was used as the reference population for the conditional analysis of the trans-ancestry meta-analysis (~80% European ancestry). Stepwise conditional analysis was performed sequentially for the index variants within each chromosome ranked by most to least significant. Index variants were then flagged as not independent from other more significant variants if the absolute value of the ratio of the original effect size to the effect size after conditional analysis was greater than the 95th percentile of all values (Supplementary Figure 10). This threshold was selected to remove variants whose effects were driven by nearby, more strongly associated variants in LD. This corresponded to a ratio of original to conditional effect size of 1.6 for ancestry-specific conditional analysis and a ratio of 1.7 for the trans-ancestry conditional analysis. The effect sizes from meta-analysis with METAL were used for comparison with the trans-ancestry conditional analysis results. Variants flagged as non-independent were excluded from the summary results in the manuscript and are flagged as non-independent in Supplementary Tables 3 and 5.
Genetic correlation
Popcorn29 was used to assess the degree of correlation in effect sizes between ancestry groups for each of the lipid traits with 1000 Genomes phase 3 as the reference LD panel. Only variants with MAF > 0.01 in each ancestry individually were included in the comparison. Both the genetic effect and genetic impact models were tested. Bivariate GREML from GCTA was used to calculate the genetic correlation between unrelated Admixed Africans and a subset of white British individuals in the UK Biobank following the method of Guo et al30,31. HapMap3 variants with MAF > 0.01 in each ancestry were used to construct the genetic relationship matrix (GRM) with the allele frequencies standardized in each population. Individuals with genetic relatedness > 0.05 were removed. A total of up to 5,575 AdmAfr and 38,668 white British individuals from UK Biobank were included in the analysis of each trait after removal of related individuals. The measured lipid traits were corrected for medication use and were inverse-normalized after correction for age, sex, and batch. Principal components 1-20 constructed from the GRM were included as covariates in the calculation of genetic correlation. Analysis within the Million Veteran Program included 24,502 European ancestry and 21,950 African American unrelated individuals. Maximum measured values were used for LDL-C, TC, and triglycerides and minimum values for HDL-C. Lipid traits were inverse-normalized after correction for age and sex with principal components 1-20 included as covariates in the calculation of genetic correlation.
Credible sets
Credible sets of potentially causal variants were generated for each of the loci identified in the trans-ancestry meta-analysis. We determined 99% credible sets of variants that encompassed the causal variant with 99% posterior probability. Regions for construction of credible sets were defined as the ± 500 kb region around each index variant. Bayes factors56,57 (BF) for each variant in the ancestry-specific meta-analysis were approximated by:
where β and SE are the effect sizes and standard errors from the RAREMETAL meta-analysis, and is the ancestry-specific sample size. A full derivation is included in the Supplementary Methods. To account for the difference in sample sizes between ancestry groups, we additionally approximated the Bayes factors after adjustment for the total trans-ancestry sample size for each trait (NTE) relative to the ancestry-specific sample size for that trait using the following equation:
Credible sets for the trans-ancestry meta-analysis were generated using the Bayes factors as output by MR-MEGA. The credible sets within each region were generated by ranking all variants by Bayes factor and calculating the number of variants required to reach a cumulative probability of 99%. In addition, we calculated credible sets in the same manner using the European ancestry and trans-ancestry meta-analysis results but including only the set of variants present in the AdmAFR meta-analysis. To summarize the size of the credible sets across the 5 lipid traits examined, we identified the set of independent index variants from the trans-ancestry meta-analysis after grouping variants based on LD. For each ± 500kb region centered around the most-significantly associated index variant for any trait, we determined the pairwise LD between all index variants in this region using LDpair58 with all reference populations (1000 Genomes AFR, AMR, EAS, EUR, and SAS) included. We considered variants to be independent if they were outside of this region, had LD r2 < 0.7, or were not available in the LDpair reference populations. Variants within the credible sets were annotated with SnpEff52 using WGSA51 and with VEP59. The number of variants in LD with an index variant was determined using LDproxy58 (Supplementary Table 20). Protein numbering was taken from dbSNP60. eQTL colocalization was performed using coloc61 version 3.2.1 with R version 3.4.3 using the default parameters. Results from GTEx V862 were compared with the GWAS signals in the region defined by the larger of ±0.25cM or ±500kb surrounding each index variant. The eQTL and GWAS signals (based on p-values from MR-MEGA) were considered to be colocalized if PP3 + PP4 ≥ 0.8 and if PP4/(PP3+PP4) > 0.9, where PP3 is the probability of two independent causal variants while PP4 is the probability of a single, shared causal variant.
LDL-C polygenic scores
Weights for the LDL-C polygenic scores were derived from beta estimates generated from each of the ancestry-specific meta-analyses and from the trans-ancestry results using METAL. Additional meta-analyses were carried out using the 2010 Global Lipids Genetics Consortium LDL-C meta-analysis results4 in combination with the i) Admixed African or ii) Admixed African, East Asian, Hispanic, and South Asian ancestry results from the present meta-analysis for comparison. Furthermore, we performed a meta-analysis of European ancestry cohorts randomly selected to reach a total sample size near 100K, 200K, or 400K to understand the role of increasing European ancestry sample size and the influence of imputation panel. In addition, we tested possible methods for improving performance of European ancestry derived scores in African ancestry individuals by separately fitting the European ancestry polygenic scores in the UK Biobank Admixed African ancestry subset to determine the best set of risk score parameters (various pruning and thresholding parameters or PRS-CS, Supplementary Note).
We generated polygenic score weights using both: i) significant variants only (at a variety of p-value thresholds) and ii) using genome-wide methods. Meta-analysis results were first filtered to variants present in UK Biobank, MGI, and MVP with imputation info score > 0.3. Pruning and thresholding was performed in PLINK63 with ancestry-matched subsets of UK Biobank individuals (AdmAFR N=7,324, EUR N=40,000, SAS N=7,193, trans-ancestry: N=10,000 (80% EUR, 15% AdmAFR, 5% SAS)) or 1KGP3 (HIS N=347 , EAS N=504) used for LD reference. We additionally tested 1000 Genomes phase 3 with all populations included as the LD reference panel for the trans-ancestry score (results not shown), which gave very similar results to those of the UK Biobank trans-ancestry reference set originally selected for its larger sample size. P-value thresholds (after GC correction) of 5x10⁻¹⁰, 5x10⁻⁹, 5x10⁻⁸, 5x10⁻⁷, 5x10⁻⁶, 5x10⁻⁵, 5x10⁻⁴, 5x10⁻³, and 5x10⁻² were tested with distance thresholds of 250 and 500 kb and LD r2 thresholds of 0.1 and 0.2. Polygenic score weights were also generated using PRS-CS32 with the LD reference panels for African, East Asian, and European ancestry populations from 1000 Genomes provided by the developers. PRS-CS LD reference panels for the other ancestries were generated using 1000 Genomes following the same protocol as provided by the PRS-CS authors32. This included removing variants with MAF ≤ 0.01, ambiguous A/T or G/C variants, and restricting to variants included in HapMap3. Pairwise LD matrices within pre-defined LD blocks64 (using European LDetect blocks for Hispanic and trans-ancestry LD calculations and Asian blocks for South Asian) were then calculated using PLINK and converted to HDF5 format.
For each individual in the testing cohorts, polygenic scores were calculated as the sum of the dosages multiplied by the given weight at each variant. UK Biobank individuals not present in datasets used to generate the summary statistics (either Admixed African, white British, both Admixed African and white British, East Asian, South Asian, or all individuals excluding South Asian) were used to select the best performing Admixed African, European, Admixed African+European, East Asian, South Asian, and trans-ancestry polygenic scores, respectively. UK Biobank South Asian ancestry individuals were included in the trans-ancestry risk score weights but excluded from the UK Biobank trans-ancestry testing set due to an initial focus on comparing predictions among European and African ancestry individuals. Sample sizes of the ancestry groups in UK Biobank used to test PRS performance included: AdmAFR N=6,863; EAS N=1,441; EUR N=389,158; SAS N=6,814; ALL=461,918. The best performing Hispanic ancestry polygenic score weights were selected based on performance in Hispanic ancestry individuals in the Michigan Genomics Initiative dataset. Model fit was assessed by the adjusted R2 of a linear model for LDL-C value at initial assessment adjusted for cholesterol medication (divided by 0.7 to estimate pre-medication levels) with sex, batch, age at initial assessment, and PCs1-4 as covariates (Supplementary Tables 21–23). Python and R were used for analysis of PRS models.
The best performing polygenic score in each ancestry group was then tested in the validation cohorts: the Michigan Genomics Initiative (EUR N=17,190; AFRAMR N=1,341), East London Genes and Health65 (ELGH; SAS N=15,242), Tohoku Medical Megabank Community Cohort Study (ToMMo; EAS N=28,217), Korean Genome and Epidemiology Study66 (KoGES; EAS N=118,260), Penn Medicine BioBank (PMBB; AFRAMR=2,138), Africa America Diabetes Mellitus (AADM; 3,566 West AFR; 707 East AFR), Africa Wits-INDEPTH partnership for Genomic Studies (AWI-Gen; 1,744 East AFR; 4,972 South AFR; 3,744 West AFR) and Million Veteran Program participants not included in the discovery meta-analysis (MVP; EUR N=68,381; AFRAMR N=18,251; EAS/SAS N=4,155; HIS N=7,669). Adjusted R2 values were reported for each cohort and ancestry group, with 95% confidence intervals for the adjusted R2 values calculated using bootstrapping. Within each cohort, covariates used were: MGI- sex, batch, PC1-4, and birth year; PMBB- birth year, sex, and PC1-4; ELGH- age, sex, and PC1-10; MVP- sex, PC1-4, birth year, and mean age; ToMMo-sex, age, recruitment method, and PC1-20 (only participants from Miyagi Prefecture were included); KoGES-age, sex, and recruitment area, AADM-age, sex, PC1-3, AWI-Gen East Africa- age, sex, PC1-6, AWI-Gen South Africa- age, sex, PC1-6, and AWI-Gen West Africa- age, sex, and PC1-4. The type of LDL-C value used in the model varied depending on the measurements selected by each cohort. Mean LDL-C values were used for MGI, MVP and PMBB, maximum LDL-C values for ELGH, and baseline measurements for AADM, AWI-Gen, ToMMo and KoGES. A descriptive summary of each validation cohort is included in Supplementary Table 16. African admixture for MGI was calculated using all African ancestry individuals in 1000 Genomes with ADMIXTURE v1.367. African admixture for MVP was calculated using the YRI and LWK African ancestry individuals in 1000 Genomes.
Extended Data
Extended Data Figure 1: Effect sizes of identified index variants from trans-ancestry meta-analysis.
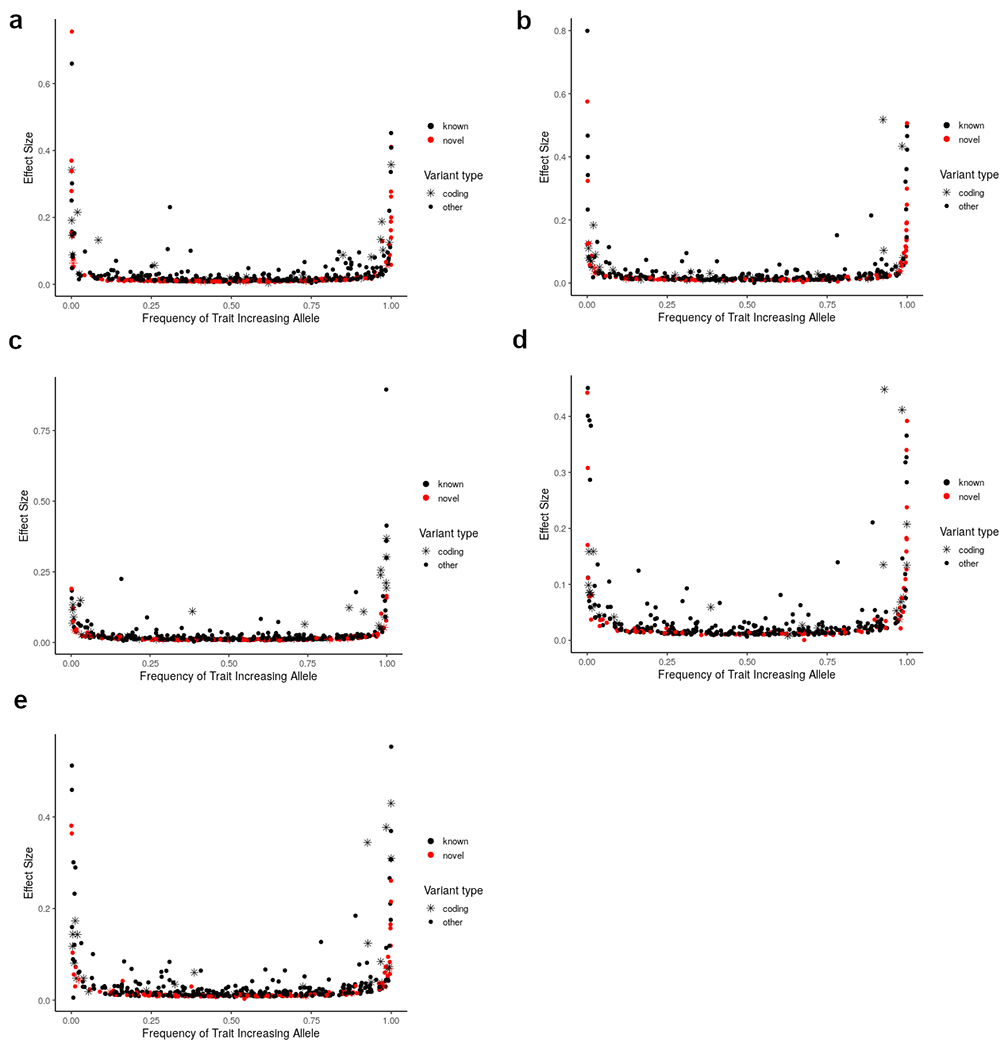
Index variants associated with a) HDL cholesterol, b) LDL cholesterol, c) triglycerides, d) nonHDL cholesterol and e) total cholesterol include both common variants of small to moderate effect and low frequency variants of moderate to large effect.
Extended Data Figure 2: Comparison of the number of index variants by sample size.
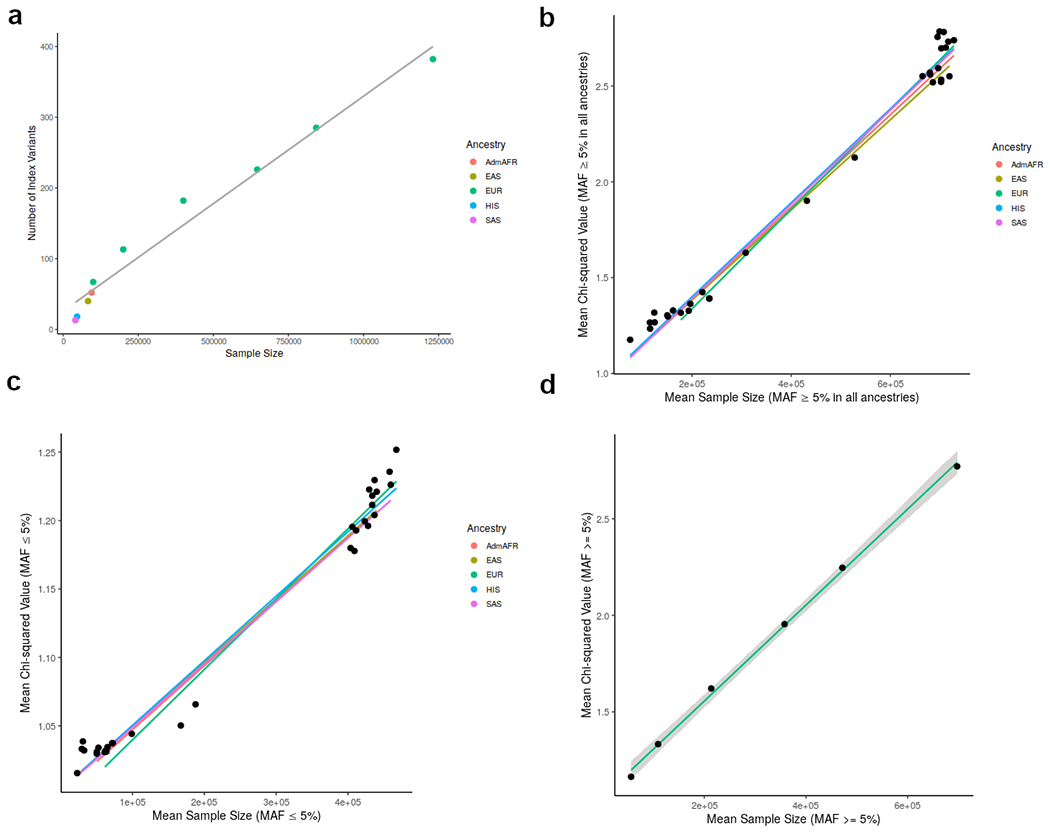
a) Comparison of the number of index variants reaching genome-wide significance (p < 5x10⁻⁸) from meta-analysis of LDL-C in each ancestry group. A meta-analysis of five random subsets of European cohorts selected to reach sample sizes of approximately 100,000, 200,000, 400,000, 600,000, or 800,000 individuals is also shown.
b) Comparison of chi-squared values from meta-analysis of LDL-C for each possible combination of ancestry groups (without genomic-control correction) for variants with minor allele frequency (MAF) ≥ 5%. The colored lines indicate a linear regression model of all meta-analyses for a specific ancestry (eg. all analyses including European individuals).
c) Comparison of chi-squared values from meta-analysis of LDL-C for variants with MAF ≤ 5%.
d) Comparison of chi-squared valued for variants with MAF ≥ 5% for LDL-C without genomic-control correction in a meta-analysis of all European cohorts as well as five subsets selected to reach sample sizes of approximately 100,000, 200,000, 400,000, 600,000, or 800,000 individuals.
Extended Data Figure 3: Effect sizes by ancestry for unique index variants from ancestry-specific meta-analysis.
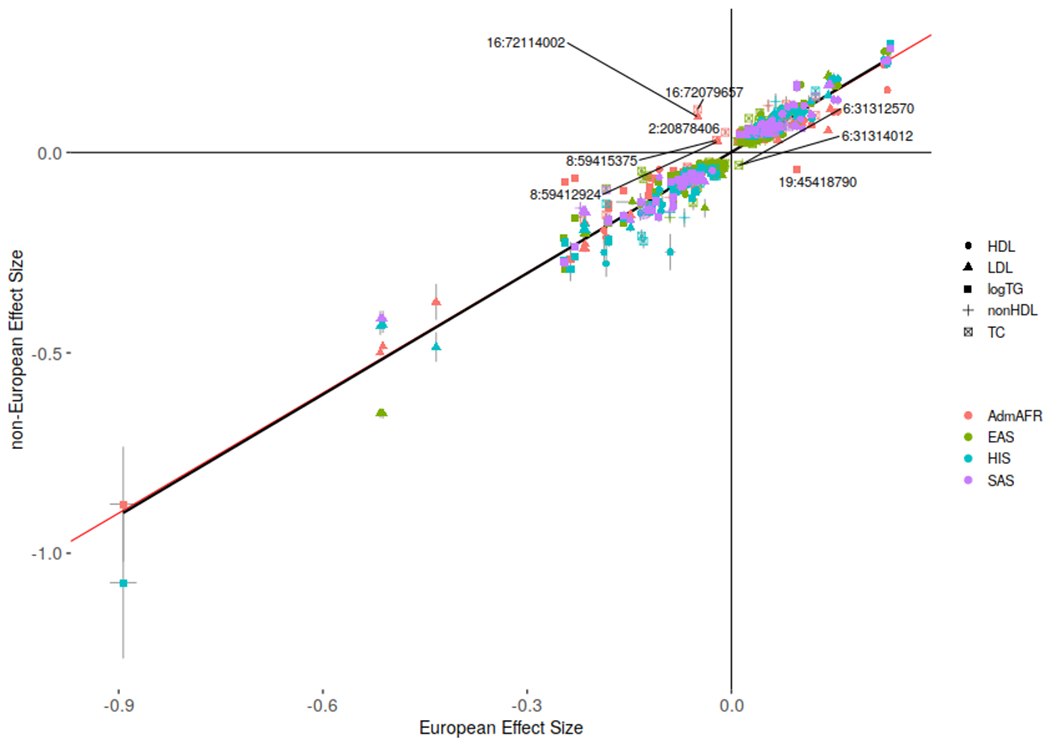
Comparison of effect sizes and standard errors for variants reaching genome-wide significance (p-value < 5x10⁻⁸ as given by RAREMETAL) in both ancestry groups. Variants with discordant directions of effect between ancestries are labeled by chromosome and position (build 37). Association results for all index variants are given in Supplementary Table 3. The red line depicts an equivalent European ancestry and non-European ancestry effect size while the black line depicts a linear regression model. R2=0.93
Extended Data Figure 4: Comparison of credible set size.
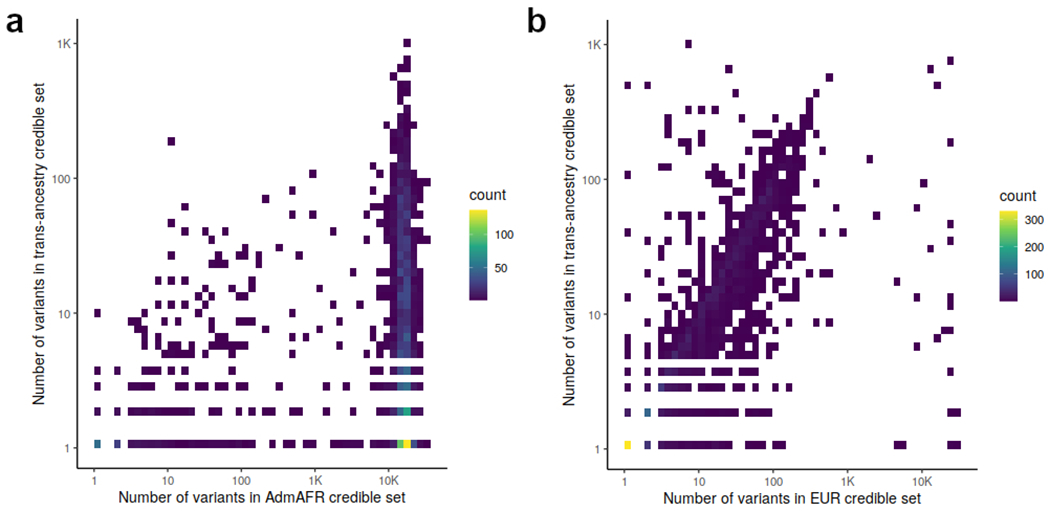
The number of variants in the 99% credible sets for each association signal are compared between a) Admixed African ancestry and trans-ancestry analysis and b) European ancestry and trans-ancestry analysis
Extended Data Figure 5: Overview of LDL-C polygenic score generation and validation.
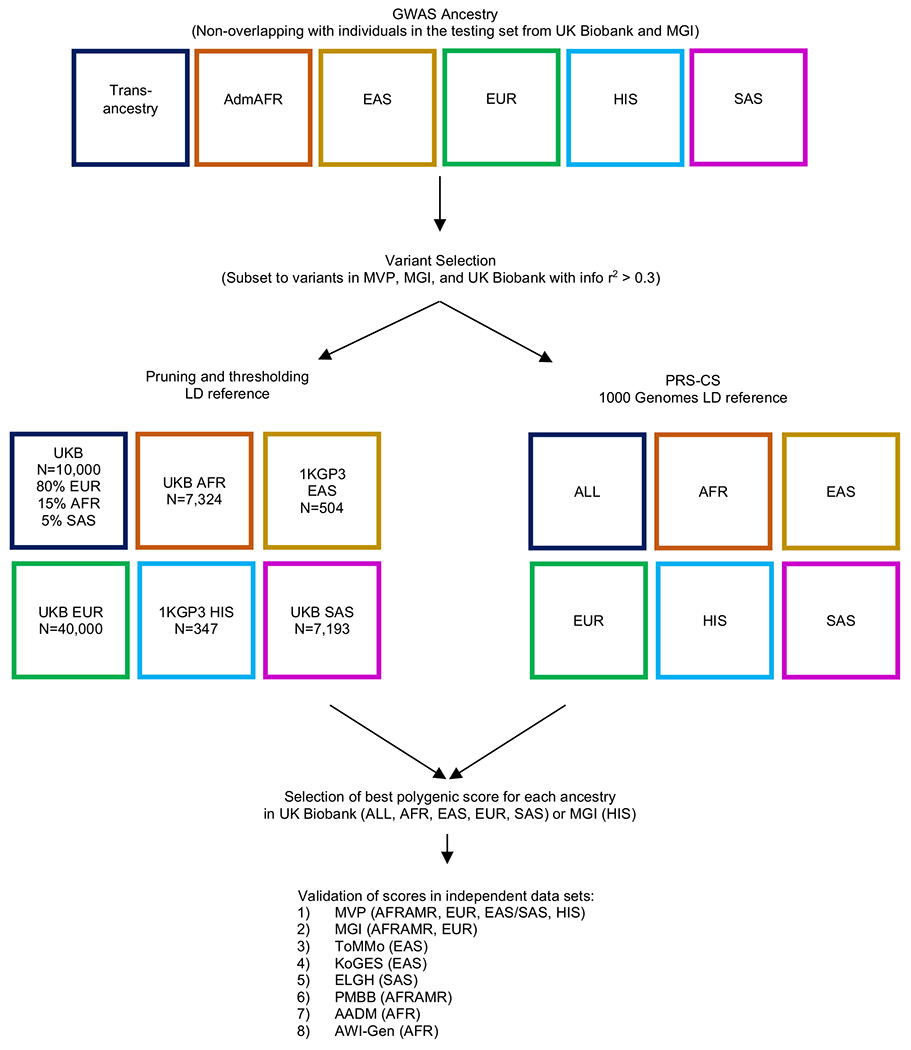
Polygenic scores were calculated separately in each ancestry group or in all ancestries combined using either pruning and thresholding or PRS-CS. The polygenic scores were then taken forward for testing in ancestry-matched participants followed by validation in independent data sets.
Extended Data Figure 6: Optimal polygenic score threshold by ancestry group for either PRS-CS or pruning and thresholding based LDL-C polygenic scores.
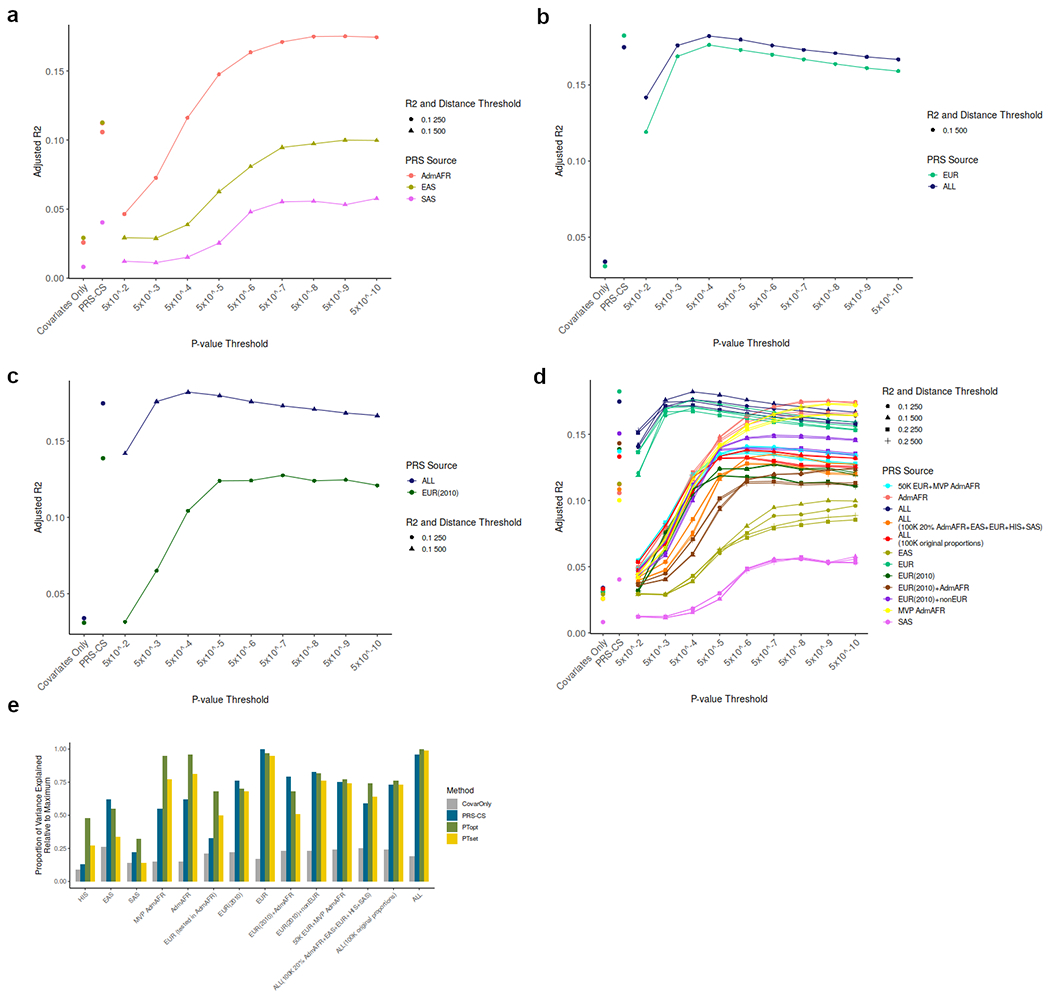
Adjusted R2 estimated upon testing in UK Biobank ancestry-matched participants (not included in GWAS summary statistics).
- Admixed African, East Asian and South Asian ancestry polygenic scores
- European and trans-ancestry polygenic scores
- European ancestry (GLGC 2010) and trans-ancestry polygenic scores
- All polygenic scores across all thresholds used for score construction
- Comparison of adjusted R2 across ancestry groups relative to the maximum for covariates alone, polygenic scores from PRS-CS or polygenic scores from pruning and thresholding
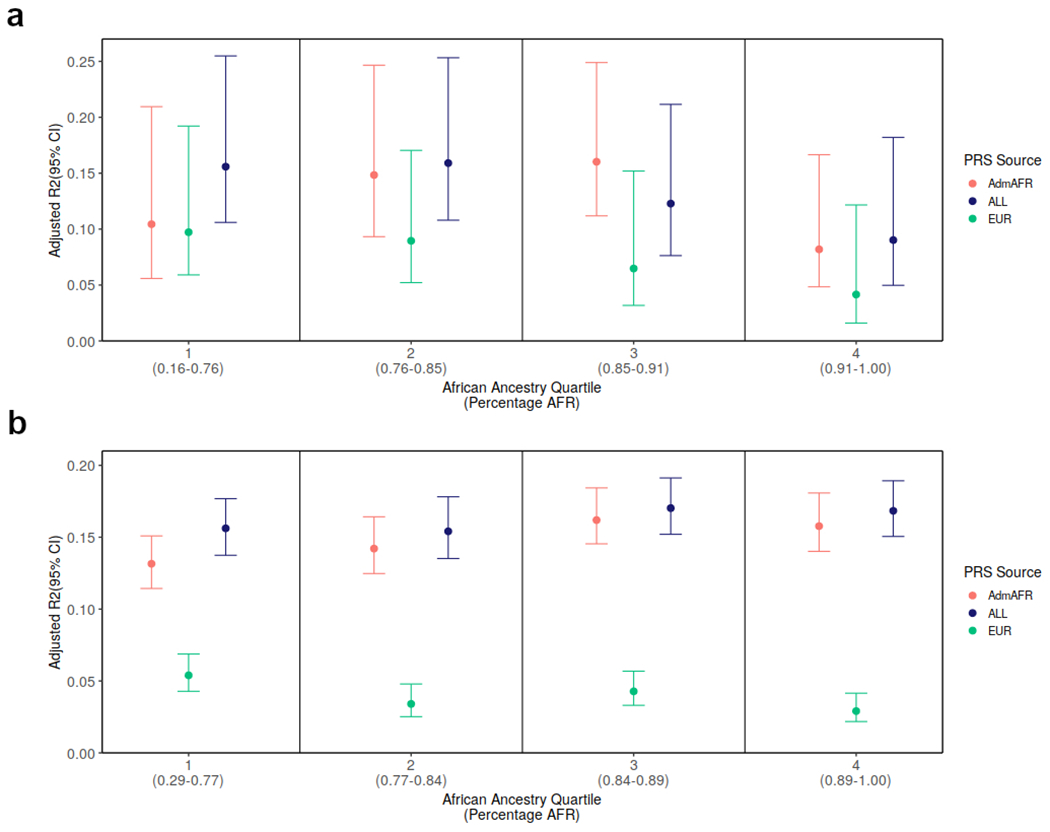
Extended Data Figure 7: Comparison of PRS performance by admixture quartile.
We divided the testing cohorts into quartiles by proportion of African ancestry and estimated the performance of the PRS separately within each quartile in a) the Michigan Genomics Initiative (N = 1,341) and b) in the Million Veteran Program (N = 18,251). Error bars represent 95% confidence intervals.
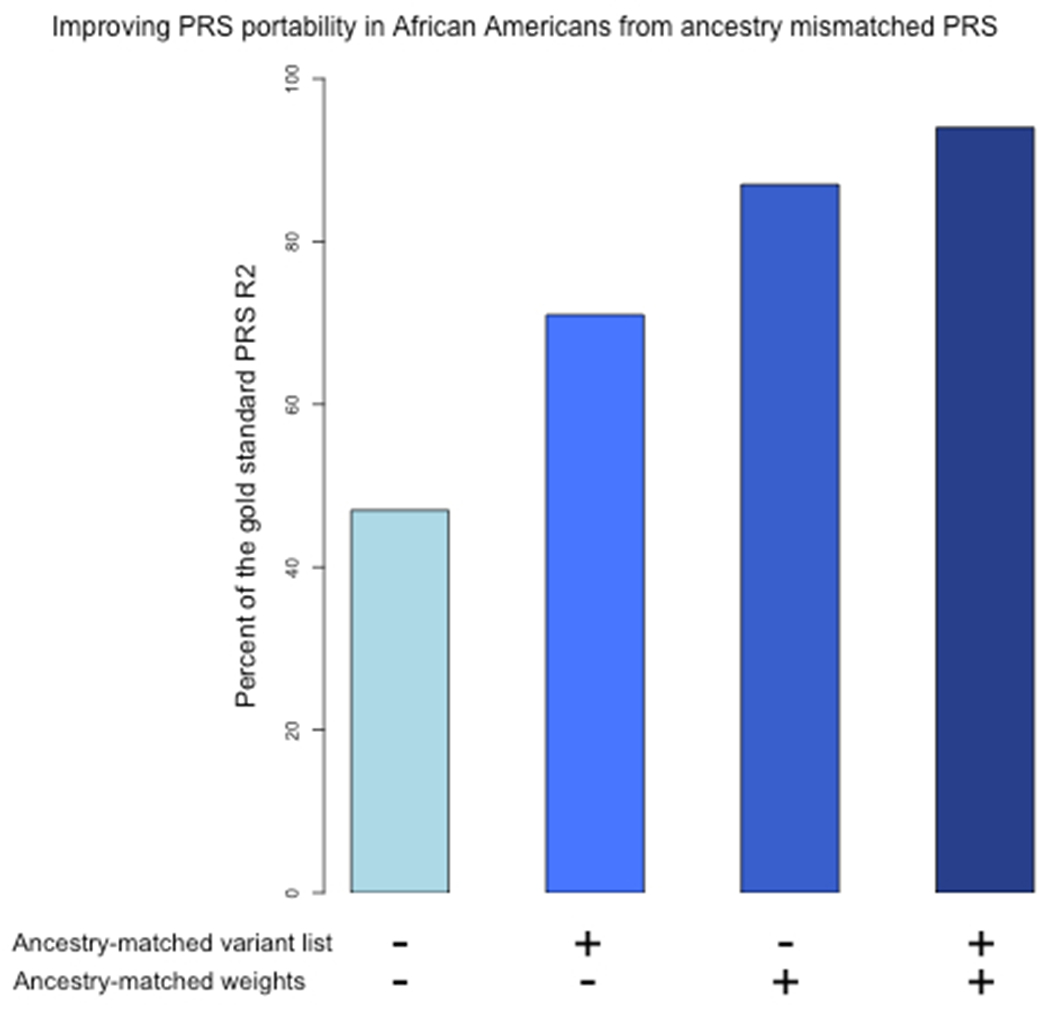
Extended Data Figure 8: Improvement in PRS performance in African Americans when starting with ancestry-mismatched European ancestry scores by updating weights, updating variant lists, or updating both variants and weights to be ancestry-matched.
By comparison to the gold-standard performance of the trans-ancestry-derived PRS in African Americans (adjusted R2 = 0.12), a European ancestry derived score capture only 47% of the variance explained by the trans-ancestry PRS. When LD and association information from the target population is used to optimize the list of variants for inclusion in the PRS, but with ancestry-mismatched weights from European ancestry GWAS, the variance explained reaches 71% of the gold standard. If the PRS variant list selected in European ancestry individuals were genotyped in the target population, and PRS weights were updated using a GWAS from the target population, the variance explained reached 87% of the gold standard. Finally, deriving both the marker list and weights from the target population (single-ancestry GWAS) explained 94% of the variance relative to the gold-standard trans-ancestry PRS.
Supplementary Material
Acknowledgments
Funding for the Global Lipids Genetics Consortium was provided by the NIH (R01-HL127564). This research has been conducted using the UK Biobank Resource under application number 24460. Computing support and file management for central meta-analysis by Sean Caron is gratefully acknowledged. This research is based on data from the Million Veteran Program, Office of Research and Development, Veterans Health Administration, and was supported by awards #2I01BX003362-03A1 and 1I01BX004821-01A1#. This publication does not represent the views of the Department of Veteran Affairs or the United States Government. Study-specific acknowledgements are provided in the supplemental material.
Competing interests
G.J.M.Z. is an employee of Incyte Corporation. G.C-P. is currently an employee of 23andMe Inc. M.J.C. is the Chief Scientist for Genomics England, a UK Government company. B.M.P. serves on the steering committee of the Yale Open Data Access Project funded by Johnson & Johnson. G.T., A.H., D.F.G., H.H., U.T., and K.S. are employees of deCODE/Amgen Inc. V.S. has received honoraria for consultations from Novo Nordisk and Sanofi and has an ongoing research collaboration with Bayer Ltd. M.M. has served on advisory panels for Pfizer, NovoNordisk and Zoe Global, has received honoraria from Merck, Pfizer, Novo Nordisk and Eli Lilly, and research funding from Abbvie, Astra Zeneca, Boehringer Ingelheim, Eli Lilly, Janssen, Merck, NovoNordisk, Pfizer, Roche, Sanofi Aventis, Servier, and Takeda. M.M. and A.M. are employees of Genentech and a holders of Roche stock. M.S. receives funding from Pfizer Inc. for a project unrelated to this work. M.E.K. is employed by SYNLAB MVZ Mannheim GmbH. W.M. has received grants from Siemens Healthineers, grants and personal fees from Aegerion Pharmaceuticals, grants and personal fees from AMGEN, grants from Astrazeneca, grants and personal fees from Sanofi, grants and personal fees from Alexion Pharmaceuticals, grants and personal fees from BASF, grants and personal fees from Abbott Diagnostics, grants and personal fees from Numares AG, grants and personal fees from Berlin-Chemie, grants and personal fees from Akzea Therapeutics, grants from Bayer Vital GmbH , grants from bestbion dx GmbH, grants from Boehringer Ingelheim Pharma GmbH Co KG, grants from Immundiagnostik GmbH, grants from Merck Chemicals GmbH, grants from MSD Sharp and Dohme GmbH, grants from Novartis Pharma GmbH, grants from Olink Proteomics, other from Synlab Holding Deutschland GmbH, all outside the submitted work. A.V.K. has served as a consultant to Sanofi, Medicines Company, Maze Pharmaceuticals, Navitor Pharmaceuticals, Verve Therapeutics, Amgen, and Color Genomics; received speaking fees from Illumina, the Novartis Institute for Biomedical Research; received sponsored research agreements from the Novartis Institute for Biomedical Research and IBM Research, and reports a patent related to a genetic risk predictor (20190017119). S.K. is an employee of Verve Therapeutics, and holds equity in Verve Therapeutics, Maze Therapeutics, Catabasis, and San Therapeutics. He is a member of the scientific advisory boards for Regeneron Genetics Center and Corvidia Therapeutics; he has served as a consultant for Acceleron, Eli Lilly, Novartis, Merck, Novo Nordisk, Novo Ventures, Ionis, Alnylam, Aegerion, Haug Partners, Noble Insights, Leerink Partners, Bayer Healthcare, Illumina, Color Genomics, MedGenome, Quest, and Medscape; he reports patents related to a method of identifying and treating a person having a predisposition to or afflicted with cardiometabolic disease (20180010185) and a genetics risk predictor (20190017119). D.K. accepts consulting fees from Regeneron Pharmaceuticals. D.O.M-K. is a part-time clinical research consultant for Metabolon, Inc. D.S. has received support from the British Heart Foundation, Pfizer, Regeneron, Genentech, and Eli Lilly pharmaceuticals. The spouse of C.J.W. is employed by Regeneron.
Footnotes
Code Availability
EasyQC: www.genepi-regensburg.de/easyqc;
Raremetal: https://github.com/SailajaVeda/raremetal
Data Availability
The GWAS meta-analysis results (including both ancestry-specific and trans-ancestry analyses) and risk score weights are available at: http://csg.sph.umich.edu/willer/public/glgc-lipids2021. The optimized trans-ancestry and single-ancestry polygenic score weights are deposited in the PGS Catalogue (https://www.pgscatalog.org/) accession ids: PGS000886-PGS000897 (all intervening numbers).
References
- 1.Taddei C et al. Repositioning of the global epicentre of non-optimal cholesterol. Nature 582, 73–77, doi: 10.1038/s41586-020-2338-1 (2020). [DOI] [PMC free article] [PubMed] [Google Scholar]
- 2.Ference BA et al. Low-density lipoproteins cause atherosclerotic cardiovascular disease. 1. Evidence from genetic, epidemiologic, and clinical studies. A consensus statement from the European Atherosclerosis Society Consensus Panel. Eur Heart J 38, 2459–2472, doi: 10.1093/eurheartj/ehx144 (2017). [DOI] [PMC free article] [PubMed] [Google Scholar]
- 3.Roth GA et al. Global, regional, and national age-sex-specific mortality for 282 causes of death in 195 countries and territories, 1980-2017: a systematic analysis for the Global Burden of Disease Study 2017. The Lancet 392, 1736–1788, doi: 10.1016/S0140-6736(18)32203-7 (2018). [DOI] [PMC free article] [PubMed] [Google Scholar]
- 4.Teslovich TM et al. Biological, clinical and population relevance of 95 loci for blood lipids. Nature 466, 707–713, doi: 10.1038/nature09270 (2010). [DOI] [PMC free article] [PubMed] [Google Scholar]
- 5.Willer CJ et al. Discovery and refinement of loci associated with lipid levels. Nature genetics 45, 1274–1283, doi: 10.1038/ng.2797 (2013). [DOI] [PMC free article] [PubMed] [Google Scholar]
- 6.Liu DJ et al. Exome-wide association study of plasma lipids in >300,000 individuals. Nature genetics 49, 1758–1766, doi: 10.1038/ng.3977 (2017). [DOI] [PMC free article] [PubMed] [Google Scholar]
- 7.Lu X et al. Exome chip meta-analysis identifies novel loci and East Asian-specific coding variants that contribute to lipid levels and coronary artery disease. Nature genetics 49, 1722–1730, doi: 10.1038/ng.3978 (2017). [DOI] [PMC free article] [PubMed] [Google Scholar]
- 8.Kathiresan S et al. A genome-wide association study for blood lipid phenotypes in the Framingham Heart Study. BMC Med Genet 8 Suppl 1, S17–S17, doi: 10.1186/1471-2350-8-S1-S17 (2007). [DOI] [PMC free article] [PubMed] [Google Scholar]
- 9.Kathiresan S et al. Polymorphisms Associated with Cholesterol and Risk of Cardiovascular Events. New England Journal of Medicine 358, 1240–1249, doi: 10.1056/NEJMoa0706728 (2008). [DOI] [PubMed] [Google Scholar]
- 10.Peloso GM et al. Association of low-frequency and rare coding-sequence variants with blood lipids and coronary heart disease in 56,000 whites and blacks. American journal of human genetics 94, 223–232, doi: 10.1016/j.ajhg.2014.01.009 (2014). [DOI] [PMC free article] [PubMed] [Google Scholar]
- 11.Hoffmann TJ et al. A large electronic-health-record-based genome-wide study of serum lipids. Nature genetics 50, 401–413, doi: 10.1038/s41588-018-0064-5 (2018). [DOI] [PMC free article] [PubMed] [Google Scholar]
- 12.Surakka I et al. The impact of low-frequency and rare variants on lipid levels. Nature genetics 47, 589–597, doi: 10.1038/ng.3300 (2015). [DOI] [PMC free article] [PubMed] [Google Scholar]
- 13.Klarin D et al. Genetics of blood lipids among ~300,000 multi-ethnic participants of the Million Veteran Program. Nature genetics 50, 1514–1523, doi: 10.1038/s41588-018-0222-9 (2018). [DOI] [PMC free article] [PubMed] [Google Scholar]
- 14.Holmen OL et al. Systematic evaluation of coding variation identifies a candidate causal variant in TM6SF2 influencing total cholesterol and myocardial infarction risk. Nature genetics 46, 345–351, doi: 10.1038/ng.2926 (2014). [DOI] [PMC free article] [PubMed] [Google Scholar]
- 15.Asselbergs FW et al. Large-scale gene-centric meta-analysis across 32 studies identifies multiple lipid loci. American journal of human genetics 91, 823–838, doi: 10.1016/j.ajhg.2012.08.032 (2012). [DOI] [PMC free article] [PubMed] [Google Scholar]
- 16.Albrechtsen A et al. Exome sequencing-driven discovery of coding polymorphisms associated with common metabolic phenotypes. Diabetologia 56, 298–310, doi: 10.1007/s00125-012-2756-1 (2013). [DOI] [PMC free article] [PubMed] [Google Scholar]
- 17.Saxena R et al. Genome-wide association analysis identifies loci for type 2 diabetes and triglyceride levels. Science (New York, N.Y.) 316, 1331–1336, doi: 10.1126/science.1142358 (2007). [DOI] [PubMed] [Google Scholar]
- 18.Iotchkova V et al. Discovery and refinement of genetic loci associated with cardiometabolic risk using dense imputation maps. Nature genetics 48, 1303–1312, doi: 10.1038/ng.3668 (2016). [DOI] [PMC free article] [PubMed] [Google Scholar]
- 19.Tachmazidou I et al. A rare functional cardioprotective APOC3 variant has risen in frequency in distinct population isolates. Nature Communications 4, 2872, doi: 10.1038/ncomms3872 (2013). [DOI] [PMC free article] [PubMed] [Google Scholar]
- 20.Tang CS et al. Exome-wide association analysis reveals novel coding sequence variants associated with lipid traits in Chinese. Nature Communications 6, 10206, doi: 10.1038/ncomms10206 (2015). [DOI] [PMC free article] [PubMed] [Google Scholar]
- 21.van Leeuwen EM et al. Genome of the Netherlands population-specific imputations identify an ABCA6 variant associated with cholesterol levels. Nature Communications 6, 6065, doi: 10.1038/ncomms7065 (2015). [DOI] [PMC free article] [PubMed] [Google Scholar]
- 22.Spracklen CN et al. Association analyses of East Asian individuals and trans-ancestry analyses with European individuals reveal new loci associated with cholesterol and triglyceride levels. Hum Mol Genet 26, 1770–1784, doi: 10.1093/hmg/ddx062 (2017). [DOI] [PMC free article] [PubMed] [Google Scholar]
- 23.Kanai M et al. Genetic analysis of quantitative traits in the Japanese population links cell types to complex human diseases. Nature genetics 50, 390–400, doi: 10.1038/s41588-018-0047-6 (2018). [DOI] [PubMed] [Google Scholar]
- 24.Sirugo G, Williams SM & Tishkoff SA The Missing Diversity in Human Genetic Studies. Cell 177, 26–31, doi: 10.1016/j.cell.2019.02.048 (2019). [DOI] [PMC free article] [PubMed] [Google Scholar]
- 25.Khera AV et al. Genome-wide polygenic scores for common diseases identify individuals with risk equivalent to monogenic mutations. Nature genetics 50, 1219–1224, doi: 10.1038/s41588-018-0183-z (2018). [DOI] [PMC free article] [PubMed] [Google Scholar]
- 26.Duncan L et al. Analysis of polygenic risk score usage and performance in diverse human populations. Nature Communications 10, 3328, doi: 10.1038/s41467-019-11112-0 (2019). [DOI] [PMC free article] [PubMed] [Google Scholar]
- 27.Buniello A et al. The NHGRI-EBI GWAS Catalog of published genome-wide association studies, targeted arrays and summary statistics 2019. Nucleic Acids Res 47, D1005–d1012, doi: 10.1093/nar/gky1120 (2019). [DOI] [PMC free article] [PubMed] [Google Scholar]
- 28.Tishkoff SA et al. The genetic structure and history of Africans and African Americans. Science (New York, N.Y.) 324, 1035–1044, doi: 10.1126/science.1172257 (2009). [DOI] [PMC free article] [PubMed] [Google Scholar]
- 29.Brown BC, Ye CJ, Price AL & Zaitlen N Transethnic Genetic-Correlation Estimates from Summary Statistics. American journal of human genetics 99, 76–88, doi: 10.1016/j.ajhg.2016.05.001 (2016). [DOI] [PMC free article] [PubMed] [Google Scholar]
- 30.Lee SH, Yang J, Goddard ME, Visscher PM & Wray NR Estimation of pleiotropy between complex diseases using single-nucleotide polymorphism-derived genomic relationships and restricted maximum likelihood. Bioinformatics 28, 2540–2542, doi: 10.1093/bioinformatics/bts474 (2012). [DOI] [PMC free article] [PubMed] [Google Scholar]
- 31.Guo J et al. Quantifying genetic heterogeneity between continental populations for human height and body mass index. Scientific reports 11, 5240, doi: 10.1038/s41598-021-84739-z (2021). [DOI] [PMC free article] [PubMed] [Google Scholar]
- 32.Ge T, Chen C-Y, Ni Y, Feng Y-CA & Smoller JW Polygenic prediction via Bayesian regression and continuous shrinkage priors. Nature Communications 10, 1776, doi: 10.1038/s41467-019-09718-5 (2019). [DOI] [PMC free article] [PubMed] [Google Scholar]
- 33.Majara L et al. Low generalizability of polygenic scores in African populations due to genetic and environmental diversity. bioRxiv, 2021.2001.2012.426453, doi: 10.1101/2021.01.12.426453 (2021). [DOI] [Google Scholar]
- 34.Lehmann BCL, Mackintosh M, McVean G & Holmes CC High trait variability in optimal polygenic prediction strategy within multiple-ancestry cohorts. bioRxiv, 2021.2001.2015.426781, doi: 10.1101/2021.01.15.426781 (2021). [DOI] [Google Scholar]
- 35.Shi H et al. Population-specific causal disease effect sizes in functionally important regions impacted by selection. Nature Communications 12, 1098, doi: 10.1038/s41467-021-21286-1 (2021). [DOI] [PMC free article] [PubMed] [Google Scholar]
- 36.Martin AR et al. Clinical use of current polygenic risk scores may exacerbate health disparities. Nature genetics 51, 584–591, doi: 10.1038/s41588-019-0379-x (2019). [DOI] [PMC free article] [PubMed] [Google Scholar]
- 37.Cavazos TB & Witte JS Inclusion of variants discovered from diverse populations improves polygenic risk score transferability. Human Genetics and Genomics Advances 2, 100017, doi: 10.1016/j.xhgg.2020.100017 (2021). [DOI] [PMC free article] [PubMed] [Google Scholar]
- 38.Wojcik GL et al. Genetic analyses of diverse populations improves discovery for complex traits. Nature 570, 514–518, doi: 10.1038/s41586-019-1310-4 (2019). [DOI] [PMC free article] [PubMed] [Google Scholar]
- 39.Bentley AR et al. Multi-ancestry genome-wide gene–smoking interaction study of 387,272 individuals identifies new loci associated with serum lipids. Nature genetics 51, 636–648, doi: 10.1038/s41588-019-0378-y (2019). [DOI] [PMC free article] [PubMed] [Google Scholar]
- 40.Taliun D et al. Sequencing of 53,831 diverse genomes from the NHLBI TOPMed Program. Nature 590, 290–299, doi: 10.1038/s41586-021-03205-y (2021). [DOI] [PMC free article] [PubMed] [Google Scholar]
- 41.Kowalski MH et al. Use of >100,000 NHLBI Trans-Omics for Precision Medicine (TOPMed) Consortium whole genome sequences improves imputation quality and detection of rare variant associations in admixed African and Hispanic/Latino populations. PLoS genetics 15, e1008500, doi: 10.1371/journal.pgen.1008500 (2019). [DOI] [PMC free article] [PubMed] [Google Scholar]
Methods References
- 42.Das S et al. Next-generation genotype imputation service and methods. Nature genetics 48, 1284–1287, doi: 10.1038/ng.3656 (2016). [DOI] [PMC free article] [PubMed] [Google Scholar]
- 43.Efficacy and safety of cholesterol-lowering treatment: prospective meta-analysis of data from 90 056 participants in 14 randomised trials of statins. The Lancet 366, 1267–1278, doi: 10.1016/S0140-6736(05)67394-1 (2005). [DOI] [PubMed] [Google Scholar]
- 44.Loh P-R et al. Efficient Bayesian mixed-model analysis increases association power in large cohorts. Nature genetics 47, 284–290, doi: 10.1038/ng.3190 (2015). [DOI] [PMC free article] [PubMed] [Google Scholar]
- 45.Zhou W et al. Efficiently controlling for case-control imbalance and sample relatedness in large-scale genetic association studies. Nature genetics 50, 1335–1341, doi: 10.1038/s41588-018-0184-y (2018). [DOI] [PMC free article] [PubMed] [Google Scholar]
- 46.Winkler TW et al. Quality control and conduct of genome-wide association meta-analyses. Nat Protoc 9, 1192–1212, doi: 10.1038/nprot.2014.071 (2014). [DOI] [PMC free article] [PubMed] [Google Scholar]
- 47.Feng S, Liu D, Zhan X, Wing MK & Abecasis GR RAREMETAL: fast and powerful meta-analysis for rare variants. Bioinformatics 30, 2828–2829, doi: 10.1093/bioinformatics/btu367 (2014). [DOI] [PMC free article] [PubMed] [Google Scholar]
- 48.Mägi R et al. Trans-ethnic meta-regression of genome-wide association studies accounting for ancestry increases power for discovery and improves fine-mapping resolution. Human Molecular Genetics 26, 3639–3650, doi: 10.1093/hmg/ddx280 (2017). [DOI] [PMC free article] [PubMed] [Google Scholar]
- 49.Willer CJ, Li Y & Abecasis GR METAL: fast and efficient meta-analysis of genomewide association scans. Bioinformatics 26, 2190–2191, doi: 10.1093/bioinformatics/btq340 (2010). [DOI] [PMC free article] [PubMed] [Google Scholar]
- 50.Loh P-R, Palamara PF & Price AL Fast and accurate long-range phasing in a UK Biobank cohort. Nature genetics 48, 811–816, doi: 10.1038/ng.3571 (2016). [DOI] [PMC free article] [PubMed] [Google Scholar]
- 51.Liu X et al. WGSA: an annotation pipeline for human genome sequencing studies. Journal of Medical Genetics 53, 111–112, doi: 10.1136/jmedgenet-2015-103423 (2016). [DOI] [PMC free article] [PubMed] [Google Scholar]
- 52.Cingolani P et al. A program for annotating and predicting the effects of single nucleotide polymorphisms, SnpEff: SNPs in the genome of Drosophila melanogaster strain w1118; iso-2; iso-3. Fly 6, 80–92, doi: 10.4161/fly.19695 (2012). [DOI] [PMC free article] [PubMed] [Google Scholar]
- 53.Wang K, Li M & Hakonarson H ANNOVAR: functional annotation of genetic variants from high-throughput sequencing data. Nucleic Acids Research 38, e164–e164, doi: 10.1093/nar/gkq603 (2010). [DOI] [PMC free article] [PubMed] [Google Scholar]
- 54.Quinlan AR & Hall IM BEDTools: a flexible suite of utilities for comparing genomic features. Bioinformatics 26, 841–842, doi: 10.1093/bioinformatics/btq033 (2010). [DOI] [PMC free article] [PubMed] [Google Scholar]
- 55.Liu DJ et al. Meta-analysis of gene-level tests for rare variant association. Nature genetics 46, 200–204, doi: 10.1038/ng.2852 (2014). [DOI] [PMC free article] [PubMed] [Google Scholar]
- 56.Maller JB et al. Bayesian refinement of association signals for 14 loci in 3 common diseases. Nature genetics 44, 1294–1301, doi: 10.1038/ng.2435 (2012). [DOI] [PMC free article] [PubMed] [Google Scholar]
- 57.Kass RE & Raftery AE Bayes Factors. Journal of the American Statistical Association 90, 773–795, doi: 10.1080/01621459.1995.10476572 (1995). [DOI] [Google Scholar]
- 58.Machiela MJ & Chanock SJ LDlink: a web-based application for exploring population-specific haplotype structure and linking correlated alleles of possible functional variants. Bioinformatics 31, 3555–3557, doi: 10.1093/bioinformatics/btv402 (2015). [DOI] [PMC free article] [PubMed] [Google Scholar]
- 59.McLaren W et al. The Ensembl Variant Effect Predictor. Genome Biology 17, 122, doi: 10.1186/s13059-016-0974-4 (2016). [DOI] [PMC free article] [PubMed] [Google Scholar]
- 60.Sherry ST et al. dbSNP: the NCBI database of genetic variation. Nucleic acids research 29, 308–311, doi: 10.1093/nar/29.1.308 (2001). [DOI] [PMC free article] [PubMed] [Google Scholar]
- 61.Giambartolomei C et al. Bayesian Test for Colocalisation between Pairs of Genetic Association Studies Using Summary Statistics. PLoS genetics 10, e1004383, doi: 10.1371/journal.pgen.1004383 (2014). [DOI] [PMC free article] [PubMed] [Google Scholar]
- 62.The GTEx Consortium atlas of genetic regulatory effects across human tissues. Science (New York, N.Y.) 369, 1318–1330, doi: 10.1126/science.aaz1776 (2020). [DOI] [PMC free article] [PubMed] [Google Scholar]
- 63.Purcell S et al. PLINK: a tool set for whole-genome association and population-based linkage analyses. American journal of human genetics 81, 559–575, doi: 10.1086/519795 (2007). [DOI] [PMC free article] [PubMed] [Google Scholar]
- 64.Berisa T & Pickrell JK Approximately independent linkage disequilibrium blocks in human populations. Bioinformatics 32, 283–285, doi: 10.1093/bioinformatics/btv546 (2016). [DOI] [PMC free article] [PubMed] [Google Scholar]
- 65.Finer S et al. Cohort Profile: East London Genes & Health (ELGH), a community-based population genomics and health study in British Bangladeshi and British Pakistani people. International Journal of Epidemiology 49, 20–21i, doi: 10.1093/ije/dyz174 (2019). [DOI] [PMC free article] [PubMed] [Google Scholar]
- 66.Moon S et al. The Korea Biobank Array: Design and Identification of Coding Variants Associated with Blood Biochemical Traits. Scientific reports 9, 1382, doi: 10.1038/s41598-018-37832-9 (2019). [DOI] [PMC free article] [PubMed] [Google Scholar]
- 67.Alexander DH, Novembre J & Lange K Fast model-based estimation of ancestry in unrelated individuals. Genome Res 19, 1655–1664, doi: 10.1101/gr.094052.109 (2009). [DOI] [PMC free article] [PubMed] [Google Scholar]
Associated Data
This section collects any data citations, data availability statements, or supplementary materials included in this article.
Supplementary Materials
Data Availability Statement
The GWAS meta-analysis results (including both ancestry-specific and trans-ancestry analyses) and risk score weights are available at: http://csg.sph.umich.edu/willer/public/glgc-lipids2021. The optimized trans-ancestry and single-ancestry polygenic score weights are deposited in the PGS Catalogue (https://www.pgscatalog.org/) accession ids: PGS000886-PGS000897 (all intervening numbers).


