

Abstract
Background
High intake of added sugar have been suggested to impact the risk for cardiovascular disease (CVD). Knowledge on the subject can contribute to preventing CVD.
Objectives
To assess the effects of a high versus low‐added sugar consumption for primary prevention of CVD in the general population.
Search methods
We searched Cochrane Central Register of Controlled Trials (CENTRAL) in the Cochrane Library, MEDLINE, Embase, Conference Proceedings Citation Index‐Science (CPCI‐S) on 2 July 2021. We also conducted a search of ClinicalTrials.gov and the WHO International Clinical Trials Registry Platform (ICTRP) Search Portal for ongoing or unpublished trials. The search was performed together with reference checking, citation searching and contact with study authors to identify additional studies. We imposed no restriction on language of publication or publication status.
Selection criteria
We included randomised controlled trials (RCTs), including cross‐over trials, that compared different levels of added sugar intake. Exclusion criteria were: participants aged below 18 years; diabetes mellitus (type 1 and 2); and previous CVD. Primary outcomes were incident cardiovascular events (coronary, carotid, cerebral and peripheral arterial disease) and all‐cause mortality. Secondary outcomes were changes in systolic and diastolic blood pressure, total cholesterol, LDL‐cholesterol, HDL‐cholesterol, triglycerides, fasting plasma glucose and adverse events (gastrointestinal symptoms and impaired dental health).
Data collection and analysis
We used the standard methodological procedures expected by Cochrane.
Main results
We included 21 RCTs (1110 participants completing the interventions) examining the effects of different levels of added sugar intake with a mean duration of 14 weeks. The study participants were generally described as healthy and the mean age ranged from 22 to 57 years.
No studies reported on cardiovascular events or all‐cause mortality. There was minimal effect of low intake of added sugar on total cholesterol levels (MD 0.11, 95% CI 0.01 to 0.21; I² = 0%; 16 studies; 763 participants; low certainty of evidence) and triglycerides (MD 0.10, 95% CI 0.03 to 0.17; I² = 3%; 14 studies; 725 participants) but no evidence of effect on LDL‐cholesterol and HDL‐cholesterol. There was minimal effect on diastolic blood pressure (MD 1.52, 95% CI 0.67 to 2.37; I² = 0%; 13 studies; 873 participants) and on systolic blood pressure (MD 1.44, 95% 0.08 to 2.80; I² = 27%, 14 studies; 873 participants; low certainty of evidence), but no evidence of effect on fasting plasma glucose.
Only one study reported on dental health, with no events. No other trials reported adverse events (impaired dental health or gastrointestinal symptoms).
All results were judged as low‐quality evidence according to GRADE. The risk of bias was generally unclear, five studies were classified at an overall low risk of bias (low risk in at least four domains, not including other bias).
Authors' conclusions
No trials investigating the effect of added sugar on cardiovascular events or all‐cause mortality were identified in our searches. Evidence is uncertain whether low intake of added sugar has an effect on risk factors for CVD; the effect was small and the clinical relevance is, therefore, uncertain. Practical ways to achieve reductions in dietary added sugar includes following current dietary recommendations.
Future trials should have longer follow‐up time and report on all‐cause mortality and cardiovascular events in order to clarify the effect of added sugar on these outcomes. Future trials should also aim for more direct interventions and preferably be more independent of industry funding.
Keywords: Adult, Aged, Humans, Middle Aged, Young Adult, Cardiovascular Diseases, Cardiovascular Diseases/epidemiology, Cardiovascular Diseases/prevention & control, Cholesterol, Dietary Sugars, Dietary Sugars/adverse effects, Primary Prevention, Sugars
Plain language summary
Low levels of sugar to prevent cardiovascular disease
Background
Cardiovascular disease (CVD) is a group of disorders affecting the heart and blood vessels and the number one cause of death worldwide. It is important to detect modifiable risk factors and find strategies to prevent CVD. There are several established modifiable risk factors for developing CVD, one of them being eating an unhealthy diet rich in sugar. Sugar can be divided in two categories; sugars naturally occurring in food and sugars that are added to food. A high level of added sugar intake is suggested to cause weight gain and affect blood lipids, increasing the risk of CVD. This review assessed different levels of added sugars in the diet and the effect on cardiovascular events (e.g. heart attack or stroke), death, and CVD risk factors in healthy adults.
Study characteristics
Databases for randomised controlled trials (clinical trials in which participants are randomly assigned to either an experimental or a control treatment) were searched. The trials that were included compared different levels of added sugar intake and its effect on risk factors for CVD in healthy adults. People with previous CVD or diabetes were not included in the review.
Key results
Twenty‐one trials were found with 1110 participants. None of the trials looked at cardiovascular events or death. The trials reported on blood pressure, blood lipid levels and blood sugar levels. The review found that low levels of added sugar intake led to a small reduction in blood pressure and blood lipid levels, but no effect was seen on blood sugar. The evidence is current to July 2021.
Quality of the evidence
The studies included in the review provide low‐quality evidence that low levels of added sugar in the diet indirectly reduces the risk of cardiovascular disease. More long‐term studies of high quality assessing effects of different levels of sugar on CVD risk factors, cardiovascular events and death are needed.
Summary of findings
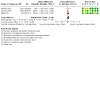
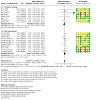
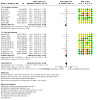
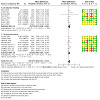
Summary of findings 1. Effects of high‐ compared to low‐added sugar consumption for the primary prevention of cardiovascular disease.
| Effects of high‐ compared to low‐added sugar consumption for the primary prevention of cardiovascular disease | ||||||
| Patient or population: Adults without diabetes or CVD Setting: Community Intervention: High‐added sugar intake Comparison: Low‐added sugar intake | ||||||
| Outcomes | Anticipated absolute effects* (95% CI) | Relative effect (95% CI) | № of participants (studies) | Certainty of the evidence (GRADE) | Comments | |
| Risk with low‐added sugar intake | Risk with Effects of high‐added sugar intake | |||||
| Cardiovascular event | No trials reported cardiovascular events | |||||
| All‐cause mortality | No trials reported all‐cause mortality | |||||
|
Systolic blood pressure (mmHg) Mean follow‐up 12 weeks1 |
The mean systolic blood pressure (mmHg) was 117.3 | MD 1.44 higher (0.08 lower to 2.80 higher) |
— | 873 (14 RCTs) | ⊕⊕⊝⊝ LOW 2 3 | Lowndes 2014b reported no differences in systolic blood pressure, but could not be included in the analysis as no numerical data were provided. |
|
Total cholesterol (mmol/L) Mean follow‐up 10 weeks1 |
The mean total cholesterol (mmol/L) was 4.7 | MD 0.11 higher (0.01 lower to 0.21 higher) | — | 763 (16 RCTs) | ⊕⊕⊝⊝ LOW 2 3 | |
|
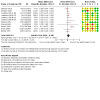
LDL‐cholesterol (mmol/L) Mean follow‐up 12 weeks1 |
The mean LDL‐cholesterol (mmol/L) was 2.9 | MD 0.01 higher (‐0.08 lower to 0.10 higher) | — | 712 (12 RCTs) | ⊕⊕⊝⊝ LOW 2 3 | |
|
HDL‐cholesterol (mmol/L) Mean follow‐up 14 weeks1 |
The mean HDL‐ cholesterol (mmol/L) was 1.2 | MD 0.01 higher (‐0.02 lower to 0.04 higher) | — | 817 (16 RCTs) | ⊕⊕⊝⊝ LOW 2 3 | |
|
Fasting plasma glucose(mmol/L) Mean follow‐up 12 weeks1 |
The mean fasting plasma glucose(mmol/L) was 5.1 | MD 0.06 higher (‐0.01 lower to 0.13 higher) | — | 720 (14 RCTs) | ⊕⊕⊝⊝ LOW 2 3 | |
| *The risk in the intervention group (and its 95% confidence interval) is based on the assumed risk in the comparison group and the relative effect of the intervention (and its 95% CI). CI: Confidence interval; RR: Risk ratio; OR: Odds ratio; | ||||||
| GRADE Working Group grades of evidence High certainty: We are very confident that the true effect lies close to that of the estimate of the effect Moderate certainty: We are moderately confident in the effect estimate: The true effect is likely to be close to the estimate of the effect, but there is a possibility that it is substantially different Low certainty: Our confidence in the effect estimate is limited: The true effect may be substantially different from the estimate of the effect Very low certainty: We have very little confidence in the effect estimate: The true effect is likely to be substantially different from the estimate of effect | ||||||
1 Minimum study duration was 4 weeks for the secondary outcomes.
2Risk of bias. Unclear risk of bias in most domains. Downgraded once
3Indirectness. Indirect interventions. Only surrogate outcomes reported. Downgraded twice
Background
High intake of added sugars has been suggested as having an impact on risk for cardiovascular disease (CVD). Many studies support this claim, in particular, in regard to sugar‐sweetened beverages (SSB). However, for total added sugar intake, the evidence is much weaker. Hence, there is a need to review the current evidence from randomised controlled trials (RCTs) in this area.
Description of the condition
Cardiovascular diseases (CVDs) are disorders of the heart and blood vessels and incorporate, for instance, acute coronary and cerebrovascular events. The origin of many CVDs is atherosclerosis, a condition that develops over many years and is often initially asymptomatic. Atherosclerosis is defined as the progressive accumulation of lipids and inflammatory cells in arteries of the body (Torres 2015). Atherosclerosis develops when arteries are narrowed or completely blocked, thus restricting the flow of blood or oxygen to organs or tissue. CVDs are a major cause of disability and are the number one cause of death globally. In 2015, it was estimated that 31% of all global deaths were due to CVDs (World Health Organization 2017). As the world's population increases and becomes older, the prevalence of CVDs is expected to increase further in the future (Roth 2015).
The most established modifiable risk factors for CVDs are physical inactivity, tobacco use, excessive alcohol consumption and maintaining an unhealthy diet. Non‐modifiable factors that can affect CVD risk include: higher age, male sex and heredity (Mendis 2011). In order to decrease mortality and morbidity resulting from CVDs, early detection methods as well as prevention strategies focusing on the modifiable risk factors are crucial. Prominent markers of detection and treating targets for CVDs are overweight and obesity conditions, dyslipidaemia and hypertension (Mendis 2011), which are all becoming increasingly prevalent health issues worldwide (Global Burden of Disease 2016).
Description of the intervention
Sugars (all mono‐ and disaccharides) can be divided into two categories: those occurring naturally in foods (intrinsic), such as lactose in milk and fructose in fruit, and those that are added to foods (extrinsic). There is no globally unanimous way to define the term 'added sugar', but the definition by the American Heart Association is clear, simple and corresponds to the majority of other definitions: ”Added sugars include any sugars or caloric sweeteners that are added to foods or beverages during processing or preparation”, for instance, white sugar (sucrose), honey, or high‐fructose corn syrups (HFCS) (American Heart Association 2017). The World Health Organisation (WHO) utilises the term 'free sugars' which includes all added sugars and the naturally occurring sugars in fruit juices (World Health Organization 2015). The WHO recommends that, for both children and adults, the total intake of free sugars should be less than 10% of the total energy intake and, ideally, not exceed 5%. It is a growing public health concern that high‐added sugar intake is causing an increased overall intake of calories for many individuals. Also, of concern is that a high intake of sugar‐rich foods can replace healthier and more nutritious foods, resulting in a less nutrient‐dense diet. Impaired nutrient density and the effects on increased energy intake and body weight, as well as the risk for dental caries, lies at the foundation of today's dietary guidelines regarding sugar (World Health Organization 2015).
The consumption of added sugar in high‐income countries is, in general, exceeding this recommended upper level. However, the current overall trends in these countries are actually suggesting a reached plateau or even a small decrease (Wittekind 2014), while the global trends, driven by low‐ and middle‐income countries, are suggesting overall increasing sugar consumption (World Cancer Research Fund International 2015).
How the intervention might work
One of the main driving forces behind why high sugar intake is hypothesised to increase risk of CVD is because of the potential weight gain it is causing. Sugar‐rich products are generally very palatable, or “high rewarding” (Stice 2013) and, at the same time, less satiating than more fibrous foods (Rebello 2013). This can result in over‐consumption and an energy intake higher than required, hence leading to weight gain. In a meta‐analysis of RCTs and cohort studies on sugar intake and body weight, of a total of 38 cohort studies and 30 trials, the authors concluded that sugar intake is a determinant of body weight, which likely is due to skewed energy balance rather than any biological effects of the sugar molecules. However, the effects of a reduced sugar intake have modest effects on obesity (Te Morenga 2012).
Higher sugar intakes are also associated with increased triglycerides, total cholesterol and LDL‐cholesterol in a large meta‐analysis of RCTs (Te Morenga 2014), which is considered to be a serum lipid profile that induces atherosclerosis (NECP 2002). In addition, it is suggested that sugar intake can be related to CVD risk through decreasing insulin sensitivity (Aeberli 2011) and can possibly also promote low‐grade inflammation (Aeberli 2011; Liu 2002; Sorensen 2005). However, several studies do not support these findings (Black 2006; Lewis 2013; Maersk 2012) and it is difficult to say with certainty whether this is a cause of the actual sugar itself or from altered adipose tissue (body fat) and blood lipid profile. In addition, blood pressure is one of the strongest risk factors and first treatment targets for CVD and is, therefore, also considered an important risk marker to evaluate (Karmali 2018).
Fructose has been in particular focus for a lot of research, possibly because of the large increase in usage of HFCS for sweetening, which contains 55% fructose and 45% glucose. Fructose has a lower glycaemic index (GI) compared to both sucrose and especially glucose, and does not yield as high insulin responses (Bantle 1986; Teff 2009), but there are findings suggesting that fructose, in particular, contributes to the increased accumulation of lipids in both vessels and liver and to visceral accumulation of adipose tissue surrounding the organs (Silbernagel 2011; Stanhope 2009). However, fructose and glucose are seldom consumed separately, but rather joined as sucrose or HFCS, and findings are not unanimous. Thus, it remains unclear how much the different metabolic pathways of glucose and fructose actually matter for the adipose tissue, blood lipid profile and cardiovascular risk (Silbernagel 2011). Therefore, this review focusses on different intake levels of all added sugars rather than comparing different sugars against each other.
Why it is important to do this review
Regarding diet and CVD prevention, meta‐analyses of either RCTs, cohort studies, or both, have previously shown that low‐sodium intake (Aburto 2013), low intakes of saturated fatty acids (Hooper 2020), high intake of dietary fibre (Threapleton 2013) and whole grains (Ye 2012), and a diet rich in fruits and vegetables (Hartley 2013) can decrease CVD risk. As for sugars, evidence from a meta‐analysis of prospective cohort studies on SSB and its effect on increased cardiovascular risk is quite conclusive (Xi 2015). Regarding total added sugar intake, two cohort studies have observed a positive relationship between added sugar intake and CVD mortality (Ramne 2018; Yang 2014). However, the study by Ramne and colleagues could also see tendencies for increased risk with the lowest intakes, i.e. a U‐shaped association (Ramne 2018). A third cohort study, investigating sugar and mortality, could not see an association (Tasevska 2014). Additionally, both the study by Ramne and colleagues and Tasevska and colleagues could see tendencies for opposite associations when separately examining added sugar intake from beverages (positive) and solid foods (negative). This inconclusive epidemiology goes in line with the existing evidence for total added sugar intake and CVDs, which currently is not very persuasive or conclusive (EFSA 2010; Hauner 2012).
As mentioned, the previous focus for research has primarily been on SSB, where the majority of data comes from observational studies, or comparing different types of sugar against each other, i.e. glucose versus fructose, rather than investigating an altered dose of total added sugars. (Chiavaroli 2015; Evans 2017; Ha 2012; Zhang 2013). Several Cochrane reviews of RCTs investigating different dietary components for prevention of CVD have been conducted (Clar 2017; Hartley 2016; Hooper 2018; Kelly 2017), however, none regarding added sugar intake. A few other systematic reviews have investigated added sugar intake and cardiovascular risk markers, but none have aimed to include CVD incidence as the primary outcome (Fattore 2017; Te Morenga 2014). Hence, it is of great importance to elucidate the evidence from RCTs that attend to the whole spectra of added sugar consumption from all sources and its potential role in primary prevention of CVD.
Objectives
To assess the effects of a high versus low‐added sugar consumption for primary prevention of CVD in the general population.
Methods
Criteria for considering studies for this review
Types of studies
We included randomised controlled trials (RCTs), including cross‐over trials. We included studies reported as full text, those published as abstract only, and unpublished data.
Types of participants
The study participants were required to have participated in an intervention comparing different levels of added sugar intake. Studies were not included if they fulfilled one or more of the following criteria:
Study population aged below 18 years;
Study population with diabetes mellitus (type 1 and 2);
Study population with previous CVD.
Types of interventions
We included trials aimed to manipulate sugar intake, hence, we compared a high sugar intake with a low sugar intake. The studies included any type of added sugar (e.g. sucrose, fructose or glucose) or sugar‐rich foods and beverages consumed orally. Limiting to added sugars meant that interventions of, for instance, high or low‐fruit intake (high in intrinsic sugars) were not included. The included interventions consisted of dietary advice where added sugar intake was either increased or decreased, provision of sugar‐rich products or encompassing a diet alteration where added sugar intake is either at a high or low level (as defined in the individual studies). If the intervention aimed towards increasing sugar intake, then the comparison group (or no treatment group) represented the low sugar group. And if the intervention group aimed to decrease sugar intake, then the comparison group (or no treatment group) represented the high sugar group.
The comparison group could be given no advice/supplementation (continue with their usual diet), a placebo product or any control diet. Studies that compared corresponding amounts of different types of sugars, for example, glucose versus fructose, were excluded from the review. We did not include studies where an altered sugar consumption was part of an overall diet or lifestyle intervention which, for instance, additionally modified exercise routines in order to avoid potential confounding.
In order to include as many studies as possible, while still ensuring enough time for stabilisation of, for instance, blood lipid concentrations, we included interventions that lasted a minimum of four weeks between baseline and follow‐up. Four weeks was not expected to be enough time to have an effect on our primary outcomes, therefore, a minimum of six months follow‐up time was required for these outcomes. Cross‐over trials were included, but only data from the first period was extracted for evaluation of the primary outcomes, and from both periods for the secondary outcomes. A minimum wash‐out period of two weeks was necessary to minimise carry‐over effects for the secondary outcomes. Trials not adhering to these study duration requirements were excluded from the analyses.
Types of outcome measures
Primary outcomes
Incident cardiovascular event (coronary, carotid, cerebral and peripheral arterial disease)
All‐cause mortality
Secondary outcomes
Changes in systolic blood pressure
Changes in diastolic blood pressure
Changes in total cholesterol
Changes in LDL‐cholesterol
Changes in HDL‐cholesterol
Changes in triglycerides
Changes in fasting plasma glucose
Adverse events: gastrointestinal symptoms (such as nausea, abdominal pain, constipation and diarrhoea)
Adverse events: impaired dental health (such as dental caries)
Where a published report did not appear to report one of these outcomes, we attempted to access the trial protocol and contacted the trial authors to ascertain whether the outcomes were measured but not reported. Relevant trials which measured these outcomes but did not report the data at all, or not in a usable format, were included in the review as part of the narrative. We did not report on other measured outcomes not relevant for the present review.
Search methods for identification of studies
Electronic searches
The electronic search was conducted on 2 July 2021, and we identified trials through systematic searches of the following bibliographic databases:
Cochrane Central Register of Controlled Trials (CENTRAL) in the Cochrane Library (Issue 7 of 12, July 2021);
MEDLINE (Ovid, from 1946 to 1 July 2021);
Embase (Ovid, from 1980 to 2021 week 25);
Conference Proceedings Citation Index — Science (CPCI‐S; Web of Science, from 1990 to 2 July 2021).
The search strategies for the databases (Appendix 1) were adapted from the draft search strategy for MEDLINE (Ovid). The Cochrane sensitivity‐precision maximising RCT filter (Lefebvre 2011) was applied to MEDLINE (Ovid) and adaptations of it to the other databases, except CENTRAL. We also conducted a search of ClinicalTrials.gov (www.ClinicalTrials.gov) and the WHO International Clinical Trials Registry Platform (ICTRP) Search Portal (http://apps.who.int/trialsearch/) for ongoing or unpublished trials on 2 July 2021.
We imposed no restriction on language of publication or publication status. We did not perform a separate search for adverse effects of interventions of altered sugar intake. We considered adverse effects described in included studies only.
Searching other resources
We checked reference lists of all included studies and any relevant systematic reviews identified for additional references to RCTs. We also examined any relevant retraction statements and errata for included studies. We contacted authors for missing data, where necessary.
Data collection and analysis
Selection of studies
We used Cochrane’s Screen4Me workflow to help assess some search results. Screen4Me comprises three components: known assessments — a service that matches records in the search results to records that have already been screened in Cochrane Crowd and been labelled as an 'RCT' or as 'Not an RCT'; the RCT classifier — a machine learning model that distinguishes RCTs from non‐RCTs and, if appropriate, Cochrane Crowd — Cochrane’s citizen science platform where the Crowd help to identify and describe health evidence. For more information about Screen4Me and the evaluations that have been done, please go to the Screen4Me webpage on the Cochrane Information Specialist’s portal: https://community.cochrane.org/organizational‐info/resources/resourcesgroups/ information‐specialists‐portal. In addition, more detailed information regarding evaluations of the Screen4Me components can be found in the following publications: Marshall 2018; McDonald 2017; Noel‐Storr 2018; Thomas 2017.
Two review authors (SB and AJ) independently screened titles and abstracts for inclusion and coded them as 'retrieve' (eligible or potentially eligible/unclear) or 'do not retrieve'. If there were any disagreements, a third and fourth author were asked to arbitrate (SA and ES). We retrieved the full‐text study reports/publications and two review authors (SB and AJ) independently screened the full text, identified studies for inclusion, and identified and recorded reasons for exclusion of the ineligible studies. We resolved any disagreement through discussion or, where required, we consulted a third and fourth person (SA and ES). We identified and excluded duplicates and collated multiple articles of the same study so that each study, rather than each article, was the unit of interest in the review. We recorded the selection process in sufficient detail to complete a PRISMA flow diagram (Figure 1) and Characteristics of excluded studies table.
1.
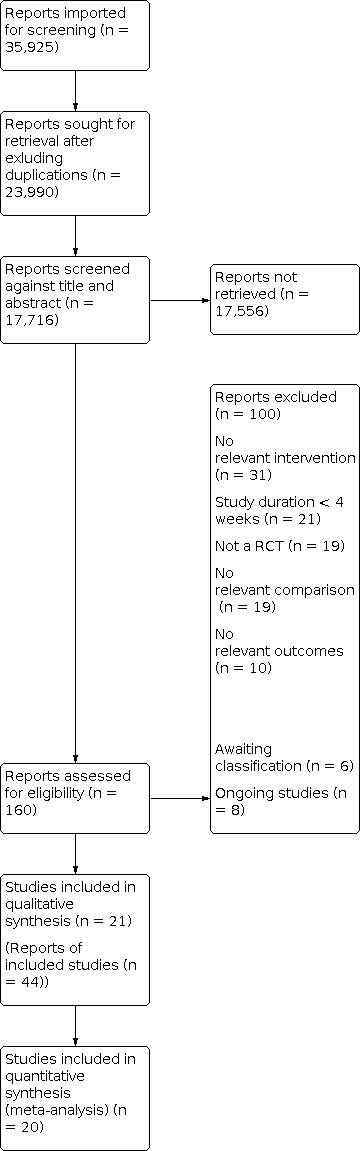
Figure 1. Study flow diagram
Data extraction and management
We used a data collection form for study characteristics and outcome data.
We extracted the following study characteristics, if available:
Methods: study design, total duration of study, number of study centres and location, study setting, date of study and wash‐out period for cross‐over trials.
Participants: N randomised, N lost to follow‐up/withdrawn, N analysed, mean age, age range, gender, mean BMI, parameters of metabolic syndrome, other diseases, eventual weight change, compliance with intervention, inclusion criteria, and exclusion criteria. Baseline data on lipids and other characteristics were collected and assessed for imbalance between groups.
Interventions: intervention details, and comparison details in sufficient detail to allow subgroups to be determined.
Outcomes: primary and secondary outcomes (including adverse events) specified and collected, and time points reported.
Notes: funding source of trial and notable conflicts of interest of trial authors.
Two review authors (SB and AJ) independently extracted outcome data from included studies. We resolved disagreements by consensus or by involving a third and fourth person (SA and ES). One review author (AJ) transferred data into the Review Manager (RevMan 2014) file. We double‐checked that data were entered correctly by comparing the data presented in the systematic review with the data extraction form. Two review authors (SB and AJ) spot‐checked study characteristics for accuracy against the trial report.
Assessment of risk of bias in included studies
Two review authors (SB and AJ) independently assessed risk of bias for each study using the criteria outlined in the Cochrane Handbook for Systematic Reviews of Interventions (Higgins 2011). We resolved any disagreements by discussion or by involving two other authors (SA and ES). We assessed the risk of bias according to the following domains.
Random sequence generation
Allocation concealment
Blinding of participants and personnel
Blinding of outcome assessment
Incomplete outcome data
Selective outcome reporting
Other bias
The primary aspect of ’other biases’ to consider was compliance with the intervention. Each potential source of bias was graded as high, low or unclear and provided a quote from the study report together with a justification for our judgement in the Risk of bias table. A study needed to be rated as low risk in at least four domains (not including 'other bias') to be considered at low summary risk of bias. The risk of bias judgements were summarised across different studies for each of the domains listed.
For cross‐over trials, the risk of biases that we considered were:
Whether the cross‐over design was suitable
Whether there was a carry‐over effect
Whether only first‐period data were available
Incorrect analysis
Comparability of results with those from parallel‐group trials
Measures of treatment effect
Mean difference and standard error were used for continuous data. If the same study presented both change scores and end of follow‐up data, we used the Cochrane Handbook (Deeks 2018) guidelines to identify the most appropriate form to include. Differences in units across studies were converted to the unit most used to avoid expressions in standardised mean difference. We entered data presented as a scale with a consistent direction of effect. We narratively described skewed data reported as medians and interquartile ranges.
Unit of analysis issues
If studies reported results at several time points, we analysed the time point with the longest follow‐up.
Studies with multiple intervention groups: Where we identified relevant studies with multiple intervention groups, we only included the highest intake group and the lowest intake group, to avoid splitting the control group. Moreover, since it might be different between studies if the intervention arm aimed to increase or decrease sugar intake, these were combined in the main analyses. This allowed us to always compare low sugar intake with high sugar intake so that trials aiming to increase sugar intake appeared with the control arm in the low sugar intake side of the equation.
Cross‐over trials: We evaluated the evidence based on data from the first phase of the intervention for the primary outcomes since these are conditions evolving over time, have long‐term effects, and it cannot be ascertained that any length of wash‐out period is adequate for eliminating the risk of carry‐over effects. Both periods were considered for the continuous secondary outcomes, so long as there was a minimum wash‐out period of two weeks between phases. We adhered to the recommended methods outlined in the Cochrane Handbook regarding cross‐over trials (Higgins 2011), and we used the generic inverse variance (GIV) method and reported the mean difference and standard error for each trial. For the trials that did not report this and instead reported the results as for instance standard deviation, we used the Revman calculator to compute the standard error.
Dealing with missing data
We contacted study authors in order to obtain missing numerical outcome data where possible (e.g. when a study was identified as abstract only). If this was not possible, the risk of bias assessment reflected this potential shortcoming. If relevant trials did not report the SD, we used the Revman calculator to attain the standard error (SE), from other available data, such as standard deviation (SD), 95% confidence interval (CI) and P values. For missing participant data, we based the evidence on an intention‐to‐treat analysis.
Assessment of heterogeneity
We used the I² statistic to measure heterogeneity among the trials in each analysis. If we identified substantial heterogeneity, we reported it and explored possible causes by prespecified subgroup analysis. We also visually assessed forest plots in order to evaluate the direction and magnitude of effects and potential overlap of CIs. Statistical heterogeneity was assessed using the I² test. We also, in addition to using the I² test, considered the P value from the Chi² tests. The significance level was set at a P value < 0.05. I² was calculated using a random‐effects model and interpreted according to the Cochrane Handbook (Deeks 2018) guidelines:
0% to 40%: might not be important;
30% to 60%: may represent moderate heterogeneity:
50% to 90%: may represent substantial heterogeneity:
75% to 100%: considerable heterogeneity.
Assessment of reporting biases
We were not able to pool more than 10 trials in order to create and examine a funnel plot to explore possible small study biases for the primary outcomes as planned; instead a funnel plot was created for the outcome total cholesterol, as described in Effects of interventions.
Data synthesis
We undertook meta‐analyses only where this was meaningful i.e. if the treatments, participants and the underlying clinical question were similar enough for pooling to make sense.
We used a random‐effects model, as we were expecting some degree of heterogeneity in the results. Clinical diversity among the included studies was expected, since they could have varying interventions, doses and comparisons. In addition, previous reviews that had a similar approach and focus, had chosen the random‐effects model.
If some studies reported continuous outcomes using change from baseline and some reported end of follow‐up values, we combined these in the same meta‐analysis and reported the mean difference and standard error.
We converted units, when applicable, so that all results were expressed in the same units. Total cholesterol, HDL‐cholesterol and LDL‐cholesterol were converted from mg/dL to mmol/L by dividing mg/dL by 38.67. Triglycerides were converted from mg/dL to mmol/L by dividing mg/dL by 88.57. Fasting plasma glucose was converted from mg/dL to mmol/L by dividing mg/dL by 18.
Subgroup analysis and investigation of heterogeneity
We carried out the following subgroup analyses:
Increased or decreased added sugar intake;
Isocaloric exchange or ad libitum intake;
Liquid or solid state of added sugar source;
Control in form of starch/refined grains;
Weight change (> 0.5 kg difference in weight change between the two study arms) or no weight change;
Healthy population or high‐risk population (metabolic syndrome or obesity, hypertension, dyslipidaemia and elevated fasting blood glucose levels/pre‐diabetes);
Duration of intervention (more or less than six months);
Industry‐funded studies or no involvement with industry.
We investigated all outcomes in all subgroup analyses, and we used the formal test for subgroup interactions in Review Manager (RevMan 2014).
Sensitivity analysis
We carried out the following sensitivity analyses:
Only including studies with a low risk of bias. A study was judged to be at low risk of bias when there was low risk in at least four domains (not including 'other bias').
Excluding cross‐over trials.
Summary of findings and assessment of the certainty of the evidence
We created a Table 1 for high versus low‐added sugar intake, presenting the following outcomes: cardiovascular events, all‐cause mortality, systolic blood pressure, total cholesterol, LDL‐cholesterol, HDL‐cholesterol, and fasting plasma glucose. We used the five GRADE considerations (study limitations, consistency of effect, imprecision, indirectness and publication bias) to assess the quality of a body of evidence as it related to the studies which contributed data to the meta‐analyses for the prespecified outcomes. We used methods and recommendations described in Section 8.5 (Higgins 2011) and Chapter 15 (Schünemann 2018) of the Cochrane Handbook for Systematic Reviews of Interventions using GRADEpro software (https://gradepro.org/).
We justified all decisions to downgrade the quality of studies using footnotes, and we made comments to aid the reader's understanding of the review, where necessary.
Judgements about evidence quality were made by two review authors (SB and AJ) working independently, with disagreements resolved by discussion or involving a third and fourth author (SA and ES). Judgements were justified, documented and incorporated into reporting of results for each outcome.
Results
Description of studies
Descriptions of the included and excluded studies can be found in the Characteristics of included studies and in the Characteristics of excluded studies tables.
Results of the search
The search generated 17,723 hits, and the subsequent screening of titles and abstract resulted in 145 studies to be assessed as full text. Twenty‐one studies adhered to the inclusion criteria and were included in the review. The study flow diagram can be seen in Figure 1. In addition, eight studies were categorised as ongoing and are outlined in the Characteristics of ongoing studies table.
Included studies
Types of studies
Twenty‐one studies were included in total and are outlined in the Characteristics of included studies table. Seven were cross‐over trials (Ahmad 2020; Black 2006; Lewis 2013; Maki 2015; Markey 2016; Njike 2011; Umpleby 2017) and 14 were parallel‐group RCTs. The studies were published between 1976 and 2021 with a clear majority published in the 2000s. Six of the included studies were conducted in the USA, five in the UK, two in Denmark, Norway, Switzerland and Mexico and one in Finland and New Zealand. Twelve of the included studies were two‐arm trials, five trials had three arms (Ebbeling 2020; Mann 1972; Njike 2011; Sanchez‐Delgado 2021; Vazquez‐Duran 2016), but only two arms were used for this review for all analyses. Three trials had four arms (Geidl‐Flueck 2021; Lowndes 2014b; Maersk 2012; for Geidl‐Flueck 2021 and Maersk 2012, only two arms were relevant for this review) and one study had six arms (Lowndes 2014a), four that were relevant for the purposes of this review.
Overview of study populations
In total, there were 1110 study participants across the included trials included in the meta‐analysis. The study populations ranged from 13 (Black 2006; Lewis 2013) to 231 (Lowndes 2014a). The mean study population was 53 participants. The age of the study participants ranged from a mean of 22 years (Vazquez‐Duran 2016) to a mean of 57 years (Ahmad 2020; Umpleby 2017). Two studies did not report mean age (Mann 1972; Madero 2015). The mean of age for all the remaining study participants was 39.2 years. Four studies only included men (Ahmad 2020; Black 2006; Geidl‐Flueck 2021; Umpleby 2017) and two studies only included women (Johnson 2015; Surwit 1997). Two studies did not report on the sex distribution of the study participants (Campos 2015; Smith 1996). Excluding the trials not reporting on sex distribution, the total study population consisted of 47% men and 53% women. The study participants were generally described as 'healthy' (as defined in the individual studies) (Black 2006; Geidl‐Flueck 2021; Mann 1972; Markey 2016; Sanchez‐Delgado 2021; Smith 1996) or overweight or obese (Campos 2015; Lewis 2013; Lowndes 2014a; Lowndes 2014b; Madero 2015; Maersk 2012; Njike 2011; Raben 2002; Surwit 1997). One study described the participants as being of increased CVD risk (Ahmad 2020) and some trials requested that the participants had a habitually high SSB consumption (Campos 2015; Ebbeling 2020; Maki 2015; Vazquez‐Duran 2016). Two trials included individuals with a specific diagnosis: polycystic ovary syndrome (PCOS) (Johnson 2015) and non‐alcoholic fatty liver disease (NAFLD) (Umpleby 2017).
Description of interventions
The most common intervention was comparing different levels of sucrose (expressed as the percentage of the daily total energy intake), and was determined by adjusting the participants' intake of foods and/or beverages (Black 2006; Lewis 2013; Mann 1972; Markey 2016; Surwit 1997; Umpleby 2017). Two studies had a similar design, but focused on fructose instead (Johnson 2015; Madero 2015). Ahmad 2020 compared high versus low sugar intake, but did not specify what type of sugar used. Studies also compared foods and beverages sweetened with sucrose with artificial sweeteners (Raben 2002), steviol glycocides (Sanchez‐Delgado 2021) or HFCS (Lowndes 2014a; Lowndes 2014b). Five trials compared SSBs with unsweetened or artificially sweetened beverages (Campos 2015; Ebbeling 2020; Maersk 2012; Njike 2011; Vazquez‐Duran 2016) and one trial compared SSBs with SSB abstinence (Geidl‐Flueck 2021). One study compared sugar‐sweetened products with dairy products (Maki 2015) and one study compared a sugar‐free diet with participants' usual diet (Smith 1996). Eight trials (Campos 2015; Ebbeling 2020; Geidl‐Flueck 2021; Maersk 2012; Njike 2011; Raben 2002; Sanchez‐Delgado 2021; Smith 1996) used an ad libitum diet. The remaining trials described their dietary exchange as isocaloric.
Outcomes included
None of the included trials reported on the primary outcomes; cardiovascular events and all‐cause mortality. For the seven secondary outcomes, all were reported in at least 10 different trials. Mann 1972 did not provide any standard deviations for reported outcomes and could not be included in the meta‐analysis. For adverse events, one study reported on dental health (Maersk 2012).
Funding sources and conflicts of interests
Eleven of the included studies reported funding sources from the sugar industry with potential vested interests and other conflicts of interests (Black 2006; Lewis 2013; Lowndes 2014a; Lowndes 2014b; Maersk 2012; Maki 2015; Mann 1972; Markey 2016; Njike 2011; Raben 2002; Surwit 1997). Four studies stated that there were no conflicts of interests (Ahmad 2020; Geidl‐Flueck 2021; Johnson 2015; Sanchez‐Delgado 2021). The remaining studies did not report funding source or potential conflicts of interests (Campos 2015; Ebbeling 2020; Madero 2015; Smith 1996; Umpleby 2017; Vazquez‐Duran 2016).
Excluded studies
Reasons for exclusion for studies that did not fulfil the inclusion criteria are outlined in the Characteristics of excluded studies table. The most common reasons for exclusion were: not relevant intervention, no relevant comparison and study duration less than four weeks, as can be seen in Figure 1.
Studies awaiting classification and ongoing studies
Six studies are awaiting classification (see Characteristics of studies awaiting classification). Eight studies are ongoing studies (see Characteristics of ongoing studies).
Risk of bias in included studies
The risk of bias assessments for the included studies can be seen in Figure 2 and Figure 3.
2.

Figure 2. Risk of bias summary: review authors' judgment about each risk of bias domain for each included study.
3.

Figure 3. Risk of bias graph: review authors' judgements about each risk of bias domain presented as percentages across all included studies.
Allocation
Random sequence generation was adequately described in 11 studies which were hence rated as low risk of bias in this domain (Black 2006; Geidl‐Flueck 2021; Johnson 2015; Lewis 2013; Madero 2015; Maki 2015; Markey 2016; Njike 2011; Smith 1996; Umpleby 2017; Vazquez‐Duran 2016). Ten studies were reported as randomised but no information on how the randomisation process was conducted was included; they were therefore rated as having 'unclear' risk of bias (Ahmad 2020; Campos 2015; Ebbeling 2020; Lowndes 2014a; Lowndes 2014b; Maersk 2012; Mann 1972; Raben 2002; Sanchez‐Delgado 2021; Surwit 1997).
Allocation concealment was deemed unclear in all but five studies. These studies adequately described allocation concealment and were rated as having low risk of bias (Geidl‐Flueck 2021; Johnson 2015; Maki 2015; Umpleby 2017; Vazquez‐Duran 2016).
Blinding
Adequate blinding procedures for participants and personnel were reported in five studies (Geidl‐Flueck 2021; Lowndes 2014a; Lowndes 2014b; Markey 2016; Njike 2011). Eight trials were not blinded, the primary reason being that blinding was not possible due to the nature of the intervention; they were therefore rated as having high risk of bias (Ebbeling 2020; Johnson 2015; Maersk 2012; Maki 2015; Mann 1972; Smith 1996; Umpleby 2017; Vazquez‐Duran 2016). The remaining trials did not mention blinding of participants and personnel and were rated as unclear (Ahmad 2020; Black 2006; Campos 2015; Lewis 2013; Madero 2015; Raben 2002; Sanchez‐Delgado 2021; Surwit 1997).
Outcome assessors were adequately blinded in four studies (Ebbeling 2020; Madero 2015; Njike 2011; Vazquez‐Duran 2016) and not mentioned in the remaining studies.
Incomplete outcome data
Eight trials included information on number of individuals lost to follow‐up, provided reasons for attrition and had a similar rate of dropouts in the different intervention groups (Black 2006; Ebbeling 2020; Lowndes 2014a; Madero 2015; Markey 2016; Njike 2011; Sanchez‐Delgado 2021; Vazquez‐Duran 2016). Studies rated at a high risk of bias had high dropout rates, did not specify dropout proportions between study groups or had low compliance in the intervention group (Maersk 2012; Maki 2015; Smith 1996; Umpleby 2017). Nine studies did not provide enough information to judge this domain and were rated as 'unclear' (Ahmad 2020; Campos 2015; Geidl‐Flueck 2021; Johnson 2015; Lewis 2013; Lowndes 2014b; Mann 1972; Raben 2002; Surwit 1997)
Selective reporting
Studies that prospectively registered the trial on, for instance, clinicaltrials.gov and had no major deviations between the protocol and the published article, were rated as having low risk of bias in this domain (Campos 2015; Geidl‐Flueck 2021; Johnson 2015; Madero 2015; Markey 2016; Umpleby 2017; Vazquez‐Duran 2016). For the remaining trials, it was not possible to fully judge this domain based on the information provided (Ahmad 2020; Black 2006; Ebbeling 2020; Lewis 2013; Lowndes 2014a; Lowndes 2014b; Maersk 2012; Maki 2015; Mann 1972; Njike 2011; Raben 2002; Sanchez‐Delgado 2021; Smith 1996; Surwit 1997).
Other potential sources of bias
Compliance with intervention
All included studies assessed compliance with the intervention. Some studies (Black 2006; Johnson 2015; Lewis 2013; Surwit 1997) contacted participants daily or several times per week to ensure dietary adherence. Other studies assessed compliance through interviews weekly (Sanchez‐Delgado 2021), every two weeks (Ebbeling 2020) or every month (Smith 1996). Several studies monitored self‐reported dietary intake weekly (Lowndes 2014a; Lowndes 2014b; Madero 2015; Vazquez‐Duran 2016), biweekly (Ahmad 2020; Mann 1972) or every four to six weeks (Njike 2011; Raben 2002; Umpleby 2017). Campos 2015 estimated more than 90% compliance from returned packages of beverages; a method also used by Geidl‐Flueck 2021, Maersk 2012, Maki 2015 and Markey 2016. Lack of dietary compliance was one of the main reasons for participant attrition in many of the included studies.
Risk of bias for cross‐over trials
The seven included studies (Ahmad 2020; Black 2006; Lewis 2013; Maki 2015; Markey 2016; Njike 2011; Umpleby 2017) had a suitable cross‐over design. All studies met the inclusion criteria of a minimum wash‐out period of two weeks between interventions and the number of participants allocated to each of the two sequences were nearly equal, minimising risk for carry‐over effects. Data from both periods were available and analyses appeared to be correctly executed across studies. The results were comparable with those from parallel‐group trials.
Summary risk of bias
All studies were assessed in relation to secondary outcomes due to lack of reported primary outcomes. Five studies were rated at an overall low risk of bias (Geidl‐Flueck 2021; Madero 2015; Markey 2016; Njike 2011; Vazquez‐Duran 2016), as these were rated as low risk in at least four domains (not including 'other bias'). The risk of bias assessment for three trials resulted in an unclear assessment, but no domains were rated at a high risk of bias (Black 2006; Lowndes 2014a; Sanchez‐Delgado 2021). The remaining studies had at least one domain assessed as high risk.
Effects of interventions
See: Table 1
Primary outcomes
No trials reported on the primary outcomes, cardiovascular events and all‐cause mortality.
Secondary outcomes
Blood pressure
Systolic blood pressure
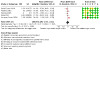
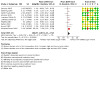
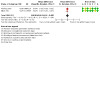
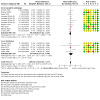
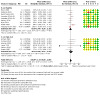
Fourteen studies reported systolic blood pressure and were summarised in a meta‐analysis of 15 comparisons. A difference in effect was found between the comparison groups, favouring a low‐added sugar intake (MD 1.44, 95% 0.08 to 2.80; I² = 27%; 14 studies; 873 participants; low certainty of evidence; Analysis 1.1). The results were pooled using a random‐effects model.
1.1. Analysis.

Comparison 1: Effects of high vs low‐added sugar consumption, Outcome 1: Systolic blood pressure (mmHg)
Lowndes 2014b reported no statistically significant difference in systolic blood pressure between the two intervention groups but provided no numerical data and could therefore not be included in the meta‐analysis.
Five studies were judged to be at low risk of bias (Geidl‐Flueck 2021; Madero 2015; Markey 2016; Njike 2011; Vazquez‐Duran 2016) and were included in a sensitivity analysis (MD ‐0.07, 95% ‐0.69 to 0.56; I² = 0%; 5 studies; 303 participants; low certainty of evidence; Analysis 8.1). Owing to the low number of studies included in the analysis, these results should be interpreted with caution.
8.1. Analysis.

Comparison 8: Sensitivity analysis ‐ Low risk of bias, Outcome 1: Systolic blood pressure (mmHg)
After excluding the seven cross‐over studies (no cluster‐randomised trials were found) and Mann 1972 (as no standard deviation for reported outcomes was provided), another sensitivity analysis was carried out on the 13 remaining parallel trials (MD 1.77; 95% CI 0.05 to 3.50; I2 = 42%; 9 studies; 735 participants; low certainty of evidence; Analysis 9.1). Excluding cross‐over studies did not lead to a substantial change in the effect estimate.
9.1. Analysis.

Comparison 9: Sensitivity analysis ‐ Cross‐overs excluded, Outcome 1: Systolic blood pressure (mmHg)
Diastolic blood pressure
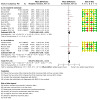
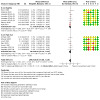
Fourteen studies reported diastolic blood pressure and were summarised in a meta‐analysis comprising 15 comparisons. A difference in effect was noted between the comparison groups, favouring a low‐added sugar intake (MD 1.52, 95% CI 0.67 to 2.37; I² = 0%; 13 studies; 873 participants; Analysis 1.2). The results were pooled using a random‐effects model.
1.2. Analysis.

Comparison 1: Effects of high vs low‐added sugar consumption, Outcome 2: Diastolic blood pressure (mmHg)
Lowndes 2014b reported no statistically significant difference in diastolic blood pressure between the two intervention groups but provided no numerical data and could therefore not be included in the meta‐analysis.
The five studies judged at low risk of bias were included in a sensitivity analysis (MD 0.19, 95% ‐1.93 to 2.31; I2 = 64%; 303 participants; Analysis 8.2). Owing to the low number of studies included in the analysis, these results should be interpreted with caution.
8.2. Analysis.
Comparison 8: Sensitivity analysis ‐ Low risk of bias, Outcome 2: Diastolic blood pressure (mmHg)
A sensitivity analysis including all parallel trials was performed (MD 1.98, 95% CI 1.23 to 2.72; I2 = 7%; 9 studies; 735 participants; Analysis 9.2). Excluding cross‐over studies did not lead to a substantial change in the effect estimate.
9.2. Analysis.
Comparison 9: Sensitivity analysis ‐ Cross‐overs excluded, Outcome 2: Diastolic blood pressure (mmHg)
Blood lipids
Total cholesterol
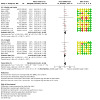
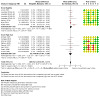
Sixteen studies reported total cholesterol and were summarised in a meta‐analysis of 19 comparisons. The pooled analysis showed a difference in effect between the comparison groups and favoured a low‐added sugar intake (MD 0.11, 95% CI 0.01 to 0.21; I² = 0%; 16 studies; 763 participants; low certainty of evidence; Analysis 1.3). The results were pooled with a random‐effects model.
1.3. Analysis.

Comparison 1: Effects of high vs low‐added sugar consumption, Outcome 3: Total cholesterol (mmol/L)
Sanchez‐Delgado 2021 reported total cholesterol as median and IQR and could not be included in the pooled analysis. Total cholesterol concentrations increased in the high‐added sugar intake group; no change was observed in the low‐added sugar intake group.
The five studies judged at low risk of bias were included in a sensitivity analysis (MD 0.19, 95% ‐1.93 to 2.31; I2 = 15%; 3 studies; 159 participants; low certainty of evidence; Analysis 8.3). Owing to the low number of studies included in the analysis, these results should be interpreted with caution.
8.3. Analysis.

Comparison 8: Sensitivity analysis ‐ Low risk of bias, Outcome 3: Total cholesterol (mmol/L)
A sensitivity analysis including all parallel trials was performed (MD 0.13, 95% CI ‐0.02 to 0.27; I2 = 14%; 10 studies; 600 participants; low certainty of evidence; Analysis 9.3). Excluding cross‐over studies did not lead to a substantial change in the effect estimate.
9.3. Analysis.

Comparison 9: Sensitivity analysis ‐ Cross‐overs excluded, Outcome 3: Total cholesterol (mmol/L)
As no studies reported on primary outcomes, a funnel plot for total cholesterol was generated, since this analysis included the highest number of studies; Figure 4. By visual inspection, the funnel plot appeared asymmetrical, suggesting the possibility of publication bias.
4.
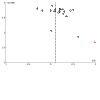
Figure 4: Funnel plot for studies that reported total cholesterol.
LDL‐cholesterol
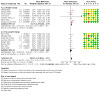
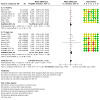
Twelve studies reported LDL‐cholesterol and were summarised in a meta‐analysis of 15 comparisons. The pooled analysis showed no difference in effect between comparison groups (MD 0.01, 95% CI ‐0.08 to 0.10; I² = 20%; 12 studies; 712 participants; low certainty of evidence; Analysis 1.4). The results were pooled with a random‐effects model.
1.4. Analysis.

Comparison 1: Effects of high vs low‐added sugar consumption, Outcome 4: LDL‐cholesterol (mmol/L)
The five studies judged at low risk of bias were included in a sensitivity analysis (MD ‐0.04, 95% ‐0.11 to 0.03; I2 = 0%, 2 studies; 87 participants; low certainty of evidence; Analysis 8.4). Owing to the low number of studies included in the analysis, these results should be interpreted with caution.
8.4. Analysis.

Comparison 8: Sensitivity analysis ‐ Low risk of bias, Outcome 4: LDL‐cholesterol (mmol/L)
A sensitivity analysis including all parallel trials was performed (MD 0.02, 95% ‐0.18 to 0.22; I2 = 55%; 5 studies; 515 participants; low certainty of evidence; Analysis 9.4). Excluding cross‐over studies did not lead to a substantial change in the effect estimate.
9.4. Analysis.

Comparison 9: Sensitivity analysis ‐ Cross‐overs excluded, Outcome 4: LDL‐cholesterol (mmol/L)
HDL‐cholesterol
Sixteen studies reported HDL‐cholesterol and were summarised in a meta‐analysis of 19 comparisons. The pooled analysis showed no difference in effect between comparison groups (MD 0.01, 95% CI ‐0.02 to 0.04; I² = 0%; 16 studies; 817 participants; low certainty of evidence; Analysis 1.5). The results were pooled with a random‐effects model.
1.5. Analysis.

Comparison 1: Effects of high vs low‐added sugar consumption, Outcome 5: HDL‐cholesterol (mmol/L)
The five studies judged at low risk of bias were included in a sensitivity analysis (MD 0.01, 95% ‐0.07 to 0.09; I2 = 0%; 2 studies; 87 participants; low certainty of evidence; Analysis 8.5). Owing to the low number of studies included in the analysis, these results should be interpreted with caution.
8.5. Analysis.

Comparison 8: Sensitivity analysis ‐ Low risk of bias, Outcome 5: HDL‐cholesterol (mmol/L)
A sensitivity analysis including all parallel trials was performed (MD 0.01, 95% ‐0.04 to 0.06; I2 = 22%; 9 studies; 620 participants; low certainty of evidence; Analysis 9.5). Excluding cross‐over studies did not lead to a substantial change in the effect estimate.
9.5. Analysis.

Comparison 9: Sensitivity analysis ‐ Cross‐overs excluded, Outcome 5: HDL‐cholesterol (mmol/L)
Triglycerides
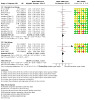
Sixteen studies reported on triglycerides and 14 of these were summarised in a meta‐analysis of 16 comparisons. The pooled analysis showed a difference in effect between comparison groups, favouring a low‐added sugar intake (MD 0.10, 95% CI 0.03 to 0.17; I² = 3%; 14 studies; 725 participants; Analysis 1.6). The results were pooled with a random‐effects model.
1.6. Analysis.

Comparison 1: Effects of high vs low‐added sugar consumption, Outcome 6: Triglycerides (mmol/L)
Black 2006 reported triglycerides as a median and IQR and could not be included in the pooled analysis. Triglyceride levels were similar in both diet groups. Sanchez‐Delgado 2021 also reported triglycerides as a median and IQR and could not be included in the pooled analysis. A significant increase in triglyceride concentration was observed in the high‐added sugar group and a decrease was observed in the low‐added sugar group. Mann 1972 did not report any standard deviations for triglyceride levels and was therefore not included in the meta‐analysis. A significant decrease in triglyceride levels was seen in the group with low‐level added sugar intake.
The five studies judged at low risk of bias were included in a sensitivity analysis (MD 0.07, 95% ‐0.01 to 0.16; I2 = 0%; 3 studies; 159 participants; Analysis 8.6). Owing to the low number of studies included in the analysis, these results should be interpreted with caution.
8.6. Analysis.
Comparison 8: Sensitivity analysis ‐ Low risk of bias, Outcome 6: Triglycerides (mmol/L)
A sensitivity analysis including all parallel trials was performed (MD 0.14, 95% CI 0.01 to 0.28; I2 = 28%; 9 studies; 566 participants; Analysis 9.6). Excluding cross‐over studies did not lead to a substantial change in the effect estimate.
9.6. Analysis.
Comparison 9: Sensitivity analysis ‐ Cross‐overs excluded, Outcome 6: Triglycerides (mmol/L)
Fasting plasma glucose
Fourteen studies reported fasting plasma glucose and were summarised in a meta‐analysis consisting of 16 comparisons. No difference in effect was found between the comparison groups (MD 0.06, 95% CI ‐0.01 to 0.13; I² = 26%; 14 studies; 720 participants; low certainty of evidence; Analysis 1.7). The results were pooled using a random‐effects model.
1.7. Analysis.

Comparison 1: Effects of high vs low‐added sugar consumption, Outcome 7: Fasting plasma glucose (mmol/L)
Sanchez‐Delgado 2021 reported fasting plasma glucose as a median and IQR and could not be included in the pooled analysis. No significant differences between the two diet groups were observed.
The five studies judged at low risk of bias were included in a sensitivity analysis (MD ‐0.06, 95% ‐0.19 to 0.08; I2 = 0%; 2 studies; 87 participants; low certainty of evidence; Analysis 8.7). Owing to the low number of studies included in the analysis, these results should be interpreted with caution.
8.7. Analysis.
Comparison 8: Sensitivity analysis ‐ Low risk of bias, Outcome 7: Fasting plasma glucose (mmol/L)
A sensitivity analysis including the parallel trials was performed (MD 0.11, 95% CI 0.00 to 0.21; I2 = 43%; 7 studies; 472 participants; low certainty of evidence; Analysis 9.7). Excluding cross‐over studies did not lead to a substantial change in the effect estimate.
9.7. Analysis.

Comparison 9: Sensitivity analysis ‐ Cross‐overs excluded, Outcome 7: Fasting plasma glucose (mmol/L)
Adverse events
One study reported on dental health (Maersk 2012), with no events. No other trials reported on the adverse events dental health or gastrointestinal symptoms.
Subgroup analyses
No subgroup analysis was carried out on high or low‐added sugar intake, since this was covered in the main analyses. No control arms used starch/refined grains and therefore no subgroup analysis was conducted on this.
Isocaloric intake or ad libitum
Testing for subgroup differences between studies with isocaloric exchange and ab libitum intake did not lead to any subgroup differences (Analysis 2.1; Analysis 2.2; Analysis 2.3; Analysis 2.4; Analysis 2.5; Analysis 2.6; Analysis 2.7).
2.1. Analysis.

Comparison 2: Subgroup analysis ‐ Isocaloric intake or ad libitum, Outcome 1: Systolic blood pressure (mmHg)
2.2. Analysis.

Comparison 2: Subgroup analysis ‐ Isocaloric intake or ad libitum, Outcome 2: Diastolic blood pressure (mmHg)
2.3. Analysis.
Comparison 2: Subgroup analysis ‐ Isocaloric intake or ad libitum, Outcome 3: Total cholesterol (mmol/L)
2.4. Analysis.

Comparison 2: Subgroup analysis ‐ Isocaloric intake or ad libitum, Outcome 4: LDL‐cholesterol (mmol/L)
2.5. Analysis.

Comparison 2: Subgroup analysis ‐ Isocaloric intake or ad libitum, Outcome 5: HDL‐cholesterol (mmol/L)
2.6. Analysis.
Comparison 2: Subgroup analysis ‐ Isocaloric intake or ad libitum, Outcome 6: Triglycerides (mmol/L)
2.7. Analysis.
Comparison 2: Subgroup analysis ‐ Isocaloric intake or ad libitum, Outcome 7: Fasting plasma glucose (mmol/L)
Solid and liquid or liquid state
No studies investigated altered sugar intake in solid foods only and therefore the comparison was changed to solid and liquid versus liquid state.
Testing for subgroup differences between solid and liquid and liquid state did not lead to any subgroup differences (Analysis 3.1; Analysis 3.2; Analysis 3.3; Analysis 3.4; Analysis 3.5; Analysis 3.6; Analysis 3.7).
3.1. Analysis.

Comparison 3: Subgroup analysis ‐ Solid and liquid or liquid state, Outcome 1: Systolic blood pressure (mmHg)
3.2. Analysis.

Comparison 3: Subgroup analysis ‐ Solid and liquid or liquid state, Outcome 2: Diastolic blood pressure (mmHg)
3.3. Analysis.

Comparison 3: Subgroup analysis ‐ Solid and liquid or liquid state, Outcome 3: Total cholesterol (mmol/L)
3.4. Analysis.

Comparison 3: Subgroup analysis ‐ Solid and liquid or liquid state, Outcome 4: LDL‐cholesterol (mmol/L)
3.5. Analysis.
Comparison 3: Subgroup analysis ‐ Solid and liquid or liquid state, Outcome 5: HDL‐cholesterol (mmol/L)
3.6. Analysis.

Comparison 3: Subgroup analysis ‐ Solid and liquid or liquid state, Outcome 6: Triglycerides (mmol/L)
3.7. Analysis.

Comparison 3: Subgroup analysis ‐ Solid and liquid or liquid state, Outcome 7: Fasting plasma glucose (mmol/L)
Difference in weight change
One study did not report the participants weight at follow‐up and was therefore excluded from this subgroup analysis (Vazquez‐Duran 2016).
Trials that reported a greater than 0.5 kg difference in weight change between the two study arms and the studies that reported no weight change were separated, and the test for subgroup difference suggested that high‐added sugar compared with low added sugar may have a different effect on diastolic blood pressure depending on weight change (P = 0.0004, I2 = 86.6%; Analysis 4.2). The remainder of the subgroup analyses for difference in weight change did not lead to any subgroup differences (Analysis 4.1; Analysis 4.3; Analysis 4.4; Analysis 4.5; Analysis 4.6; Analysis 4.7).
4.2. Analysis.
Comparison 4: Subgroup analysis ‐ Difference in weight change, Outcome 2: Diastolic blood pressure (mmHg)
4.1. Analysis.

Comparison 4: Subgroup analysis ‐ Difference in weight change, Outcome 1: Systolic blood pressure (mmHg)
4.3. Analysis.

Comparison 4: Subgroup analysis ‐ Difference in weight change, Outcome 3: Total cholesterol (mmol/L)
4.4. Analysis.

Comparison 4: Subgroup analysis ‐ Difference in weight change, Outcome 4: LDL‐cholesterol (mmol/L)
4.5. Analysis.

Comparison 4: Subgroup analysis ‐ Difference in weight change, Outcome 5: HDL‐cholesterol (mmol/L)
4.6. Analysis.

Comparison 4: Subgroup analysis ‐ Difference in weight change, Outcome 6: Triglycerides (mmol/L)
4.7. Analysis.

Comparison 4: Subgroup analysis ‐ Difference in weight change, Outcome 7: Fasting plasma glucose (mmol/L)
Healthy or high‐risk population
For the subgroup analysis of healthy or high‐risk populations, the study was categorised as high‐risk if more than half of the participants met these requirements, and vice versa.
Testing for subgroup differences between healthy and high‐risk populations did not lead to any subgroup differences (Analysis 5.1; Analysis 5.2; Analysis 5.3; Analysis 5.4; Analysis 5.5; Analysis 5.6; Analysis 5.7).
5.1. Analysis.
Comparison 5: Subgroup analysis ‐ Healthy or high risk population, Outcome 1: Systolic blood pressure (mmHg)
5.2. Analysis.

Comparison 5: Subgroup analysis ‐ Healthy or high risk population, Outcome 2: Diastolic blood pressure (mmHg)
5.3. Analysis.

Comparison 5: Subgroup analysis ‐ Healthy or high risk population, Outcome 3: Total cholesterol (mmol/L)
5.4. Analysis.
Comparison 5: Subgroup analysis ‐ Healthy or high risk population, Outcome 4: LDL‐cholesterol (mmol/L)
5.5. Analysis.

Comparison 5: Subgroup analysis ‐ Healthy or high risk population, Outcome 5: HDL‐cholesterol (mmol/L)
5.6. Analysis.
Comparison 5: Subgroup analysis ‐ Healthy or high risk population, Outcome 6: Triglycerides (mmol/L)
5.7. Analysis.
Comparison 5: Subgroup analysis ‐ Healthy or high risk population, Outcome 7: Fasting plasma glucose (mmol/L)
Intervention < 6 months or ≥ 6 months
Comparing the length of the intervention by dividing the trials into less than six months or six months or more for diastolic blood pressure suggested that a high or low‐added sugar intake may have a different effect depending on the study duration (P = 0.03, I2 = 79.7%; Analysis 6.2). No differences between the subgroups were observed for the remainder of the analyses (Analysis 6.1; Analysis 6.3; Analysis 6.4; Analysis 6.5; Analysis 6.6; Analysis 6.7).
6.2. Analysis.

Comparison 6: Subgroup analysis ‐ Intervention <6 months or ≥6 months, Outcome 2: Diastolic blood pressure (mmHg)
6.1. Analysis.

Comparison 6: Subgroup analysis ‐ Intervention <6 months or ≥6 months, Outcome 1: Systolic blood pressure (mmHg)
6.3. Analysis.

Comparison 6: Subgroup analysis ‐ Intervention <6 months or ≥6 months, Outcome 3: Total cholesterol (mmol/L)
6.4. Analysis.

Comparison 6: Subgroup analysis ‐ Intervention <6 months or ≥6 months, Outcome 4: LDL‐cholesterol (mmol/L)
6.5. Analysis.

Comparison 6: Subgroup analysis ‐ Intervention <6 months or ≥6 months, Outcome 5: HDL‐cholesterol (mmol/L)
6.6. Analysis.

Comparison 6: Subgroup analysis ‐ Intervention <6 months or ≥6 months, Outcome 6: Triglycerides (mmol/L)
6.7. Analysis.

Comparison 6: Subgroup analysis ‐ Intervention <6 months or ≥6 months, Outcome 7: Fasting plasma glucose (mmol/L)
Industry funding
The trials were divided according to the presence of industry funding/involvement and did not result in any subgroup differences (Analysis 7.1; Analysis 7.2; Analysis 7.3; Analysis 7.4; Analysis 7.5; Analysis 7.6; Analysis 7.7).
7.1. Analysis.

Comparison 7: Subgroup analysis ‐ Industry funding, Outcome 1: Systolic blood pressure (mmHg)
7.2. Analysis.

Comparison 7: Subgroup analysis ‐ Industry funding, Outcome 2: Diastolic blood pressure (mmHg)
7.3. Analysis.
Comparison 7: Subgroup analysis ‐ Industry funding, Outcome 3: Total cholesterol (mmol/L)
7.4. Analysis.

Comparison 7: Subgroup analysis ‐ Industry funding, Outcome 4: LDL‐cholesterol (mmol/L)
7.5. Analysis.
Comparison 7: Subgroup analysis ‐ Industry funding, Outcome 5: HDL‐cholesterol (mmol/L)
7.6. Analysis.

Comparison 7: Subgroup analysis ‐ Industry funding, Outcome 6: Triglycerides (mmol/L)
7.7. Analysis.
Comparison 7: Subgroup analysis ‐ Industry funding, Outcome 7: Fasting plasma glucose (mmol/L)
Discussion
Summary of main results
This systematic review summarised 21 RCTS examining the effect of added sugar on risk factors for cardiovascular disease. None of the studies reported on cardiovascular event or all‐cause mortality, the review's primary outcomes. The risk of bias was generally unclear, and only five studies were classified at an overall low risk of bias (low risk in at least four domains, not including other bias). The interventions generally compared different levels of fructose or sucrose in foods and/or beverages, with some trials using artificial sweeteners as the comparator.
The study participants who were in the high‐added sugar intake group had 1.44 mmHg higher systolic blood pressure mean (MD 1.44, 95% 0.08 to 2.80; I² = 27%; 14 studies; 873 participants; low certainty of evidence; Analysis 1.1), 1.52 mmHg higher diastolic blood pressure mean (MD 1.52, 95% CI 0.67 to 2.37; I² = 0%; 13 studies; 873 participants; Analysis 1.2), 0.11 mmol/L higher total cholesterol mean (MD 0.11, 95% CI 0.01 to 0.21; I² = 0%; 16 studies; 763 participants; low certainty of evidence; Analysis 1.3) and a 0.10 mmol/L higher triglyceride level mean (MD 0.10, 95% CI 0.03 to 0.17; I² = 3%; 14 studies; 725 participants; Analysis 1.6) when comparing with the participants in the low‐added sugar intake group. There did not appear to be an association between a high intake of added sugar and increased levels of LDL‐cholesterol, HDL‐cholesterol and fasting plasma glucose. Adverse events were only reported in Maersk 2012, (reporting no events of impaired dental health). The evidence in the present review is uncertain and the effect was small and, therefore, the clinical relevance is uncertain.
The subgroup analyses, comparing isocaloric exchange with ad libitum intake, solid with liquid state, healthy with high‐risk population and industry‐funding with no involvement, did not generate any subgroup differences. Separating the trials according to weight change (less or greater than 0.5 kg change between study arms) resulted in a difference in effect for diastolic blood pressure (P = 0.0004, I2 = 86.6%; Analysis 4.2). The considerable heterogeneity in this comparison indicates that these results should be interpreted with caution.
A sensitivity analysis was conducted where only studies with an overall low risk of bias were included (n = 5). No statistically significant results appeared in the sensitivity analysis. The results should be viewed with caution due to the low number of studies included. A sensitivity analysis, where the cross‐over trials (n = 7) and Mann 1972 (as no standard deviation for reported outcomes was provided) were excluded, was also conducted. A difference in effect between high and low‐added sugar intake groups was observed for systolic blood pressure (MD 1.77; 95% CI 0.05 to 3.50; I2 = 42%; 9 studies; 735 participants; low certainty of evidence; Analysis 9.1), diastolic blood pressure (MD 1.98; 95% CI 1.23 to 2.72; I2 = 7%; 9 studies; 735 participants; Analysis 9.2), triglycerides MD 0.14; 95% CI 0.01 to 0.28; I2 = 28%; 9 studies; 566 participants; Analysis 9.6) and fasting plasma glucose (MD 0.11, 95% CI 0.00 to 0.21; I2 = 43%; 7 studies; 472 participants; low certainty of evidence; Analysis 9.7), all favouring a low‐added sugar intake. The statistical heterogeneity observed for diastolic blood pressure means that this result needs to be viewed with caution. The results of the sensitivity analyses did not lead to a substantial change in effect estimate for any of the outcomes.
Overall completeness and applicability of evidence
The number of trials meeting the inclusion criteria was relatively large, and allowed for analyses of our secondary outcomes. No studies reported on our primary outcomes and therefore no analyses could be conducted on these. Hence, no conclusions can be drawn regarding high versus low‐added sugar intake for the primary prevention of CVDs. The conclusions drawn in this review rely entirely on results attained from analyses of the secondary outcomes. However, the secondary outcomes were chosen primarily on the basis of the role these have in the development of cardiovascular disease and even though no conclusions can be drawn regarding the primary prevention of cardiovascular disease, a decreased sugar intake seems to decrease blood pressure and lipid levels and potentially decreases the risk of future cardiovascular events.
The included trials compared different levels of added sugar or compared with a placebo on cardio‐metabolic outcomes. The results showed a higher mean value on blood pressure and total cholesterol and triglycerides for the individuals having high‐added sugar intake compared with individuals who had a low‐added sugar intake, but the effect was relatively small and the clinical relevance limited. Heterogeneity between the trials was a potential concern and was explored in subgroup and sensitivity analyses. No differences were observed in these analyses, apart from the subgroup analysis on weight change that resulted in a difference between the two groups for diastolic blood pressure, but with considerable heterogeneity. A concern in both the subgroup and sensitivity analyses was the small number of studies in certain groups, meaning that the results should be interpreted cautiously.
Quality of the evidence
As no trials were identified that focused on our primary outcomes, these could not be assessed in terms of quality of the evidence. For all reported outcomes in this review, the certainty of evidence was graded as low. Uncertain risk of bias for many trials and domains and indirectness of trials motivated the choice to downgrade.
The main concerns regarding risk of bias were blinding of participants (performance bias). Lack of blinding of the participants might affect the performance of the individuals. However, since none of the included outcomes in the review was based on self‐administered data, a lack of blinding will likely not be as a significant issue. The study authors generally justified the lack of blinding by stating that blinding was impossible due to the nature of the intervention. Nonetheless, it is not possible to ascertain the impact on the results by not blinding the participants.
There was a lack of information provided from many studies regarding allocation concealment (selection bias) and selective reporting (reporting bias), and hence the majority of trials were rated as unclear in these domains. Allocation concealment was adequately reported in four trials. The seven trials that were registered on clinicaltrials.gov (or equivalent) were rated at a low risk of bias. The remainder of the trials did not report any prespecified study protocol, and it was therefore not possible to judge the risk of bias in this domain for those trials. Five studies were rated as at an overall low risk of bias, as these were rated as low risk in at least four domains (Geidl‐Flueck 2021; Madero 2015; Markey 2016; Njike 2011; Vazquez‐Duran 2016).
In addition to the risk of bias assessment, indirectness was also considered a concern when assessing the quality of the evidence. No trials reported on our primary outcomes, hence, the results of this review depended solely upon surrogate outcomes, causing indirectness. Another concern was that the trials might not be comparable due to varying interventions, populations and/or duration. Attempts were made to investigate this further in the subgroup analyses, and no major differences between subgroups were disclosed. Lastly, many studies stated industry involvement with potential vested interests. However, in a subgroup analysis comparing industry involvement with no involvement, no significant subgroup differences were noted.
Potential biases in the review process
In addition to the comprehensive search across databases which was conducted, we also went through the reference list of relevant trials to ensure that no trials were missed. We attempted to contact study authors when necessary. In order to evaluate publication bias, we created a funnel plot of the outcome with the highest number of trials (total cholesterol). The plot indicated no presence of publication bias by visual inspection.
Four cross‐over studies (Reiser 1981; Reiser 1989; Hallfrisch 1983; Gostner 2005) matched our inclusion criteria but failed to mention any wash‐out period and were therefore excluded after unsuccessful attempts to contact the study authors. A summary of the results of these four studies now follows. In 1981, Reiser and colleagues studied 24 hyperinsulinaemic individuals and found a positive association between a high sucrose intake and total cholesterol, triglycerides and LDL‐cholesterol. A high sugar intake was associated with lower HDL‐cholesterol. Hallfrisch and colleagues compared different levels of fructose intake among 12 hyperinsulinaemic men and 12 men with normal insulin response. Total cholesterol and LDL‐cholesterol increased with fructose intake, in both groups, and triglycerides increased for the hyperinsulinaemic men only. In the Reiser trial (1989), ten hyperinsulinaemic and 11 non‐hyperinsulinaemic men consumed either fructose or high‐amylose cornstarch following a cross‐over design. Fructose intake was associated with an increase in total cholesterol, VLDL‐cholesterol and triglycerides among the hyperinsulinaemics, when compared to cornstarch, and similar results were reported for the non‐hyperinsulinaemics. In the Gostner trial, nineteen volunteers received 30 g of isomalt or 30 g of sucrose daily as part of a controlled diet during two four‐week study periods. No effect on blood lipids or other measured outcomes was seen.
Comprehensive lifestyle interventions were excluded from the present review, in order to avoid potential confounding. This meant that trials aiming to change, for instance, diet and physical activity were not included, since it would be difficult to disentangle the effects of sugar intake from the effects of physical activity. However, this led to fewer studies being included in the review, since a multifactorial approach is fairly common in RCTs on the current topic. It was also challenging to assess the appropriateness of older studies, as these were not as comprehensive as current ones. For this reason, some studies were excluded, or only reported narratively and excluded from the meta‐analysis. Other confounders that might have affected the results, that were not accounted for in this review, included family history of coronary artery disease, smoking and the presence of regular exercise (outside the scope of the intervention).
The shortest study duration that was included was four weeks, in order to include as many studies as possible. The majority of the studies were relatively short‐term; only six had a duration of six months or longer. Substantial effects of an altered added sugar intake might not appear during a shorter trial, potentially contributing to lack of evidence in this review.
Agreements and disagreements with other studies or reviews
There is currently no evidence from RCTs on the effect of added sugar intake and cardiovascular disease, as is shown in the present systematic review, and the existing research on the topic is observational in nature (Tasevska 2014; Xi 2015).
A previous systematic review of RCTs found an association between high sugar intake and increased total cholesterol, triglycerides and LDL‐cholesterol (Te Morenga 2014). The results of the present systematic review are in line with the conclusions presented by Te Morenga and colleagues regarding triglycerides and total cholesterol, but no association between high‐added sugar intake and LDL‐cholesterol was found in this review. The results also deviated for blood pressure, as we found an association between added sugar intake and diastolic blood pressure, and Te Morenga and colleagues did not. However, the evidence in the present review is uncertain and the effect was small and, therefore, the clinical relevance is uncertain. In contrast to the present review, the review by Te Morenga and colleagues included diabetics. Te Morenga used the wider definition of free sugar and not added sugar, and the endpoint for the Te Morenga review was 2013, whereas for this review the endpoint was 2020. Nonetheless, our review is in broad agreement with the results presented by Te Morenga and colleagues as both concluded that sugar intake impacts upon blood lipids and blood pressure levels.
Another systematic review of RCTs was not able to establish an association between sugar intake and cardiovascular risk factors, when comparing free sugars with complex carbohydrates (Fattore 2017). Heterogeneity, as well as publication bias, were major concerns in the review conducted by Fattore and colleagues and the variability between the interventions made it difficult to draw conclusions. The present review, although not faced with the challenges associated with heterogeneity, struggled with indirectness that resulted in the overall quality of the evidence being rated as low.
Authors' conclusions
Implications for practice.
Currently, there is no evidence regarding the effect of added sugar consumption on CV events and all‐cause mortality. This review provides low‐quality evidence that a low intake of added sugar intake reduces total cholesterol, triglycerides and blood pressure levels, potentially decreasing the risk of future CV events. The observed effect was small and the clinical relevance is unclear. Potential bias related to confounding factors, such as regular exercise, was not taken into consideration in this review and, given the limited data, the results should be interpreted carefully.
Implications for research.
Since we were unable to detect trials conducted on the primary outcomes, more RCTs on CV events and all‐cause mortality are needed. This requires trials with a longer follow‐up, as most of the included trials in the present review were relatively short‐term. There is also a need for well‐conducted RCTs where the published papers are written in sufficient detail enabling a complete risk of bias assessment. Finally, more trials conducted without the involvement of sugar organisations or companies with potential vested interests are needed.
History
Protocol first published: Issue 4, 2019
Acknowledgements
We wish to thank the Cochrane Heart Groups editorial team for their assistance and support throughout this process. The background and methods section of this review was based on a standard template provided by Cochrane Heart.
We also thank Robin Featherstone (Cochrane Editorial and Methods Department) and Anne Littlewood (Cochrane Oral Health, Manchester, UK) for providing support with the CENTRAL search.
We would also like to thank Carola Tilgmann, IT strategist at Lund University, who helped develop an initial version of a search strategy which was further developed by the Cochrane Heart Group.
We would like to acknowledge and thank the following people for their help in assessing the search results for this review via Cochrane’s Screen4Me workflow. The names are: Hina Vaish, Susanna Wisniewski, Benedict Davies, Katarina Paunovic, Gabriella Cooper, Danial Sayyad, Rosalind Chiam, Ned Chalmers, Kit Byatt, Louise Murphy, Lyle Croyle, Karen Ma, Igor Svintsitskyi, Brian Duncan, Nicole Askin, Stefanie Rosumeck, Azeem Ahmad, Ala Elhelali, Sadie Miller, Aghnia Jolanda Putri, Priscilla Smith, Yuan Chi, Julie Cattini, Jessica Antretter, Brian Li, Alexander Lingley, Thidar Aung, Sydney Roshan Rebello Rebello, Capt (Dr) Nikhil Sisodiya, Nikolaos Sideris, Emmet Farragher, Susanna Wisniewski, Deborah Jackson, Riccardo Guarise, Saeed Husseini Barghazan, Victoria Exley, Hebatullah Abdulazeem, Adeola Ajayi, Urmilla Bala, Nuno Fernandes, Stella Maria O'Brien, Farah Siddiqui, Shammas Mohammed, Andrea Egger‐Rainer.
We also wish to thank the peer reviewers who have contributed to this review: Prof Peter Clifton, University of South Australia, and Sabeeh Kamil (consumer reviewer).
Appendices
Appendix 1. Search strategies
CENTRAL
#1 sugar*:ti,ab
#2 (monosaccharide* or disaccharide* or glucose or galactose or fructose or dextrose or sucrose or lactose or maltose or "corn syrup" or honey):ti,ab
#3 (sweetener* or sweetening or (maize next syrup*) or ("glucose fructose" next syrup*) or isoglucose):ti,ab
#4 ((soft or fizzy or carbonated) NEAR/3 drink*):ti,ab
#5 {or #1‐#4}
#6 (cardio* or cardia* or heart* or coronary* or angina* or ventric* or myocard* or pericard* or ischem* or ischaem* or emboli* or arrhythmi* or thrombo* or "atrial fibrillat*" or tachycardi* or endocardi* or "sick sinus"):ti,ab
#7 (stroke or strokes or cerebrovasc* or "cerebral vascular" or apoplexy or (brain next accident*) or (brain next infarct*) or (cerebral next infarct*) or (lacunar next infarct*)):ti,ab
#8 (hypertensi* or (peripheral next arter* next disease) or "high blood pressure" or (increas* next "blood pressure") or "elevated blood pressure"):ti,ab
#9 (hyperlipid* or hyperlipemia* or hyperlipaemia* or hypercholesterol* or hypercholesteremia* or hypercholesteraemia* or hyperlipoproteinemia* or hyperlipoproteinaemia* or hypertriglyceridemia* or hypertriglyceridaemia*):ti,ab
#10 (diet* NEAR/2 cholesterol*):ti,ab
#11 (HDL* NEAR/3 cholesterol*):ti,ab
#12 ("high density" NEAR/2 cholesterol*):ti,ab
#13 "alpha lipoprotein cholesterol":ti,ab
#14 (LDL NEAR/2 cholester*):ti,ab
#15 ("low density" NEAR/2 cholesterol*):ti,ab
#16 "beta lipoprotein cholesterol":ti,ab
#17 ("coronary risk" next factor*):ti,ab
#18 "blood pressure":ti,ab
#19 (triglyceride* or triacylglycerol*):ti,ab
#20 (lipoprote* or "fasting blood sugar" or "fasting plasma glucose"):ti,ab
#21 {or #6‐#20}
#22 (diet* or consum* or eat* or food* or nutri* or intake):ti,ab
#23 #5 and #21 and #22
MEDLINE Ovid
1. exp Dietary Sugars/
2. sugar*.tw.
3. exp Monosaccharides/
4. exp Disaccharides/
5. monosaccharide*.tw.
6. disaccharide*.tw.
7. glucose.tw.
8. galactose.tw.
9. fructose.tw.
10. dextrose.tw.
11. sucrose.tw.
12. lactose.tw.
13. maltose.tw.
14. corn syrup.tw.
15. honey.tw.
16. exp Sweetening Agents/
17. sweetener*.tw.
18. sweetening.tw.
19. maize syrup*.tw.
20. glucose‐fructose syrup*.tw.
21. isoglucose.tw.
22. Carbonated Beverages/
23. ((soft or fizzy or carbonated) adj3 drink*).tw.
24. or/1‐23
25. exp Cardiovascular Diseases/
26. cardio*.tw.
27. cardia*.tw.
28. heart*.tw.
29. coronary*.tw.
30. angina*.tw.
31. ventric*.tw.
32. myocard*.tw.
33. pericard*.tw.
34. isch?em*.tw.
35. emboli*.tw.
36. arrhythmi*.tw.
37. thrombo*.tw.
38. atrial fibrillat*.tw.
39. tachycardi*.tw.
40. endocardi*.tw.
41. (sick adj sinus).tw.
42. exp Stroke/
43. (stroke or strokes).tw.
44. cerebrovasc*.tw.
45. cerebral vascular.tw.
46. apoplexy.tw.
47. (brain adj2 accident*).tw.
48. ((brain* or cerebral or lacunar) adj2 infarct*).tw.
49. exp Hypertension/
50. hypertensi*.tw.
51. peripheral arter* disease*.tw.
52. ((high or increased or elevated) adj2 blood pressure).tw.
53. exp Hyperlipidemias/
54. hyperlipid*.tw.
55. hyperlip?emia*.tw.
56. hypercholesterol*.tw.
57. hypercholester?emia*.tw.
58. hyperlipoprotein?emia*.tw.
59. hypertriglycerid?emia*.tw.
60. exp Arteriosclerosis/
61. Cholesterol, Dietary/
62. (diet* adj2 cholesterol*).tw.
63. Cholesterol, HDL/
64. (HDL* adj3 cholesterol*).tw.
65. (high density adj2 cholesterol*).tw.
66. alpha lipoprotein cholesterol.tw.
67. Cholesterol, LDL/
68. (LDL adj2 cholester*).tw.
69. (low density adj2 cholesterol*).tw.
70. beta lipoprotein cholesterol.tw.
71. "coronary risk factor* ".tw.
72. Blood Pressure/
73. blood pressure.tw.
74. exp Triglycerides/
75. triglyceride*.tw.
76. triacylglycerol*.tw.
77. exp Lipoproteins/
78. lipoprote*.tw.
79. "fasting blood sugar".tw.
80. "fasting plasma glucose".tw.
81. or/25‐80
82. diet/
83. diet*.tw.
84. consum*.tw.
85. eat*.tw.
86. food*.tw.
87. nutri*.tw.
88. intake.tw.
89. or/82‐88
90. 24 and 81 and 89
91. randomized controlled trial.pt.
92. controlled clinical trial.pt.
93. randomized.ab.
94. placebo.ab.
95. clinical trials as topic.sh.
96. randomly.ab.
97. trial.ti.
98. 91 or 92 or 93 or 94 or 95 or 96 or 97
99. exp animals/ not humans.sh.
100. 98 not 99
101. 90 and 100
Embase Ovid
1. sugar intake/
2. sugar*.tw.
3. exp monosaccharide/
4. *disaccharide/
5. monosaccharide*.tw.
6. disaccharide*.tw.
7. glucose.tw.
8. galactose.tw.
9. fructose.tw.
10. dextrose.tw.
11. sucrose.tw.
12. lactose.tw.
13. maltose.tw.
14. corn syrup.tw.
15. honey.tw.
16. *sweetening agent/
17. sweetener*.tw.
18. sweetening.tw.
19. maize syrup*.tw.
20. glucose‐fructose syrup*.tw.
21. isoglucose.tw.
22. carbonated beverage/
23. ((soft or fizzy or carbonated) adj3 drink*).tw.
24. or/1‐23
25. exp cardiovascular disease/
26. cardio*.tw.
27. cardia*.tw.
28. heart*.tw.
29. coronary*.tw.
30. angina*.tw.
31. ventric*.tw.
32. myocard*.tw.
33. pericard*.tw.
34. isch?em*.tw.
35. emboli*.tw.
36. arrhythmi*.tw.
37. thrombo*.tw.
38. atrial fibrillat*.tw.
39. tachycardi*.tw.
40. endocardi*.tw.
41. (sick adj sinus).tw.
42. exp cerebrovascular accident/
43. (stroke or strokes).tw.
44. cerebrovasc*.tw.
45. cerebral vascular.tw.
46. apoplexy.tw.
47. (brain adj2 accident*).tw.
48. ((brain* or cerebral or lacunar) adj2 infarct*).tw.
49. exp hypertension/
50. hypertensi*.tw.
51. peripheral arter* disease*.tw.
52. ((high or increased or elevated) adj2 blood pressure).tw.
53. exp hyperlipidemia/
54. hyperlipid*.tw.
55. hyperlip?emia*.tw.
56. hypercholesterol*.tw.
57. hypercholester?emia*.tw.
58. hyperlipoprotein?emia*.tw.
59. hypertriglycerid?emia*.tw.
60. exp arteriosclerosis/
61. cholesterol intake/
62. (diet* adj2 cholesterol*).tw.
63. high density lipoprotein cholesterol/
64. (HDL* adj3 cholesterol*).tw.
65. (high density adj2 cholesterol*).tw.
66. alpha lipoprotein cholesterol.tw.
67. low density lipoprotein cholesterol/
68. (LDL adj2 cholester*).tw.
69. (low density adj2 cholesterol*).tw.
70. beta lipoprotein cholesterol.tw.
71. "coronary risk factor* ".tw.
72. blood pressure/
73. blood pressure.tw.
74. exp triacylglycerol/
75. triglyceride*.tw.
76. triacylglycerol*.tw.
77. exp lipoprotein/
78. lipoprote*.tw.
79. "fasting blood sugar".tw.
80. "fasting plasma glucose".tw.
81. or/25‐80
82. diet/
83. diet*.tw.
84. consum*.tw.
85. eat*.tw.
86. food*.tw.
87. nutri*.tw.
88. intake.tw.
89. or/82‐88
90. 24 and 81 and 89
91. random$.tw.
92. factorial$.tw.
93. crossover$.tw.
94. cross over$.tw.
95. cross‐over$.tw.
96. placebo$.tw.
97. (doubl$ adj blind$).tw.
98. (singl$ adj blind$).tw.
99. assign$.tw.
100. allocat$.tw.
101. volunteer$.tw.
102. crossover procedure/
103. double blind procedure/
104. randomized controlled trial/
105. single blind procedure/
106. 91 or 92 or 93 or 94 or 95 or 96 or 97 or 98 or 99 or 100 or 101 or 102 or 103 or 104 or 105
107. (animal/ or nonhuman/) not human/
108. 106 not 107
109. 90 and 108
110. limit 109 to embase
CPCI‐S
#16 #15 AND #14
#15 TS=(random* or blind* or allocat* or assign* or trial* or placebo* or crossover* or cross‐over*)
#14 #13 AND #12 AND #4
#13 TS=(diet* or consum* or eat* or food* or nutri* or intake)
#12 #11 OR #10 OR #9 OR #8 OR #7 OR #6 OR #5
#11 TS=("blood pressure" or triglyceride* or triacylglycerol* or lipoprote* or "fasting blood sugar" or "fasting plasma glucose")
#10 TS=("coronary risk factor*")
#9 TS=(arterioscleros* or "diet* cholesterol*" or HDL or LDL or "high density cholesterol*" or "low density cholesterol*" or "alpha lipoprotein cholesterol" or "beta lipoprotein cholesterol")
#8 TS=(hyperlipid* or hyperlipemia* or hyperlipaemia* or hypercholesterol* or hypercholesteremia* or hypercholesteraemia* or hyperlipoproteinemia* or hyperlipoproteinaemia* or hypertriglyceridemia* or hypertriglyceridaemia*)
#7 TS=(hypertensi* or "peripheral arter* disease*" or "high blood pressure" or "increas* blood pressure" or "elevated blood pressure")
#6 TS=(stroke or strokes or cerebrovasc* or "cerebral vascular" or apoplexy or "brain accident*" or "brain infarct*" or "cerebral infarct*" or "lacunar infarct*")
#5 TS=(cardio* or cardia* or heart* or coronary* or angina* or ventric* or myocard* or pericard* or ischem* or ischaem* or emboli* or arrhythmi* or thrombo* or "atrial fibrillat*" or tachycardi* or endocardi* or "sick sinus")
#4 #3 OR #2 OR #1
#3 TS=("soft drink*" or "fizzy drink*" or "carbonated drink*" or "carbonated beverage*")
#2 TS=(sweetener* or sweetening or "maize syrup*" or "glucose‐fructose syrup*" or isoglucose)
#1 TS=(sugar* or monosaccharide* or disaccharide* or glucose or galactose or fructose or dextrose or sucrose or lactose or maltose or "corn syrup" or honey)
Clinicaltrials.gov
Advanced search
Interventional studies
Intervention: sugar
ICTRP
Recruitment: All
Intervention: sugar
Data and analyses
Comparison 1. Effects of high vs low‐added sugar consumption.
| Outcome or subgroup title | No. of studies | No. of participants | Statistical method | Effect size |
|---|---|---|---|---|
| 1.1 Systolic blood pressure (mmHg) | 14 | Mean Difference (IV, Random, 95% CI) | 1.44 [0.08, 2.80] | |
| 1.2 Diastolic blood pressure (mmHg) | 14 | Mean Difference (IV, Random, 95% CI) | 1.52 [0.67, 2.37] | |
| 1.3 Total cholesterol (mmol/L) | 16 | Mean Difference (IV, Random, 95% CI) | 0.11 [0.01, 0.21] | |
| 1.4 LDL‐cholesterol (mmol/L) | 12 | Mean Difference (IV, Random, 95% CI) | 0.01 [‐0.08, 0.10] | |
| 1.5 HDL‐cholesterol (mmol/L) | 16 | Mean Difference (IV, Random, 95% CI) | 0.01 [‐0.02, 0.04] | |
| 1.6 Triglycerides (mmol/L) | 14 | Mean Difference (IV, Random, 95% CI) | 0.10 [0.03, 0.17] | |
| 1.7 Fasting plasma glucose (mmol/L) | 14 | Mean Difference (IV, Random, 95% CI) | 0.06 [‐0.01, 0.13] |
Comparison 2. Subgroup analysis ‐ Isocaloric intake or ad libitum.
| Outcome or subgroup title | No. of studies | No. of participants | Statistical method | Effect size |
|---|---|---|---|---|
| 2.1 Systolic blood pressure (mmHg) | 14 | Mean Difference (IV, Random, 95% CI) | 1.44 [0.08, 2.80] | |
| 2.1.1 Isocaloric exchange | 9 | Mean Difference (IV, Random, 95% CI) | 0.10 [‐0.51, 0.71] | |
| 2.1.2 Ad libitum | 5 | Mean Difference (IV, Random, 95% CI) | 2.48 [‐0.27, 5.23] | |
| 2.2 Diastolic blood pressure (mmHg) | 14 | Mean Difference (IV, Random, 95% CI) | 1.52 [0.67, 2.37] | |
| 2.2.1 Isocaloric exchange | 9 | Mean Difference (IV, Random, 95% CI) | 2.15 [1.69, 2.60] | |
| 2.2.2 Ad libitum | 5 | Mean Difference (IV, Random, 95% CI) | 0.81 [‐1.64, 3.27] | |
| 2.3 Total cholesterol (mmol/L) | 16 | Mean Difference (IV, Random, 95% CI) | 0.11 [0.01, 0.21] | |
| 2.3.1 Isocaloric exchange | 11 | Mean Difference (IV, Random, 95% CI) | 0.14 [‐0.00, 0.28] | |
| 2.3.2 Ad libitum | 5 | Mean Difference (IV, Random, 95% CI) | 0.10 [‐0.11, 0.31] | |
| 2.4 LDL‐cholesterol (mmol/L) | 12 | Mean Difference (IV, Random, 95% CI) | 0.01 [‐0.08, 0.10] | |
| 2.4.1 Isocaloric exchange | 10 | Mean Difference (IV, Random, 95% CI) | 0.06 [‐0.05, 0.18] | |
| 2.4.2 Ad libitum | 2 | Mean Difference (IV, Random, 95% CI) | ‐0.06 [‐0.13, 0.01] | |
| 2.5 HDL‐cholesterol (mmol/L) | 16 | Mean Difference (IV, Random, 95% CI) | 0.01 [‐0.02, 0.04] | |
| 2.5.1 Isocaloric exchange | 10 | Mean Difference (IV, Random, 95% CI) | 0.03 [‐0.01, 0.06] | |
| 2.5.2 Ad libitum | 6 | Mean Difference (IV, Random, 95% CI) | ‐0.03 [‐0.09, 0.04] | |
| 2.6 Triglycerides (mmol/L) | 14 | Mean Difference (IV, Random, 95% CI) | 0.10 [0.03, 0.17] | |
| 2.6.1 Isocaloric exchange | 9 | Mean Difference (IV, Random, 95% CI) | 0.08 [‐0.01, 0.17] | |
| 2.6.2 Ab libitum | 5 | Mean Difference (IV, Random, 95% CI) | 0.18 [‐0.13, 0.49] | |
| 2.7 Fasting plasma glucose (mmol/L) | 14 | Mean Difference (IV, Random, 95% CI) | 0.06 [‐0.01, 0.13] | |
| 2.7.1 Isocaloric exchange | 9 | Mean Difference (IV, Random, 95% CI) | 0.06 [‐0.02, 0.15] | |
| 2.7.2 Ad libitum | 5 | Mean Difference (IV, Random, 95% CI) | 0.04 [‐0.08, 0.16] |
Comparison 3. Subgroup analysis ‐ Solid and liquid or liquid state.
| Outcome or subgroup title | No. of studies | No. of participants | Statistical method | Effect size |
|---|---|---|---|---|
| 3.1 Systolic blood pressure (mmHg) | 14 | Mean Difference (IV, Random, 95% CI) | 1.44 [0.08, 2.80] | |
| 3.1.1 Solid and liquid | 8 | Mean Difference (IV, Random, 95% CI) | 2.44 [0.01, 4.86] | |
| 3.1.2 Liquid | 6 | Mean Difference (IV, Random, 95% CI) | 0.78 [‐0.57, 2.13] | |
| 3.2 Diastolic blood pressure (mmHg) | 14 | Mean Difference (IV, Random, 95% CI) | 1.52 [0.67, 2.37] | |
| 3.2.1 Solid and liquid | 8 | Mean Difference (IV, Random, 95% CI) | 1.11 [‐0.60, 2.81] | |
| 3.2.2 Liquid | 6 | Mean Difference (IV, Random, 95% CI) | 1.54 [0.49, 2.59] | |
| 3.3 Total cholesterol (mmol/L) | 16 | Mean Difference (IV, Random, 95% CI) | 0.11 [0.01, 0.21] | |
| 3.3.1 Solid and liquid | 12 | Mean Difference (IV, Random, 95% CI) | 0.13 [‐0.03, 0.30] | |
| 3.3.2 Liquid | 4 | Mean Difference (IV, Random, 95% CI) | 0.09 [‐0.04, 0.23] | |
| 3.4 LDL‐cholesterol (mmol/L) | 12 | Mean Difference (IV, Random, 95% CI) | 0.01 [‐0.08, 0.10] | |
| 3.4.1 Solid and liquid | 8 | Mean Difference (IV, Random, 95% CI) | 0.03 [‐0.13, 0.18] | |
| 3.4.2 Liquid | 4 | Mean Difference (IV, Random, 95% CI) | 0.00 [‐0.11, 0.11] | |
| 3.5 HDL‐cholesterol (mmol/L) | 16 | Mean Difference (IV, Random, 95% CI) | 0.01 [‐0.02, 0.04] | |
| 3.5.1 Solid and liquid | 11 | Mean Difference (IV, Random, 95% CI) | 0.02 [‐0.02, 0.06] | |
| 3.5.2 Liquid | 5 | Mean Difference (IV, Random, 95% CI) | ‐0.00 [‐0.05, 0.05] | |
| 3.6 Triglycerides (mmol/L) | 14 | Mean Difference (IV, Random, 95% CI) | 0.10 [0.03, 0.17] | |
| 3.6.1 Solid and liquid | 10 | Mean Difference (IV, Random, 95% CI) | 0.11 [‐0.02, 0.25] | |
| 3.6.2 Liquid | 4 | Mean Difference (IV, Random, 95% CI) | 0.11 [0.02, 0.19] | |
| 3.7 Fasting plasma glucose (mmol/L) | 14 | Mean Difference (IV, Random, 95% CI) | 0.06 [‐0.01, 0.13] | |
| 3.7.1 Solid and liquid | 10 | Mean Difference (IV, Random, 95% CI) | 0.06 [‐0.01, 0.14] | |
| 3.7.2 Liquid | 4 | Mean Difference (IV, Random, 95% CI) | 0.06 [‐0.07, 0.20] |
Comparison 4. Subgroup analysis ‐ Difference in weight change.
| Outcome or subgroup title | No. of studies | No. of participants | Statistical method | Effect size |
|---|---|---|---|---|
| 4.1 Systolic blood pressure (mmHg) | 14 | Mean Difference (IV, Random, 95% CI) | 1.44 [0.08, 2.80] | |
| 4.1.1 Weight change | 7 | Mean Difference (IV, Random, 95% CI) | 3.44 [0.28, 6.60] | |
| 4.1.2 No weight change | 8 | Mean Difference (IV, Random, 95% CI) | 0.76 [‐0.97, 2.49] | |
| 4.2 Diastolic blood pressure (mmHg) | 14 | Mean Difference (IV, Random, 95% CI) | 1.52 [0.67, 2.37] | |
| 4.2.1 Weight change | 7 | Mean Difference (IV, Random, 95% CI) | 2.29 [1.82, 2.76] | |
| 4.2.2 No weight change | 8 | Mean Difference (IV, Random, 95% CI) | 0.37 [‐0.92, 1.66] | |
| 4.3 Total cholesterol (mmol/L) | 16 | Mean Difference (IV, Random, 95% CI) | 0.11 [0.01, 0.21] | |
| 4.3.1 Weight change | 8 | Mean Difference (IV, Random, 95% CI) | 0.12 [‐0.07, 0.32] | |
| 4.3.2 No weight change | 9 | Mean Difference (IV, Random, 95% CI) | 0.11 [‐0.02, 0.24] | |
| 4.4 LDL‐cholesterol (mmol/L) | 12 | Mean Difference (IV, Random, 95% CI) | 0.01 [‐0.08, 0.10] | |
| 4.4.1 Weight change | 5 | Mean Difference (IV, Random, 95% CI) | 0.02 [‐0.22, 0.25] | |
| 4.4.2 No weight change | 8 | Mean Difference (IV, Random, 95% CI) | ‐0.00 [‐0.09, 0.08] | |
| 4.5 HDL‐cholesterol (mmol/L) | 16 | Mean Difference (IV, Random, 95% CI) | 0.01 [‐0.02, 0.04] | |
| 4.5.1 Weight change | 7 | Mean Difference (IV, Random, 95% CI) | 0.02 [‐0.04, 0.08] | |
| 4.5.2 No weight change | 10 | Mean Difference (IV, Random, 95% CI) | 0.00 [‐0.04, 0.05] | |
| 4.6 Triglycerides (mmol/L) | 14 | Mean Difference (IV, Random, 95% CI) | 0.10 [0.03, 0.17] | |
| 4.6.1 Weight change | 6 | Mean Difference (IV, Random, 95% CI) | 0.17 [‐0.05, 0.39] | |
| 4.6.2 No weight change | 9 | Mean Difference (IV, Random, 95% CI) | 0.09 [0.01, 0.16] | |
| 4.7 Fasting plasma glucose (mmol/L) | 14 | Mean Difference (IV, Random, 95% CI) | 0.06 [‐0.01, 0.13] | |
| 4.7.1 Weight change | 7 | Mean Difference (IV, Random, 95% CI) | 0.02 [‐0.07, 0.12] | |
| 4.7.2 No weight change | 8 | Mean Difference (IV, Random, 95% CI) | 0.07 [‐0.02, 0.17] |
Comparison 5. Subgroup analysis ‐ Healthy or high risk population.
| Outcome or subgroup title | No. of studies | No. of participants | Statistical method | Effect size |
|---|---|---|---|---|
| 5.1 Systolic blood pressure (mmHg) | 14 | Mean Difference (IV, Random, 95% CI) | 1.44 [0.08, 2.80] | |
| 5.1.1 Healthy | 8 | Mean Difference (IV, Random, 95% CI) | 1.40 [‐0.30, 3.10] | |
| 5.1.2 High risk | 6 | Mean Difference (IV, Random, 95% CI) | 2.29 [‐0.87, 5.45] | |
| 5.2 Diastolic blood pressure (mmHg) | 14 | Mean Difference (IV, Random, 95% CI) | 1.52 [0.67, 2.37] | |
| 5.2.1 Healthy | 8 | Mean Difference (IV, Random, 95% CI) | 1.29 [0.07, 2.51] | |
| 5.2.2 High risk | 6 | Mean Difference (IV, Random, 95% CI) | 0.92 [‐1.47, 3.31] | |
| 5.3 Total cholesterol (mmol/L) | 16 | Mean Difference (IV, Random, 95% CI) | 0.11 [0.01, 0.21] | |
| 5.3.1 Healthy | 6 | Mean Difference (IV, Random, 95% CI) | 0.07 [‐0.06, 0.21] | |
| 5.3.2 High risk | 10 | Mean Difference (IV, Random, 95% CI) | 0.16 [‐0.01, 0.33] | |
| 5.4 LDL‐cholesterol (mmol/L) | 12 | Mean Difference (IV, Random, 95% CI) | 0.01 [‐0.08, 0.10] | |
| 5.4.1 Healthy | 6 | Mean Difference (IV, Random, 95% CI) | 0.00 [‐0.09, 0.10] | |
| 5.4.2 High risk | 6 | Mean Difference (IV, Random, 95% CI) | 0.01 [‐0.19, 0.21] | |
| 5.5 HDL‐cholesterol (mmol/L) | 16 | Mean Difference (IV, Random, 95% CI) | 0.01 [‐0.02, 0.04] | |
| 5.5.1 Healthy | 7 | Mean Difference (IV, Random, 95% CI) | ‐0.01 [‐0.06, 0.03] | |
| 5.5.2 High risk | 9 | Mean Difference (IV, Random, 95% CI) | 0.04 [‐0.01, 0.09] | |
| 5.6 Triglycerides (mmol/L) | 14 | Mean Difference (IV, Random, 95% CI) | 0.10 [0.03, 0.17] | |
| 5.6.1 Healthy | 6 | Mean Difference (IV, Random, 95% CI) | 0.15 [0.02, 0.27] | |
| 5.6.2 High risk | 8 | Mean Difference (IV, Random, 95% CI) | 0.06 [‐0.07, 0.20] | |
| 5.7 Fasting plasma glucose (mmol/L) | 14 | Mean Difference (IV, Random, 95% CI) | 0.06 [‐0.01, 0.13] | |
| 5.7.1 Healthy | 6 | Mean Difference (IV, Random, 95% CI) | 0.01 [‐0.07, 0.10] | |
| 5.7.2 High risk | 8 | Mean Difference (IV, Random, 95% CI) | 0.12 [0.02, 0.21] |
Comparison 6. Subgroup analysis ‐ Intervention <6 months or ≥6 months.
| Outcome or subgroup title | No. of studies | No. of participants | Statistical method | Effect size |
|---|---|---|---|---|
| 6.1 Systolic blood pressure (mmHg) | 14 | Mean Difference (IV, Random, 95% CI) | 1.44 [0.08, 2.80] | |
| 6.1.1 ≥ 6 months | 3 | Mean Difference (IV, Random, 95% CI) | 0.52 [‐1.08, 2.12] | |
| 6.1.2 < 6 months | 11 | Mean Difference (IV, Random, 95% CI) | 2.10 [0.38, 3.82] | |
| 6.2 Diastolic blood pressure (mmHg) | 14 | Mean Difference (IV, Random, 95% CI) | 1.52 [0.67, 2.37] | |
| 6.2.1 ≥ 6 months | 2 | Mean Difference (IV, Random, 95% CI) | 2.27 [1.79, 2.75] | |
| 6.2.2 < 6 months | 12 | Mean Difference (IV, Random, 95% CI) | 0.84 [‐0.33, 2.01] | |
| 6.3 Total cholesterol (mmol/L) | 16 | Mean Difference (IV, Random, 95% CI) | 0.11 [0.01, 0.21] | |
| 6.3.1 ≥ 6 months | 2 | Mean Difference (IV, Random, 95% CI) | 0.52 [0.07, 0.96] | |
| 6.3.2 6 months | 14 | Mean Difference (IV, Random, 95% CI) | 0.09 [‐0.02, 0.19] | |
| 6.4 LDL‐cholesterol (mmol/L) | 12 | Mean Difference (IV, Random, 95% CI) | 0.01 [‐0.08, 0.10] | |
| 6.4.1 ≥ 6 months | 1 | Mean Difference (IV, Random, 95% CI) | ‐0.17 [‐0.44, 0.10] | |
| 6.4.2 < 6 months | 11 | Mean Difference (IV, Random, 95% CI) | 0.03 [‐0.07, 0.12] | |
| 6.5 HDL‐cholesterol (mmol/L) | 16 | Mean Difference (IV, Random, 95% CI) | 0.01 [‐0.02, 0.04] | |
| 6.5.1 ≥ 6 months | 3 | Mean Difference (IV, Random, 95% CI) | ‐0.04 [‐0.14, 0.07] | |
| 6.5.2 < 6 months | 13 | Mean Difference (IV, Random, 95% CI) | 0.02 [‐0.02, 0.05] | |
| 6.6 Triglycerides (mmol/L) | 14 | Mean Difference (IV, Random, 95% CI) | 0.10 [0.03, 0.17] | |
| 6.6.1 ≥ 6 months | 2 | Mean Difference (IV, Random, 95% CI) | ‐0.05 [‐0.70, 0.60] | |
| 6.6.2 < 6 months | 12 | Mean Difference (IV, Random, 95% CI) | 0.11 [0.03, 0.19] | |
| 6.7 Fasting plasma glucose (mmol/L) | 14 | Mean Difference (IV, Random, 95% CI) | 0.06 [‐0.01, 0.13] | |
| 6.7.1 ≥ 6 months | 2 | Mean Difference (IV, Random, 95% CI) | 0.00 [‐0.14, 0.14] | |
| 6.7.2 < 6 months | 12 | Mean Difference (IV, Random, 95% CI) | 0.07 [‐0.01, 0.14] |
Comparison 7. Subgroup analysis ‐ Industry funding.
| Outcome or subgroup title | No. of studies | No. of participants | Statistical method | Effect size |
|---|---|---|---|---|
| 7.1 Systolic blood pressure (mmHg) | 14 | Mean Difference (IV, Random, 95% CI) | 1.44 [0.08, 2.80] | |
| 7.1.1 Industry funding | 6 | Mean Difference (IV, Random, 95% CI) | 1.17 [‐2.10, 4.43] | |
| 7.1.2 No involvement | 8 | Mean Difference (IV, Random, 95% CI) | 1.35 [‐0.13, 2.82] | |
| 7.2 Diastolic blood pressure (mmHg) | 14 | Mean Difference (IV, Random, 95% CI) | 1.52 [0.67, 2.37] | |
| 7.2.1 Industry funding | 6 | Mean Difference (IV, Random, 95% CI) | 1.00 [‐1.26, 3.25] | |
| 7.2.2 No involvement | 8 | Mean Difference (IV, Random, 95% CI) | 2.14 [1.69, 2.60] | |
| 7.3 Total cholesterol (mmol/L) | 16 | Mean Difference (IV, Random, 95% CI) | 0.11 [0.01, 0.21] | |
| 7.3.1 Industry funding | 8 | Mean Difference (IV, Random, 95% CI) | 0.05 [‐0.10, 0.19] | |
| 7.3.2 No involvement | 8 | Mean Difference (IV, Random, 95% CI) | 0.17 [0.02, 0.33] | |
| 7.4 LDL‐cholesterol (mmol/L) | 12 | Mean Difference (IV, Random, 95% CI) | 0.01 [‐0.08, 0.10] | |
| 7.4.1 Industry funding | 6 | Mean Difference (IV, Random, 95% CI) | ‐0.03 [‐0.09, 0.04] | |
| 7.4.2 No involvement | 6 | Mean Difference (IV, Random, 95% CI) | 0.02 [‐0.15, 0.19] | |
| 7.5 HDL‐cholesterol (mmol/L) | 16 | Mean Difference (IV, Random, 95% CI) | 0.01 [‐0.02, 0.04] | |
| 7.5.1 Industry funding | 8 | Mean Difference (IV, Random, 95% CI) | ‐0.01 [‐0.06, 0.04] | |
| 7.5.2 No involvement | 8 | Mean Difference (IV, Random, 95% CI) | 0.03 [‐0.02, 0.07] | |
| 7.6 Triglycerides (mmol/L) | 14 | Mean Difference (IV, Random, 95% CI) | 0.10 [0.03, 0.17] | |
| 7.6.1 Industry funding | 7 | Mean Difference (IV, Random, 95% CI) | 0.12 [‐0.01, 0.26] | |
| 7.6.2 No involvement | 7 | Mean Difference (IV, Random, 95% CI) | 0.11 [‐0.01, 0.23] | |
| 7.7 Fasting plasma glucose (mmol/L) | 14 | Mean Difference (IV, Random, 95% CI) | 0.06 [‐0.01, 0.13] | |
| 7.7.1 Industry funding | 8 | Mean Difference (IV, Random, 95% CI) | 0.07 [‐0.04, 0.18] | |
| 7.7.2 No involvement | 6 | Mean Difference (IV, Random, 95% CI) | 0.05 [‐0.05, 0.14] |
Comparison 8. Sensitivity analysis ‐ Low risk of bias.
| Outcome or subgroup title | No. of studies | No. of participants | Statistical method | Effect size |
|---|---|---|---|---|
| 8.1 Systolic blood pressure (mmHg) | 5 | Mean Difference (IV, Random, 95% CI) | ‐0.07 [‐0.69, 0.56] | |
| 8.2 Diastolic blood pressure (mmHg) | 5 | Mean Difference (IV, Random, 95% CI) | 0.19 [‐1.93, 2.31] | |
| 8.3 Total cholesterol (mmol/L) | 3 | Mean Difference (IV, Random, 95% CI) | 0.11 [‐0.13, 0.36] | |
| 8.4 LDL‐cholesterol (mmol/L) | 2 | Mean Difference (IV, Random, 95% CI) | ‐0.04 [‐0.11, 0.03] | |
| 8.5 HDL‐cholesterol (mmol/L) | 2 | Mean Difference (IV, Random, 95% CI) | 0.01 [‐0.07, 0.09] | |
| 8.6 Triglycerides (mmol/L) | 3 | Mean Difference (IV, Random, 95% CI) | 0.07 [‐0.01, 0.16] | |
| 8.7 Fasting plasma glucose (mmol/L) | 2 | Mean Difference (IV, Random, 95% CI) | ‐0.06 [‐0.19, 0.08] |
Comparison 9. Sensitivity analysis ‐ Cross‐overs excluded.
| Outcome or subgroup title | No. of studies | No. of participants | Statistical method | Effect size |
|---|---|---|---|---|
| 9.1 Systolic blood pressure (mmHg) | 9 | Mean Difference (IV, Random, 95% CI) | 1.77 [0.05, 3.50] | |
| 9.2 Diastolic blood pressure (mmHg) | 9 | Mean Difference (IV, Random, 95% CI) | 1.98 [1.23, 2.72] | |
| 9.3 Total cholesterol (mmol/L) | 10 | Mean Difference (IV, Random, 95% CI) | 0.13 [‐0.02, 0.27] | |
| 9.4 LDL‐cholesterol (mmol/L) | 5 | Mean Difference (IV, Random, 95% CI) | 0.02 [‐0.18, 0.22] | |
| 9.5 HDL‐cholesterol (mmol/L) | 9 | Mean Difference (IV, Random, 95% CI) | 0.01 [‐0.04, 0.06] | |
| 9.6 Triglycerides (mmol/L) | 9 | Mean Difference (IV, Random, 95% CI) | 0.14 [0.01, 0.28] | |
| 9.7 Fasting plasma glucose (mmol/L) | 7 | Mean Difference (IV, Random, 95% CI) | 0.11 [0.00, 0.21] |
Characteristics of studies
Characteristics of included studies [ordered by study ID]
Ahmad 2020.
| Study characteristics | ||
| Methods |
Study design: Randomised controlled trial Study grouping: Cross‐over Duration of study: Two periods of 12 weeks each Wash‐out period: 4 weeks |
|
| Participants |
Baseline Characteristics
Included criteria: Male sex; increased cardio‐metabolic risk Excluded criteria: Not reported Pretreatment: Not reported |
|
| Interventions |
Intervention Characteristics High‐added sugar intake
Low‐added sugar intake
|
|
| Outcomes | Secondary outcomes: systolic blood pressure, diastolic blood pressure, triglycerides, total cholesterol, HDL‐cholesterol, LDL‐cholesterol, fasting plasma glucose | |
| Identification |
Sponsorship source: Funded by BBSRC Country: UK Setting: Not specified Authors name: Aryati Ahmad Institution: Faculty of Health Sciences, Univeriti Sultan Zainal Abidin; Faculty of Health and Medical Sciences, University of Surrey Email: aryatiahmad@unisza.edu.my Address: Universiti Sultan Zainal Abidin, Gong Badak Campus, Kuala Nerus 21300, Malaysia |
|
| Notes | ||
| Risk of bias | ||
| Bias | Authors' judgement | Support for judgement |
| Random sequence generation (selection bias) | Unclear risk | Randomised, but no further details provided |
| Allocation concealment (selection bias) | Unclear risk | No details provided |
| Blinding of participants and personnel (performance bias) All outcomes | Unclear risk | No details provided |
| Blinding of outcome assessment (detection bias) All outcomes | Unclear risk | No details provided |
| Incomplete outcome data (attrition bias) All outcomes | Unclear risk | No details provided |
| Selective reporting (reporting bias) | Unclear risk | All stated outcomes were included in the analyses but no prespecified analysis plan provided |
| Other bias | Low risk | Participants were instructed to finish food portion sheets daily; monitored every two weeks |
Black 2006.
| Study characteristics | ||
| Methods |
Study design: Randomised controlled trial Study grouping: Cross‐over Duration of study: Two periods of 6 weeks each Wash‐out period: 4 weeks |
|
| Participants |
Baseline Characteristics
Included criteria: Male sex Excluded criteria: BMI > 35; cardiac, hepatic or renal disease; a history of diabetes; blood pressure >140/80 mmHg; hyperlipidaemia (LDL > 3.0 mmol/L and triglycerides > 2.0 mmol/L) Pretreatment: not reported |
|
| Interventions |
Intervention Characteristics High‐added sugar intake
Low‐added sugar intake
|
|
| Outcomes | Secondary outcomes: total cholesterol, LDL‐cholesterol, HDL‐cholesterol, fasting plasma glucose | |
| Identification |
Sponsorship source: Unrestricted research grant from The Sugar Bureau and Suikerstichting, the Netherlands Country: UK Setting: Not specified Authors name: R. Neil, A. Black Institution: Regional Centre for Endocrinology and Diabetes, Royal Victoria Hospital, Belfast Email: steven.hunter@royalhospitals.nhs.n‐i.uk Address: Dr. Steven J. Hunter, Regional Centre for Endocrinology and Diabetes, Royal Victoria Hospital, Grosvenor Road, Belfast, U.K., BT12 6BA |
|
| Notes | ||
| Risk of bias | ||
| Bias | Authors' judgement | Support for judgement |
| Random sequence generation (selection bias) | Low risk | Judgement Comment: Subjects were randomised in blocks of four using a random‐number generator to ensure that equal numbers of volunteers received high or low‐sucrose diets during the first phase. |
| Allocation concealment (selection bias) | Unclear risk | Judgement Comment: No information provided |
| Blinding of participants and personnel (performance bias) All outcomes | Unclear risk | Judgement Comment: Participants were not aware of the assigned intervention. Unclear if carers/people delivering were aware |
| Blinding of outcome assessment (detection bias) All outcomes | Unclear risk | Judgement Comment: No information provided |
| Incomplete outcome data (attrition bias) All outcomes | Low risk | Judgement Comment: One person left for reasons unrelated to the study. Otherwise complete follow‐up |
| Selective reporting (reporting bias) | Unclear risk | Judgement Comment: All stated outcomes are included in the analyses but no prespecified analysis plan provided |
| Other bias | Low risk | Daily visits by study personnel to ensure dietary compliance |
Campos 2015.
| Study characteristics | ||
| Methods |
Study design: Randomised controlled trial Study grouping: Parallel‐group Duration of study: 4 weeks run‐in period + 12 weeks |
|
| Participants |
Baseline Characteristics High‐added sugar intake
Low‐added sugar intake
Overall
Included criteria: Male and female; BMI greater than 25 kg/m2; daily consumption of two or more 22‐oz SSBs Excluded criteria: Not reported Pretreatment: Two groups (IHCL < 60 & > 60) which were significantly different at baseline |
|
| Interventions |
Intervention Characteristics High‐added sugar intake
Low‐added sugar intake
|
|
| Outcomes | Secondary outcomes: Systolic blood pressure, diastolic blood pressure, total cholesterol, HDL‐cholesterol, triglycerides, fasting plasma glucose | |
| Identification |
Sponsorship source: The Swiss National Foundation for Science the Fondation Raymond Berger pourla recherché sur le diabéte et les maladies métaboliques, Lausanne, Switzerland Country: Switzerland Setting: Not reported Authors name: Vanessa Campos Institution: Department of Physiology, Faculty of Biology and Medicine, University of Lausanne, Lausanne Email: luc.tappy@unil.ch Address: Not reported |
|
| Notes | ||
| Risk of bias | ||
| Bias | Authors' judgement | Support for judgement |
| Random sequence generation (selection bias) | Unclear risk | Judgement Comment: The study stated that randomisation was stratified by sex, but the method was not described in more detail. |
| Allocation concealment (selection bias) | Unclear risk | Judgement Comment: No information provided |
| Blinding of participants and personnel (performance bias) All outcomes | Unclear risk | Judgement Comment: No information provided |
| Blinding of outcome assessment (detection bias) All outcomes | Unclear risk | Judgement Comment: No information provided |
| Incomplete outcome data (attrition bias) All outcomes | Unclear risk | Judgement Comment: Individuals lost to follow‐up in ASB group only, no reasons for attrition given |
| Selective reporting (reporting bias) | Low risk | Judgement Comment: Study protocol registered on clinicaltrials.gov. No identified major deviations between protocol and published article |
| Other bias | Low risk | Participants returned packages in order to ensure dietary compliance. |
Ebbeling 2020.
| Study characteristics | ||
| Methods |
Study design: Randomised controlled trial Study grouping: Parallel‐group Duration of study: 12 months |
|
| Participants |
Baseline Characteristics High‐added sugar intake
Low‐added sugar intake
Overall
Included criteria: Adults aged 18‐40 years, consumed at least 1 serving (12 fl oz) per day of SSB and had a BMI between 18.5 to 40.0 Excluded criteria: Fasting blood glucose ≥ 110 mg/dL, physician diagnosis of a major medical or psychiatric illness, chronic use of any medication that could affect ≥ 1 study outcomes, and heavy smoking (> 10 cigarettes/d). Additional exclusion criteria for females included: pregnancy (preceding 12 months) or plans to become pregnant during the study period, lactation (preceding 3 months), and change in hormonal contraceptives (preceding 3 months). Pretreatment: Not reported |
|
| Interventions |
Intervention Characteristics High‐added sugar intake
Low‐added sugar intake
|
|
| Outcomes | Secondary outcomes: Systolic blood pressure, diastolic blood pressure, LDL‐cholesterol, HDL‐cholesterol, fasting plasma glucose | |
| Identification |
Sponsorship source: Grants from National Heart, Lung and Blood Institute; National Institute for Diabetes and Kidney Diseases; the National Center for Research Resources; the Harvard Catalyst Clinical and Translational Science Center; the New Balance Foundation Country: USA Setting: Boston's Children Hospital Authors name: Cara B. Ebbeling Institution: New Balance Foundation Obesity Prevention Center Email: cara.ebbeling@childrens.harvard.edu Address: 300 Longwood Avenue, BCH 3179, Boston, MA 02115 |
|
| Notes | The trial consisted of three arms. The SSB and USB arms were used for this review; the ASB arm was not included. | |
| Risk of bias | ||
| Bias | Authors' judgement | Support for judgement |
| Random sequence generation (selection bias) | Unclear risk | Judgement Comment: No details provided |
| Allocation concealment (selection bias) | Unclear risk | Judgement Comment: No details provided |
| Blinding of participants and personnel (performance bias) All outcomes | High risk | Judgement Comment: Study participants were not blinded. |
| Blinding of outcome assessment (detection bias) All outcomes | Low risk | Judgement Comment: Personnel who assessed study outcomes were masked to group assignment. |
| Incomplete outcome data (attrition bias) All outcomes | Low risk | Judgement Comment: Reasons for dropouts were included and analyses were conducted on dropouts that determined no significant differences from completers of the study. |
| Selective reporting (reporting bias) | Unclear risk | Judgement Comment: According to the original proposal, insulin secretion was specified as an effect modifier; however, because of scheduling challenges and the need to streamline study visits, insulin secretion was not measured. |
| Other bias | Low risk | Study personnel made phone calls every two weeks and sent out intervention messages to ensure dietary compliance. |
Geidl‐Flueck 2021.
| Study characteristics | ||
| Methods |
Study design: Randomised controlled trial Study grouping: Parallel‐group Duration of study: 7 weeks |
|
| Participants |
Baseline Characteristics High‐added sugar intake
Low‐added sugar intake
Overall
Included criteria: Male sex; age 18‐30 years; BMI < 24 Excluded criteria: High SSB consumption (exceeding CHO 60 g/day); more than 3 hours of physical activity per week |
|
| Interventions |
Intervention Characteristics High‐added sugar intake
Low‐added sugar intake
|
|
| Outcomes | Secondary outcomes: systolic blood pressure, diastolic blood pressure | |
| Identification |
Sponsorship source: funded by the Swiss National Science Foundation (No. 144204), Switzerland, Vontobel Foundation, Switzerland, Rhyner Bangerter Foundation, Switzerland, Promedica Foundation, Lichtenstein, Uniscientia Foundation, Lichtenstein, Prof. Otto Beisheim Foundation, Switzerland, Jubiläuumsstiftung Swiss Life, Switzerland, Philhuman Foundation, Lichtenstein and the Austrian Federal Ministry of Education (No. BMWFW‐10.420/0005‐WF/V/3c/2017), Austria Country: Switzerland Setting: Not reported Authors name: Bettina Geidl‐Flueck Institution: Department of Endocrinology, Diabetology and Clinical Nutrition, University Hospital Zurich (USZ) and University of Zurich (UZH), Switzerland Email: Bettina.geidl@usz.ch Address: University Hospital Zurich, Raemistrasse 100, 8091 Zurich, Switzerland |
|
| Notes | The trial consisted of four arms. The control and sucrose arms were used for this review; the glucose and fructose arms were not included. | |
| Risk of bias | ||
| Bias | Authors' judgement | Support for judgement |
| Random sequence generation (selection bias) | Low risk | Individuals randomised using simple random allocation |
| Allocation concealment (selection bias) | Low risk | The randomisation method used indicated allocation concealment. |
| Blinding of participants and personnel (performance bias) All outcomes | Low risk | Double‐blinded, SSB provided in coded containers |
| Blinding of outcome assessment (detection bias) All outcomes | Unclear risk | No details provided |
| Incomplete outcome data (attrition bias) All outcomes | Unclear risk | Similar dropout rates across the groups. Reasons for attrition not provided for all participants, therefore, unable to fully judge |
| Selective reporting (reporting bias) | Low risk | Study protocol registered on clinicaltrials.gov. No identified major deviations between protocol and published article |
| Other bias | Low risk | Participants had to return empty SSB containers and not consumed SSBs and keep SSB records. |
Johnson 2015.
| Study characteristics | ||
| Methods |
Study design: Randomised controlled trial Study grouping: Parallel‐group Duration of study: 8 weeks |
|
| Participants |
Baseline Characteristics High‐added sugar intake
Low‐added sugar intake
Overall
Included criteria: Women; 18‐40 years old; morbidly obese (BMI > 40); diagnosed with polycystic ovarian syndrome (PCOS) Excluded criteria: Not reported Pretreatment: There were no significant differences in baseline characteristics in the two groups except for FSH and LH‐levels and hirsutism. The withdrawal rate did not differ significantly between groups (23% vs 10%, P = 0.301). |
|
| Interventions |
Intervention Characteristics High‐added sugar intake
Low‐added sugar intake
|
|
| Outcomes | Secondary outcomes: systolic blood pressure, diastolic blood pressure, total cholesterol, LDL‐cholesterol, HDL‐cholesterol, triglycerides, fasting plasma glucose | |
| Identification |
Sponsorship source: One author was supported by a research fellowship grant from the Norwegian National Advisory Unit on Women’s Health, Oslo University Hospital Rikshospitalet. Country: Norway Setting: Not stated Authors name: Line K Johnson Institution: Morbid Obesity Centre Email: line.kristin.johnson@siv.no Address: Vestfold Hospital Trust, PO Box 2168, 3103 Tønsberg |
|
| Notes | ||
| Risk of bias | ||
| Bias | Authors' judgement | Support for judgement |
| Random sequence generation (selection bias) | Low risk | Judgement Comment: Randomised in blocks. Sealed pre‐numbered containers were opened by the research secretary. |
| Allocation concealment (selection bias) | Low risk | Judgement Comment: Group allocation was revealed to participant and staff member (registered dietitian or study nurse) after all baseline examinations and measures were completed. |
| Blinding of participants and personnel (performance bias) All outcomes | High risk | Judgement Comment: Participants and personnel were not blinded. |
| Blinding of outcome assessment (detection bias) All outcomes | Unclear risk | Judgement Comment: No information provided |
| Incomplete outcome data (attrition bias) All outcomes | Unclear risk | Judgement Comment: No significant difference in withdrawal rate (P = 0.3). Four participants switched group in the first two weeks of the trial, but were still assessed according to their original group. No reasons for attrition provided |
| Selective reporting (reporting bias) | Low risk | Judgement Comment: The study protocol was published at clinicaltrials.gov and identifier included in the published article. No major deviations from the study protocol could be identified. |
| Other bias | Low risk | Study personnel made phone calls every week to ensure dietary compliance. |
Lewis 2013.
| Study characteristics | ||
| Methods |
Study design: Randomised controlled trial Study grouping: Cross‐over Duration of study: Two periods of 6 weeks Wash‐out period: 4 weeks |
|
| Participants |
Baseline Characteristics
Included criteria: Over 18 years of age; BMI 25‐35 Excluded criteria: Significant cardiac, renal or hepatic disease; a diagnosis of diabetes; pregnancy and breastfeeding Pretreatment: Not reported |
|
| Interventions |
Intervention Characteristics High‐added sugar intake
Low‐added sugar intake
|
|
| Outcomes | Secondary outcomes: systolic blood pressure, diastolic blood pressure, total cholesterol, LDL‐cholesterol, HDL‐cholesterol, fasting plasma glucose | |
| Identification |
Sponsorship source: Sugar Nutrition UK Country: UK Setting: Not stated Authors name: Anthony S. Lewis Institution: Regional Centre for Endocrinology and Diabetes Email: aslewis2000@yahoo.co.uk Address: Royal Victoria Hospital, Grosvenor Road, Belfast, BT12 6BA, Northern Ireland |
|
| Notes | ||
| Risk of bias | ||
| Bias | Authors' judgement | Support for judgement |
| Random sequence generation (selection bias) | Low risk | Judgement Comment: Subjects were randomised in blocks of four using a random number generator to ensure equal numbers of subjects received high and low‐sucrose in the first dietary period. |
| Allocation concealment (selection bias) | Unclear risk | Judgement Comment: No information provided |
| Blinding of participants and personnel (performance bias) All outcomes | Unclear risk | Judgement Comment: No information provided |
| Blinding of outcome assessment (detection bias) All outcomes | Unclear risk | Judgement Comment: No information provided |
| Incomplete outcome data (attrition bias) All outcomes | Unclear risk | Judgement Comment: Reasons for attrition were provided, but we were unable to fully judge. |
| Selective reporting (reporting bias) | Unclear risk | Judgement Comment: All stated outcomes were included in the analyses but no prespecified analysis plan provided |
| Other bias | Low risk | Study personnel made phone calls every 2‐3 days to ensure dietary compliance. |
Lowndes 2014a.
| Study characteristics | ||
| Methods |
Study design: Randomised controlled trial Study grouping: Parallel‐group Duration of study: 10 weeks |
|
| Participants |
Baseline Characteristics High‐added sugar intake (HFCS)
Low‐added sugar intake (HFCS)
High‐added sugar intake (sucrose)
Low‐added sugar intake (sucrose)
Overall
Included criteria: Men and women; aged 20–60 years; BMI 23–35 kg/m2 Excluded criteria: Currently enrolled in a commercial weight‐loss programme or taking weight‐loss medication or supplements; experienced a change in weight of greater than 3% of current body weight in the past 30 days; were currently using tobacco products or had utilised such products within the past year; had uncontrolled hypertension (≥ 140/90 mmHg); were diagnosed with type 1 or type 2 diabetes; had thyroid disease and either not taking medication or the dosage changed within the past six months; a history of surgical procedure for weight loss; major surgery within three months of enrolment; a history of heart problems (e.g., bypass surgery, myocardial infarction, etc.) within three months of enrolment; orthopaedic limitations that would interfere with regular physical activity; if they had a history of gastrointestinal disorders or diagnosed eating disorders, a history or the presence of cancer or congestive heart failure; women who were pregnant, lactating or trying to become pregnant; taking any prescription medication for less than three months; any individual consuming ≥ 14 alcoholic drinks per week; a known allergy to SUC or HFCS; participation in another clinical trial within 30 days prior to enrolment; lactose intolerance or any other significant food allergy Pretreatment: Not reported |
|
| Interventions |
Intervention Characteristics High‐added sugar intake (HFCS)
Low‐added sugar intake (HFCS)
High‐added sugar intake (sucrose)
Low‐added sugar intake (sucrose)
|
|
| Outcomes | Secondary outcomes: Systolic blood pressure, diastolic blood pressure, total cholesterol, HDL‐cholesterol, LDL‐cholesterol, triglycerides, fasting plasma glucose | |
| Identification |
Sponsorship source: Unrestricted grant funding, unclear source Country: USA Setting: Not stated Authors name: Joshua Lowndes Institution: Rippe Lifestyle Institute Email: jlowndes@rippelifestyle.com Address: 215 Celebration Place, Suite 300, Celebration, FL 34747, USA |
|
| Notes | The trials consisted of six arms. The 8% sucrose, 8% HFCS, 30% sucrose and 30% HFCS were included in the review; the 18% HFCS and 18% sucrose arms were not included. | |
| Risk of bias | ||
| Bias | Authors' judgement | Support for judgement |
| Random sequence generation (selection bias) | Unclear risk | Judgement Comment: Randomisation process not described |
| Allocation concealment (selection bias) | Unclear risk | Judgement Comment: No details provided. |
| Blinding of participants and personnel (performance bias) All outcomes | Low risk | Judgement Comment: Participants were blinded. Personnel were aware of the percentage of sugar but not if the participant received fructose or sucrose. |
| Blinding of outcome assessment (detection bias) All outcomes | Unclear risk | Judgement Comment: No information provided |
| Incomplete outcome data (attrition bias) All outcomes | Low risk | Judgement Comment: Similar dropout rate across all groups. All participants who completed the intervention were analysed. Reasons for attrition provided |
| Selective reporting (reporting bias) | Unclear risk | Judgement Comment: All outcomes reported but no prespecified analysis plan |
| Other bias | Low risk | Participants handed in self‐reported checklists every week. |
Lowndes 2014b.
| Study characteristics | ||
| Methods |
Study design: Randomised controlled trial Study grouping: Parallel‐group Duration of study: 10 weeks |
|
| Participants |
Baseline Characteristics High‐added sugar intake (sucrose)
Low‐added sugar intake (sucrose)
High‐added sugar intake (HFCS)
Low‐added sugar intake (HFCS)
Overall
Included criteria: Overweight/obese subjects between the ages of 25 and 60 years of age with Body Mass Index (BMI) 27.0–35.0 kg/m2. Excluded criteria: Current enrolment in any commercial weight‐loss programme, prescription medicines or supplements for weight loss, or a greater than five pound change in weight during the past three months. Individuals with a history of orthopaedic limitations that would interfere with the ability to meet prescribed exercise, a history of heart problems, major surgery within the last three months, clinically diagnosed eating disorders or any gastrointestinal disorder, dietary restrictions or allergies to any component of the diet or which would limit the ability to adhere to dietary requirements of the study were all excluded. Users of tobacco products or individuals consuming more than 14 alcoholic beverages per week were also excluded. Pretreatment: Not reported |
|
| Interventions |
Intervention Characteristics High‐added sugar intake (sucrose)
Low‐added sugar intake (sucrose)
High‐added sugar intake (HFCS)
Low‐added sugar intake (HFCS)
|
|
| Outcomes | Secondary outcomes: systolic blood pressure, diastolic blood pressure, total cholesterol, LDL‐cholesterol, HDL‐cholesterol, triglycerides | |
| Identification |
Sponsorship source: Unrestricted grant funding, unclear source. Country: USA Setting: Not reported Authors name: Joshua Lowndes Institution: Rippe Lifestyle Institute Email: jrippe@rippelifestyle.com Address: 215 Celebration Place, Suite 300, Celebration, FL 34747, USA |
|
| Notes | ||
| Risk of bias | ||
| Bias | Authors' judgement | Support for judgement |
| Random sequence generation (selection bias) | Unclear risk | Judgement Comment: No details reported |
| Allocation concealment (selection bias) | Unclear risk | Judgement Comment: No details reported |
| Blinding of participants and personnel (performance bias) All outcomes | Low risk | Judgement Comment: Participants and personnel were blinded to the type of sugar. Participants were also blinded to the amount of sugar they consumed. |
| Blinding of outcome assessment (detection bias) All outcomes | Unclear risk | No information provided |
| Incomplete outcome data (attrition bias) All outcomes | Unclear risk | Judgement Comment: Reasons for attrition were given but no information on number of dropouts in each group |
| Selective reporting (reporting bias) | Unclear risk | Judgement Comment: All outcomes reported but no prespecified analysis plan |
| Other bias | Low risk | Participants handed in self‐reported checklists every week. |
Madero 2015.
| Study characteristics | ||
| Methods |
Study design: Randomised controlled trial Study grouping: Parallel‐group Duration of study: 4 weeks (study consisted of two phases: diet and diet + allopurinol. Here, only the first phase was included). |
|
| Participants |
Baseline Characteristics High‐added sugar intake
Low‐added sugar intake
Overall
Included criteria: 18 years or older; overweight (BMI > 25 kg/m2) or obese (BMI > 30 kg/m2); systolic blood pressure > 120 to 140 mmHg and diastolic 80 to 90 mmHg; with a history of high‐fructose consumption from sources of added sugar (excluding fruits) of > 70 g/d Excluded criteria: History of diabetes, chronic kidney disease, liver disease or abnormal liver function tests, haematologic abnormalities, malignancy, taking any medications, or pregnant. Patients were eliminated from the study if during the study period they required any medications, if the BP during the study period became greater than 160/100 mmHg, fasting blood glucose greater than 200 mg/dL, low‐density lipoprotein cholesterol greater than 190 mg/dL, triglycerides greater than 500 mg/dL, serum uric acid levels less than 2 mg/dL or greater than 12 mg/dL, became pregnant, had severe disease in the study period (infectious, neoplastic, cardiovascular, and neurologic), or required hospitalisation for medical or surgical causes. In addition, patients were eliminated from the study if they had adverse clinical or biochemically derived from the study medication (allergic reaction, decreased cell blood count, or elevated liver function tests). Pretreatment: Not reported |
|
| Interventions |
Intervention Characteristics High‐added sugar intake
Low‐added sugar intake
|
|
| Outcomes | Secondary outcomes: systolic blood pressure, diastolic blood pressure, total cholesterol, triglycerides | |
| Identification |
Sponsorship source: Country: Mexico Setting: Instituto Nacional de Cardiología Ignacio Chávez Authors name: Magdalena Madero Institution: Division of Nephrology and Renal Pathophysiology, National Heart Institute of Mexico, Mexico City Email: madero.magdalena@gmail.com Address: Juan Badiano no 1, Col Seccion XVI, Delegacion Tlalpan, Mexico City 14080, Mexico |
|
| Notes | ||
| Risk of bias | ||
| Bias | Authors' judgement | Support for judgement |
| Random sequence generation (selection bias) | Low risk | Judgement Comment: Randomised by using a random number table |
| Allocation concealment (selection bias) | Unclear risk | Judgement Comment: No information provided |
| Blinding of participants and personnel (performance bias) All outcomes | Unclear risk | Judgement Comment: No information provided |
| Blinding of outcome assessment (detection bias) All outcomes | Low risk | Judgement Comment: "To evaluate consistency of measurement, randomized measures were done blinded by a person external to the trial." |
| Incomplete outcome data (attrition bias) All outcomes | Low risk | Judgement Comment: More dropouts in the control group, with reasons for attrition provided. However, more individuals in the control group at baseline, so similar number of individuals analysed in both groups |
| Selective reporting (reporting bias) | Low risk | Judgement Comment: Study protocol published on clinicaltrials.gov; even though the study design had been modified, the stated outcomes remained unchanged. |
| Other bias | Low risk | Participants were instructed to record their food and beverage intake at least once a week in a food diary. |
Maersk 2012.
| Study characteristics | ||
| Methods |
Study design: Randomised controlled trial Study grouping: Parallel‐group Duration of study: 6 months |
|
| Participants |
Baseline Characteristics High‐added sugar intake
Low‐added sugar intake
Overall
Included criteria: BMI 26‐40; aged 20‐50; blood pressure < 160/100 mmHg Excluded criteria: Diabetes Pretreatment: There was an unequal distribution of sex (i.e. more men in the regular cola group) and a tendency for differences in visceral adipose tissue, skeletal muscle fat, and liver fat (P < 0.1) between the groups. |
|
| Interventions |
Intervention Characteristics High‐added sugar intake
Low‐added sugar intake
|
|
| Outcomes | Secondary outcomes: total cholesterol, HDL‐cholesterol, triglycerides, fasting plasma glucose, adverse events: impaired dental health | |
| Identification |
Sponsorship source: Supported by grants from The Danish Council for Strategic Research, The Food Study Group/Danish Ministry of Food, Agriculture and Fisheries, Novo Nordic Foundation, and Clinical Institute at Aarhus University, Denmark. The semi‐skim milk was donated by the Danish Dairy Company, Arla Foods, but without any influence on the design, interpretation, or conclusions of the study. Country: Denmark Setting: Aarhus University Hospital and Department of Nutrition, Copenhagen University Authors name: Maria Maersk Institution: Department of Endocrinology and Internal Medicine Email: bjoern.richelsen@aarhus.rm.dk Address: Aarhus University Hospital, Tage Hansensgade 2, DK‐8000 Aarhus, Denmark |
|
| Notes | The trial consisted of four arms. The sucrose‐sweetened regular cola and water arms were used for this review; the milk and aspartame‐sweetened diet cola arms were not included. | |
| Risk of bias | ||
| Bias | Authors' judgement | Support for judgement |
| Random sequence generation (selection bias) | Unclear risk | No information provided |
| Allocation concealment (selection bias) | Unclear risk | Judgement Comment: No information provided |
| Blinding of participants and personnel (performance bias) All outcomes | High risk | Judgement Comment: Unblinded |
| Blinding of outcome assessment (detection bias) All outcomes | Unclear risk | Judgement Comment: No information provided |
| Incomplete outcome data (attrition bias) All outcomes | High risk | Judgement Comment: 9/32 = 28.1% dropout rate, similar proportion in both groups. Unclear reasons for dropout |
| Selective reporting (reporting bias) | Unclear risk | Judgement Comment: All stated outcomes were included in the analyses but no prespecified analysis plan provided |
| Other bias | Low risk | Participants were asked to bring empty bottles or cartons to the research centre for counting every 3–4 weeks to ensure dietary compliance. They also filled out a 7‐day dietary record at baseline, 3 months and at follow‐up. |
Maki 2015.
| Study characteristics | ||
| Methods |
Study design: Randomised controlled trial Study grouping: Cross‐over Duration of study: 2 periods of 6 weeks each Wash‐out period: 2 weeks |
|
| Participants |
Baseline Characteristics
Included criteria: Men and women; 18–74 years old; with BMI < 45.0 kg/m2; waist circumference of > 83.8 cm (33.0 inches) for women and > 91.4 cm (36.0 inches) for men; self‐reported use of high‐sugar beverages; high risk of the development of T2DM; willing to maintain a stable body weight; maintain their habitual diet; limit non‐study‐related dairy product intake Excluded criteria: Uncontrolled hypertension (systolic blood pressure ≥160 mmHg or diastolic blood pressure ≥100 mmHg); abnormal laboratory test results of clinical importance (at the discretion of the investigator), including TGs ≥400 mg/dL, fasting creatinine ≥1.5 mg/dL, and fasting blood glucose ≥126 mg/dL; a history or presence of clinically important cardiac (including coronary artery disease), renal, hepatic, endocrine (including type 1 diabetes mellitus or T2DM), pulmonary, biliary, gastrointestinal, pancreatic, or neurologic disorders; a recent history or presence of cancer, except non‐melanoma skin cancer; weight loss or gain of > 4.5 kg in the month before screening or extreme dietary habits (e.g. very‐low carbohydrate diet); and a history within the last 12 mo or strong potential for alcohol abuse (> 14 servings/wk) or substance abuse; Individuals who reported habitual consumption of > 4 servings/d of dairy foods and beverages; use of medications or supplements known to alter carbohydrate or lipid metabolism; using weight‐loss drugs or programmes within 4 wks before the screening visit; antibiotics used within 4 wks before the screening visit Pretreatment: Not reported |
|
| Interventions |
Intervention Characteristics High‐added sugar intake
Low‐added sugar intake
|
|
| Outcomes | Secondary outcomes: total cholesterol, LDL‐cholesterol, HDL‐cholesterol, triglycerides, fasting plasma glucose | |
| Identification |
Sponsorship source: Dairy Research Institute/National Dairy Council (Rosemont, IL) Country: USA Setting: Not stated Comments: Authors name: Kevin C Maki Institution: Biofortis Clinical Research, Addison, IL and Midwest Center for Metabolic and Cardiovascular Research, Glen Ellyn, IL Email: kmaki@mc‐mcr.com Address: Not reported |
|
| Notes | ||
| Risk of bias | ||
| Bias | Authors' judgement | Support for judgement |
| Random sequence generation (selection bias) | Low risk | Judgement Comment: A randomisation list was created with the use of SAS with the seed number recorded. |
| Allocation concealment (selection bias) | Low risk | Judgement Comment: A series of envelopes were created, with each envelope showing the subject's treatment sequence (dairy products then SSPs or SSPs then dairy products) and opened by the study co‐ordinator at the time of random assignment. |
| Blinding of participants and personnel (performance bias) All outcomes | High risk | Judgement Comment: Participants and personnel not blinded |
| Blinding of outcome assessment (detection bias) All outcomes | Unclear risk | Judgement Comment: No information provided |
| Incomplete outcome data (attrition bias) All outcomes | High risk | Judgement Comment: Unequal number of individuals lost to follow‐up depending on randomisation sequence (8 vs. 2) and only nonspecific reasons for attrition provided |
| Selective reporting (reporting bias) | Unclear risk | Judgement Comment: All outcomes reported but no prespecified analysis plan |
| Other bias | Low risk | Dietary compliance was based on returned food items. |
Mann 1972.
| Study characteristics | ||
| Methods |
Study design: Randomised controlled trial Study grouping: Parallel‐group Duration of study: 22 weeks |
|
| Participants |
Baseline Characteristics High‐added sugar intake
Low‐added sugar intake
Overall
Included criteria: Male, healthy office workers 35‐53 years old Excluded criteria: Not reported Pretreatment: Not reported |
|
| Interventions |
Intervention Characteristics High‐added sugar intake
Low‐added sugar intake
|
|
| Outcomes | Secondary outcomes: triglycerides | |
| Identification |
Sponsorship source: The South African Sugar Association Country: South Africa Setting: Insurance company Authors name: J. I. MANN Institution: Department of Medicine, University of Cape Town Email: Not reported Address: Not reported |
|
| Notes | The trial consisted of three arms. The low‐sugar and usual‐diet arms were used for this review; the reduced starch arm was not included. | |
| Risk of bias | ||
| Bias | Authors' judgement | Support for judgement |
| Random sequence generation (selection bias) | Unclear risk | Judgement Comment: No information provided |
| Allocation concealment (selection bias) | Unclear risk | Judgement Comment: No information provided |
| Blinding of participants and personnel (performance bias) All outcomes | High risk | Judgement Comment: Participants unblinded |
| Blinding of outcome assessment (detection bias) All outcomes | Unclear risk | Judgement Comment: No information provided |
| Incomplete outcome data (attrition bias) All outcomes | Unclear risk | Judgement Comment: Only one dropout during study, but no further details provided to allow us to make a full assessment |
| Selective reporting (reporting bias) | Unclear risk | Judgement Comment: All stated outcomes were included in the analyses but no prespecified analysis plan provided |
| Other bias | Low risk | Participants were asked to fill out 3‐day diet records twice during the experimental period. |
Markey 2016.
| Study characteristics | ||
| Methods |
Study design: Randomised controlled trial Study grouping: Cross‐over Duration of study: Two periods of 8 weeks each Wash‐out period: 4 weeks |
|
| Participants |
Baseline Characteristics
Included criteria: Men and women aged 20–49 years who were not underweight or obese (BMI between 18.5 and 30 kg/m2). Excluded criteria: Clinical diagnosis of diabetes, CVD, anti‐inflammatory or hypertensive medication, smoking, excessive alcohol consumption (> 21 units per week for men and > 14 units per week for women), participation in regular vigorous exercise or fitness training (≥ 20 min × 3 times/week), pregnancy or lactating Pretreatment: Not reported |
|
| Interventions |
Intervention Characteristics High‐added sugar intake
Low‐added sugar intake
|
|
| Outcomes | Secondary outcomes: systolic blood pressure, diastolic blood pressure, total cholesterol, LDL‐cholesterol, HDL‐cholesterol, triglycerides, fasting plasma glucose | |
| Identification |
Sponsorship source: Sugar Nutrition UK Country: UK Setting: Reading Authors name: Oonagh Markey Institution: Hugh Sinclair Unit of Human Nutrition, Department of Food and Nutritional Sciences, University of Reading Email: j.a.lovegrove@reading.ac.uk Address: Hugh Sinclair Unit of Human Nutrition, Department of Food and Nutritional Sciences, University of Reading, Reading, Berkshire RG6 6AP, UK |
|
| Notes | ||
| Risk of bias | ||
| Bias | Authors' judgement | Support for judgement |
| Random sequence generation (selection bias) | Low risk | Judgement Comment: Stated that a computer‐based minimisation procedure was used to randomly allocate participants |
| Allocation concealment (selection bias) | Unclear risk | Judgement Comment: No information provided |
| Blinding of participants and personnel (performance bias) All outcomes | Low risk | Judgement Comment: Study products were blinded to the participants. An investigator who was not involved with assessing study outcomes relabelled products so that these looked identical. |
| Blinding of outcome assessment (detection bias) All outcomes | Unclear risk | Judgement Comment: No information provided |
| Incomplete outcome data (attrition bias) All outcomes | Low risk | Judgement Comment: Reasons for attrition given and most participants completed both interventions. |
| Selective reporting (reporting bias) | Low risk | Judgement Comment: Study protocol was published on clinicaltrials.gov and no deviations between the protocol and the published article were identified. |
| Other bias | Low risk | Participants were asked to fill out a daily dietary compliance sheet and were asked to return unopened leftover products to the Nutrition Unit. |
Njike 2011.
| Study characteristics | ||
| Methods |
Study design: Randomised controlled trial Study grouping: Cross‐over Duration of study: 3 periods of 6 weeks each Wash‐out period: 4 weeks |
|
| Participants |
Baseline Characteristics Overall
Included criteria: BMI 25‐35; waist circumference > 100 cm for men and > 80 cm for women; non‐smoker Excluded criteria: Current eating disorder; diagnosed coronary artery disease; diabetes mellitus; sleep apnoea; pregnancy; insulin or glucose sensitising medication use; restricted diet; allergy to cocoa; inability to comply with the protocol Pretreatment: Not reported |
|
| Interventions |
Intervention Characteristics High‐added sugar intake
Low‐added sugar intake
|
|
| Outcomes | Secondary outcomes: systolic blood pressure, diastolic blood pressure, total cholesterol, LDL‐cholesterol, HDL‐cholesterol, triglycerides, fasting plasma glucose | |
| Identification |
Sponsorship source: The Hershey Company Country: USA Setting: Naugatuck Valley, Connecticut Authors name: Valentine Yanchou Njike Institution: Prevention Research Center, Yale University School of Medicine, Derby, CT Email: katzdl@pol.net, shelli.larovera@yalegriffinprc.org Address: Yale‐Griffin Prevention Research Center, 130 Division Street, Derby, CT 06418, US |
|
| Notes | The trial consisted of three arms. The sugar‐free cocoa and sugar‐sweetened cocoa arms were used in the review; the placebo hot liquid arm was not included. | |
| Risk of bias | ||
| Bias | Authors' judgement | Support for judgement |
| Random sequence generation (selection bias) | Low risk | Judgement Comment: Randomised by using a computer‐generated random number sequence |
| Allocation concealment (selection bias) | Unclear risk | Judgement Comment: No information provided |
| Blinding of participants and personnel (performance bias) All outcomes | Low risk | Judgement Comment: Participants were blinded to the composition of each treatment. |
| Blinding of outcome assessment (detection bias) All outcomes | Low risk | Judgement Comment: The ultrasonographer and the data analyst were unaware of the treatment assignment. |
| Incomplete outcome data (attrition bias) All outcomes | Low risk | Judgement Comment: Relatively few individuals lost to follow‐up and reasons for attrition provided and evenly distributed between the groups |
| Selective reporting (reporting bias) | Unclear risk | Judgement Comment: All stated outcomes were included in the analyses but no prespecified analysis plan provided |
| Other bias | Low risk | Participants were asked to complete a 3‐day food diary for each of the intervention periods as well as the four‐week washout period to assess dietary patterns throughout the study period. |
Raben 2002.
| Study characteristics | ||
| Methods |
Study design: Randomised controlled trial Study grouping: Parallel‐group Duration of study: 10 weeks |
|
| Participants |
Baseline Characteristics High‐added sugar intake
Low‐added sugar intake
Overall
Included criteria: 20–50 y old; overweight [BMI of 25–30 or > 10% overweight according to weight‐and‐height tables]; healthy; not dieting; not pregnant or lactating Excluded criteria: Not stated Pretreatment: Not reported |
|
| Interventions |
Intervention Characteristics High‐added sugar intake
Low‐added sugar intake
|
|
| Outcomes | Secondary outcomes: systolic blood pressure, diastolic blood pressure, total cholesterol, HDL‐cholesterol, triglycerides, fasting plasma glucose | |
| Identification |
Sponsorship source: Supported by the Danish Research and Development Programme for Food Technology 1990–1994 and Danisco Sugar. Coca Cola (Nordic and Eurasia Divisions) provided soft drinks for the study. Country: Denmark Setting: Not stated Authors name: Anne Raben Institution: Department of Human Nutrition, Faculty of LIFE sciences, University of Copenhagen Email: ara@kvl.dk Address: Department of Human Nutrition, Faculty of LIFE sciences, University of Copenhagen, Rolighedsvej 30, 1958 Frederiksberg C, Denmark |
|
| Notes | Glucose, cholesterol and triglycerides only reported for a subset of the study population (n = 23) | |
| Risk of bias | ||
| Bias | Authors' judgement | Support for judgement |
| Random sequence generation (selection bias) | Unclear risk | Judgement Comment: Randomised, but no details provided |
| Allocation concealment (selection bias) | Unclear risk | Judgement Comment: Not specified if the allocation sequence was concealed |
| Blinding of participants and personnel (performance bias) All outcomes | Unclear risk | Judgement Comment: Participants blinded but no information provided if personnel were blinded |
| Blinding of outcome assessment (detection bias) All outcomes | Unclear risk | Judgement Comment: No information provided |
| Incomplete outcome data (attrition bias) All outcomes | Unclear risk | Judgement Comment: No information provided on loss to follow‐up and potential reasons for attrition |
| Selective reporting (reporting bias) | Unclear risk | Judgement Comment: All stated outcomes were included in the analyses but no prespecified analysis plan provided |
| Other bias | Low risk | Participants were asked to fill out 7‐day dietary records at week 0, 5, and 10. |
Sanchez‐Delgado 2021.
| Study characteristics | ||
| Methods |
Study design: Randomised controlled trial Study grouping: Parallel‐group Duration of study: 6 weeks |
|
| Participants |
Baseline Characteristics High‐added sugar intake
Low‐added sugar intake
Overall
Included criteria: age 18‐30 years; BMI 18.5‐24.9 Excluded criteria: Hypertension; hyperglycaemia; current treatment to reduce weight; current hormonal therapy |
|
| Interventions |
Intervention Characteristics High‐added sugar intake
Low‐added sugar intake
|
|
| Outcomes | Secondary outcomes: total cholesterol, triglycerides, fasting glucose | |
| Identification |
Sponsorship source: No specific grant from any funding agency, commercial or not‐for‐profit sectors Country: Mexico Setting: Not reported Authors name: Marcela Sanchez‐Delgado Institution: Laboratorio de Neuroquimica, Facultad de Medicina, Universidad Autonoma del Estado de Mexico, Mexico Email: icontreras@uaemex.mx Address: Colonia Moderna de la Cruz Toluca, Mexico |
|
| Notes | The trial consisted of three arms. The sucrose and steviol glycosides arms were used for this review; the sucralose arm was not included. | |
| Risk of bias | ||
| Bias | Authors' judgement | Support for judgement |
| Random sequence generation (selection bias) | Unclear risk | Randomised, but no further details provided. Therefore unable to fully judge |
| Allocation concealment (selection bias) | Unclear risk | No information provided |
| Blinding of participants and personnel (performance bias) All outcomes | Unclear risk | No information provided |
| Blinding of outcome assessment (detection bias) All outcomes | Unclear risk | No information provided |
| Incomplete outcome data (attrition bias) All outcomes | Low risk | Low dropout rate, 4 out of 42 individuals. Reasons for attrition provided |
| Selective reporting (reporting bias) | Unclear risk | The trial did not refer to any study protocol, therefore, unable to fully judge |
| Other bias | Low risk | Participants were required to visit the study facilities once a week and to maintain a sweetener consumption diary. |
Smith 1996.
| Study characteristics | ||
| Methods |
Study design: Randomised controlled trial Study grouping: Parallel‐group Duration of study: 9 months |
|
| Participants |
Baseline Characteristics High‐added sugar intake
Low‐added sugar intake
Overall
Included criteria: General good health; a fasting plasma triglyceride level > 2.0 mmol/L; total cholesterol level < 6.5 mmol/L; no other metabolic derangement; a willingness to take part in a long‐term dietary study Excluded criteria: Not provided Pretreatment: Not reported |
|
| Interventions |
Intervention Characteristics High‐added sugar intake
Low‐added sugar intake
|
|
| Outcomes | Secondary outcomes: total cholesterol, HDL‐cholesterol, triglycerides | |
| Identification |
Sponsorship source: Country: New Zealand Setting: Dunedin Authors name: JB Smith Institution: Department of Human Nutrition, University of Otago, Dunedin, New Zealand Email: Not provided Address: Not provided |
|
| Notes | The included results were deciphered by visually inspecting plots since no numbers were included in the study results. | |
| Risk of bias | ||
| Bias | Authors' judgement | Support for judgement |
| Random sequence generation (selection bias) | Low risk | Judgement Comment: The participants were randomly allocated to study and control groups using a system of random numbers designed to allocate twice as many subjects to the intervention group as were allocated to the control group. |
| Allocation concealment (selection bias) | Unclear risk | Judgement Comment: No information provided |
| Blinding of participants and personnel (performance bias) All outcomes | High risk | Judgement Comment: Participants unblinded |
| Blinding of outcome assessment (detection bias) All outcomes | Unclear risk | Judgement Comment: No information provided |
| Incomplete outcome data (attrition bias) All outcomes | High risk | Judgement Comment: 15/37 = 40.5% dropout rate. Proportion between groups not described, however compliance was worse in the intervention group. Reasons for attrition not provided in sufficient detail |
| Selective reporting (reporting bias) | Unclear risk | Judgement Comment: All outcomes reported but no prespecified analysis plan |
| Other bias | Low risk | Dietary compliance was assessed by interviews each month. |
Surwit 1997.
| Study characteristics | ||
| Methods |
Study design: Randomised controlled trial Study grouping: Parallel‐group Duration of study: 6 weeks |
|
| Participants |
Baseline Characteristics High‐added sugar intake
Low‐added sugar intake
Overall
Included criteria: Women 130‐200% of their ideal body weights Excluded criteria: Used any drug that affected the autonomic nervous system or metabolism (including nicotine) or any psychotropic agent; if they had a history of significant cardiopulmonary, neurologic, gastrointestinal, or endocrinologic illness; or if they participated in a regular exercise programme Pretreatment: Not reported |
|
| Interventions |
Intervention Characteristics High‐added sugar intake
Low‐added sugar intake
|
|
| Outcomes | Secondary outcomes: systolic blood pressure, diastolic blood pressure, total cholesterol, LDL‐cholesterol, HDL‐cholesterol, triglycerides, fasting plasma glucose | |
| Identification |
Sponsorship source: The National Institute Of Mental Health, The Sugar Association and the Kellogg Company Country: USA Setting: Not reported Authors name: Richard S Surwit Institution: From the Department of Psychiatry and Behavioral Sciences, the Department of Medicine, and the Sarah W Stedman Nutrition Center, Duke University Medical Center, Durham Email: surwi001@mc.duke.edu Address: Department of Psychiatry and Behavioral Sciences, Box 3842, Duke University Medical Center, Durham, NC 27710 |
|
| Notes | ||
| Risk of bias | ||
| Bias | Authors' judgement | Support for judgement |
| Random sequence generation (selection bias) | Unclear risk | Judgement Comment: No details reported |
| Allocation concealment (selection bias) | Unclear risk | Judgement Comment: No details reported |
| Blinding of participants and personnel (performance bias) All outcomes | Unclear risk | Judgement Comment: No details reported |
| Blinding of outcome assessment (detection bias) All outcomes | Unclear risk | Judgement Comment: No details reported |
| Incomplete outcome data (attrition bias) All outcomes | Unclear risk | Judgement Comment: Number and reasons for dropouts were provided, but higher proportion in high‐sucrose group |
| Selective reporting (reporting bias) | Unclear risk | Judgement Comment: All outcomes reported but unable to fully judge |
| Other bias | Low risk | Participants were asked to fill out a one‐page daily diary to document deviation from the study diets, hunger, health problems, or concerns. A staff monitor was present daily during dinner to review the diary, record blood pressure, answer questions, and give support. |
Umpleby 2017.
| Study characteristics | ||
| Methods |
Study design: Randomised controlled trial Study grouping: Cross‐over Duration of study: 2 periods of 12 weeks each Wash‐out period: 4 weeks |
|
| Participants |
Baseline Characteristics NAFLD:
Controls:
Included criteria: Men (aged 40–65 years, BMI 25–30) at increased cardio‐metabolic risk Excluded criteria: Diabetes; any medical condition other than NAFLD; lipid‐lowering medication; unstable weight in the preceding 3 months; intake of alcohol exceeding 20 g/day Pretreatment: Not reported |
|
| Interventions |
Intervention Characteristics High‐added sugar intake
Low‐added sugar intake
|
|
| Outcomes | Secondary outcomes: total cholesterol, LDL‐cholesterol, HDL‐cholesterol, triglycerides, fasting plasma glucose | |
| Identification |
Sponsorship source: UK government grant from the Biological Biotechnology Scientific Research Council [Grant no. BB/G009899/1]; University of Surrey PhD scholarship (to A.M.); Medical Research Council (body composition measurements); and infrastructure support from the National Institute of Health Research at the Cambridge Biomedical Research Centre. Country: UK Setting: Not stated Authors name: A. Margot Umpleby Institution: Faculty of Health and Medical Sciences, University of Surrey, Guildford, U.K Email: b.griffin@surrey.ac.uk Address: Not reported |
|
| Notes | Since NAFLD is a medical condition we did not feel that it was appropriate to combine the groups. Therefore, the results were presented separately for the controls and NAFLD individuals. | |
| Risk of bias | ||
| Bias | Authors' judgement | Support for judgement |
| Random sequence generation (selection bias) | Low risk | Judgement Comment: Participants randomised using a computer‐generated sequence of treatments in sealed envelopes |
| Allocation concealment (selection bias) | Low risk | Judgement Comment: Computer‐generated sequence of treatments in sealed envelopes |
| Blinding of participants and personnel (performance bias) All outcomes | High risk | Judgement Comment: Participants unblinded |
| Blinding of outcome assessment (detection bias) All outcomes | Unclear risk | Judgement Comment: No information provided |
| Incomplete outcome data (attrition bias) All outcomes | High risk | Judgement Comment: Only information on how many participants completed the study. Number of people lost to follow‐up (if any) or reasons for attrition were not included. |
| Selective reporting (reporting bias) | Low risk | Judgement Comment: Trial registered on clinicaltrials.gov, and the outcomes included in the protocol were reported in the published article. |
| Other bias | Low risk | Self‐recorded dietary intakes were monitored by regular visits to the homes of participants to ensure dietary compliance. |
Vazquez‐Duran 2016.
| Study characteristics | ||
| Methods |
Study design: Randomised controlled trial Study grouping: Parallel‐group Duration of study: 6 months |
|
| Participants |
Baseline Characteristics High‐added sugar intake
Low‐added sugar intake
Overall
Included criteria: Nursing students; male and female; > 18 years old; consumed < 12 ounces of sweetened beverages/day Excluded criteria: Maintaining a special diet; arterial hypertension diagnosed with or without use of antihypertensive medications; hyperthyroidism or hypothyroidism; use of weight loss medications; diabetes mellitus; cardiovascular or psychiatric diseases or hormonal therapy; participated in vigorous physical activity for more than one hour/day. Pretreatment: Not reported |
|
| Interventions |
Intervention Characteristics High‐added sugar intake
Low‐added sugar intake
|
|
| Outcomes | Secondary outcomes: systolic blood pressure, diastolic blood pressure | |
| Identification |
Sponsorship source: Instituto Nacional de Ciencias Medicas y Nutricion Salvador Zubiran Country: Mexico Setting: Not stated Authors name: Marisela Vázquez‐Durán Institution: Department of Clinical Nutrition Email: cam7125@gmail.com Address: Department of Clinical Nutrition. Instituto Nacional de Ciencias Médicas y Nutrición. Salvador Zubirán. Vasco de Quiroga No. 15 Col. Sección XVI, Tlalpan. CP 14000 México. D.F. |
|
| Notes | The trial consisted of three arms. The without‐sugar‐sweetened beverages and caloric and non‐caloric beverages arms were included in the review; the with non‐calorie‐sweetened beverages arm was not included. | |
| Risk of bias | ||
| Bias | Authors' judgement | Support for judgement |
| Random sequence generation (selection bias) | Low risk | Judgement Comment: Participants randomly assigned using a sequential series of numbers computer‐generated to one of the three treatment groups |
| Allocation concealment (selection bias) | Low risk | Judgement Comment: One of the researchers of the present study who did not have contact with participants performed the randomisation. |
| Blinding of participants and personnel (performance bias) All outcomes | High risk | Judgement Comment: Participants and nutritionist who prescribed the diets were not blinded. |
| Blinding of outcome assessment (detection bias) All outcomes | Low risk | Judgement Comment: The individuals who performed the clinical evaluations were blinded. |
| Incomplete outcome data (attrition bias) All outcomes | Low risk | Judgement Comment: Low loss to follow‐up and similar population size across groups at the end of the study |
| Selective reporting (reporting bias) | Low risk | Judgement Comment: Prespecified analysis plan available on clinicaltrials.gov, and was not changed |
| Other bias | Low risk | Participants were asked to fill out a 24‐hour dietary record once a week. Each student received reminders via email about healthy eating at the beginning and at three and six months of the intervention. |
Characteristics of excluded studies [ordered by study ID]
| Study | Reason for exclusion |
|---|---|
| ACTRN12612000874819 | Wrong study design |
| ACTRN12614000431628 | Short‐term (< 4 weeks) |
| ACTRN12615001321538 | Wrong comparator |
| ACTRN12616000840482 | Short‐term (< 4 weeks) |
| ACTRN12616001352493 | Wrong study design |
| ACTRN12617000319370 | Wrong comparator |
| ACTRN12618000322235 | Wrong study design |
| ACTRN12618001758291 | Wrong comparator |
| Aeberli 2011 | Short‐term (< 4 weeks) |
| Aeberli 2012 | Short‐term (< 4 weeks) |
| Ahmad 2020b | Wrong study design |
| Al Dujaili 2017 | Short‐term (< 4 weeks) |
| Al Tamimi 2020 | Wrong intervention |
| Al Waili 2004 | Short‐term (< 4 weeks) |
| Anderson 2014 | Wrong intervention |
| Angelopoulos 2015 | Wrong comparator |
| Angelopoulos 2016 | Wrong comparator |
| Angelopoulos 2016a | Wrong comparator |
| Bachlechner 2017 | Short‐term (< 4 weeks) |
| Bantle 2000 | Wrong comparator |
| Bonora 1999 | Wrong study design |
| Brandes 1981 | Wrong study design |
| Brown 2011 | Short‐term (< 4 weeks) |
| Bruun 2015 | No relevant outcome for present review measured |
| Brynes 2003 | Short‐term (< 4 weeks) |
| Campos 2017 | No relevant outcome for present review measured |
| Chen 2009 | Wrong intervention |
| Chen 2010 | Wrong intervention |
| Chew 2019 | Wrong intervention |
| Clayton 2019 | Wrong intervention |
| Creighton 2014 | Wrong intervention |
| Davila 2016 | Short‐term (< 4 weeks) |
| Derakhshandeh‐Rishehri 2014 | Wrong intervention |
| Dhillon 2018 | Wrong intervention |
| Dominguez Coello 2017 | Wrong intervention |
| Feig 2010 | Wrong intervention |
| Geidl 2018 | No relevant outcome for present review measured |
| Genta 2009 | Wrong intervention |
| Gonzalez‐Granda 2018 | Short‐term (< 4 weeks) |
| Gostner 2005 | Wrong study design |
| Grande 1974 | Short‐term (< 4 weeks) |
| Hallfrisch 1983 | Wrong study design |
| Hidvegi 2016 | Wrong study design |
| Higgins 2018 | Wrong intervention |
| Higgins 2019 | No relevant outcome for present review measured |
| Hochuli 2011 | Short‐term (< 4 weeks) |
| Hollenbeck 1993 | Wrong study design |
| Houston 2015 | Wrong study design |
| Hudgins 1998 | Short‐term (< 4 weeks) |
| Huttunen 1976 | Wrong study design, not an RCT |
| ISRCTN11540234 | Wrong intervention |
| ISRCTN41579277 | Wrong intervention |
| ISRCTN57611296 | Wrong intervention |
| ISRCTN90960030 | Wrong intervention |
| Juturu 2011 | Wrong intervention |
| Kuzma 2019 | Short‐term (< 4 weeks) |
| Lambert 2018 | Wrong intervention |
| Lowndes 2012 | Wrong intervention |
| Madero 2011 | Wrong intervention |
| Madjd 2018 | Wrong comparator |
| Majid 2013 | Wrong intervention |
| Meng 2018 | Wrong comparator |
| NCT00374218 | Wrong study design |
| NCT00525694 | Short‐term (< 4 weeks) |
| NCT00868673 | Wrong intervention |
| NCT01364337 | Wrong intervention |
| NCT01394380 | No relevant outcome for present review measured |
| NCT01645995 | No relevant outcome for present review measured |
| NCT01683929 | Short‐term (< 4 weeks) |
| NCT01790984 | Wrong comparator |
| NCT02252952 | No relevant outcomes for current review measured |
| NCT02347267 | Wrong comparator |
| NCT02911753 | Wrong intervention |
| NCT03527277 | Wrong comparator |
| NCT03868683 | Wrong comparator |
| Nickols Richardson 2014 | Wrong intervention |
| Nikkila 1972 | Short‐term (< 4 weeks) |
| Okuno 2010 | Wrong comparator |
| Padilla Camberos 2018 | Wrong intervention |
| Ramirez Velez 2016 | Wrong study design |
| Rasad 2018 | Wrong comparator |
| Reid 2013 | No relevant outcome for present review measured |
| Reiser 1981 | Wrong study design |
| Reiser 1989 | Wrong study design |
| Roberts 1974 | Wrong study design |
| Swanson 1992 | Wrong intervention |
| Tate 2012 | Wrong comparator |
| UMIN000016456 | Wrong intervention |
| UMIN000016586 | Wrong intervention |
| UMIN000018120 | Short‐term (< 4 weeks) |
| UMIN000022168 | Wrong study design |
| Zaveri 2009 | Wrong intervention |
RCT:
Characteristics of studies awaiting classification [ordered by study ID]
ACTRN12610000106033.
| Methods | Randomised controlled study |
| Participants | 120 healthy males, ages 20‐55 |
| Interventions | Sugar‐sweetened beverages vs non‐caloric beverages for 8 weeks |
| Outcomes | Body weight; plasma total and high‐density lipoprotein cholesterol; plasma triacylglycerol |
| Notes |
Crutchley 2013.
| Methods | Randomised controlled study |
| Participants | Relatively insulin‐resistant population, number not stated |
| Interventions | Sugar‐sweetened beverages vs non‐sweetened beverages for 8 weeks |
| Outcomes | Fasting glucose; triglyceride; HDL‐cholesterol; weight; BMI; blood pressure |
| Notes |
Kassi 2016.
| Methods | Randomised controlled trial |
| Participants | 38 men and women with metabolic syndrome, aged 47.3 +/‐ 10.3 years |
| Interventions | Sweet of choice vs Stevia snack for 16 weeks |
| Outcomes | Systolic blood pressure; diastolic blood pressure; fasting glucose |
| Notes |
UMIN000014317.
| Methods | Randomised controlled study |
| Participants | 44 healthy men and women of ages 20‐59 years |
| Interventions | Placebo vs (unknown) food for 12 weeks |
| Outcomes | Plasma glucose; triglyceride |
| Notes |
UMIN000026291.
| Methods | Randomised controlled trial |
| Participants | 70 healthy men and women of ages 20‐65 |
| Interventions | Placebo vs (unknown) food for 12 weeks |
| Outcomes | Body weight; total cholesterol; HDL‐cholesterol; LDL‐cholesterol; fasting blood glucose |
| Notes |
UMIN000031206.
| Methods | Randomised controlled trial |
| Participants | 24 healthy men and women of ages 20‐65 years |
| Interventions | Placebo vs (unknown) test food for 4 weeks |
| Outcomes | Body weight; blood pressure, blood tests (not described in detail) |
| Notes |
BMI: HDL: LDL: vs:
Characteristics of ongoing studies [ordered by study ID]
Boakes 2015.
| Study name | Effects of sugar‐sweetened drinks on psychological and metabolic outcomes |
| Methods | RCT, parallel |
| Participants | 153 |
| Interventions | Sugar‐sweetened drink vs water, 4.5 L per week |
| Outcomes | Primary outcome: Waist circumference. Secondary outcome: fasting blood glucose, triglyceride, cholesterol, blood pressure, BMI, OGTT, Go/No go test for response inhibition, sweetness preference test, total body fat as measured by Bio‐electrical Impedance Analysis |
| Starting date | 25/09/2015 |
| Contact information | Prof Robert A Boakes, School of Psychology, University of Sydney, Sydney NSW 2006 Australia |
| Notes | Duration of intervention: 12 weeks |
Flores‐Muñoz 2018.
| Study name | Metabolism effects of artificially sweetened beverages restriction |
| Methods | RCT, parallel |
| Participants | 45 |
| Interventions | Experimental: artificially sweetened beverages Control group: no changes in their alimentary habits |
| Outcomes | Primary:
Secondary:
|
| Starting date | February 1, 2017 |
| Contact information | Paulina E Viveros‐Watty, pauwatty@gmail.com |
| Notes | Inclusion Criteria:
Exclusion Criteria:
|
Gonzalez 2018.
| Study name | Dietary carbohydrate manipulation and energy balance |
| Methods | RCT, parallel assignment |
| Participants | 60 |
| Interventions |
|
| Outcomes | Primary: Physical activity energy expenditure (kJ/day or kcal/day) Secondary: Time spent in different physical activity intensities (MET categories) (minutes), energy expended in different physical activity intensities (MET categories) (kJ or kcal), step count, energy intake and dietary macronutrient composition, weight, bone mineral density, bone mineral content, fat body mass, lean body mass, android fat mass, gynoid fat mass, resting metabolic rate, substrate oxidation, waist and hip circumference, fasting metabolite/hormone profile, postprandial metabolite/hormone profile, blood pressure, food preference ratings, subjective appetite and mood ratings, interstitial glucose concentrations, adipose tissue gene expression, adipose tissue protein expression, muscle tissue gene expression, muscle tissue protein expression, muscle glycogen concentrations, protein glycation, gut microbiome characterisation, metabolimics, faecal energy density, urinary beta‐hydroxybutyrate concentrations, urine urea nitrogen excretion, genetic variation |
| Starting date | October 1, 2018 |
| Contact information | |
| Notes | Inclusion Criteria:
Exclusion Criteria:
|
Havel 2016.
| Study name | Adverse metabolic effects of dietary sugar |
| Methods | RCT, parallel |
| Participants | 72 |
| Interventions | Interventions:
|
| Outcomes | Primary outcomes: Change of de novo lipogenesis: palmitate tracer‐to‐tracee ratios by gas chromatography‐mass spectrometry Secondary outcomes:
|
| Starting date | February 2016 |
| Contact information | Kimber L Stanhope, klstanhope@ucdavis.edu |
| Notes | Inclusion Criteria:
Exclusion criteria:
|
Raben 2019.
| Study name | Sweeteners and sweetness enhancers: prolonged effects on health obesity and safety |
| Methods | RCT, parallel |
| Participants | 330 healthy participants |
| Interventions | Sugar vs sweeteners |
| Outcomes | Glucose; blood pressure |
| Starting date | 2019 |
| Contact information | |
| Notes |
Sievenpiper 2018.
| Study name | Strategies To OPpose Sugars with NOn‐nutritive sweeteners Or Water (STOP Sugars NOW) trial |
| Methods | RCT, parallel |
| Participants | 81 |
| Interventions | Experimental: Non‐nutritive sweetened beverage (NSB) Experimental: Water Active Comparator: Sugar‐sweetened beverage (SSB) |
| Outcomes | Primary:
Secondary:
|
| Starting date | May 31, 2018 |
| Contact information | |
| Notes | Inclusion Criteria:
Exclusion Criteria:
|
Tobias 2020.
| Study name | Health effects of substituting sugary beverages with artificially‐sweetened beverages or water (SUB‐POP) |
| Methods | RCT, parallel |
| Participants | 270 healthy participants, 20‐69 years old |
| Interventions | SSB vs aspartame SSB |
| Outcomes | Weight; fP‐glucose; triglycerides; HDL‐C; LDL‐C; systolic blood pressure; diastolic blood pressure |
| Starting date | 2020 |
| Contact information | |
| Notes |
Vohl 2017.
| Study name | Effect of non‐nutritive sweeteners of high‐sugar sweetened beverages on metabolic health and gut microbiome |
| Methods | RCT, parallel |
| Participants | 66 |
| Interventions |
|
| Outcomes | Primary: Changes in metabolic syndrome parameters including insulin/glucose homeostasis and lipid/lipoprotein metabolism in sugar‐sweetened beverages (SSB) consumers Secondary:
|
| Starting date | October 18, 2017 |
| Contact information | Marie‐Claude Vohl, marie-claude.vohl@fsaa.ulaval.ca |
| Notes |
ALT: Asp(‐AL)(‐EB): AST: BMI: BP: CAM: CCRC: Chol: fP: HDL(‐C): HFCS(‐AL)(‐EB): iAUC: kcal: kJ: LDL(‐C): MET: MRI: NSB: OGTT: RCT: R.N.s: rRNA: SSB: TG: VLDL:
Differences between protocol and review
Since it is no longer recommended that industry‐funding should be taken into consideration in the risk of bias domain 'other potential sources of bias', only compliance with the intervention was assessed in this section and industry‐funding was reported in the text only.
As no studies reported our primary outcomes, we instead generated a funnel plot for total cholesterol, the secondary outcome with the highest number of studies and with the most clinical relevance. For the same reason, none of the other planned analyses on the primary outcomes could be conducted.
We also changed a subgroup analysis from solid versus liquid to solid and liquid versus liquid, since no included trials only provided solid foods to the participants. We also clarified, with respect to the subgroup analysis comparing healthy with a high‐risk population, that a study had to have at least 50% of participants defined as unhealthy for the study to be categorised as such, and vice versa.
Contributions of authors
Sara Bergwall and Anna Johansson screened titles and abstracts and assessed studies for inclusion or exclusion, performed the analyses and wrote the review.
Emily Sonestedt and Stefan Acosta reviewed and contributed with expertise.
Sources of support
Internal sources
No sources of support provided
External sources
-
This project was supported by the NIHR via Cochrane Infrastructure funding to the Heart Group. The views and opinions expressed therein are those of the authors and do not necessarily reflect those of the Systematic Reviews Programme, NIHR, NHS or the Department of Health and Social Care, UK
NIHR
Declarations of interest
Sara Bergwall has declared that she has no conflicts of interest.
Anna Johansson reports to work as a health professional related to the topic area of this review.
Emily Sonestedt has declared that she has no conflicts of interest.
Stefan Acosta has declared that he has no conflicts of interest.
New
References
References to studies included in this review
Ahmad 2020 {published data only}
- Ahmad A, Isherwood C, Umpleby M, Griffin B. Effects of high and low sugar diets on cardiovascular disease risk factors. Annals of Nutrition & Metabolism 2019;75(3):46. [DOI: 10.1159/000501751] [DOI] [PubMed] [Google Scholar]
- Ahmad A, Isherwood C, Umpleby M, Griffin B. Effects of high and low sugar diets on cardiovascular disease risk factors. Journal of Nutritional Science and Vitaminology 2020;66(Supplement):S18-S24. [DOI] [PubMed] [Google Scholar]
- Ahmad A, Isherwood C, Umpleby M, Griffin B. Effects of high and low sugar diets on cardiovascular disease risk factors. Journal of Nutritional Science and Vitaminology 2021;66:S18-24. [DOI: 10.3177/jnsv.66.S18] [DOI] [PubMed] [Google Scholar]
Black 2006 {published data only}
- Black RN, Spence M, McMahon RO, Cuskelly GJ, Ennis CN, McCance DR, et al. Effect of eucaloric high- and low-sucrose diets with identical macronutrient profile on insulin resistance and vascular risk: a randomized controlled trial. Diabetes 2006;55:3566-72. [DOI: 10.2337/db06-0220] [DOI] [PubMed] [Google Scholar]
Campos 2015 {published data only}
- Campos V, Despland C, Brandejsky V, Kreis R, Schneiter P, Chiolero A, et al. Sugar- and artificially sweetened beverages and intrahepatic fat: a randomized controlled trial. Obesity (Silver Spring, Md) 2015;23:2335-9. [DOI: 10.1002/oby.21310] [DOI] [PubMed] [Google Scholar]
- Campos V, Despland C, Schneiter P, Brandejsky V, Kreis R, Boesch C, et al. A randomized control trial of sugar-sweetened and artificially sweetened beverages and intrahepatic fat in overweight subjects. FASEB Journal 2015;29:602.5. [Google Scholar]
- NCT01394380. Reduction of sweetened beverages and intrahepatic fat (REDUCS). clinicaltrials.gov/show/NCT01394380 (first posted 14 July 2011).
Ebbeling 2020 {published data only}
- Ebbeling CB, Feldman HA, Steltz SK, Ludwig DS. Differential effects of sugar-sweetened, artificially sweetened, and unsweetened beverages on taste preference but not CVD risk factors in a 12-month RCT. Circulation 2019;139(Suppl 1):044. [DOI: 10.1161/circ.139.suppl_1.044] [DOI] [Google Scholar]
- Ebbeling CB, Feldman HA, Steltz SK, Quinn NL, Robinson LM, Ludwig DS. Effects of sugar-sweetened, artificially sweetened, and unsweetened beverages on cardiometabolic risk factors, body composition, and sweet taste preference: a randomized controlled trial. Journal of the American Heart Association 2020;9(15):e015668. [DOI: 10.1161/JAHA.119.015668] [DOI] [PMC free article] [PubMed] [Google Scholar]
- NCT01295671. Beverages and Societal Health (BASH III). clinicaltrials.gov/show/NCT01295671 (first posted 14 February 2011).
Geidl‐Flueck 2021 {published data only}
- Geidl-Flueck B, Hochuli M, Nemeth A, Eberl A, Derron N, Kofeler HC, et al. Fructose- and sucrose- but not glucose-sweetened beverages promote hepatic de novo lipogenesis: a randomized controlled trial. Journal of Hepatology 2021;75(1):46-54. [DOI] [PubMed] [Google Scholar]
- NCT01733563. Sugar Sweetened Beverages (SSB) - effects on metabolism. clinicaltrials.gov/show/nct01733563 (first posted 27 November 2012).
Johnson 2015 {published data only}
- Johnson LK, Holven KB, Nordstrand N, Mellembakken JR, Tanbo T, Hjelmesaeth J. Fructose content of low calorie diets: effect on cardiometabolic risk factors in obese women with polycystic ovarian syndrome: a randomized controlled trial. Endocrine Connections 2015;4:144-54. [DOI: 10.1530/EC-15-0047] [DOI] [PMC free article] [PubMed] [Google Scholar]
- NCT00779571. The FEMale health dietary INtervention study (FEMIN). clinicaltrials.gov/show/NCT00779571 (first posted 24 October 2008).
Lewis 2013 {published data only}
- ISRCTN50808730. Comparison of 15% versus 5% sucrose intakes as part of a eucaloric diet in overweight/obese subjects: impact on insulin resistance, insulin secretion, postprandial glucose levels and vascular compliance. https://doi.org/10.1186/ISRCTN50808730 (date applied 31 August 2007).
- Lewis AS, McCourt HJ, Ennis CN, Bell PM, Courtney CH, McKinley MC, et al. Comparison of 5% versus 15% sucrose intakes as part of a eucaloric diet in overweight and obese subjects: effects on insulin sensitivity, glucose metabolism, vascular compliance, body composition and lipid profile. A randomised controlled trial. Metabolism: Clinical and Experimental 2013;62:694-702. [DOI: 10.1016/j.metabol.2012.11.008] [DOI] [PubMed] [Google Scholar]
Lowndes 2014a {published data only}
- Lowndes J, Sinnett S, Yu Z, Rippe J. The effects of fructose-containing sugars on weight, body composition and cardiometabolic risk factors when consumed at up to the 90th percentile population consumption level for fructose. Nutrients 2014;6:3153-68. [DOI: 10.3390/nu6083153] [DOI] [PMC free article] [PubMed] [Google Scholar]
- Yu Z, Lowndes J, Rippe J. High-fructose corn syrup and sucrose have equivalent effects on energy-regulating hormones at normal human consumption levels.. Nutrition Research 2013;33(12):1043-52. [DOI: 10.1016/j.nutres.2013.07.020] [DOI] [PubMed] [Google Scholar]
Lowndes 2014b {published data only}
- Lowndes J, Sinnett S, Pardo S, Nguyen VT, Melanson KJ, Yu Z, et al. The effect of normally consumed amounts of sucrose or high fructose corn syrup on lipid profiles, body composition and related parameters in overweight/obese subjects. Nutrients 2014;6:1128-44. [DOI: 10.3390/nu6031128] [DOI] [PMC free article] [PubMed] [Google Scholar]
Madero 2015 {published data only}
- Madero M, Rodriguez Castellanos FE, Jalal D, Villalobos-Martin M, Salazar J, Vazquez-Rangel A, et al. A pilot study on the impact of a low fructose diet and allopurinol on clinic blood pressure among overweight and prehypertensive subjects: a randomized placebo controlled trial. Journal of the American Society of Hypertension 2015;9:837-44. [DOI: 10.1016/j.jash.2015.07.008] [DOI] [PubMed] [Google Scholar]
- NCT01157936. Hyperuricemia on hypertension and metabolic syndrome. clinicaltrials.gov/show/NCT01157936 (first posted 8 July 2010).
Maersk 2012 {published data only}
- Engel S, Tholstrup T, Bruun JM, Astrup A, Richelsen B, Raben A. Effect of high milk and sugar-sweetened and non-caloric soft drink intake on insulin sensitivity after 6 months in overweight and obese adults: a randomized controlled trial. European Journal of Clinical Nutrition 2018;72:358-66. [DOI: 10.1038/s41430-017-0006-9] [DOI] [PubMed] [Google Scholar]
- Maersk M, Belza A, Stodkilde-Jorgensen H, Ringgaard S, Chabanova E, Thomsen H, et al. Sucrose-sweetened beverages increase fat storage in the liver, muscle, and visceral fat depot: a 6-mo randomized intervention study. American Journal of Clinical Nutrition 2012;95:283-9. [DOI: 10.3945/ajcn.111.022533] [DOI] [PubMed] [Google Scholar]
- NCT00777647. Effect of carbonated soft drinks on the body weight. clinicaltrials.gov/show/NCT00777647 (first posted 22 October 2008).
Maki 2015 {published data only}
- Maki KC, Nieman KM, Schild AL, Kaden VN, Lawless AL, Kelley KM, et al. Sugar-sweetened product consumption alters glucose homeostasis compared with dairy product consumption in men and women at risk of type 2 diabetes mellitus. Journal of Nutrition 2015;145:459-66. [DOI: 10.3945/jn.114.204503] [DOI] [PubMed] [Google Scholar]
- NCT01936935. Clinical trial to assess the effects of dairy on insulin sensitivity and β-cell function. clinicaltrials.gov/show/NCT01936935 (first posted 6 September 2013).
Mann 1972 {published data only}
- Mann JI, Hendricks DA, Truswell AS, Manning E. Effects on serum-lipids in normal men of reducing dietary sucrose or starch for five months. Lancet (London, England) 1970;1(7652):870-2. [DOI: 10.1016/s0140-6736(70)91696-x] [DOI] [PubMed] [Google Scholar]
- Mann JI, Truswell AS, Manning EB. Effects on serum lipids of reducing dietary sucrose or starch for 22 weeks in normal men. South African Medical Journal 1972;46(25):827-34. [PubMed] [Google Scholar]
Markey 2016 {published data only}
- Markey O, Le Jeune J, Lovegrove JA. Energy compensation following consumption of sugar-reduced products: a randomized controlled trial. European Journal of Nutrition 2016;55(6):2137-49. [DOI: 10.1007/s00394-015-1028-5] [DOI] [PMC free article] [PubMed] [Google Scholar]
- Markey O, Lejeune J, Lovegrove JA. Initial findings of the impact of an 8-week intervention of sugar reformulated product exchange on cardiovascular risk factors. Proceedings of the Nutrition Society 2013;72:E214. [DOI: 10.1017/S0029665113002395] [DOI] [Google Scholar]
- NCT01645995. The impact of reformulated foods on cardiovascular risk factors (REFORM). clinicaltrials.gov/show/NCT01645995 (first posted 20 July 2012).
Njike 2011 {published data only}
- Njike VY, Faridi Z, Shuval K, Dutta S, Kay CD, West SG, et al. Effects of sugar-sweetened and sugar-free cocoa on endothelial function in overweight adults. International Journal of Cardiology 2011;149(1):83-8. [DOI: 10.1016/j.ijcard.2009.12.010] [DOI] [PubMed] [Google Scholar]
Raben 2002 {published data only}
- Raben A, Moller BK, Flint A, Vasilaras TH, Moller AC, Holst JJ, et al. Increased postprandial glycaemia, insulinemia, and lipidemia after 10 weeks' sucrose-rich diet compared to an artificially sweetened diet: a randomised controlled trial. Food & Nutrition Research 2011;55:[Epub ahead of print]. [DOI] [PMC free article] [PubMed] [Google Scholar]
- Raben A, Vasilaras TH, Moller AC, Astrup A. Sucrose compared with artificial sweeteners: different effects on ad libitum food intake and body weight after 10 wk of supplementation in overweight subjects. American Journal of Clinical Nutrition 2002;76(4):721-9. [DOI] [PubMed] [Google Scholar]
Sanchez‐Delgado 2021 {published data only}
- Sanchez-Delgado M, Estrada JA, Paredes-Cervantes V, Kaufer-Horwitz M, Contreras I. Changes in nutrient and calorie intake, adipose mass, triglycerides and TNF-alpha concentrations after non-caloric sweetener intake: a pilot study. International Journal for Vitamin and Nutrition Research 2021;91:87-98. [DOI] [PubMed] [Google Scholar]
Smith 1996 {published data only}
- Smith JB, Niven BE, Mann JI. The effect of reduced extrinsic sucrose intake on plasma triglyceride levels. European Journal of Clinical Nutrition 1996;50(8):498-504. [PubMed] [Google Scholar]
Surwit 1997 {published data only}
- Surwit RS, Feinglos MN, McCaskill CC, Clay SL, Babyak MA, Brownlow BS, et al. Metabolic and behavioral effects of a high-sucrose diet during weight loss. American Journal of Clinical Nutrition 1997;65(4):908-15. [DOI: 10.1093/ajcn/65.4.908] [DOI] [PubMed] [Google Scholar]
Umpleby 2017 {published data only}
- NCT01790984. How does dietary carbohydrate influence the formation of an atherogenic lipoprotein phenotype (ALP)? (CHOT). clinicaltrials.gov/show/NCT01790984 (first posted 13 February 2013).
- Umpleby AM, Shojaee-Moradie F, Fielding B, Li X, Marino A, Alsini N, et al. Impact of liver fat on the differential partitioning of hepatic triacylglycerol into VLDL subclasses on high and low sugar diets. Clinical Science 2017;131(21):2561-73. [DOI: 10.1042/CS20171208] [DOI] [PMC free article] [PubMed] [Google Scholar]
- Umpleby M, Shojaee-Moradie F, Fielding B, Li X, Isherwood C, Jackson N, et al. A diet low in sugar reduces the production of atherogenic lipoproteins in men with high liver fat. Atherosclerosis 2015;241(1):e46. [Google Scholar]
Vazquez‐Duran 2016 {published data only}
- NCT02347267. Reduction in consumption of sweetened beverages on weight, body composition and blood pressure in young adults. clinicaltrials.gov/show/NCT02347267 (first posted 27 January 2015).
- Vazquez Duran M, Castillo Martinez L, Orea Tejada A, Tellez Olvera DA, Delgado Perez LG, Marquez Zepeda B, et al. Effect of decreasing the consumption of sweetened caloric and non-caloric beverages on weight, body composition and blood pressure in young adults. European Journal of Preventive Cardiology 2013;20(1 Suppl):S120. [DOI: 10.1177/2047487314530052] [DOI] [Google Scholar]
- Vazquez-Duran M, Orea-Tejeda A, Castillo-Martinez L, Cano-Garcia A, Tellez-Olvera L, Keirns-Davis C. A randomized control trial for reduction of caloric and non-caloric sweetened beverages in young adults: effects in weight, body composition and blood pressure. Nutricion Hospitalaria 2016;33(6):1372-8. [DOI: 10.20960/nh.797] [DOI] [PubMed] [Google Scholar]
References to studies excluded from this review
ACTRN12612000874819 {published and unpublished data}
- ACTRN12612000874819. The FRUIT Study: Fruit – Relationships with Urate and Insulin resistance Trial. www.who.int/trialsearch/Trial2.aspx?TrialID=ACTRN12612000874819 (date of registration 17 August 2012).
ACTRN12614000431628 {published and unpublished data}
- ACTRN12614000431628. Dietary fructose consumption and cardio-metabolic health. www.anzctr.org.au/ACTRN12614000431628.aspx (date submitted 14 April 2014).
ACTRN12615001321538 {published data only}
- ACTRN12615001321538. The Beverage study: the effects of consuming different types of sweeteners on blood glucose, insulin, and satiety responses. www.anzctr.org.au/ACTRN12615001321538.aspx (date submitted 27 October 2015).
ACTRN12616000840482 {published and unpublished data}
- ACTRN12616000840482. Effect of sugar sweetened beverages on glycaemic control during prolonged sitting periods in sedentary overweight and obese adults. www.anzctr.org.au/Trial/Registration/TrialReview.aspx?id=370947 (date submitted 22 June 2016).
ACTRN12616001352493 {published and unpublished data}
- ACTRN12616001352493. The Sugars Intake Measurement Study: a study to investigate the association between carbon and nitrogen stable isotope ratios as a biomarker of sugars intake in 120 healthy participants in New Zealand. www.anzctr.org.au/Trial/Registration/TrialReview.aspx?id=371554 (date submitted 27 September 2016).
ACTRN12617000319370 {published and unpublished data}
- ACTRN12617000319370. Effect of sugar and blackcurrant consumption on the health properties in healthy adults. www.anzctr.org.au/Trial/Registration/TrialReview.aspx?id=372300 (date submitted 10 February 2017).
ACTRN12618000322235 {published and unpublished data}
- ACTRN12618000322235. The relationship between sugar-sweetened beverage consumption and alcoholic beverage consumption in Australian adults. www.anzctr.org.au/Trial/Registration/TrialReview.aspx?id=374456 (date submitted 7 February 2018).
ACTRN12618001758291 {published and unpublished data}
- ACTRN12618001758291. The Snacking @ Otago Study: the effects of consuming almonds or biscuits on body weight and satiety. trialsearch.who.int/Trial2.aspx?TrialID=ACTRN12618001758291 (date of registration 25 October 2018).
Aeberli 2011 {published data only}
- Aeberli I, Gerber PA, Hochuli M, Haile S, Gouni-Berthold I, Berthold HK, et al. Low to moderate consumption of sugar-sweetened beverages impairs glucose and lipid metabolism and promotes inflammation in healthy young men - a randomized, controlled trial. Obesity Reviews 2011;12:54-5. [DOI: 10.1111/j.1467-789X.2011.00888.x] [DOI] [PubMed] [Google Scholar]
- Aeberli I, Gerber PA, Hochuli M, Kohler S, Haile SR, Gouni-Berthold I, et al. Low to moderate sugar-sweetened beverage consumption impairs glucose and lipid metabolism and promotes inflammation in healthy young men: a randomized controlled trial. American Journal of Clinical Nutrition 2011;94(2):479-85. [DOI: 10.3945/ajcn.111.013540] [DOI] [PubMed] [Google Scholar]
Aeberli 2012 {published data only}
- Aeberli I, Hochuli M, Gerber PA, Sze L, Murer SB, Spinas GA, et al. Moderate amounts of fructose impair insulin sensitivity in healthy young men - a randomized controlled trial. Obesity facts 2012;5(Suppl 1):60. [DOI] [PMC free article] [PubMed] [Google Scholar]
Ahmad 2020b {published and unpublished data}
- ACTRN12618001154291. Association of free sugar intake with food and nutrient intake, blood pressure, and obesity measures in Australian adults. www.anzctr.org.au/Trial/Registration/TrialReview.aspx?id=375551&isReview=true (date registered 13 July 2018).
- Ahmad R, Mok A, Rangan AM. Association of free suganr intake with blood pressure and obesity measures in Australian adults. European Journal of Nutrition 2020;59:651-9. [DOI: 10.1007/s00394-019-01932-7/] [DOI] [PubMed] [Google Scholar]
Al Dujaili 2017 {published data only}
- Al-Dujaili EA, Twaij H, Bataineh YA, Arshad U, Amjid F. Effect of stevia consumption on blood pressure, stress hormone levels and anthropometrical parameters in healthy persons. American Journal of Pharmacology and Toxicology 2017;12(1):7-17. [DOI: 10.3844/ajptsp.2017.7.17] [DOI] [Google Scholar]
Al Tamimi 2020 {published data only}
- Al-Tamimi AM, Petrisko M, Hong MY, Rezende L, Clayton ZS, Kern M. Honey does not adversely impact blood lipids of adult men and women: a randomized cross-over trial. Nutrition research (New York, NY) 2020;74:87‐95. [DOI: 10.1016/j.nutres.2019.11.012] [DOI] [PMC free article] [PubMed] [Google Scholar]
Al Waili 2004 {published data only}
- Al-Waili NS. Natural honey lowers plasma glucose, C-reactive protein, homocysteine, and blood lipids in healthy, diabetic, and hyperlipidemic subjects: comparison with dextrose and sucrose. Journal of Medicinal Food 2004;7(1):100-7. [DOI: 10.1089/109662004322984789] [DOI] [PubMed] [Google Scholar]
Anderson 2014 {published data only}
- Anderson JW, Weiter KM, Christian AL, Ritchey MB, Bays HE. Raisins compared with other snack effects on glycemia and blood pressure: a randomized, controlled trial. Postgraduate Medicine 2014;126(1):37-43. [DOI: 10.3810/pgm.2014.01.2723] [DOI] [PubMed] [Google Scholar]
Angelopoulos 2015 {published data only}
- Angelopoulos TJ, Lowndes J, Sinnett S, Rippe JM. Fructose containing sugars do not raise blood pressure or uric acid at normal levels of human consumption. Journal of Clinical Hypertension (Greenwich, Conn) 2015;17(2):87-94. [DOI: 10.1111/jch.12457] [DOI] [PMC free article] [PubMed] [Google Scholar]
- NCT01797042. A comparison of the metabolic effects of fructose, glucose, high fructose corn syrup and sucrose at normal population consumed levels in adults aged 20-60 years old. clinicaltrials.gov/show/nct01797042 (first posted 22 February 2013).
Angelopoulos 2016 {published data only}
- Angelopoulos T, Lowndes J, Rippe JM. No changes in uric acid or blood pressure after 6 months of daily consumption of sugar sweetened or diet beverages. Journal of the American Society of Hypertension (31st Annual Scientific Meeting of the American Society of Hypertension, United States) 2016;4(Suppl):e56. [Google Scholar]
Angelopoulos 2016a {published data only}
- Angelopoulos TJ, Lowndes J, Sinnett S, Rippe JM. Fructose containing sugars at normal levels of consumption do not effect adversely components of the metabolic syndrome and risk factors for cardiovascular disease. Nutrients 2016;8(4):179. [DOI: 10.3390/nu8040179] [DOI] [PMC free article] [PubMed] [Google Scholar]
Bachlechner 2017 {published data only}
- Bachlechner S, Denzer-Lippmann MY, Wielopolski J, Fischer M, Buettner A, Doerfler A, et al. The effects of different iscaloric oral nutrient solutions on psychophysical, metabolic, cognitive, and olfactory function in young male subjects. Frontiers in Psychology 2017;23(8):1988. [DOI] [PMC free article] [PubMed] [Google Scholar]
Bantle 2000 {published data only}
- Bantle JP, Raatz SK, Thomas W, Georgopoulos A. Effects of dietary fructose on plasma lipids in healthy subjects. American Journal of Clinical Nutrition 2000;72(5):1128-34. [DOI: 10.1093/ajcn/72.5.1128] [DOI] [PubMed] [Google Scholar]
Bonora 1999 {published data only}
- Bonora E, Kiechl S, Willeit J, Oberhollenzer F, Egger G, Muggeo M. Glucose, insulin and atherosclerosis: lessons from the Bruneck Study. In: Insulin Resistance, Metabolic Diseases and Diabetic Complications. Elsevier Science, 1999:19-24. [Google Scholar]
Brandes 1981 {published data only}
- Brandes JW, Lorenz-Meyer H. Sugar free diet: a new perspective in the treatment of Crohn disease? Randomized, control study. Gastroenterology 1981;19:1-12. [PubMed] [Google Scholar]
Brown 2011 {published data only}
- Brown AW, Bohan Brown MM, Onken KL, Beitz DC. Short-term consumption of sucralose, a nonnutritive sweetener, is similar to water with regard to select markers of hunger signaling and short-term glucose homeostasis in women. Nutrition Research 2011;31:882-8. [DOI] [PubMed] [Google Scholar]
Bruun 2015 {published data only}
- Bruun JM, Maersk M, Belza A, Astrup A, Richelsen B. Consumption of sucrose-sweetened soft drinks increases plasma levels of uric acid in overweight and obese subjects: a 6-month randomised controlled trial. European Journal of Clinical Nutrition 2015;69(8):949-53. [DOI: 10.1038/ejcn.2015.95] [DOI] [PubMed] [Google Scholar]
Brynes 2003 {published data only}
- Brynes AE, Mark Edwards C, Ghatei MA, Dornhorst A, Morgan LM, Bloom SR, et al. A randomised four-intervention crossover study investigating the effect of carbohydrates on daytime profiles of insulin, glucose, non-esterified fatty acids and triacylglycerols in middle-aged men. British Journal of Nutrition 2003;89(2):207-18. [DOI: 10.1079/BJN2002769] [DOI] [PubMed] [Google Scholar]
Campos 2017 {published data only}
- Campos V, Despland C, Brandejsky V, Kreis R, Schneiter P, Boesch C, et al. Metabolic effects of replacing sugar-sweetened beverages with artificially-sweetened beverages in overweight subjects with or without hepatic steatosis: a randomized control clinical trial. Nutrients 2017;9(3):202. [DOI] [PMC free article] [PubMed] [Google Scholar]
- Campos V, Despland C, Kreis R, Schneiter P, Boesch C, Tappy L. Metabolic effects of replacing sugar-sweetened by artifcially sweetened beverages in overweight subjects with or without hepatic steatosis: a randomized control clinical trial. Obesity Facts 2017;10:190-1. [DOI: 10.1159/000468958] [DOI] [PMC free article] [PubMed] [Google Scholar]
Chen 2009 {published data only}
- Chen L, Appel LJ, Loria C, Lin PH, Champagne CM, Elmer PJ, et al. Reduction in consumption of sugar-sweetened beverages is associated with weight loss: the PREMIER trial. American Journal of Clinical Nutrition 2009;89(5):1299-306. [DOI: 10.3945/ajcn.2008.27240] [DOI] [PMC free article] [PubMed] [Google Scholar]
Chen 2010 {published data only}
- Chen L, Caballero B, Mitchell DC, Loria C, Lin PH, Champagne CM, et al. Reducing consumption of sugar-sweetened beverages is associated with reduced blood pressure: a prospective study among United States adults. Circulation 2010;121(22):2398-406. [DOI: 10.1161/CIRCULATIONAHA.109.911164] [DOI] [PMC free article] [PubMed] [Google Scholar]
Chew 2019 {published data only}
- Chew B, Mathison B, Kimble L, McKay D, Kaspar K, Khoo C, et al. Chronic consumption of a low calorie, high polyphenol cranberry beverage attenuates inflammation and improves glucoregulation and HDL cholesterol in healthy overweight humans: a randomized controlled trial. European Journal of Nutrition 2019;58(3):1223-35. [DOI: 10.1007/s00394-018-1643-z] [DOI] [PMC free article] [PubMed] [Google Scholar]
Clayton 2019 {published data only}
- Clayton ZS, Fusco E, Schreiber L, Carpenter JN, Hooshmand S, Hong MY, et al. Snack selection influences glucose metabolism, antioxidant capacity and cholesterol in healthy overweight adults: a randomized parallel arm trial. Nutrition Research 2019;65:89-98. [DOI] [PMC free article] [PubMed] [Google Scholar]
Creighton 2014 {published data only}
- Creighton S, Jay M. Are non-nutritive sweetened beverages comparable to water in weight loss trials? Journal of Clinical Outcomes Management 2014;21(11):490-2. [Google Scholar]
Davila 2016 {published data only}
- Davila LC, Gomez DR, Lopez-Miranda J, Parra K, Uzcategui M, Aparicio D, et al. Effect of oat beta-glucan on glycemic index and glycemic load of a nutritional supplement sweetened with sucralose in healthy adults: a randomized clinical trial. Archivos Venezolanos de Farmacologia y Terapeutica 2016;35:77-85. [Google Scholar]
Derakhshandeh‐Rishehri 2014 {published data only}
- Derakhshandeh-Rishehri SM, Heidari-Beni M, Feizi A, Askari GR, Entezari MH. Effect of honey vinegar syrup on blood sugar and lipid profile in healthy subjects. International Journal of Preventive Medicine 2014;5(12):1608-15. [PMC free article] [PubMed] [Google Scholar]
Dhillon 2018 {published data only}
- Dhillon J, Thorwald M, De La Cruz N, Vu E, Asghar SA, Kuse Q, et al. Glucoregulatory and cardiometabolic profiles of almond vs. cracker snacking for 8 weeks in young adults: a randomized controlled trial. Nutrients 2018;10(8):960. [DOI] [PMC free article] [PubMed] [Google Scholar]
Dominguez Coello 2017 {published data only}
- Dominguez Coello S, Carrillo Fernandez L, Gobierno Hernandez J, Mendez Abad M, Borges Alamo C, Garcia Dopico JA, et al. Effectiveness of a low-fructose and/or low-sucrose diet in decreasing insulin resistance (DISFRUTE study): study protocol for a randomized controlled trial. Trials 2017;18(1):369. [DOI: 10.1186/s13063-017-2043-z] [DOI] [PMC free article] [PubMed] [Google Scholar]
Feig 2010 {published data only}
- Feig DI. Sugar-sweetened beverages and hypertension. Future Cardiology 2010;6(6):773-6. [DOI: 10.2217/fca.10.92] [DOI] [PubMed] [Google Scholar]
Geidl 2018 {published data only}
- Geidl B, Hochuli M, Spinas GA, Gerber PA. Consumption of sugar-sweetened beverages impairs the LDL subclass profile - data from a double-blind randomized controlled trial. Obesity Facts 2018;11(Supplement 1):191-2. [DOI: 10.1159/000489691] [DOI] [Google Scholar]
Genta 2009 {published data only}
- Genta S, Cabrera W, Habib N, Pons J, Carillo IM, Grau A, et al. Yacon syrup: beneficial effects on obesity and insulin resistance in humans. Clinical Nutrition (Edinburgh, Scotland) 2009;28(2):182-7. [DOI: 10.1016/j.clnu.2009.01.013] [DOI] [PubMed] [Google Scholar]
Gonzalez‐Granda 2018 {published data only}
- Gonzalez-Granda A, Damms-Machado A, Basrai M, Bischoff SC. Changes in plasma acylcarnitine and lysophosphatidylcholine levels following a high-fructose diet: a targeted metabolomics study in healthy women. Nutrients 2018;10(9):no pagination. [DOI: 10.3390/nu10091254] [DOI] [PMC free article] [PubMed] [Google Scholar]
Gostner 2005 {published data only}
- Gostner A, Schaffer V, Theis S, Menzel T, Luhrs H, Melcher R, et al. Effects of isomalt consumption on gastrointestinal and metabolic parameters in healthy volunteers. British Journal of Nutrition 2005;94(4):575–81. [DOI: 10.1079/bjn20051510] [DOI] [PubMed] [Google Scholar]
Grande 1974 {published data only}
- Grande F, Anderson JT, Keys A. Sucrose and various carbohydrate-containing foods and serum lipids in man. American Journal of Clinical Nutrition 1974;27(10):1043-51. [DOI: 10.1093/ajcn/27.8.1043] [DOI] [PubMed] [Google Scholar]
Hallfrisch 1983 {published data only}
- Hallfrisch J, Reiser S, Prather ES. Blood lipid distribution of hyperinsulinemic men consuming three levels of fructose. American Journal of Clinical Nutrition 1983;37(5):740-8. [DOI: 10.1093/ajcn/37.5.740] [DOI] [PubMed] [Google Scholar]
Hidvegi 2016 {published data only}
- Hidvegi T. The effect of nonnutritives sweeteners on certain metabolic parameters. Orvosi Hetilap 2016;157 Suppl 1:8-13. [DOI] [PubMed] [Google Scholar]
Higgins 2018 {published data only}
- Higgins KA, Considine RV, Mattes RD. Aspartame consumption for 12 weeks does not affect glycemia, appetite, or body weight of healthy, lean adults in a randomized controlled trial. Journal of Nutrition 2018;148(4):650-7. [DOI: 10.1093/jn/nxy021] [DOI] [PubMed] [Google Scholar]
Higgins 2019 {published data only}
- Higgins KA, Mattes RD. A randomized controlled trial contrasting the effects of 4 low-calorie sweeteners and sucrose on body weight in adults with overweight or obesity. American Journal of Clinical Nutrition 2019;109(5):1288-301. [DOI: 10.1093/ajcn/nqy381] [DOI] [PubMed] [Google Scholar]
Hochuli 2011 {published data only}
- Hochuli M, Aeberli I, Gerber PA, Troxler H, Kohler S, Haile S, et al. Low to moderate amounts of sugar sweetened beverages impair glucose and lipid metabolism, including beta-oxidation of fatty acids, in healthy young men - a randomised controlled trial. Diabetologia 2011;54(Suppl 1):S280. [Google Scholar]
Hollenbeck 1993 {published data only}
- Hollenbeck CB. Dietary fructose effects on lipoprotein metabolism and risk for coronary artery disease. American Journal of Clinical Nutrition 1993;58:800S-9S. [DOI] [PubMed] [Google Scholar]
Houston 2015 {published data only}
- Houston M, Minich DM. Fructose-containing sugars do not raise blood pressure or uric acid at normal levels of human consumption. Journal of Clinical Hypertension 2015;17(2):95-7. [DOI: 10.1111/jch.12470] [DOI] [PMC free article] [PubMed] [Google Scholar]
Hudgins 1998 {published data only}
- Hudgins LC, Seidman CE, Diakun J, Hirsch J. Human fatty acid synthesis is reduced after the substitution of dietary starch for sugar. American Journal of Clinical Nutrition 1998;67:631-9. [DOI] [PubMed] [Google Scholar]
Huttunen 1976 {published data only}
- Huttunen JK, Makinen KK, Scheinin A. Turku sugar studies XI. Effects of sucrose, fructose and xylitol diets on glucose, lipid and urate metabolism. Acta Odontologica Scandinavica 1976;34(6):345-51. [DOI] [PubMed] [Google Scholar]
ISRCTN11540234 {published data only}
- ISRCTN11540234. Honey cocktail study. www.who.int/trialsearch/Trial2.aspx?TrialID=ISRCTN11540234 (date assigned 16 June 2016).
ISRCTN41579277 {published data only}
- ISRCTN41579277. Relationship between a low fructose consumption and insulin resistance. doi.org/10.1186/ISRCTN41579277 (date assigned 15 November 2016).
ISRCTN57611296 {published data only}
- ISRCTN57611296. Metabolic and cardiovascular response to common food and drink ingredients. www.who.int/trialsearch/Trial2.aspx?TrialID=ISRCTN57611296 (date assigned 10 October 2014).
ISRCTN90960030 {published and unpublished data}
- ISRCTN90960030. Effect of functional milk product on the metabolic syndrome II. www.who.int/trialsearch/trial2.aspx? Trialid=isrctn90960030 (date assigned 5 February 2008).
Juturu 2011 {published data only}
- Juturu V, Wilson D, Evans M, Kasper K, Roderick R, Khoo C. Effect of a cranberry beverage on insulinotropic response in moderately hypercholesterolemic overweight/obese adults: a randomized, double-blind, placebo-controlled clinical trial. Endocrine Practice 2011;17(6):19A. [Google Scholar]
Kuzma 2019 {published data only}
- Kuzma JN, Cromer G, Hagman DK, Breymeyer KL, Roth CL, Foster-Schubert KE, et al. Consuming glucose-sweetened, not fructose-sweetened, beverages increases fasting insulin in healthy humans. European Journal of Clinical Nutrition 2019;73:487-90. [DOI] [PMC free article] [PubMed] [Google Scholar]
Lambert 2018 {published data only}
- Lambert C, Cubedo J, Padro T, Vilahur G, Lopez-Bernal S, Rocha M, et al. Effects of a carob-pod-derived sweetener on glucose metabolism. Nutrients 2018;10:271. [DOI] [PMC free article] [PubMed] [Google Scholar]
Lowndes 2012 {published data only}
- Lowndes J, Kawiecki D, Pardo S, Nguyen V, Melanson KJ, Yu Z, et al. The effects of four hypocaloric diets containing different levels of sucrose or high fructose corn syrup on weight loss and related parameters. Nutrition Journal 2012;11(1):No pagination. [DOI: 10.1186/1475-2891-11-55] [DOI] [PMC free article] [PubMed] [Google Scholar]
Madero 2011 {published data only}
- Madero M, Arriaga JC, Jalal D, Rivard C, McFann K, Perez-Mendez O, et al. The effect of two energy-restricted diets, a low-fructose diet versus a moderate natural fructose diet, on weight loss and metabolic syndrome parameters: a randomized controlled trial. Metabolism: Clinical and Experimental 2011;60(11):1551-9. [DOI: 10.1016/j.metabol.2011.04.001] [DOI] [PubMed] [Google Scholar]
Madjd 2018 {published and unpublished data}
- IRCT201402177754N5. Effects of replacement of diet beverage soft drinks with water on promoting weight reduction. irct.ir/trial/8217 (registration date 11 March 2014).
- Madjd A, Taylor MA, Delavari A, Malekzadeh R, Macdonald IA, Farshchi HR. Effects of replacing diet beverages with water on weight loss and weight maintenance: 18-month follow-up, randomized clinical trial.. International Journal of Obesity 2018;42(4):835-40. [DOI: 10.1038/ijo.2017.306] [DOI] [PubMed] [Google Scholar]
Majid 2013 {published data only}
- Majid M, Younis MA, Naveed AK, Shah MU, Azeem Z, Tirmizi SH. Effects of natural honey on blood glucose and lipid profile in young healthy Pakistani males. Journal of Ayub Medical College, Abbottabad 2013;25(3-4):44-7. [PubMed] [Google Scholar]
Meng 2018 {published data only}
- Meng H, Matthan NR, Benitez SB, Fried SK, Lichtenstein AH. Effect of dietary carbohydrate type on serum lipid profile, adipose tissue macrophage infiltration and inflammatory status, and peripheral macrophage cholesterol efflux. Circulation 2018;137:No pagination. [Google Scholar]
NCT00374218 {published and unpublished data}
- NCT00374218. Effect of replacing HFCS with sucromalt in subjects with raised waist circumference. clinicaltrials.gov/show/nct00374218 (first posted 11 September 2006).
NCT00525694 {published data only}
- NCT00525694. Zero calorie drink products. clinicaltrials.gov/show/NCT00525694 (first posted 6 September 2007).
NCT00868673 {published data only}
- NCT00868673. The role of fructose and uric acid In the development of obesity and metabolic syndrome. clinicaltrials.gov/show/nct00868673 (first posted 25 March 2009).
NCT01364337 {published data only}
- NCT01364337. Design and testing efficacy of blood pressure and glucose lowering diet for Taiwanese pre-/1st staged hypertension patients and/or pre-diabetes patients. clinicaltrials.gov/ct2/show/NCT01364337 (first posted 2 June 2010).
NCT01394380 {published and unpublished data}
- NCT01394380. Reduction of sweetened beverages and intrahepatic fat. clinicaltrials.gov/show/nct01394380 (first posted 14 July 2011).
NCT01645995 {published and unpublished data}
- NCT01645995. The impact of reformulated foods on cardiovascular risk factors. clinicaltrials.gov/show/NCT01645995 (first posted 20 July 2012).
NCT01683929 {published data only}
- NCT01683929. The effects of oral glucose compared to sweetener drinking on hormonal/metabolic responses. clinicaltrials.gov/show/nct01683929 (first posted 12 September 2012).
NCT01790984 {published and unpublished data}
- NCT01790984. How does dietary carbohydrate influence the formation of an atherogenic lipoprotein phenotype (ALP)? clinicaltrials.gov/show/NCT01790984 (first posted 13 February 2013).
NCT02252952 {published and unpublished data}
- NCT02252952. The effect of sugar sweetened and diet beverages consumed as part of a weight-maintenance diet on fat storage. clinicaltrials.gov/show/nct02252952 (first posted 30 September 2014).
NCT02347267 {published and unpublished data}
- NCT02347267. Reduction in consumption of sweetened beverages on weight, body composition and blood pressure in young adults. clinicaltrials.gov/show/nct02347267 (first posted 27 January 2015).
NCT02911753 {published data only}
- NCT02911753. Feasibility and acceptability of a beverage intervention for Hispanic adults. clinicaltrials.gov/show/nct02911753 (first posted 25 October 2019).
NCT03527277 {published data only}
- NCT03527277. Orange juice and sugar intervention study. clinicaltrials.gov/show/nct03527277 (first posted 17 May 2018).
NCT03868683 {published data only}
- NCT03868683. The glycemic effect of added sugar on bake beans. clinicaltrials.gov/ct2/show/NCT03868683 (first posted 11 March 2019).
Nickols Richardson 2014 {published data only}
- Nickols-Richardson SM, Piehowski K, Metzgar CJ, Miller DL, Preston AG. Changes in body weight, blood pressure and selected metabolic biomarkers with an energy-restricted diet including twice daily sweet snacks and once daily sugar-free beverage. Nutrition Research and Practice 2014;8(6):695-704. [DOI: 10.4162/nrp.2014.8.6.695] [DOI] [PMC free article] [PubMed] [Google Scholar]
Nikkila 1972 {published data only}
- Nikkila EA, Kekki M. Effects of dietary fructose and sucrose on plasma triglyceride metabolism in patients with endogenous hypertriglyceridemia. Acta Medica Scandinavica 1972;542(Suppl):221-7. [DOI] [PubMed] [Google Scholar]
Okuno 2010 {published data only}
- Okuno M, Kim MK, Mizu M, Mori M, Mori H, Yamori Y. Palatinose-blended sugar compared with sucrose: different effects on insulin sensitivity after 12 weeks supplementation in sedentary adults. International Journal of Food Sciences and Nutrition 2010;61(6):643-51. [DOI: 10.3109/09637481003694576] [DOI] [PubMed] [Google Scholar]
Padilla Camberos 2018 {published data only}
- Padilla-Camberos E, Barragan-Alvarez CP, Diaz-Martinez NE, Rathod V, Flores-Fernandez JM. Effects of agave fructans (agave tequilana weber var. azul) on body fat and serum lipids in obesity. Plant Foods for Human Nutrition (Dordrecht, Netherlands) 2018;73(1):34-9. [DOI: 10.1007/s11130-018-0654-5] [DOI] [PubMed] [Google Scholar]
Ramirez Velez 2016 {published data only}
- Ramirez-Velez R, Ojeda ML, Tordecilla MA, Pena JC, Meneses JF. Regular consumption of sugar-sweetened beverages increases the lipid-metabolic profile and adiposity among university students from Colombia. Revista Colombiana de Cardiología 2016;23:11-8. [Google Scholar]
Rasad 2018 {published and unpublished data}
- IRCT2014111519966N. The effect of honey consumption compared with sucrose on cardiovascular risk factors in young healthy people. en.irct.ir/trial/17721 (registration date 30 November 2014).
- Rasad H, Entezari MR, Ghadiri E, Mahaki B, Pahlavani M. The effect of honey consumption compared with sucrose on lipid profile in young healthy subjects (randomized clinical trial). Clinical Nutrition ESPEN 2018;26:8-12. [DOI: 10.1016/j.clnesp.2018.04.016.] [DOI] [PubMed] [Google Scholar]
Reid 2013 {published and unpublished data}
- NCT01799096. Effects of the sugar sucrose on bodyweight and energy intake over 28 days in obese women. clinicaltrials.gov/show/nct01799096 (first posted 26 February 2013).
- Reid M, Hammersley R, Duffy M, Ballantyne C. Effects on obese women of the sugar sucrose added to the diet over 28 d: a quasi-randomised, single-blind, controlled trial. British Journal of Nutrition 2014;111(3):563-570. [DOI: 10.1017/S0007114513002687] [DOI] [PMC free article] [PubMed] [Google Scholar]
Reiser 1981 {published data only}
- Reiser S, Bickard MC, Hallfrisch J, Michaelis OE, Prather ES. Blood lipids and their distribution in lipoproteins in hyperinsulinemic subjects fed three different levels of sucrose. Journal of Nutrition 1981;111(6):1045-57. [DOI: 10.1093/jn/111.6.1045] [DOI] [PubMed] [Google Scholar]
Reiser 1989 {published data only}
- Reiser S, Powell AS, Scholfield DJ, Panda P, Ellwood KC, Canary JJ. Blood lipids, lipoproteins, apoproteins, and uric acid in men fed diets containing fructose or high-amylose cornstarch. American Journal of Clinical Nutrition 1989;49(5):832-9. [DOI: 10.1093/ajcn/49.5.832] [DOI] [PubMed] [Google Scholar]
Roberts 1974 {published data only}
- Roberts AM. Dietary sucrose and serum triglyceride levels. American Heart Journal 1974;88:808-9. [DOI] [PubMed] [Google Scholar]
Swanson 1992 {published data only}
- Swanson JE, Laine DC, Thomas W, Bantle JP. Metabolic effects of dietary fructose in healthy subjects. American Journal of Clinical Nutrition 1992;55(4):851-6. [DOI] [PubMed] [Google Scholar]
Tate 2012 {published data only}
- Tate DF, Turner-McGrievy G, Lyons E, Stevens J, Erickson K, Polzien K, et al. Replacing caloric beverages with water or diet beverages for weight loss in adults: main results of the Choose Healthy Options Consciously Everyday (CHOICE) randomized clinical trial. American Journal of Clinical Nutrition 2012;95(3):555-63. [DOI: 10.3945/ajcn.111.026278] [DOI] [PMC free article] [PubMed] [Google Scholar]
UMIN000016456 {published and unpublished data}
- JPRN-UMIN000016456. A clinical study for evaluating the efficacy and safety of long-term consumption of the honey vinegar beverage on lowering blood pressure in the subjects with high normal blood pressure or grade 1 hypertension. trialsearch.who.int/Trial2.aspx?TrialID=JPRN-UMIN000016456 (date of registration 31 August 2016).
UMIN000016586 {published data only}
- JPRN-UMIN000016586. A clinical study for evaluating the safety of excessive consumption of the honey vinegar beverage. trialsearch.who.int/Trial2.aspx?TrialID=JPRN-UMIN000016586 (date of registration 30 June 2016).
UMIN000018120 {published data only}
- UMIN000018120. A study on the effect of rare sugar syrup on blood glucose level: randomized, placebo-controlled, double blind cross-over trial. trialsearch.who.int/Trial2.aspx?TrialID=JPRN-UMIN000018120 (date of registration 30 July 2016).
UMIN000022168 {published data only}
- JPRN-UMIN000022168. Effect of consumption of cacao 72% dark chocolate for 4 weeks on blood pressure, fasting serum lipid profile, cognitive function, and markers of oxidative stress and inflammation in Japanese 45-69 subjects: single group pre-post trial. www.who.int/trialsearch/trial2.aspx? Trialid=jprn-umin000022168 (date of registration 2 May 2016).
Zaveri 2009 {published data only}
- Zaveri S, Drummond S. The effect of including a conventional snack (cereal bar) and a nonconventional snack (almonds) on hunger, eating frequency, dietary intake and body weight. Journal of Human Nutrition and Dietetics 2009;22(5):461-8. [DOI: 10.1111/j.1365-277X.2009.00983.x] [DOI] [PubMed] [Google Scholar]
References to studies awaiting assessment
ACTRN12610000106033 {published and unpublished data}
- ACTRN12610000106033. The ICE Tea study: dietary compensation capabilities in individuals resistant to obesity (expenders) and susceptible to obesity (conservers). www.anzctr.org.au/Trial/Registration/TrialReview.aspx?id=335091 (date registered 2 February 2010).
Crutchley 2013 {published data only}
- Crutchley PW, Morenga LT. Effect of sugar-sweetened soft drinks on serum uric acid and associated metabolic risk factors. FASEB Journal 2013;27:112.8. [DOI: 10.1096/fasebj.27.1_supplement.112.8] [DOI] [Google Scholar]
Kassi 2016 {published data only}
- Kassi EN, Landis G, Pavlaki A, Lambrou G, Mantzou E, Androulakis I, et al. Long-term effects of stevia rebaudiana on glucose and lipid profile, adipocytokines, markers of inflammation and oxidation status in patients with metabolic syndrome. Endocrine Reviews 2016;37:577. [DOI: 10.1210/endo-meetings.2016.CE.5.SUN-577] [DOI] [Google Scholar]
UMIN000014317 {published data only}
- UMIN000014317. Effects of ingestion of a food on glycometabolism: a randomized, double blind, placebo-controlled study. upload.umin.ac.jp/cgi-open-bin/ctr_e/ctr_view.cgi?recptno=R000016667 (date of disclosure 19 June 2014).
UMIN000026291 {published data only}
- UMIN000026291. Examination study on abdominal visceral fat reducing action by functional food intake - randomized placebo-controlled double-blind parallel group comparison study. upload.umin.ac.jp/cgi-open-bin/ctr_e/ctr_view.cgi?recptno=R000030198 (date of disclosure 7 April 2017).
UMIN000031206 {published data only}
- UMIN000031206. Safety of overconsumption of a test food. rctportal.niph.go.jp/s/detail/um?trial_id=UMIN000031206 (date of disclosure 9 February 2018).
References to ongoing studies
Boakes 2015 {published and unpublished data}ACTRN12615001004550
- ACTRN12615001004550. Effects of sugar-sweetened drinks on psychological and metabolic outcomes [Possible effects on healthy young adults of sugar- and artificially-sweetened drinks in terms of psychological and metabolic outcomes]. trialsearch.who.int/?trialid=ACTRN12615001004550 (first posted 25 September 2015).
Flores‐Muñoz 2018 {published and unpublished data}
- NCT03679689. Metabolism effects of artificially sweetened beverages restriction. clinicaltrials.gov/show/nct03679689 (first posted 20 September 2018).
Gonzalez 2018 {published and unpublished data}
- NCT03574987. Dietary carbohydrate manipulation and energy balance: RCT. clinicaltrials.gov/show/nct03574987 (first posted 2 July 2018).
Havel 2016 {published and unpublished data}
- NCT02548767. Adverse metabolic effects of dietary sugar. clinicaltrials.gov/show/nct02548767 (first posted 14 September 2016).
Raben 2019 {published data only}
- NCT04226911. Sweeteners and sweetness enhancers: prolonged effects on health, obesity and safety. clinicaltrials.gov/ct2/show/NCT04226911 (first posted 13 January 2020).
Sievenpiper 2018 {published and unpublished data}
- NCT03543644. Strategies to oppose sugars with non-nutritive sweeteners or water (STOP Sugars NOW) trial. clinicaltrials.gov/show/NCT03543644 (first posted 1 June 2018).
Tobias 2020 {published data only}
- NCT04567108. Health effects of substituting sugary beverages with artificially-sweetened beverages or water [SUBstituting With Preferred Options: Health Effects of Substituting Sugar-sweetened Beverages With Non-caloric Beverages in Adults With Overweight and Obesity]. clinicaltrials.gov/ct2/show/NCT04567108 (first posted 28 September 2020).
Vohl 2017 {published and unpublished data}
- NCT03259685. Effect of non-nutritive sweeteners of high sugar sweetened beverages on metabolic health and gut microbiome. clinicaltrials.gov/show/nct03259685 (first posted 24 August 2017).
Additional references
Aburto 2013
- Aburto NJ, Ziolkovska A, Hooper L, Elliott P, Cappuccio FP, Meerpohl JJ. Effect of lower sodium intake on health: systematic review and meta-analyses. BMJ 2013;346:f1326. [PMID: ] [DOI] [PMC free article] [PubMed] [Google Scholar]
Aeberli 2011
- Aeberli I, Gerber PA, Hochuli M, Kohler S, Haile SR, Gouni-Berthold I, et al. Low to moderate sugar-sweetened beverage consumption impairs glucose and lipid metabolism and promotes inflammation in healthy young men: a randomized controlled trial. American Journal of Clinical Nutrition 2011;94(2):479-85. [PMID: ] [DOI] [PubMed] [Google Scholar]
American Heart Association 2017
- American Heart Association. Sugar 101. www.heart.org/en/healthy-living/healthy-eating/eat-smart/sugar/sugar-101 (accessed 7 December 2018).
Bantle 1986
- Bantle JP, Laine DC, Thomas JW. Metabolic effects of dietary fructose and sucrose in types I and II diabetic subjects. JAMA 1986;256(23):3241-6. [PMID: ] [PubMed] [Google Scholar]
Black 2006
- Black RN, Spence M, McMahon RO, Cuskelly GJ, Ennis CN, McCance DR, et al. Effect of eucaloric high- and low-sucrose diets with identical macronutrient profile on insulin resistance and vascular risk: a randomized controlled trial. Diabetes 2006;55(12):3566-72. [PMID: ] [DOI] [PubMed] [Google Scholar]
Chiavaroli 2015
- Chiavaroli L, De Souza RJ, Ha V, Cozma AI, Mirrahimi A, Wang DD, et al. Effect of fructose on established lipid targets: a systematic review and meta-analysis of controlled feeding trials. Journal of the American Heart Association 2015;4(9):e001700. [PMID: ] [DOI] [PMC free article] [PubMed] [Google Scholar]
Clar 2017
- Clar C, Al-Khudairy L, Loveman E, Kelly SA, Hartley L, Flowers N, et al. Low glycaemic index diets for the prevention of cardiovascular disease. Cochrane Database of Systematic Reviews 2017, Issue 7. Art. No: CD004467. [DOI: 10.1002/14651858.CD004467.pub3] [DOI] [PMC free article] [PubMed] [Google Scholar]
Deeks 2018
- Deeks JJ, Higgins JP, Altman DG, Cochrane Statistical Methods Group. Chapter 10: Analysing data and undertaking meta-analyses .. In: Higgins JPT, Chandler J, Cumpston MS, Li T, Page MJ, Welch V, editors(s). Cochrane Handbook for Systematic Reviews of Interventions (draft version (13 September 2018)). Chichester, UK: John Wiley & Sons, 2018. [Google Scholar]
EFSA 2010
- EFSA Panel on Dietetic Products, Nutrition, and Allergies (NDA). Scientific opinion on dietary reference values for carbohydrates and dietary fibre. European Food Safety Authority Journal 2010;8(3):1462. [Google Scholar]
Evans 2017
- Evans RA, Frese M, Romero J, Cunningham JH, Mills KE. Chronic fructose substitution for glucose or sucrose in food or beverages has little effect on fasting blood glucose, insulin, or triglycerides: a systematic review and meta-analysis. American Journal of Clinical Nutrition 2017;106(2):519-29. [PMID: ] [DOI] [PubMed] [Google Scholar]
Fattore 2017
- Fattore E, Botta F, Agostoni C, Bosetti C. Effects of free sugars on blood pressure and lipids: a systematic review and meta-analysis of nutritional isoenergetic intervention trials. American Journal of Clinical Nutrition 2017;105(1):42-56. [PMID: ] [DOI] [PubMed] [Google Scholar]
Global Burden of Disease 2016
- Disease and Injury Incidence and Prevalence Collaborators. Global, regional, and national incidence, prevalence, and years lived with disability for 328 diseases and injuries for 195 countries, 1990–2016: a systematic analysis for the Global Burden of Disease Study 2016. Lancet 2017;390:1211-59. [DOI] [PMC free article] [PubMed] [Google Scholar]
Ha 2012
- Ha V, Sievenpiper JL, De Souza RJ, Chiavaroli L, Wang DD, Cozma AI, et al. Effect of fructose on blood pressure: a systematic review and meta-analysis of controlled feeding trials. Hypertension 2012;59(4):787-95. [PMID: ] [DOI] [PubMed] [Google Scholar]
Hartley 2013
- Hartley L, Igbinedion E, Holmes J, Flowers N, Thorogood M, Clarke A, et al. Increased consumption of fruit and vegetables for the primary prevention of cardiovascular diseases. Cochrane Database of Systematic Reviews 2013, Issue 6. Art. No: CD009874. [DOI: 10.1002/14651858.CD009874.pub2] [DOI] [PMC free article] [PubMed] [Google Scholar]
Hartley 2016
- Hartley L, May MD, Loveman E, Colquitt JL, Rees K. Dietary fibre for the primary prevention of cardiovascular disease. Cochrane Database of Systematic Reviews 2016, Issue 1. Art. No: CD011472. [DOI: 10.1002/14651858.CD011472.pub2] [DOI] [PMC free article] [PubMed] [Google Scholar]
Hauner 2012
- Hauner H, Bechthold A, Boeing H, Bronstrup A, Buyken A, Leschik-Bonnet E, et al. Evidence-based guideline of the German Nutrition Society: carbohydrate intake and prevention of nutrition-related diseases. Annals of Nutrition & Metabolism 2012;60(Suppl 1):1-58. [PMID: ] [DOI] [PubMed] [Google Scholar]
Higgins 2011
- Higgins JPT, Green S, editor(s). Cochrane Handbook for Systematic Reviews of Interventions. 5.1 (updated March 2011) edition. Chichester (UK): John Wiley & Sons, 2011. [Google Scholar]
Hooper 2018
- Hooper L, Al‐Khudairy L, Abdelhamid AS, Rees K, Brainard JS, Brown TJ, et al. Omega-6 fats for the primary and secondary prevention of cardiovascular disease. Cochrane Database of Systematic Reviews 2018, Issue 11. Art. No: CD011094. [DOI: 10.1002/14651858.CD011094.pub4] [DOI] [PMC free article] [PubMed] [Google Scholar]
Hooper 2020
- Hooper L, Martin N, Jimoh OF, Kirk C, Foster E, Abdelhamid AS. Reduction in saturated fat intake for cardiovascular disease. Cochrane Database of Systematic Reviews 2020, Issue 5. Art. No: CD011737. [DOI: 10.1002/14651858.CD011737.pub2] [DOI] [PMC free article] [PubMed] [Google Scholar]
Karmali 2018
- Karmali KN, Lloyd-Jones DM, Van der Leeuw J, Goff DC Jr, Yusuf S, Zanchetti A, et al. Blood pressure-lowering treatment strategies based on cardiovascular risk versus blood pressure: a meta-analysis of individual participant data. PLOS Medicine 2018;15(3):e1002538. [PMID: ] [DOI] [PMC free article] [PubMed] [Google Scholar]
Kelly 2017
- Kelly SA, Hartley L, Loveman E, Colquitt JL, Jones HM, Al-Khudairy L, et al. Whole grain cereals for the primary or secondary prevention of cardiovascular disease. Cochrane Database of Systematic Reviews 2017, Issue 8. Art. No: CD005051. [DOI: 10.1002/14651858.CD005051.pub3] [DOI] [PMC free article] [PubMed] [Google Scholar]
Lefebvre 2011
- Lefebvre C, Manheimer E, Glanville J. Chapter 6: Searching for studies. In: Higgins JP, Green S, editors(s). Cochrane Handbook for Systematic Reviews of Interventions.. 5.1 (updated March 2011) edition. Chichester (UK): John Wiley & Sons, 2011. [Google Scholar]
Lewis 2013
- Lewis AS, McCourt HJ, Ennis CN, Bell PM, Courtney CH, McKinley MC, et al. Comparison of 5% versus 15% sucrose intakes as part of a eucaloric diet in overweight and obese subjects: effects on insulin sensitivity, glucose metabolism, vascular compliance, body composition and lipid profile. A randomised controlled trial. Metabolism: Clinical and Experimental 2013;62(5):694-702. [PMID: ] [DOI] [PubMed] [Google Scholar]
Liu 2002
- Liu S, Manson JE, Buring JE, Stampfer MJ, Willett WC, Ridker PM. Relation between a diet with a high glycemic load and plasma concentrations of high-sensitivity C-reactive protein in middle-aged women. American Journal of Clinical Nutrition 2002;75(3):492-8. [PMID: ] [DOI] [PubMed] [Google Scholar]
Maersk 2012
- Maersk M, Belza A, Stodkilde-Jorgensen H, Ringgaard S, Chabanova E, Thomsen H, et al. Sucrose-sweetened beverages increase fat storage in the liver, muscle, and visceral fat depot: a 6-mo randomized intervention study. American Journal of Clinical Nutrition 2012;95(2):283-9. [PMID: ] [DOI] [PubMed] [Google Scholar]
Marshall 2018
- Marshall IJ, Noel-Storr AH, Kuiper J, Thomas J, Wallace BC. Machine learning for identifying randomized controlled trials: an evaluation and practitioner’s guide. Research Synthesis Methods 2018;9:602-14. [DOI] [PMC free article] [PubMed] [Google Scholar]
McDonald 2017
- McDonald S, Noel-Storr AH, Thomas J. Harnessing the efficiencies of machine learning and Cochrane Crowd to identify randomised trials for individual Cochrane reviews. In: Global Evidence Summit, 13–16 September 2017; Cape Town, South Africa. 2017.
Mendis 2011
- Mendis S, Puska P, Norrving B, editor(s). Global Atlas on Cardiovascular Disease, Prevention and Control. Geneva: World Health Organisation, 2011. [Google Scholar]
NECP 2002
- NCEP Expert Panel on Detection, Evaluation, and Treatment of High Blood Cholesterol in Adults. Third report of the National Cholesterol Education Program (NCEP) Expert Panel on Detection, Evaluation, and Treatment of High Blood Cholesterol in Adults (Adult Treatment Panel III) final report. Circulation 2002;106(25):3143-421. [PMID: ] [PubMed] [Google Scholar]
Noel‐Storr 2018
- Noel-Storr AH, Project Transform team. Cochrane Crowd: new ways of working together to produce health evidence. In: Evidence Live 2018, 18—20 June 2018; Oxford, UK. 2018.
Ramne 2018
- Ramne S, Alves Dias J, González-Padilla E, Olsson K, Lindahl B, Engström G, et al. Association between added sugar intake and mortality is nonlinear and dependent on sugar source in 2 Swedish population-based prospective cohorts. American Journal of Clinical Nutrition 2018;108:1-13. [DOI] [PubMed] [Google Scholar]
Rebello 2013
- Rebello CJ, Johnson WD, Martin CK, Xie W, O'Shea M, Kurilich A, et al. Acute effect of oatmeal on subjective measures of appetite and satiety compared to a ready-to-eat breakfast cereal: a randomized crossover trial. Journal of the American College of Nutrition 2013;32(4):272-9. [PMID: ] [DOI] [PubMed] [Google Scholar]
RevMan 2014 [Computer program]
- Review Manager 5 (RevMan 5). Version 5.3. Copenhagen: Nordic Cochrane Centre, The Cochrane Collaboration, 2014.
Roth 2015
- Roth GA, Forouzanfar MH, Moran AE, Barber R, Nguyen G, Feigin VL, et al. Demographic and epidemiologic drivers of global cardiovascular mortality. New England Journal of Medicine 2015;372(14):1333-41. [PMID: ] [DOI] [PMC free article] [PubMed] [Google Scholar]
Schünemann 2018
- Schünemann HJ, Vist GE, Higgins JPT, Santesso N, Deeks JJ, Glasziou P, et al. Chapter 15: Interpreting results and drawing conclusions. In: Higgins JPT, Thomas J, Chandler J, Cumpston MS, Li T, Page MJ, et al, editors(s). Cochrane Handbook for Systematic Reviews of Interventions. draft version (16 September 2018) edition. Chichester (UK): John Wiley & Sons, 2018. [Google Scholar]
Silbernagel 2011
- Silbernagel G, Machann J, Unmuth S, Schick F, Stefan N, Haring HU, et al. Effects of 4-week very-high-fructose/glucose diets on insulin sensitivity, visceral fat and intrahepatic lipids: an exploratory trial. British Journal of Nutrition 2011;106(1):79-86. [PMID: ] [DOI] [PubMed] [Google Scholar]
Sorensen 2005
- Sorensen LB, Raben A, Stender S, Astrup A. Effect of sucrose on inflammatory markers in overweight humans. American Journal of Clinical Nutrition 2005;82(2):421-7. [PMID: ] [DOI] [PubMed] [Google Scholar]
Stanhope 2009
- Stanhope KL, Schwarz JM, Keim NL, Griffen SC, Bremer AA, Graham JL, et al. Consuming fructose-sweetened, not glucose-sweetened, beverages increases visceral adiposity and lipids and decreases insulin sensitivity in overweight/obese humans. Journal of Clinical Investigation 2009;119(5):1322-34. [PMID: ] [DOI] [PMC free article] [PubMed] [Google Scholar]
Stice 2013
- Stice E, Burger KS, Yokum S. Relative ability of fat and sugar tastes to activate reward, gustatory, and somatosensory regions. American Journal of Clinical Nutrition 2013;98(6):1377-84. [PMID: ] [DOI] [PMC free article] [PubMed] [Google Scholar]
Tasevska 2014
- Tasevska N, Park Y, Jiao L, Hollenbeck A, Subar AF, Potischman N. Sugars and risk of mortality in the NIH-AARP Diet and Health study. American Journal of Clinical Nutrition 2014;99(5):1077-88. [PMID: ] [DOI] [PMC free article] [PubMed] [Google Scholar]
Teff 2009
- Teff KL, Grudziak J, Townsend RR, Dunn TN, Grant RW, Adams SH, et al. Endocrine and metabolic effects of consuming fructose- and glucose-sweetened beverages with meals in obese men and women: influence of insulin resistance on plasma triglyceride responses. Journal of Clinical Endocrinology and Metabolism 2009;94(5):1562-9. [PMID: ] [DOI] [PMC free article] [PubMed] [Google Scholar]
Te Morenga 2012
- Te Morenga L, Mallard S, Mann J. Dietary sugars and body weight: systematic review and meta-analyses of randomised controlled trials and cohort studies. BMJ 2012;346:e7492. [PMID: ] [DOI] [PubMed] [Google Scholar]
Te Morenga 2014
- Te Morenga LA, Howatson AJ, Jones RM, Mann J. Dietary sugars and cardiometabolic risk: systematic review and meta-analyses of randomized controlled trials of the effects on blood pressure and lipids. American Journal of Clinical Nutrition 2014;100(1):65-79. [PMID: ] [DOI] [PubMed] [Google Scholar]
Thomas 2017
- Thomas J, Noel-Storr AH, Marshall I, Wallace B, McDonald S, Mavergames C, et al. Living systematic review network. Living systematic reviews: 2. Combining human and machine effort. Journal of Clinical Epidemiology 2017;S0895-4356 (17):30604-2. [DOI] [PubMed] [Google Scholar]
Threapleton 2013
- Threapleton DE, Greenwood DC, Evans CE, Cleghorn CL, Nykjaer C, Woodhead C, et al. Dietary fibre intake and risk of cardiovascular disease: systematic review and meta-analysis. BMJ 2013;347:f6879. [PMID: ] [DOI] [PMC free article] [PubMed] [Google Scholar]
Torres 2015
- Torres N, Guevara-Cruz M, Velazquez-Villegas LA, Tovar AR. Nutrition and atherosclerosis. Archives of Medical Research 2015;46(5):408-26. [PMID: ] [DOI] [PubMed] [Google Scholar]
Wittekind 2014
- Wittekind A, Walton J. Worldwide trends in dietary sugars intake. Nutrition Research Reviews 2014;27(2):330-45. [PMID: ] [DOI] [PubMed] [Google Scholar]
World Cancer Research Fund International 2015
- World Cancer Research Fund International. Curbing Global Sugar Consumption: Effective Food Policy Actions to Help Promote Healthy Diets and Tackle Obesity. London: World Cancer Research Fund International, 2015. [Google Scholar]
World Health Organization 2015
- World Health Organization. Guideline: Sugar Intake for Adults and Children. Geneva: World Health Organisation, 2015. [Google Scholar]
World Health Organization 2017
- World Health Organization. Cardiovascular diseases (CVDs). www.who.int/en/news-room/fact-sheets/detail/cardiovascular-diseases-(cvds) (accessed 7 December 2018).
Xi 2015
- Xi B, Huang Y, Reilly KH, Li S, Zheng R, Barrio-Lopez MT, et al. Sugar-sweetened beverages and risk of hypertension and CVD: a dose-response meta-analysis. British Journal of Nutrition 2015;113(5):709-17. [PMID: ] [DOI] [PubMed] [Google Scholar]
Yang 2014
- Yang Q, Zhang Z, Gregg EW, Flanders WD, Merritt R, Hu FB. Added sugar intake and cardiovascular diseases mortality among US adults. JAMA Internal Medicine 2014;174(4):516-24. [PMID: ] [DOI] [PMC free article] [PubMed] [Google Scholar]
Ye 2012
- Ye EQ, Chacko SA, Chou EL, Kugizaki M, Liu S. Greater whole-grain intake is associated with lower risk of type 2 diabetes, cardiovascular disease, and weight gain. Journal of Nutrition 2012;142(7):1304-13. [PMID: ] [DOI] [PMC free article] [PubMed] [Google Scholar]
Zhang 2013
- Zhang YH, An T, Zhang RC, Zhou Q, Huang Y, Zhang J. Very high fructose intake increases serum LDL-cholesterol and total cholesterol: a meta-analysis of controlled feeding trials. Journal of Nutrition 2013;143(9):1391-8. [PMID: ] [DOI] [PubMed] [Google Scholar]
References to other published versions of this review
Bergwall 2019
- Bergwall S, Ramne S, Sonestedt E, Acosta S. High versus low added sugar consumption for the primaryprevention of cardiovascular disease. Cochrane Database of Systematic Reviews 2019, Issue 4. Art. No: CD013320. [DOI: 10.1002/14651858.CD013320] [DOI] [PMC free article] [PubMed] [Google Scholar]