Abstract
Liquid chromatography-high resolution mass spectrometry (LC-MS)-based metabolomics aims to identify and quantitate all metabolites, but most LC-MS peaks remain unidentified. Here, we present a global network optimization approach, NetID, to annotate untargeted LC-MS metabolomics data. The approach aims to generate, for all experimentally observed ion peaks, annotations that match the measured masses, retention times, and (when available) MS/MS fragmentation patterns. Peaks are connected based on mass differences reflecting adducting, fragmentation, isotopes, or feasible biochemical transformations. Global optimization generates a single network linking most observed ion peaks, enhances peak assignment accuracy, and produces chemically-informative peak-peak relationships, including for peaks lacking MS/MS spectra. Applying this approach to yeast and mouse data, we identified five previously unrecognized metabolites (thiamine derivatives and N-glucosyl-taurine). Isotope tracer studies indicate active flux through these metabolites. Thus, NetID applies existing metabolomic knowledge and global optimization to substantially improve annotation coverage and accuracy in untargeted metabolomics datasets, facilitating metabolite discovery.
Introduction
Metabolomics provides a snapshot of the concentrations of detectable small molecules in a biological system. In doing so, it reflects the integrated impact of genetics and environment on metabolism. One important role of metabolomics is annotating previously unknown or underappreciated metabolites. For example, metabolomics facilitated identification of 2-hydroxyglutarate as an oncometabolite, eventually leading to the development of inhibitors of 2-hydroxyglutarate synthesis as anticancer agents1,2. Metabolomics also contributed to the identification of a diversity of natural products3,4 and disease biomarkers5.
A common experimental strategy in metabolomics is liquid chromatography-high resolution mass spectrometry (LC-MS). LC-MS metabolomics measures thousands of ion peaks, of which hundreds are associated with known metabolites. A much greater number of peaks, however, remain unannotated. A common approach to peak annotation is to compare exact mass and either retention time or MS/MS (MS2) fragmentation pattern to authenticated standards. To facilitate such comparisons, extensive molecular structural databases (Pubchem6, HMDB7, KEGG8, ChemSpider9), MS2 spectral databases (METLIN10, GNPS11, MassBank12–14 and NIST15), and software (e.g. XCMS16,17, GNPS11, SIRIUS18 and MS-DIAL19) have been developed. Peaks can also arise from mass spectrometry phenomena, such as adducts, fragments or isotopes of metabolites20–24. Such peaks seem to account for at least half of non-background LC-MS features25–27. Despite this progress, a great number of unknown peaks remain, and figuring out their identities is a primary challenge in the field.
Network analysis, capitalizing on peak-peak relationships to increase annotation scope and accuracy, has been broadly used in metabolomics data annotation. Workflows employing the concept of molecular connectivity have been used to build networks (e.g., GNPS28–30, CANOPUS31, MetDNA32, CliqueMS33 and others34–37). Ions connected by either biochemistry or mass spectrometry phenomena often share MS2 fragmentation pattern similarity. While distinct metabolites typically separate chromatographically, ions connected through mass spectrometry phenomena co-elute.
Metabolite discovery involves generation of candidate molecular formulae beyond those in current databases. This can be achieved by modifying formulae of known metabolites using characteristic biochemically feasible atom transformations that match observed MS1 mass differences36,38 (e.g. 2.016 for 2H). Such approaches can be combined with clustering metabolites based on similar MS2 fragmentation patterns in a molecular network, as demonstrated in GNPS and other works28–30,32,39. In a cluster of connected peaks, one known metabolite peak can help to annotate its neighbors, facilitating unknown discovery. One state-of-the-art database-independent method to generate novel candidate molecular formulae (SIRIUS 4.0) combines high-resolution m/z, natural isotope abundances, and MS2 spectral analyses18.
Most existing methods focus on annotation of either individual peaks or a subnetwork of peaks. Every peak can be sequentially assessed, but individual annotations do not make full use of available information regarding all other peaks in the network. In contrast, global optimization methods can consider peak annotations not one-by-one, but instead all at once to take full advantage of the entire available information. One effort in this direction involves using Gibbs-sampling statistics and probabilistic peak annotation, taking into account biochemical connections, isotope patterns, and adduct relationships40–42. This strategy has been combined with the MS2-based annotation SIRIUS algorithm to shift the probabilities of candidate peak annotations, improving annotations results43.
Here we explore an alternative global optimization strategy, integer linear programming. Optimization via integer linear programming has been successfully applied across fields, such as production planning and vehicle scheduling, in addition to computational and systems biology44–47. Computationally, it ensures convergence to the globally optimal solution, and, due to linear formulation of the problem, can be efficient in practice, enabling application to large networks.
To our knowledge, integer linear programming optimization has not been previously applied for metabolomics data annotation. To this end, we present a stand-alone algorithm “NetID.” The algorithm optimizes a network of mass spectrometry peak connections based on MS1 mass differences corresponding to gain or loss of relevant chemical moieties and MS2 spectral similarity, in a manner that differentiates biochemical connections from those based on mass spectrometry phenomena, and that incorporates literature data on known metabolites and their retention times.
We applied this integer linear programming optimization approach to untargeted metabolomics data from both Baker’s yeast and mouse liver. The global optimization step enforces a single formula assignment for each experimentally observed ion peak, increasing annotation accuracy as estimated by a target–decoy strategy48. Through these efforts, we provide likely formulae for several hundred potential metabolites that are not yet annotated and confirm the identities of five previously unrecognized metabolites.
Results
NetID algorithm
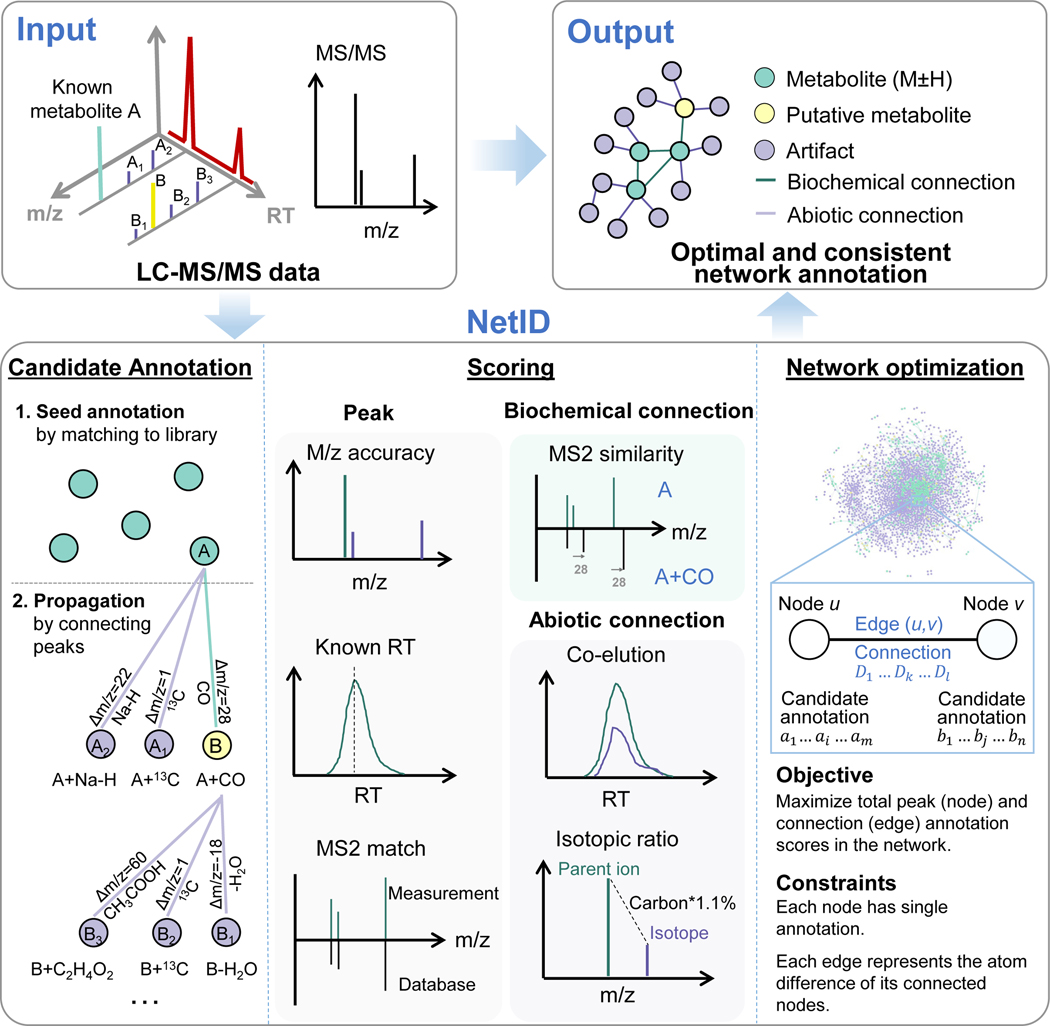
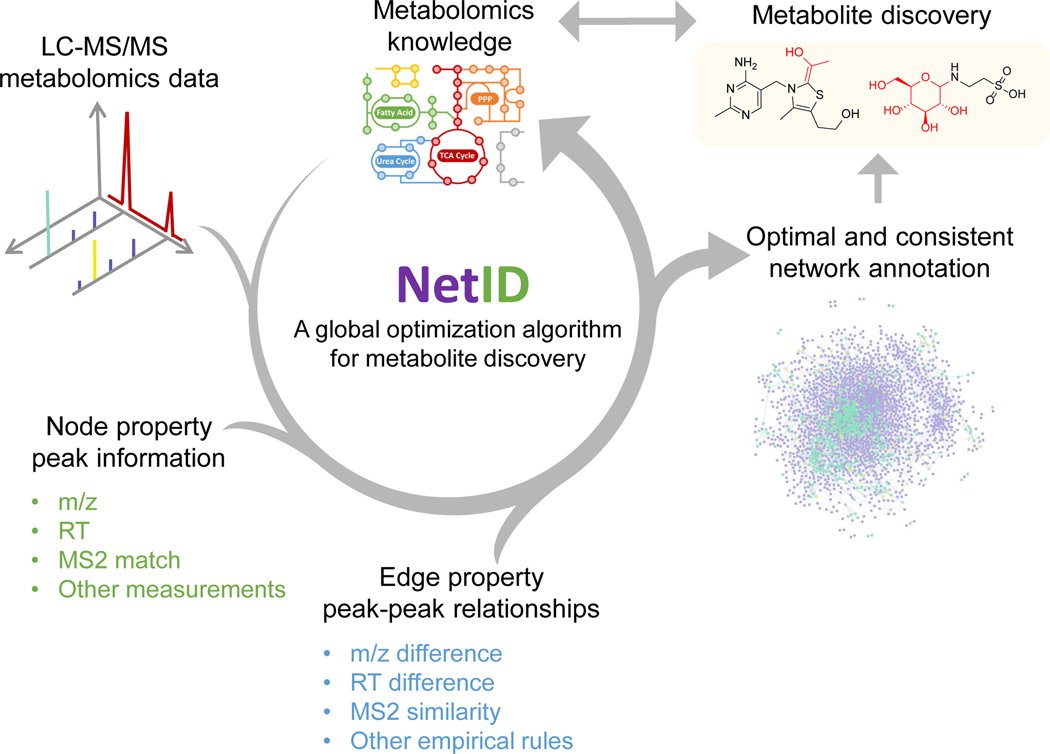
NetID involves three computational steps: candidate annotation, scoring, and network optimization (Figure 1). The workflow starts with a peak table that contains a list of peaks’ m/z, RT, intensity, and (when available) associated MS2 spectra, with background peaks removed by comparing with a process blank sample. Each peak defines a node in the network. In the candidate annotation phase, we match every node’s experimentally measured m/z to formulae in the selected metabolomics database (e.g. HMDB). Peaks matching to database formula within 10 ppm are assigned as seed nodes with candidate seed formulae, from which we extend edges to build the network.
Figure 1. A global network optimization approach for untargeted metabolomics data annotation (NetID).
The input data are LC-MS peaks with m/z, retention times, intensities and optional MS2 spectra. The output is a molecular network with peaks (nodes) assigned with unique formulae and connected by edges reflecting atom differences arising either through metabolism (biochemical connection) or mass spectrometry phenomenon (abiotic connection). Peaks are classified as “metabolite” (M+H or M-H peak of formula found in selected metabolomics database, e.g. HMDB), “putative metabolite” (formula not found in database but with biochemical connection to a metabolite), or “artifact” (only abiotic connection to a metabolite). NetID algorithm involves three steps. Candidate annotation first matches peaks to database formulae. These seed annotations are then extended through edges to cover most nodes, with the majority of nodes receiving multiple formula annotations. Each node and edge annotation are then scored based on match to known masses, retention times, and MS/MS fragmentation patterns. Global network optimization maximizes sum of node scores and edge scores, while enforcing a unique formula for each node and a unique transformation relationship for each edge.
Edges connect two nodes via gain or loss of specific chemical moieties (atoms). The atom differences can occur either due to metabolism (biochemical connection) or due to mass spectrometry phenomena (abiotic connections). For example, a difference of 2H suggests an oxidation/reduction relationship and defines a biochemical edge. A difference of Na-H suggests sodium adducting and is a type of abiotic edge (adduct edge). Other atom differences define other types of abiotic connections (isotope or fragment edges). Most atom differences are specific to biochemical, adduct, isotope, or fragment edges, but a few occur in multiple categories. For example, H2O loss can be either biochemical (enzymatic dehydration) or abiotic (in-source water loss). By integrating literature and in-house data, we assembled a list of 25 biochemical atom differences and 59 abiotic atom differences which together define all connections in the network (Supplementary Table 1, 2, Supplementary Data 1). Using these lists, we make candidate edge annotations such that (i) Δm/z between the connected nodes matches the atom mass difference and (ii) only co-eluting peaks are connected by abiotic edges. Through the edge extension process starting from the seed nodes, candidate formulae are assigned to nodes outside the initial seeds. A few rounds of edge extension suffice to give thorough coverage (see Methods). Due to finite mass measurement precision, a single node (including a seed node) may be assigned multiple contradictory candidate formulae, which are resolved at the following scoring and optimization step.
NetID then scores every candidate node and edge annotation. Candidate node annotations are scored based on precision of m/z match to the molecular formula and (when the relevant information is available) precision of retention time match to known metabolite retention time and quality of MS2 spectra match to database structure. In addition, there is a bonus for matching to formula in HMDB and a penalty for unlikely formulae (e.g. containing an uncommon elemental ratio or extreme number of ring and double bond equivalents)49. Biochemical edges receive a positive score for MS2 spectra similarity between the connected nodes. Abiotic edges are scored based on precision of co-elution with the parent metabolite, connection type (adduct, isotope, etc.), and features specific to the connection type, such as expected natural abundance for isotope peaks (see Methods and Supplementary Note 1). The overall impact is to assign high scores to those candidate annotations that effectively align the experimentally observed ion peaks with prior metabolomics knowledge.
With a score assigned for each candidate node and edge annotation, we formulate the global network optimization problem as that of maximizing the network score with linear constraints that each node and edge has a single annotation and that they are consistent (e.g. peaks connected by H2 edge must have formula differing by 2H). Such optimization is readily performed by linear programming with a typical runtime of minutes to hours on a personal computer, and results in an optimal and consistent network annotation.
Global network optimization
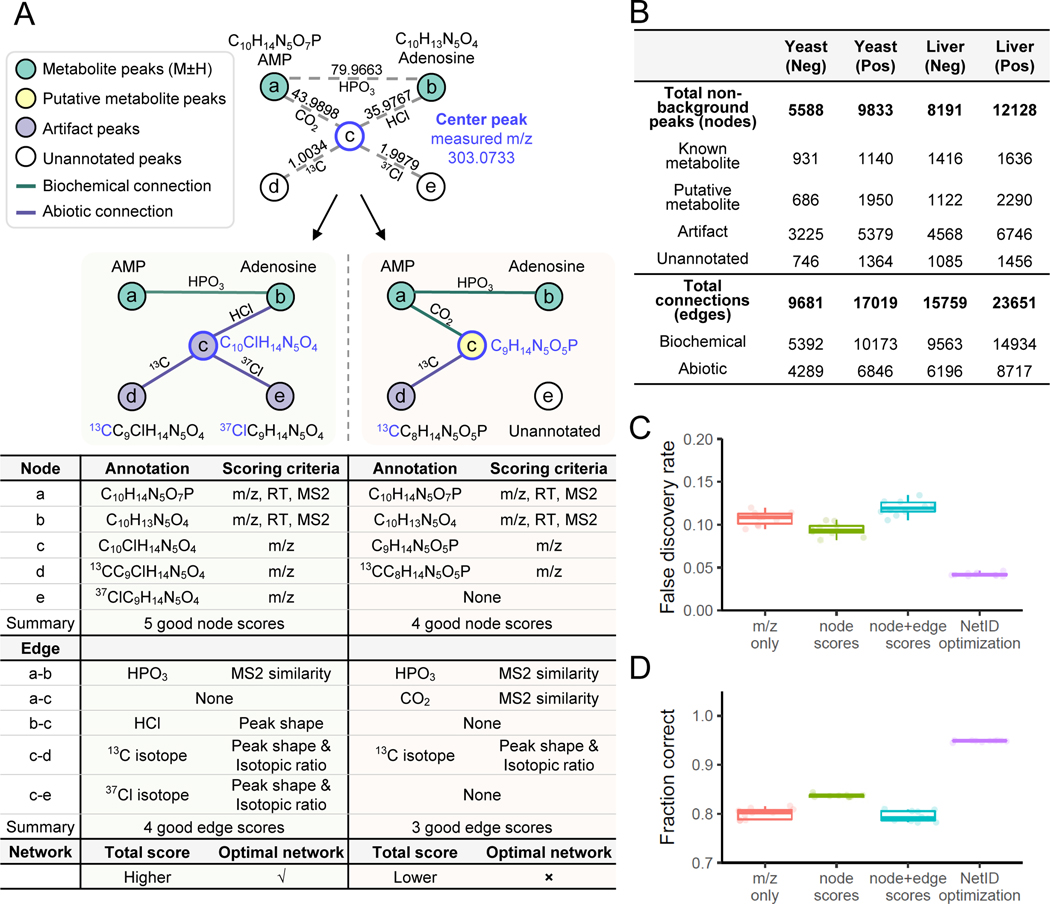
As an example of the utility of global network optimization, where all peaks and connections are simultaneously considered to enhance annotation accuracy, we present an example network containing five peaks (Figure 2A). We first match experimental measurements to the database, assigning node a and node b as seed nodes adenosine monophosphate (AMP, C10H14N5O7P) and adenosine (C10H13N5O4), respectively. We also identify five possible connections between the five nodes. Two alternative networks are generated by extending from seed assignments. In the left network, node c is annotated as adenosine HCl adduct (C10ClH14N5O4), whereas in the right network, node c is (mis)annotated as a putative metabolite (C9H14N5O5P) resulting from CO2 loss from AMP. Node d is 13C isotope of node c in both networks. Node e is annotated as 37Cl isotope of node c in the left network, and is unannotated in the right network because there is no Cl atom in the parent molecule.
Figure 2. Utility of global network optimization.
(A) An example network demonstrating the value of the global optimization step in NetID. Node a and node b match database formulae and are connected by an edge of phosphate (HPO3). Node c can be connected to either node a or node b through mutually incompatible annotations, resulting in two different candidate networks. The table below the two candidate networks shows the annotations and scoring criteria for each, with the left network preferred for more good node and edge annotations. (B) Summary table of NetID annotations of negative and positive mode LC-MS data from Baker’s yeast and mouse liver. (C) False discovery rate estimated using target-decoy strategy. Each data point (circle) is from a different randomized decoy library. (D) Fraction of 314 manually curated “ground truth” annotations made correctly. N = 10 randomized libraries were tested for C and D. Boxes show median and IQR and whiskers extend to largest and smallest value no further than ±1.5 × IQR from hinge.
The left network has a higher total node and edge annotation score than the right network, and thus is selected by NetID. This selection makes sense to an experienced mass spectrometrist: the 37Cl isotope signature in node e indicates that node c should contain Cl. The power of NetID is that it automatically captures such logic, and uses the power of global computational optimization to extend such inferences across the network in an automated manner.
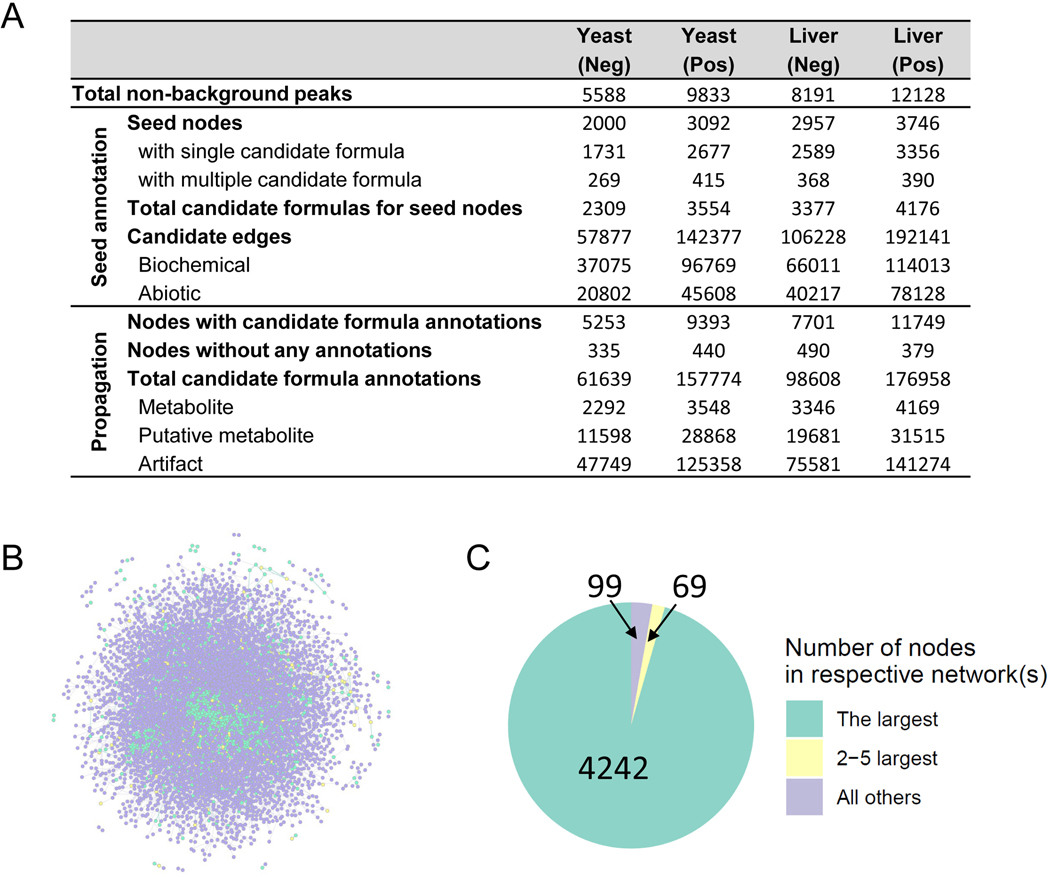
We applied the NetID algorithm to yeast and liver datasets, in both positive and negative ionization mode (Figure 2B, Extended Data Fig. 1A). Raw LC-MS data from replicate yeast or liver samples were analyzed together by peak-picking software (El-MAVEN50) to generate a single list of peaks consistently found for that sample type and ionization mode. Yeast data were MS1 only, while liver data included targeted MS2 spectra. Considering the example of negative mode yeast data with a total of 5,588 non-background peaks, in the candidate annotation step, roughly 1,600 potential formulae were assigned to 1,400 peaks, with about 200 peaks receiving multiple formula annotations. These nodes were connected by just over 50,000 potential edges. Edge extension expanded coverage to over 5,000 nodes with an average of twelve potential formulae each, highlighting the importance of scoring and network optimization to assign proper formulae. After scoring node and edge annotations, global network optimization settled on about 4,800 unique node annotations. About 20% of the annotated peaks were metabolites (formula corresponding to M ±H monoisotopic peak existed in database), 14% were putative metabolites (formula not in database but with biochemical connection to a metabolite), and the rest were mass spectrometry phenomena, such as adducts, fragments, isotopes. Thus, after thorough background ion removal, we assign a few thousand peaks as likely metabolite ions and the majority as mass spectrometry artifacts. Orthogonal approaches such as credentialing via isotope labeling27 similarly assign the majority of peaks as mass spectrometry artifacts, but annotate fewer peaks as likely metabolites than NetID.
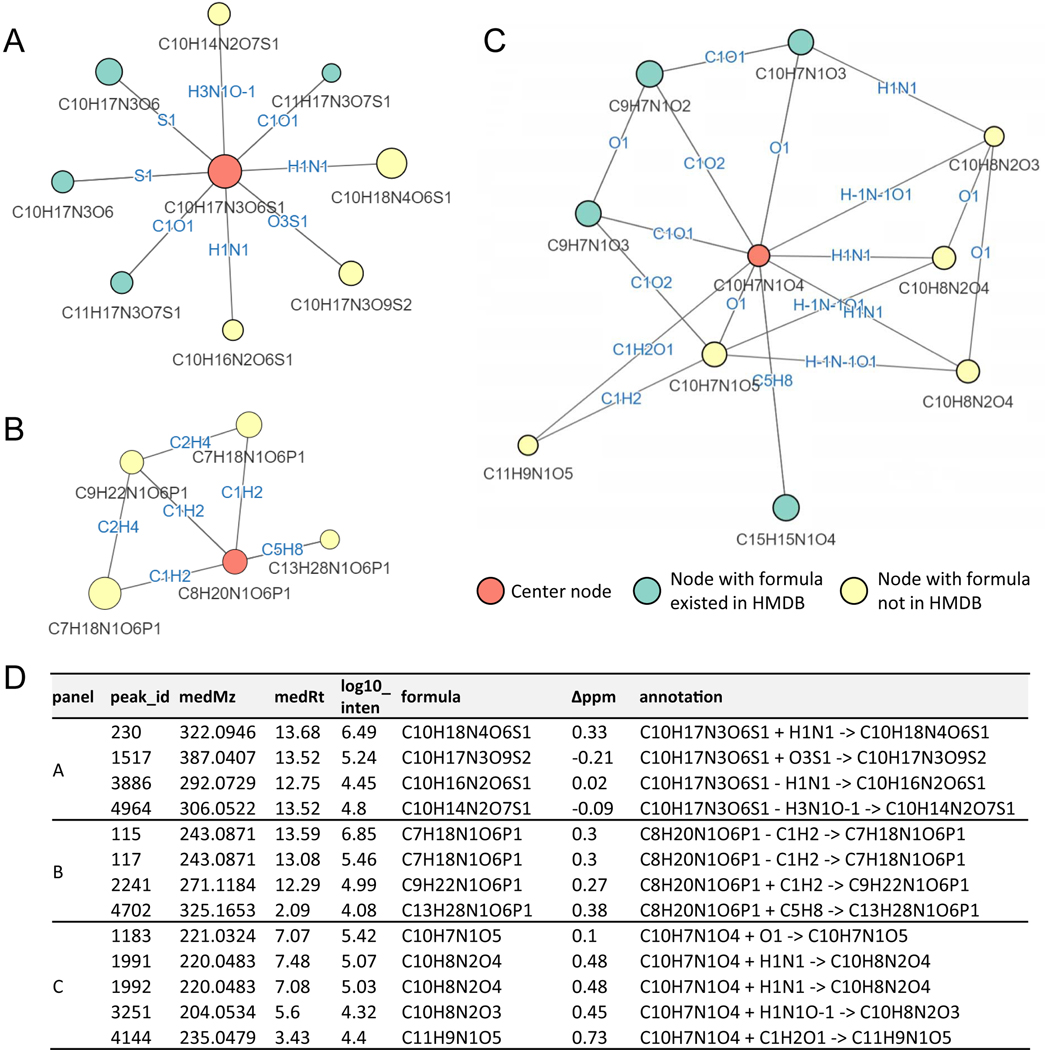
The roughly 5000 nodes were connected by about 10,000 edges. Two nodes share each edge, with each node connected by an average of four edges. These edges were roughly evenly split between biochemical and abiotic connections (Figure 2B, Extended Data Fig. 1A,B). More than 90% of annotated nodes fell into a single dominant connected network (Extended Data Fig. 1C), reflecting most peaks being connected to core metabolism. About 15% of peaks (737/5588), however, remained unannotated (Figure 2B). These unannotated peaks likely reflect deficiencies in our lists of allowed atom differences, including additional forms of mass spectrometry phenomena. For example, manual examination of the unconnected peaks revealed a dozen nickel adducts of known metabolites (Supplementary Table. 3). The annotated peaks included several hundred formulae for putative metabolites (Extended Data Fig. 2, Supplementary Data 2).
Performance validation
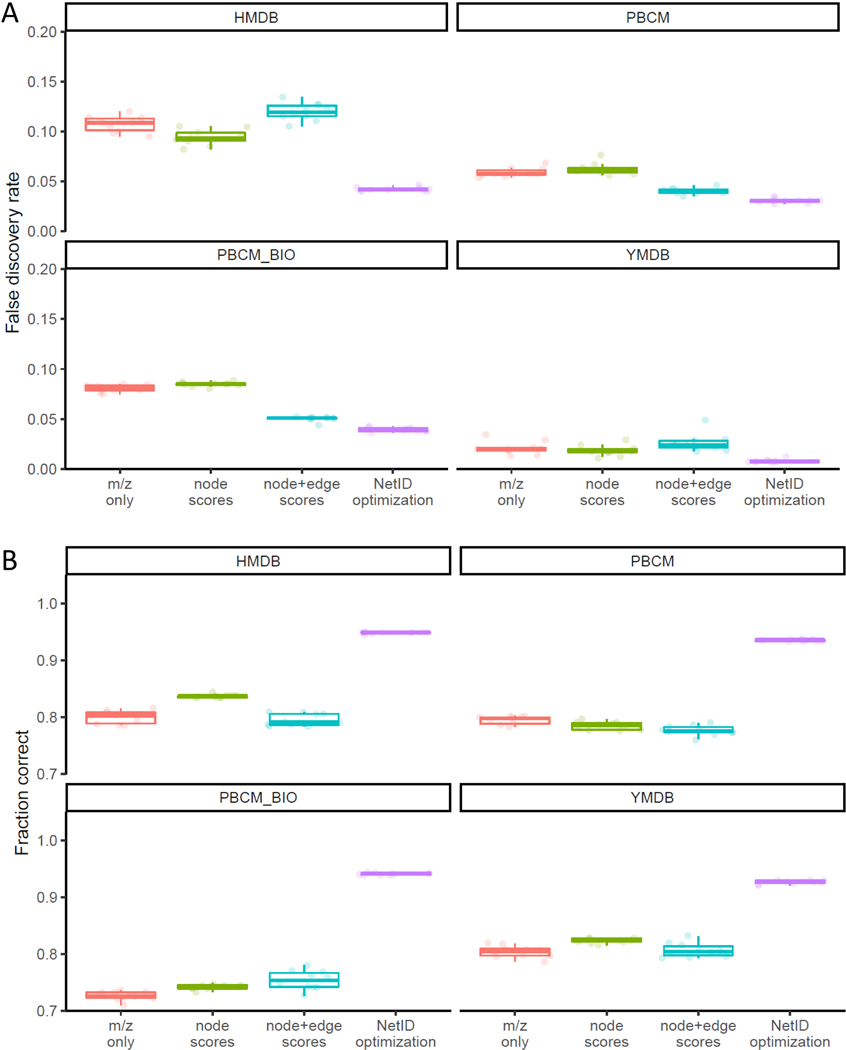
We evaluated the performance of the NetID algorithm using the negative mode yeast data (MS1 only) under the same parameter settings as above (Figure 2C,D). We first employed a target-decoy estimation strategy, in which we intentionally introduce formulae with biologically unreasonable elements, and test whether our annotation strategy effectively avoids annotating peaks with these fake formulae51,52. Assessments were made using several different metabolite databases (HMDB7, YMDB53, PubChemLite.0.2.054, and a subset of biopathway related entries in PubChemLite.0.2.0). As expected, the smaller databases yielded fewer false identifications. Importantly, across all of the databases, NetID more effectively selected appropriate formulae (lower false discovery rate) compared to methods considering m/z only, node scores only, or both node and edge scores but without global optimization (Figure 2C, Extended Data Fig. 3A).
As an orthogonal means of testing the algorithm, we manually curated 314 peaks as known annotations (Supplementary Data 2), and assessed the fraction annotated correctly. Across databases, NetID resulted in more accurate annotations of these gold standard peaks, with the number of incorrect annotations roughly an order of magnitude lower for NetID compared to node or combined node and edge scores without global optimization (Figure 2D, Extended Data Fig. 3B).
Thiamine-derived metabolites
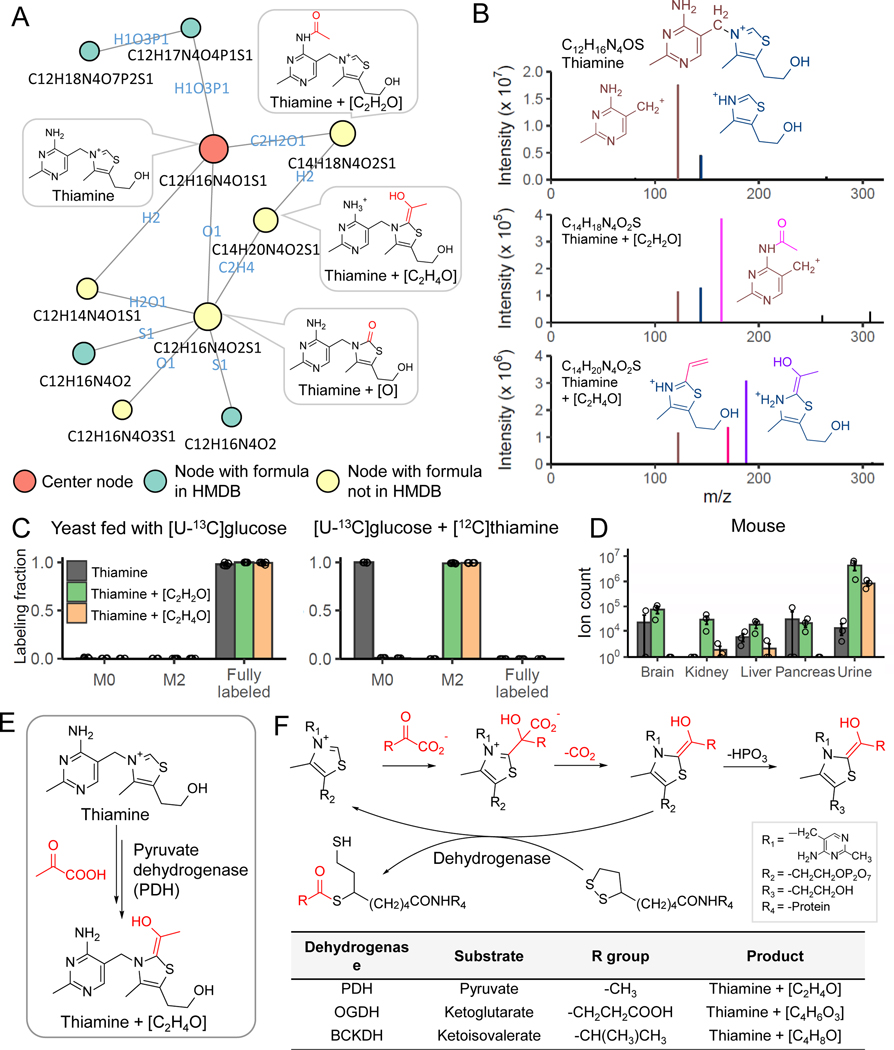
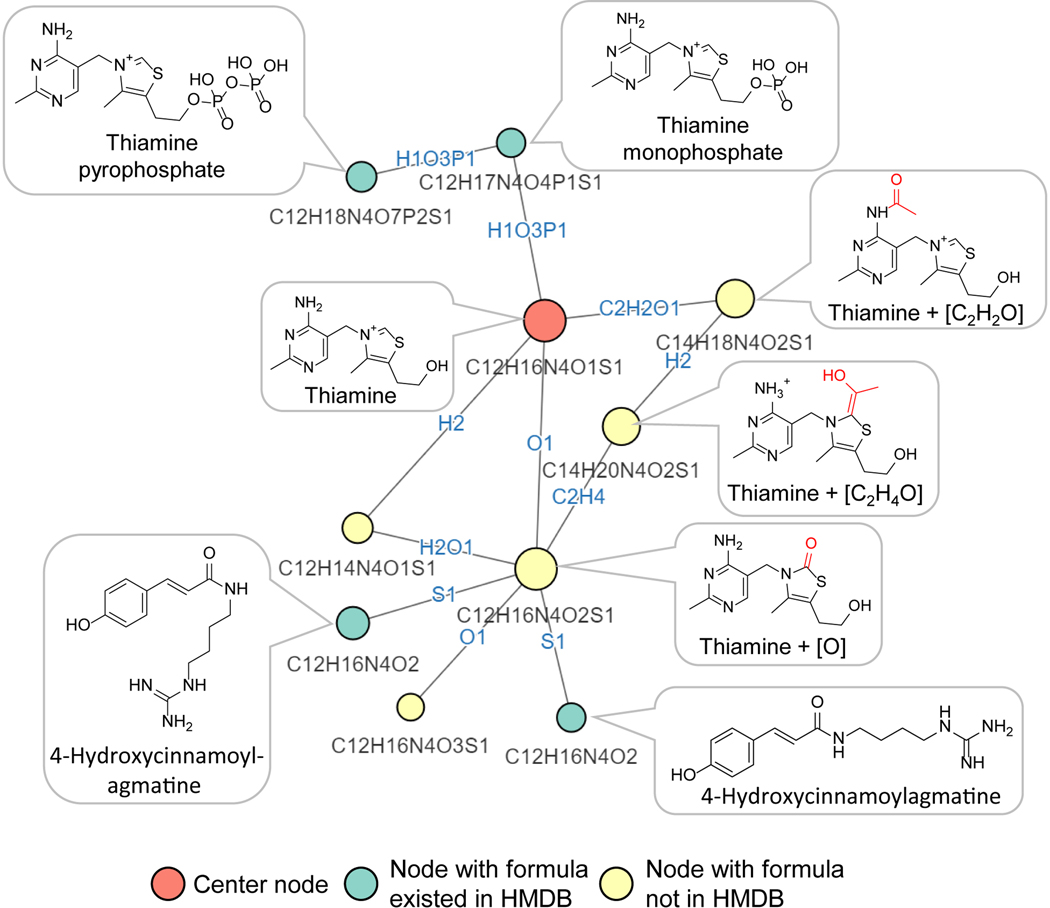
Among the putative metabolites in the yeast metabolomics dataset, we found three with ion count > 105 that are connected in a subnetwork around thiamine. Their formulae are C12H16N4O2S (thiamine+O), C14H20N4O2S (thiamine+C2H2O) and C14H18N4O2S, (thiamine+C2H4O) (Figure 3A, Extended Data Fig. 4). These formula assignments and connections were initially obtained without MS2 spectra being available, reflecting the ability of NetID to make accurate formula assignments and connections based on MS1 data (combined with other peak attributes like retention time). While not found in HMDB, thiamine+O is documented in METLIN as a thiamine oxidation product, so we focused on the other two potential thiamine derivatives.
Figure 3. NetID reveals thiamine-derived metabolites in yeast.
(A) Subnetwork surrounding thiamine. Nodes, connections, and formulae are direct output of NetID. Boxes with structures were manually added. (B) MS2 spectra of thiamine, thiamine+C2H2O, and thiamine+C2H4O, with proposed structures of the major fragments. (C) Labeling fraction of thiamine and its derivatives, in [U-13C]glucose with and without unlabeled thiamine in the medium (n = 5). (D) The thiamine derivatives are also found in mouse tissues and urine (n=3). (E) Proposed mechanism for formation of thiamine+C2H4O. Pyruvate dehydrogenase (PDH) decarboxylates pyruvate, and adds the resulting [C2H4O] unit (in red) to thiamine. (F) The same enzymatic mechanism occurs in oxoglutarate dehydrogenase (OGDH) and branched-chain α-ketoacid dehydrogenase complex (BCKDC), and generates thiamine+C4H6O3 and thiamine+C4H8O respectively. Bar represents mean values and error bar indicates s.d. in (C) and s.e. in (D).
MS2 spectra of the putative thiamine+C2H2O and thiamine+C2H4O contained characteristic thiamine fragments. Both contained a classical pyrimidine fragment, with thiamine+C2H2O also containing an acetylated pyrimidine fragment, leading to a probable structure (Figure 3A,B). The structural assignment is further supported by the presence of an unmodified thiazole fragment. In contrast, thiamine+C2H4O lacked a classical unmodified thiazole fragment, instead showing a thiazole+C2H4O fragment (and a fragment with further water loss) (Figure 3A,B).
Isotope tracing experiments further confirmed these two peaks contain thiamine. When fed [U-13C]glucose as the sole carbon source, yeast synthesize thiamine de novo, resulting in fully labeled thiamine species, with carbon counts matching the NetID formula assignments (Figure 3C). Adding unlabeled thiamine to the [U-13C]glucose culture media, yeast uptake the unlabeled thiamine, resulting in unlabeled thiamine and M+2 labeled thiamine+C2H2O and thiamine+C2H4O species. Although discovered in yeast, these are conserved metabolites, found also in mammalian samples (Figure 3D).
Acetylation is one of the 25 biochemical atom transformations allowed in NetID, while the addition of C2H4O is much less common biochemically. Accordingly, we looked into thiamine metabolism to explore how thiamine+C2H4O might be produced. Thiamine pyrophosphate is an important cofactor in pyruvate dehydrogenase (PDH, the entry step of carbohydrate to TCA cycle) (Figure 3E). The de-pyrophosphorylation product of thiamine pyrophosphate intermediate in PDH reaction yields thiamine+C2H4O (Figure 3F).
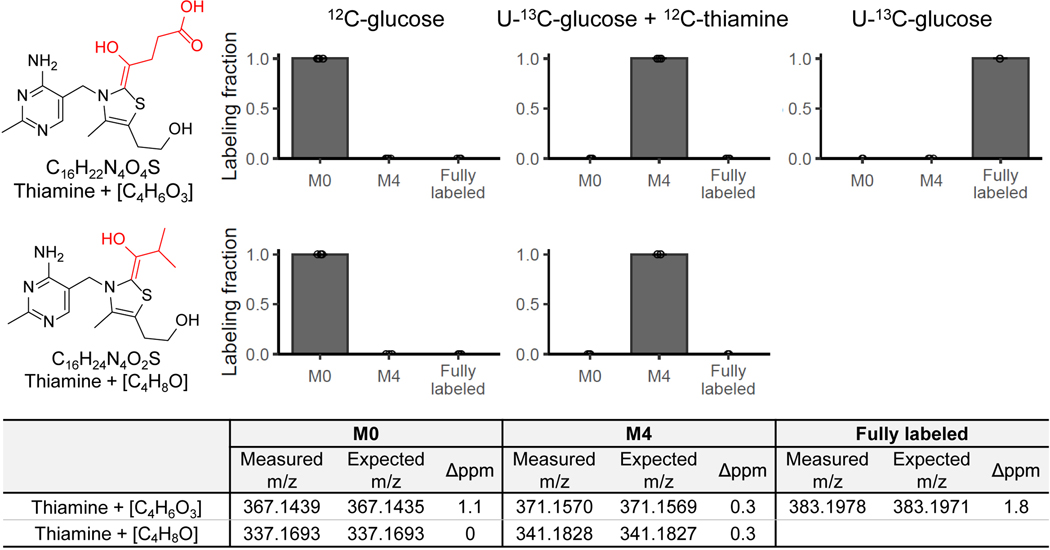
Based on this biochemical route, we realized that analogous products could be formed by α-ketoglutarate dehydrogenase (thiamine+C4H6O3) and branched-chain keto acid dehydrogenase (thiamine+C4H8O) (Figure 3F). Peaks at both of these exact masses were also experimentally observed, with isotope labeling results supporting their being thiamine-derived metabolites (Extended Data Fig. 5). Thus, NetID enabled the identification of four thiamine-derived metabolites that were not present in metabolomics databases (Supplementary Table 4).
N-glucosyl-taurine
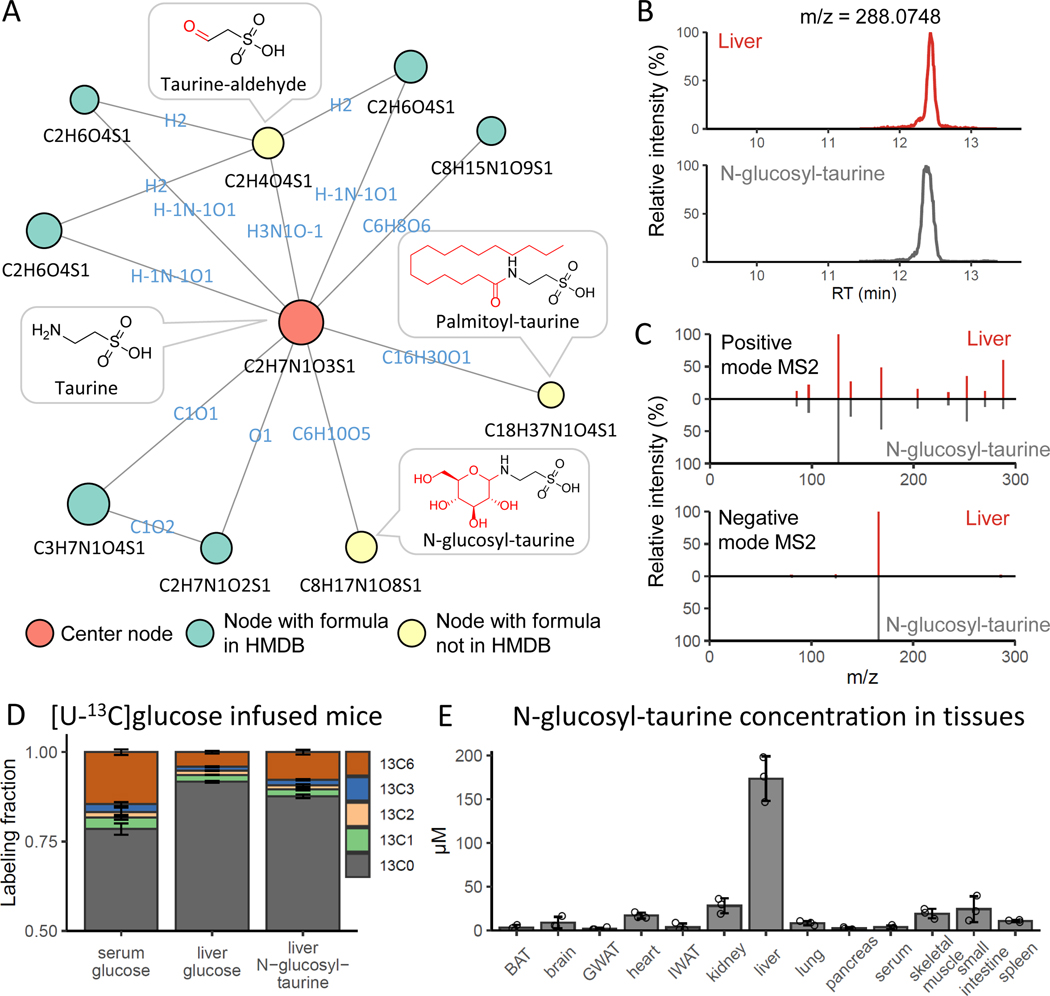
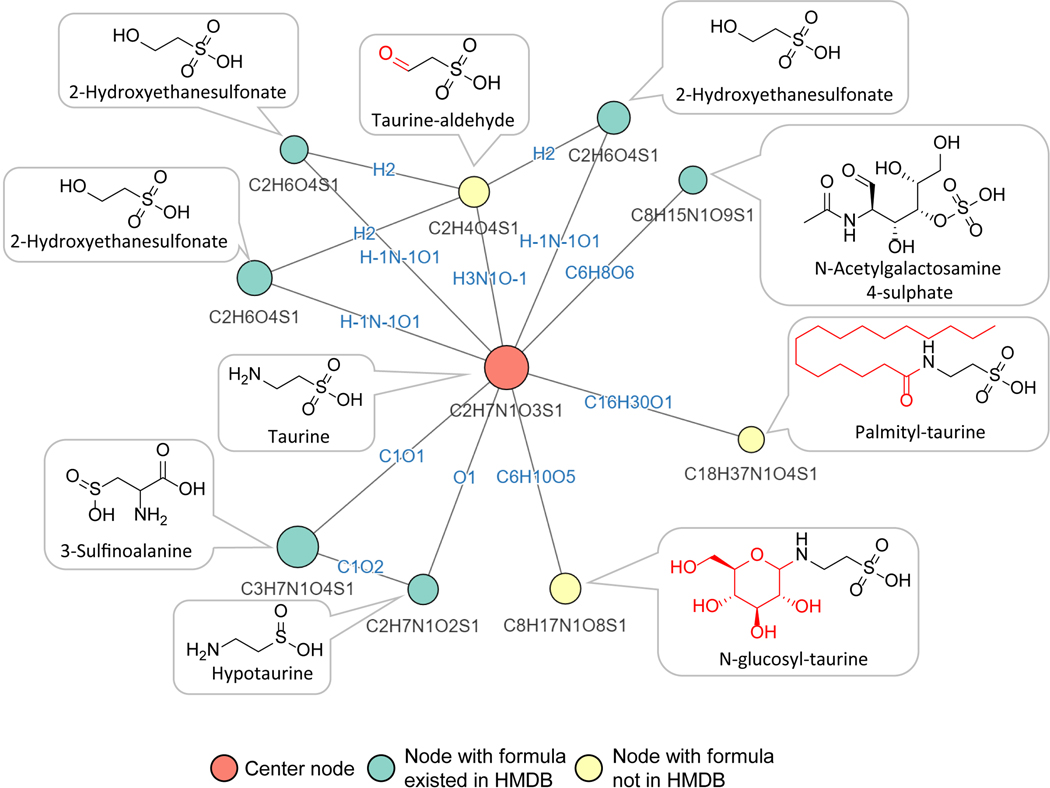
We similarly carried out NetID annotation of a mouse liver dataset. We observed multiple putative metabolite peaks linked to taurine, by apparent glucosylation (+C6H10O5), palmitoylation (+C16H30O) and transamination (+O-NH3) (Figure 4A, Extended Data Fig. 6). Like the thiamine-related peaks, these were initially correctly annotated without relying on MS2 data. While all were missing in HMDB, the latter two were found in METLIN: N-palmitoyl taurine (C18H37NO4S) and sulfoacetaldehyde (C2H4O4S). Pubchem contains an entry for N-glucosyl-taurine (C8H17NO8S) as a synthetic chemical but no database previously suggested it is a metabolite. To confirm the structure of the putative taurine glucosylation product (C8H17NO8S), we chemically synthesized N-glucosyl-taurine (Extended Data Fig. 7, Supplementary Note 2). Synthetic N-glucosyl-taurine matched the retention time and MS2 fragmentation pattern of the observed C8H17NO8S peak (Figure 4B,C). In liver samples of mice infused with [U-13C]glucose, C8H17NO8S appeared in M+6 form, suggesting active biosynthesis of N-glucosyl-taurine from circulating glucose (Figure 4D). N-glucosyl-taurine was not observed in yeast extract but was detected in multiple mouse tissues. Search for peaks matching the N-glucosyl-taurine MS2 spectra using MASST identified matches in both mouse and human samples thus translating these findings in an animal to humans55. Quantitation using the synthetic standard shows that the liver has the highest level of glucosyl-taurine at ~170 μM (Figure 4E, Extended Data Fig. 8). This ranks among the few dozen most abundant liver metabolites.
Figure 4. NetID discovers mammalian taurine derivatives.
(A) Subnetwork surrounding taurine from mouse liver extract data. Nodes, connections, and formulae are direct output of NetID. Boxes with structures were manually added. (B) LC-MS chromatogram of N-glucosyl-taurine standard and the putative glucosyl-taurine from liver extract. (C) Top 10 abundant ion peaks in MS2 spectrum of glucosyl-taurine peak from liver extract (top), and synthetic N-glucosyl-taurine standard (bottom). (D) Isotope labeling pattern of putative glucosyl-taurine in mice, infused via jugular vein catheter for 2 h with [U-13C]glucose (n=3). (E) Absolute N-glucosyl-taurine concentration in murine serum and tissues (n=3). Bar represents mean values and error bar indicates s.d. in (D) and s.e. in (E).
Discussion
The advent of LC-MS metabolomics revealed tens of thousands of metabolite peaks not matching known formulae, raising the possibility that the majority of metabolites remained to be discovered. While the biosphere likely contains many novel metabolites, it has been increasingly recognized that most peaks in typical untargeted metabolomics studies do not arise from novel metabolites, but rather mass spectrometry phenomena. The goal of comprehensively annotating untargeted metabolomics peaks with molecular formulae has, however, remained elusive.
One promising strategy for peak annotation involves building networks where nodes are LC-MS peaks (with associated molecular formulae) and edges are atom transformations linking the peaks. Here we advance this strategy by combining metabolomics knowledge with computational global optimization. We explicitly differentiate between biochemical connections reflecting metabolic activity and abiotic connections arising from mass spectrometry phenomena. By formulating the peak annotation challenge as a linear programming problem, we identify an optimal network in light of all observed peaks. Rather than weeding out peaks from mass spectrometry phenomena like adducts and natural isotopes, this approach takes advantage of the information embedded in them. It further provides traceable peak-peak relationships, which illuminate the basis for assigned formulae and suggest candidate structures.
Applying this approach to untargeted LC-MS data from yeast and liver samples, we assign formulae to roughly three-quarters of all non-background peaks. In each of positive and negative mode, the annotated peaks cover about 1000 known metabolites, with on average three mass peaks for every metabolite or putative metabolite (e.g. M+H plus two adduct or isotope peaks). This leaves a couple thousand unannotated peaks from each LC-MS run. Based on the observed ratio between peaks and metabolites, this likely correspond to hundreds (but not thousands) of unidentified metabolites. Importantly, this approach has already generated likely formulae for many hundreds of putative metabolites (Extended Data Fig. 2, Supplementary Data 2), including five species for which we assign structures (Figure 3, 4).
Isomers are an important source of metabolome structural diversity but are indistinguishable by MS1. The present approach ignores co-eluting isomers, thereby potentially underestimating the number of unidentified metabolites. Future efforts with additional chromatography approaches and enhanced MS2 depth can help. In parallel, it will be valuable to expand the list of feasible mass spectrometry adducts, as uncommon adducts, such as the nickel adducts that we discovered here, may account for many of the peaks that persistently lack formula annotation. Complementary efforts on both of these fronts should provide a more accurate count of unidentified metabolites.
To assign formulae and eventually structures to these unidentified metabolites, integration of concepts from both NetID and literature approaches that better capitalize on the full information present in MS2 data is a promising future direction. How might such integration work? One strategy is to use formulae predictions from SIRIUS18, MS-DIAL19, or software integrating multiple such computational pipelines37 as an additional scoring input to NetID, prioritizing peak annotations that match formulae (and eventually, with further enhancements, structures) considered likely based on these software. Other data types can be further added as scoring parameters, for example, compound class categorization based on MS2 data31 or retention time prediction56,57. Importantly, by introducing these inputs as the step of NetID scoring, we retain the backend power of the global network optimization approach to arrive at a final network that best reflects the full available information to annotate all observed LC-MS peaks.
As formula and structural predictions of increasing quality are made, it will be important to validate them experimentally. The gold standard for this purpose is chemical synthesis of pure standards, verifying MS2 spectral and retention time match58,59. Higher throughput approaches can, however, also be highly informative. For example, isotope labeling can confirm atom composition based on seeing the expected mass shifts upon 13C and 15N labeling. Abiotic peak annotations can also be experimentally validated, e.g. for solvent adducts by changing running buffer60 or for fragments through ramping in-source voltage26,61,62. Once confirmed experimentally, such annotations can be used as prior knowledge in future network optimization efforts. Thus, experimentational and computational progress is mutually reinforcing, and holds the potential to identify most unknown metabolites over the coming decade to yield a robust blueprint of the metabolome (Figure 5).
Figure 5. NetID applies global optimization for metabolomics data annotation and metabolite discovery.
Methods
Yeast metabolomics sample preparation and isotope labeling
S. cerevisiae strain FY4 was grown for at least 10 generations in minimal essential media containing 0.4% [U-12C] or [U-13C]glucose and 10 mM ammonium sulfate with or without 0.4 mg/L thiamine hydrochloride63. Then, in mid-exponential phase, 5 mL culture broth (OD600 = 0.80) was filtered and metabolites were extracted using 1 mL extraction buffer (40:40:20:0.5 acetonitrile:methanol:water:formic acid), followed by adding 88 μL neutralization buffer (15% NH4HCO3). The extracts were kept at −20°C for at least 15 min to precipitate protein before centrifuging at 16,000 g for 10 min. The supernatant was used for LC-MS analysis.
Murine metabolomics sample preparation and intravenous infusion experiment
Animal studies followed protocols approved by the Princeton University Institutional Animal Care and Use Committee. Twelve-month-old female wild-type C57BL/6 mice (The Jackson Laboratory, Bar Harbor, ME) on standard mouse chow diet were sacrificed by cervical dislocation and tissues quickly dissected and snap frozen in liquid nitrogen with precooled Wollenberger clamp. Frozen samples from liquid nitrogen were then transferred to −80°C freezer for storage. To extract metabolites, frozen liver tissue samples were first weighed (~ 20 mg each) and transferred to 2 mL round-bottom Eppendorf Safe-Lock tubes on dry ice. Samples were then ground into powder with a cryomill machine (Retsch, Newtown, PA) for 30 seconds at 25 Hz, and maintained at cold temperature using liquid nitrogen. For every 25 mg tissues, 922 uL extraction buffer (as above) was added to the tube, vortexed for 10 seconds, and allowed to sit on ice for 10 minutes. Then 78 μL neutralization buffer was added and the samples vortexed. The samples were allowed to sit on ice for 20 minutes and then centrifuged at 16,000 g for 25 min at 4°C. The supernatants were transferred to another Eppendorf tube and centrifuged at 16,000 g for another 25 min at 4°C. The supernatants were transferred to glass vials for LC-MS analysis. A procedure blank was generated identically without tissue, which was used later to remove the background ions.
Detailed methods for intravenous infusion of mice have been described previously64. Briefly, in vivo infusions were performed on 12–14-week-old C57BL/6 mice pre-catheterized in the right jugular vein (Charles River Laboratories). Mice were kept fasted for 6 h and then infused for 2.5 h with [U-13C]glucose (200 mM, 0.1 μL/min/g). The mouse infusion setup (Instech Laboratories) included a tether and swivel system so that the animal had free movement in the cage. Venous samples were taken from tail bleeds. At the end of the infusion, the mouse was euthanized by cervical dislocation and tissues were collected and extracted as above. Serum metabolites were extracted by adding 100 μl methanol to 5 μL of serum and centrifuging for 20 min. The supernatant was used for LC–MS analysis.
LC-MS and LC-MS/MS
LC separation was achieved using a Vanquish UHPLC system (Thermo Fisher Scientific) with an Xbridge BEH Amide column (150×2mm, 2.5 μm particle size; Waters). Solvent A is 95:5 water: acetonitrile with 20 mM ammonium acetate and 20 mM ammonium hydroxide at pH 9.4, and solvent B is acetonitrile. The gradient is 0 min, 90% B; 2 min, 90% B; 3 min, 75%; 7 min, 75% B; 8 min, 70%, 9 min, 70% B; 10 min, 50% B; 12 min, 50% B; 13 min, 25% B; 14 min, 25% B; 16 min, 0% B, 20.5 min, 0% B; 21 min, 90% B; 25 min, 90% B. Total running time is 25 min at a flow rate of 150 μl/min. LC-MS data were collected on a Q-Exactive Plus mass spectrometer (Thermo Fisher) operating in full scan mode with an MS1 scan range of m/z 70–1000, and resolving power of 160,000 at m/z 200. Other MS parameters are as follows: sheath gas flow rate, 28 (arbitrary units); aux gas flow rate, 10 (arbitrary units); sweep gas flow rate, 1 (arbitrary units); spray voltage, 3.3 kV; capillary temperature, 320°C; S-lens RF level, 65; AGC target, 3E6 and maximum injection time, 500 ms.
MS2 spectra were collected in targeted mode using the PRM function at 25 eV HCD energy with other instrument settings being resolution 17500, AGC target 106, Maximum IT 250 ms, isolation window 1.5 m/z. Targeted MS2 data for the thiamine related metabolites were collected for structural identification using similar parameters as above except the HCD energy was set at 20, 35, and 50 eV in a step-CE mode.
Data prepossessing
LC-MS raw data files (.raw) were converted to mzXML format using ProteoWizard (version 3.0.20315) 65. El-MAVEN (version 0.7.0 or 0.12.0) was used to generate a peak table containing m/z, retention time, and intensity for peaks. Parameters for peak picking were the defaults except for the following: mass domain resolution is 10 ppm; time domain resolution is 15 scans; minimum intensity is 1000; minimum peak width is 5 scans. The resulting peak table was exported to a .csv file. Redundant peak entries due to imperfect peak picking process are removed if two peaks are within 0.1 min and their m/z difference is within 2 ppm. Background peaks are removed if the intensity in procedure blank sample is > 0.5-fold of that in biological samples.
Targeted MS2 data were extracted from the mzXML files using lab-developed Matlab code (Supplementary Note 3). MS2 spectra may contain interfering product ions from co-eluting isobaric parent ions. These interfering product ions were removed by examining the extracted ion chromatogram (EIC) similarity between the product ions in MS2 data and the parent ion in MS1 data. A Pearson correlation coefficient of 0.8 was used as a cutoff to retain those product ions that have similar EIC as the parent ion66. The cleaned MS2 data were exported to Excel files for data input. Although the provided workflow uses targeted MS2 data as input, NetID as currently configured can also handle data-dependent MS2 data, but additional parsing software (under development) is need to convert the large primary data-dependent MS2 files into the NetID input format.
Data input
NetID requires (1) a peak table (in .csv format) containing m/z, RT and intensity from high-resolution mass spectrometry data; (2) a reference compound database, for which we provide HMDB7, YMDB53, a lite version of PubChem54 (PubChemLite.0.2.0) and a subset of 47,101 biopathway related entries (PubChemLite_Bio) that the user may choose; and. (3) a transformation table (in .csv format), for which we assembled a list of 25 biochemical atom differences and 59 abiotic atom differences. NetID optionally uses (4) a list of excel files containing MS2 fragmentation information (m/z and intensity) for peaks in the above peak table and (5) a list of known metabolites’ retention time, for which we provide our in-house retention time list for demonstration. Users can customize the compound database, the transformation table and the retention time list following the user guide.
For the analysis of yeast and mouse liver datasets in Figure 2–4, structures, formulae, m/z and MS2 spectra of metabolites were obtained from the Human Metabolome Database (HMDB, version 4.0) and retention times of selected metabolites were determined through running authentic standards using the above-mentioned LC-MS method (Supplementary data 3). For yeast, no MS2 data were used in NetID analysis (MS2 data were used post hoc to confirm certain annotations). For liver, targeted MS2 spectra were used (1479 positive and 803 negative ionization mode spectra experimentally obtained for previously identified peaks of > 105 intensity60).
Candidate node and edge annotations
The first module of NetID algorithm is to make candidate annotations for seed nodes, assign candidate annotations for other nodes, and assign candidate edges in the network. Each peak is a node in the network. We compare the experimentally measured m/z for each node to those of all metabolite formulae in the selected metabolomics database (e.g. HMDB). When the m/z difference is within a predefined tolerance (e.g. 10 ppm), candidate formulae and IDs are assigned to the node, and this node is defined as a primary seed node. Note that assignments to seeds are candidate annotations. A primary seed node can contain multiple candidate formulae and IDs if all are within the m/z difference range.
Edges connect two nodes via gain or loss of specific atoms. We provided a list of 25 biochemical atom differences and 59 abiotic atom differences which together define all connections in the network (Supplementary Table 1, 2, Supplementary Data 1). Let each of these differences be denoted by Di. For each node u, if there is a node v such that the difference in the measured m/z of the nodes matches one of the those in the list of atom mass differences within (e.g. 10 ppm) of , we add an edge between u and v. That is, if um/z and vm/z are the experimentally measured m/z for the peaks corresponding to nodes u and v respectively (assuming vm/z > um/z for simplicity), then there is an edge between these nodes if there is some difference Di such that
| (1) |
If Di is an abiotic difference, in order to add an edge, it is additionally required that the retention time between two nodes should be within a predefined (e.g. 0.2 min). That is, if uRT and vRT are the retention times for u and v respectively, then it is required that
| (2) |
For each node, its candidate formulae set will expand due to extending formulae from its neighboring nodes through the edge atom differences. For example, when applying the atom difference of edge (u, v) on the formula assigned to primary seed node u, we can derive a new candidate formula for the connected node v. If the derived formula’s calculated m/z is within a predefined m/z tolerance (e.g. 5 ppm) of node v’s measured m/z, then a new candidate formula is added for node v. Iterating the process to all candidate formulae of node u through edge (u, v) will further expand candidate formulae for node v.
We apply the above extension process to formulae of all primary seed nodes through atom difference edges, and these new candidate formulae themselves can be used for another round of extension. Note that a primary seed node will be treated as the rest of nodes during the subsequent rounds of extension, and may as well be assigned with new formulae. To avoid duplicated efforts in the extension process, we allow formulae of primary seed nodes and biotransformed formulae thereof to be extended through both biotransformation and abiotic atom difference edges, and do not allow abiotic candidate formulae to be further extended through biotransformation atom difference edges. The default extension process includes two rounds of biotransformation edge extensions and three rounds of abiotic edge extensions.
Each candidate node annotation is defined as (i) metabolite, (ii) putative metabolite, or (iii) artifact (nodes can also be unannotated). Specifically, if the elemental formula corresponding to the (de)protonated ion of a monoisotopic peak is found in the employed metabolomics database, this node is defined as a metabolite. If the formula is not found at the employed database, but the node is connected to a metabolite via biochemical connection(s), the node is defined as a putative metabolite. Finally, if the node is connected only via abiotic connections such as adduct, fragment, or isotope connection(s), it is defined as an artifact. As currently configured, NetID defines metabolite peaks exclusively as (de)protonated ions. In the case that a (de)protonated ion peak is not detected, but related adducts are (e.g. [M+Na]+), the adducts will remain unannotated (or be misannotated), as there is no procedure for annotating adducts lacking (de)protonated ion peaks.
Scoring in NetID
The second module of NetID algorithm is to score every candidate node and edge annotation assigned in the candidate annotation step.
The node scoring system aims to assign high scores to annotations that align observed ion peaks with known metabolites based on m/z, retention time, MS2, and/or isotope abundances. Let the set of candidate annotations for node u be denoted as . For each node u and each of its candidate annotation , let denotes the score of candidate annotation for node u. is the sum of seven different scoring components, including (a) , a negative score evaluating the difference between measured m/z and the calculated m/z of assigned molecular formula; (b) , a positive score if the measured RT for the peak corresponding to node u matches to a known standard; (c) , a positive score if the measured MS2 spectrum of node u matches the database MS2 spectrum of annotation ; (d) , a positive score if the annotated formula exists in the employed metabolomics database; (e) , a negative score if an expected isotopic peak is missing; (f) , a negative score if annotation violates basic chemical rules; (g) , a positive score if the annotation is derived from a parent peak with a high score annotation. For details, see Supplementary Note 1.
The edge scoring system aims to assign high scores to edge annotations that correctly capture biochemical connections between metabolites (based on MS2 spectra similarity) and abiotic connections between metabolites and their mass spectrometry phenomena derivatives. Biochemical, isotope, adduct, and neutral loss edge annotations are the most common types. We also score other less common abiotic connection types appeared in orbitrap data, including oligomers, multi-charge species, heterodimers, in-source fragments of known or unknown metabolites61, and ringing artifact peaks surrounding high-intensity ions26,67.
Suppose we consider two nodes u and v that are connected by an edge (u, v). For each pair of nodes u and v such that there is an edge (u, v), let the set of candidate formula for node u and v be denoted as and , respectively, and let the set of candidate atom differences for edge (u, v) be . Let S() be the score of choosing candidate formula for node u, candidate formula for node v and candidate atom difference for edge (u, v). Note that S() is set to be 0 if atom difference does not represent the formula difference of and :
| (3) |
is the sum of four different scoring components, including (a) , a positive score defined for biochemical edges if node u and v have experimental measured MS2 spectra, and they share MS2 similarity; (b) , a negative score defined for abiotic edges, if the RT of two connected nodes differs more than a threshold (e.g. 0.05 min); (c) Stype(), a non-negative score defined for all edges, depending on the connection type of edge, which is defined by , including biotransformation, adduct, isotope, and fragment edges, and optionally including oligomer and multi-charge species, heterodimer, in-source fragments and ringing artifacts edges; (d) , a negative score defined for isotopic edges (a type of abiotic edge) if the measured isotope peaks deviate from expected natural abundance. For details, see Supplementary Note 1.
Global network optimization using linear programming
The third module of NetID algorithm is to perform global network optimization. Using scores assigned for each candidate node and edge annotation, our goal is to find formula annotations for each node and edge so as to maximize the sum of their scores across the network under the constraints that each node is assigned a single annotation, and that the network annotation is consistent. When a node has multiple candidate node annotations that shared with same formula (e.g. isomers), the one with highest score (better MS2 match or RT match) is selected. When equal scores happen, the candidate annotation that appears first in the metabolite list from database is reported as a default. We use linear programming to solve this optimization problem, as described next.
For each node u and each of its candidate formula , we define a node binary decision variable to denote whether candidate formula is selected as the annotation for node u. That is,
| (4) |
For each edge, we define a binary decision variable to denote whether candidate formulae and are chosen for nodes u and v, and the candidate atom difference corresponds to the formula difference of candidate formulae and of the connected nodes u and v. That is,
| (5) |
We constrain the optimization so that each node has a single annotation, and an edge exists only if the atom difference of that edge annotation matches the formula difference of nodes. For computational purposes, nodes may also receive “blank” or “no formula” annotation (we refer to such nodes in elsewhere in the text as “unannotated”). The node and edge binary variables must satisfy
| (6) |
| (7) |
| (8) |
For all variables defined above, we add the constraints that they are either 1 or 0, representing the candidate annotation is selected or not selected, respectively, in the network.
With scores of each candidate node and edge annotation, the objective for the optimization is to determine all variables and so as to maximize the sum of all node scores and edge scores in a network while satisfying the above constraints.
The optimization result provides a string of binary numbers that denotes whether a candidate node or edge annotation is selected for the global optimal network. IBM ILOG CPLEX Optimization Studio (version 12.10) is used to solve the linear programming problem. For the reported datasets and using the default parameter settings, optimization finishes within an hour on a standard laptop (Supplementary Table 5). Depending on the number of peaks in data tables, the entries in the atom difference tables, the choice of reference compound databases, and the parameters involved in scoring, runtimes during internal testing ranged from minutes to hours.
Evaluation of NetID
After running the candidate annotation and network extension process as usual for NetID, we compared four different annotation selection methods: (i) m/z only, selecting the candidate annotation with closest m/z to the measured m/z; (ii) node scores, selecting the candidate annotation with highest candidate node score (as per usual NetID scoring rules); (iii) node + edge scores, adding half of a candidate edge score to each node score of the two connected candidate node annotations, and selecting the candidate annotation with highest combined score; (iv) NetID optimization, using the candidate node and edge score, and selecting the candidate annotation from global optimization. The parameter settings are kept the same across Figure 2B-D.
We employed a target-decoy strategy to estimate false discovery rate51,52. The target library is the compound library we use for annotation, including HMDB (human metabolomics database), PBCM (PubChemLite.0.2.0)54, PBCM_BIO (a subset of biopathway related entries in PubChemLite.0.2.0) and YMDB (yeast metabolomics database)53. The decoy formula was generated by adding an implausible element adduct to a formula from target library. These implausible elements are those not in any formulae in database, namely, He, Be, Ne, Sc, Kr, Rb, Sr, Y, Zr, Nb, Mo, Ru, Rh, Pd, Ag, Cd, In, Sn, Sb, Te, Xe, Cs, Ba, La, Ce, Pr, Nd, Sm, Eu, Gd, Tb, Ho, Er, Tm, Yb, Lu, Hf, Ta, W, Re, Os, Ir, Pt, Au, Hg, Tl, Pb, Bi, Th and U. Applying the decoy formula generation process (i.e. adding a single randomly selected implausible element in place of hydrogen) to all unique formulae in a target compound library gives the corresponding decoy library. The combined target library and decoy library were used for annotation. Any annotation containing an implausible element is considered a false positive (FP) result. The number of FP results from target library is estimated to be similar to that from decoy library, because 1:1 ratio of target formulae and decoy formulae were used. That is FPtarget_library ≈ FPdecoy_library. Using the combined target-decoy library, the false discovery rate (FDR) is estimated to be FPdecoy_library / T, where T is the total number of annotations. The decoy library generation process was repeated ten times for each database.
We manually annotated 314 peaks in the yeast negative mode dataset (Supplementary data 1). Using these annotations as ground truth, we evaluated the fraction of correct annotation for the four different annotation methods above. Peak annotations matching to the ground truth formulae, including adduct, isotope formulae, are counted as correct, and peaks that are not annotated or their annotations did not match are counted as incorrect. The annotation process used 1:1 target-decoy library and was repeated 10 times as above.
Visualization
We provide an interactive Shiny R app to visualize and explore the NetID output network. In addition, NetID outputs two .csv files (cyto_node.csv and cyto_edges.csv) that are compatible with the general network visualization software Cytoscape. The interactive Shiny R app and detailed user guide are available at GitHub (https://github.com/LiChenPU/NetID).
Data availability
All LC-MS data, including the yeast and mouse metabolomics datasets, the 13C labeling datasets, and over 2000 targeted MS2 files collected from the liver data in mzXML formats were deposited in MassIVE (ID = MSV000087434). R code for generating NetID statistics and performing FDR analysis in Figure 2 and Extended Data Fig. 1 are provided in GitHub (https://github.com/LiChenPU/NetID/releases/tag/v1.0) and Zenodo (https://zenodo.org/record/5508337). Atom difference rule table is provided in Supplementary Data 1, peak table for yeast data negative mode, including NetID annotation results, putative metabolite list, and manual curation results in Supplementary Data 2, an in-house retention time list for known metabolites in Supplementary Data 3, HMDB, YMDB, PubChemLite, PubChemLite_bio reference compound databases (customized to contain relevant information) in Supplementary Data 4-7, and MS2 spectra of newly-discovered metabolites in Supplementary Data 8.
Code availability
NetID was developed mainly in R, and used a mixture of IBM ILOG CPLEX Optimization Studio, Matlab and Python. NetID code and example files are available for non-commercial use in GitHub at https://github.com/LiChenPU/NetID/releases/tag/v1.0 and Zenodo at https://zenodo.org/record/5508337, under the GNU General Public License v3.0. User guide and pseudocode are provided in Supplementary Notes 3, and 4.
Extended Data
Extended Data Fig. 1. Characterization of NetID network.
Characterization of NetID network. (A) Summary table of the candidate annotation step in NetID workflow. (B) Visualization of the optimal network obtained from negative mode LC-MS analysis of Baker’s yeast, containing 4851 nodes and 9699 connections. Metabolite and putative metabolite peaks are in green and artifact peaks in purple. (C) Connectivity of NetID network from the yeast negative-mode dataset.
Extended Data Fig. 2. Examples of putative metabolites in yeast negative-mode dataset.
Examples of putative metabolites in yeast negative-mode dataset. (A-C) Subnetwork surrounding glutathione (A), glycerophosphocholine (B), and xanthurenic acid (C). (D) Peak properties and annotations for putative metabolites (yellow nodes) in subnetworks (A)-(C).
Extended Data Fig. 3. Evaluation of annotation false discovery rate (FDR) and fraction gold-standard peaks annotated correctly using different reference databases.
Evaluation of annotation false discovery rate (FDR) and fraction gold-standard peaks annotated correctly using different reference databases. The four tested reference compound databases are HMDB (human metabolomics database), PBCM (PubChemLite.0.2.0, zenodo.org/record/3611238), PBCM_BIO (a subset of biopathway related entries in PubChemLite.0.2.0) and YMDB (yeast metabolomics database). (A) False discovery rate estimated using target-decoy strategy. (B) Fraction of 314 manually curated “ground truth” annotations made correctly. For A and B, each individual data point (circle) is from a different randomized decoy library. N = 10 randomized libraries were tested for each reference compound database. Boxes show median and IQR and whiskers extend to largest and smallest value no further than ±1.5 × IQR from hinge.
Extended Data Fig. 4. Subnetwork surrounding thiamine with additional known structures.
Subnetwork surrounding thiamine with additional known structures. Nodes, connections, and formulae are direct output of NetID. Boxes with structures were manually added.
Extended Data Fig. 5. Evidence for the additional thiamine-derived metabolites.
Evidence for the additional thiamine-derived metabolites. Similar to Figure 3, adding unlabeled thiamine to [U-13C]glucose culture media, yeast uptake the unlabeled thiamine, resulting in unlabeled thiamine, M+4 labeled thiamine+[C4H6O3] and thiamine+[C4H8O] species (n=5). The proposed formulae are also supported by m/z measured by high-resolution mass-spectrometry. Bar represents mean values and error bar indicates s.d..
Extended Data Fig. 6. Subnetwork surrounding taurine with additional known structures.
Subnetwork surrounding taurine with additional known structures. Nodes, connections, and formulae are direct output of NetID. Boxes with structures were manually added.
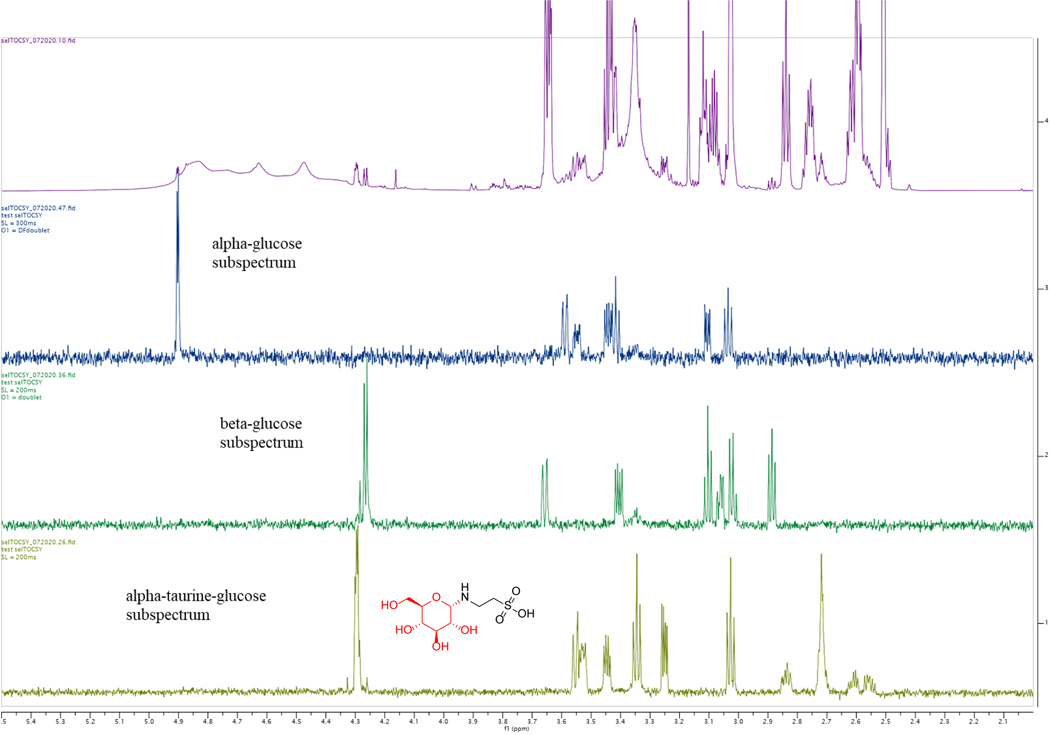
Extended Data Fig. 7. SelTOCSY NMR confirmation of the structure of the chemically synthesized N-glucosyl-taurine.
SelTOCSY NMR confirmation of the structure of the chemically synthesized N-glucosyl-taurine. The final crude material is a mixture of glucose, taurine, and N-glucosyl-taurine at 5.2% (pink line). Comparing N-glucosyl-taurine (yellow) to alpha- (blue) and beta-glucose (green) NMR experiments indicate that C1 of the glucosyl group connects the amine group of taurine in α-position.
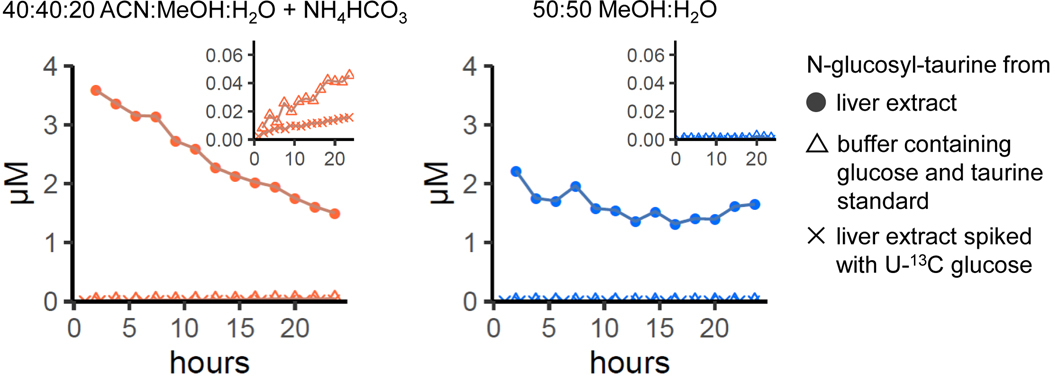
Extended Data Fig. 8. Glucosyl-taurine is a liver metabolite, not ex vivo reaction product.
Glucosyl-taurine is a liver metabolite, not ex vivo reaction product. To test for ex vivo production of glucosyl-taurine, liver extract (with or without spiked 55 μM [U-13C]glucose) or extraction buffer (40:40:20 ACN:MeOH:H2O + NH4HCO3 or 50:50 MeOH:H2O) containing pure glucose and taurine were incubated at 5°C for the indicated duration. Metabolites formed by ex vivo reactions typically accumulate upon sample incubation, while glucosyl-taurine does not. Moreover, there is minimal assimilation of [U-13C]glucose into glucosyl-taurine to make M+6 glucosyl-taurine in liver extract, and, while trace glucosyl-taurine can be formed abiotically in acetonitrile:methanol:water at pH = 7, the observed biological quantity is 100-fold greater.
Supplementary Material
Acknowledgements
This work was supported by a Department of Energy (DOE) grant (no. DE-SC0012461 to J.D.R.), the Center for Advanced Bioenergy and Bioproducts Innovation (grant no. DE-SC0018420, subcontract to J.D.R.), NIH grant R50CA211437 to W.L and the Howard Hughes Medical Institute and Burroughs Wellcome Fund via the PDEP and Hanna H. Gray Fellows Programs to M.R.M. We thank Istvan Pelczer at NMR facility of Department of Chemistry at Princeton University for the NMR analysis, the Metabolomics & Lipidomics Mass Spectrometry Core Facility of IMIB at Fudan University for additional mass spectrometry support, and X. Su and Y. An for scientific discussion and help. The Center for Advanced Bioenergy and Bioproducts Innovation and the Center for Bioenergy Innovation are both U.S. Department of Energy Bioenergy Research Centers supported by the Office of Biological and Environmental Research in the DOE Office of Science. Any opinions, findings, conclusions or recommendations expressed in this publication are those of the authors and do not necessarily reflect the views of the U.S. Department of Energy.
Footnotes
Competing interests
The authors declare no competing interests.
Reference
- 1.DiNardo CD et al. Durable Remissions with Ivosidenib in IDH1-Mutated Relapsed or Refractory AML. N. Engl. J. Med 378, 2386–2398 (2018). [DOI] [PubMed] [Google Scholar]
- 2.Dang L. et al. Cancer-associated IDH1 mutations produce 2-hydroxyglutarate. Nature 462, 739 (2009). [DOI] [PMC free article] [PubMed] [Google Scholar]
- 3.Doroghazi JR et al. A roadmap for natural product discovery based on large-scale genomics and metabolomics. Nature Chemical Biology 10, 963–968 (2014). [DOI] [PMC free article] [PubMed] [Google Scholar]
- 4.Aron AT et al. Reproducible molecular networking of untargeted mass spectrometry data using GNPS. Nature Protocols 15, 1954–1991 (2020). [DOI] [PubMed] [Google Scholar]
- 5.Johnson CH, Ivanisevic J. & Siuzdak G. Metabolomics: beyond biomarkers and towards mechanisms. Nature Reviews Molecular Cell Biology 17, 451–459 (2016). [DOI] [PMC free article] [PubMed] [Google Scholar]
- 6.Kim S. et al. PubChem 2019 update: improved access to chemical data. Nucleic Acids Res 47, D1102–D1109 (2019). [DOI] [PMC free article] [PubMed] [Google Scholar]
- 7.Wishart DS et al. HMDB 4.0: the human metabolome database for 2018. Nucleic Acids Res 46, D608–D617 (2018). [DOI] [PMC free article] [PubMed] [Google Scholar]
- 8.Kanehisa M, Sato Y, Kawashima M, Furumichi M. & Tanabe M. KEGG as a reference resource for gene and protein annotation. Nucleic Acids Res 44, D457–D462 (2016). [DOI] [PMC free article] [PubMed] [Google Scholar]
- 9.Pence HE & Williams A. ChemSpider: An Online Chemical Information Resource. J. Chem. Educ 87, 1123–1124 (2010). [Google Scholar]
- 10.Xue J, Guijas C, Benton HP, Warth B. & Siuzdak G. METLIN MS2 molecular standards database: a broad chemical and biological resource. Nat Methods 17, 953–954 (2020). [DOI] [PMC free article] [PubMed] [Google Scholar]
- 11.Wang M. et al. Sharing and community curation of mass spectrometry data with Global Natural Products Social Molecular Networking. Nature Biotechnology 34, 828–837 (2016). [DOI] [PMC free article] [PubMed] [Google Scholar]
- 12.Tsugawa H. et al. Hydrogen Rearrangement Rules: Computational MS/MS Fragmentation and Structure Elucidation Using MS-FINDER Software. Anal. Chem 88, 7946–7958 (2016). [DOI] [PMC free article] [PubMed] [Google Scholar]
- 13.Horai H. et al. MassBank: a public repository for sharing mass spectral data for life sciences. J. Mass Spectrom 45, 703–714 (2010). [DOI] [PubMed] [Google Scholar]
- 14.MassBank | MassBank Europe Mass Spectral DataBase. https://massbank.eu/MassBank/.
- 15.sherena.johnson@nist.gov. NIST Standard Reference Database 1A. NIST https://www.nist.gov/srd/nist-standard-reference-database-1a (2014).
- 16.Tautenhahn R, Patti GJ, Rinehart D. & Siuzdak G. XCMS Online: A Web-Based Platform to Process Untargeted Metabolomic Data. Anal. Chem 84, 5035–5039 (2012). [DOI] [PMC free article] [PubMed] [Google Scholar]
- 17.Forsberg EM et al. Data processing, multi-omic pathway mapping, and metabolite activity analysis using XCMS Online. Nature Protocols 13, 633–651 (2018). [DOI] [PMC free article] [PubMed] [Google Scholar]
- 18.Dührkop K. et al. SIRIUS 4: a rapid tool for turning tandem mass spectra into metabolite structure information. Nature Methods 16, 299–302 (2019). [DOI] [PubMed] [Google Scholar]
- 19.Tsugawa H. et al. A cheminformatics approach to characterize metabolomes in stable-isotope-labeled organisms. Nature Methods 16, 295 (2019). [DOI] [PubMed] [Google Scholar]
- 20.Stricker T, Bonner R, Lisacek F. & Hopfgartner G. Adduct annotation in liquid chromatography/high-resolution mass spectrometry to enhance compound identification. Anal Bioanal Chem 413, 503–517 (2021). [DOI] [PMC free article] [PubMed] [Google Scholar]
- 21.Kuhl C, Tautenhahn R, Böttcher C, Larson TR & Neumann S. CAMERA: An Integrated Strategy for Compound Spectra Extraction and Annotation of Liquid Chromatography/Mass Spectrometry Data Sets. Anal. Chem 84, 283–289 (2012). [DOI] [PMC free article] [PubMed] [Google Scholar]
- 22.Domingo-Almenara X. et al. Autonomous METLIN-Guided In-source Fragment Annotation for Untargeted Metabolomics. Anal. Chem 91, 3246–3253 (2019). [DOI] [PMC free article] [PubMed] [Google Scholar]
- 23.Broeckling CD, Afsar FA, Neumann S, Ben-Hur A. & Prenni JE RAMClust: A Novel Feature Clustering Method Enables Spectral-Matching-Based Annotation for Metabolomics Data. Anal. Chem 86, 6812–6817 (2014). [DOI] [PubMed] [Google Scholar]
- 24.Domingo-Almenara X, Montenegro-Burke JR, Benton HP & Siuzdak G. Annotation: A Computational Solution for Streamlining Metabolomics Analysis. Anal. Chem 90, 480–489 (2018). [DOI] [PMC free article] [PubMed] [Google Scholar]
- 25.Sindelar M. & Patti GJ Chemical Discovery in the Era of Metabolomics. J. Am. Chem. Soc 142, 9097–9105 (2020). [DOI] [PMC free article] [PubMed] [Google Scholar]
- 26.Wang L. et al. Peak Annotation and Verification Engine for Untargeted LC–MS Metabolomics. Anal. Chem 91, 1838–1846 (2019). [DOI] [PMC free article] [PubMed] [Google Scholar]
- 27.Mahieu NG, Huang X, Chen Y-J & Patti GJ Credentialing Features: A Platform to Benchmark and Optimize Untargeted Metabolomic Methods. Anal. Chem 86, 9583–9589 (2014). [DOI] [PMC free article] [PubMed] [Google Scholar]
- 28.Schmid R. et al. Ion identity molecular networking for mass spectrometry-based metabolomics in the GNPS environment. Nat Commun 12, 3832 (2021). [DOI] [PMC free article] [PubMed] [Google Scholar]
- 29.Nothias L-F et al. Feature-based molecular networking in the GNPS analysis environment. Nat Methods 17, 905–908 (2020). [DOI] [PMC free article] [PubMed] [Google Scholar]
- 30.da Silva RR et al. Propagating annotations of molecular networks using in silico fragmentation. PLOS Computational Biology 14, e1006089 (2018). [DOI] [PMC free article] [PubMed] [Google Scholar]
- 31.Dührkop K. et al. Systematic classification of unknown metabolites using high-resolution fragmentation mass spectra. Nat Biotechnol (2020) doi: 10.1038/s41587-020-0740-8. [DOI] [PubMed]
- 32.Shen X. et al. Metabolic reaction network-based recursive metabolite annotation for untargeted metabolomics. Nature Communications 10, 1516 (2019). [DOI] [PMC free article] [PubMed] [Google Scholar]
- 33.Senan O. et al. CliqueMS: A computational tool for annotating in-source metabolite ions from LC-MS untargeted metabolomics data based on a coelution similarity network. 8. [DOI] [PMC free article] [PubMed] [Google Scholar]
- 34.Alden N. et al. Biologically Consistent Annotation of Metabolomics Data. Anal. Chem 89, 13097–13104 (2017). [DOI] [PubMed] [Google Scholar]
- 35.Del Carratore F. et al. Integrated Probabilistic Annotation: A Bayesian-Based Annotation Method for Metabolomic Profiles Integrating Biochemical Connections, Isotope Patterns, and Adduct Relationships. Anal. Chem (2019) doi: 10.1021/acs.analchem.9b02354. [DOI] [PubMed]
- 36.Yu M. & Petrick L. Untargeted high-resolution paired mass distance data mining for retrieving general chemical relationships. Commun Chem 3, 157 (2020). [DOI] [PMC free article] [PubMed] [Google Scholar]
- 37.Ernst M. et al. MolNetEnhancer: Enhanced Molecular Networks by Integrating Metabolome Mining and Annotation Tools. Metabolites 9, (2019). [DOI] [PMC free article] [PubMed] [Google Scholar]
- 38.Watrous J. et al. Mass spectral molecular networking of living microbial colonies. PNAS 109, E1743–E1752 (2012). [DOI] [PMC free article] [PubMed] [Google Scholar]
- 39.Hooft JJJ van der Wandy J, Barrett MP, Burgess KEV & Rogers S. Topic modeling for untargeted substructure exploration in metabolomics. PNAS 113, 13738–13743 (2016). [DOI] [PMC free article] [PubMed] [Google Scholar]
- 40.Del Carratore F. et al. Integrated Probabilistic Annotation: A Bayesian-Based Annotation Method for Metabolomic Profiles Integrating Biochemical Connections, Isotope Patterns, and Adduct Relationships. Anal. Chem 91, 12799–12807 (2019). [DOI] [PubMed] [Google Scholar]
- 41.Rogers S, Scheltema RA, Girolami M. & Breitling R. Probabilistic assignment of formulas to mass peaks in metabolomics experiments. Bioinformatics 25, 512–518 (2009). [DOI] [PubMed] [Google Scholar]
- 42.Daly R. et al. MetAssign: probabilistic annotation of metabolites from LC-MS data using a Bayesian clustering approach. Bioinformatics 30, 2764–2771 (2014). [DOI] [PMC free article] [PubMed] [Google Scholar]
- 43.Ludwig M. et al. Database-independent molecular formula annotation using Gibbs sampling through ZODIAC. Nature Machine Intelligence 2, 629–641 (2020). [Google Scholar]
- 44.Kingsford CL, Chazelle B. & Singh M. Solving and analyzing side-chain positioning problems using linear and integer programming. Bioinformatics 21, 1028–1039 (2005). [DOI] [PubMed] [Google Scholar]
- 45.Nabieva E, Jim K, Agarwal A, Chazelle B. & Singh M. Whole-proteome prediction of protein function via graph-theoretic analysis of interaction maps. Bioinformatics 21, i302–i310 (2005). [DOI] [PubMed] [Google Scholar]
- 46.Ochoa A. & Singh M. Domain prediction with probabilistic directional context. Bioinformatics 33, 2471–2478 (2017). [DOI] [PMC free article] [PubMed] [Google Scholar]
- 47.Gusfield D. Integer Linear Programming in Computational and Systems Biology: An Entry-Level Text and Course. (Cambridge University Press, 2019). doi: 10.1017/9781108377737. [DOI] [Google Scholar]
- 48.Palmer A. et al. FDR-controlled metabolite annotation for high-resolution imaging mass spectrometry. Nature Methods 14, 57–60 (2017). [DOI] [PubMed] [Google Scholar]
- 49.Kind T. & Fiehn O. Seven Golden Rules for heuristic filtering of molecular formulas obtained by accurate mass spectrometry. BMC Bioinformatics 8, 105 (2007). [DOI] [PMC free article] [PubMed] [Google Scholar]
- 50.Melamud E, Vastag L. & Rabinowitz JD Metabolomic Analysis and Visualization Engine for LC−MS Data. Anal. Chem 82, 9818–9826 (2010). [DOI] [PMC free article] [PubMed] [Google Scholar]
- 51.Palmer A. et al. FDR-controlled metabolite annotation for high-resolution imaging mass spectrometry. Nat Methods 14, 57–60 (2017). [DOI] [PubMed] [Google Scholar]
- 52.Käll L, Storey JD, MacCoss MJ & Noble WS Assigning Significance to Peptides Identified by Tandem Mass Spectrometry Using Decoy Databases. J. Proteome Res 7, 29–34 (2008). [DOI] [PubMed] [Google Scholar]
- 53.Jewison T. et al. YMDB: the Yeast Metabolome Database. Nucleic Acids Research 40, D815–D820 (2012). [DOI] [PMC free article] [PubMed] [Google Scholar]
- 54.Bolton E. & Schymanski E. PubChemLite tier0 and tier1. (2020) doi: 10.5281/zenodo.3611238. [DOI]
- 55.Wang M. et al. Mass spectrometry searches using MASST. Nat Biotechnol 1–4 (2020) doi: 10.1038/s41587-019-0375-9. [DOI] [PMC free article] [PubMed]
- 56.Bonini P, Kind T, Tsugawa H, Barupal DK & Fiehn O. Retip: Retention Time Prediction for Compound Annotation in Untargeted Metabolomics. Anal. Chem 92, 7515–7522 (2020). [DOI] [PMC free article] [PubMed] [Google Scholar]
- 57.Bach E, Szedmak S, Brouard C, Böcker S. & Rousu J. Liquid-chromatography retention order prediction for metabolite identification. Bioinformatics 34, i875–i883 (2018). [DOI] [PubMed] [Google Scholar]
- 58.Fiehn O. et al. The metabolomics standards initiative (MSI). Metabolomics 3, 175–178 (2007). [DOI] [PMC free article] [PubMed] [Google Scholar]
- 59.Blaženović I. et al. Structure Annotation of All Mass Spectra in Untargeted Metabolomics. Anal. Chem 91, 2155–2162 (2019). [DOI] [PMC free article] [PubMed] [Google Scholar]
- 60.Lu W. et al. Improved Annotation of Untargeted Metabolomics Data through Buffer Modifications That Shift Adduct Mass and Intensity. Anal. Chem 92, 11573–11581 (2020). [DOI] [PMC free article] [PubMed] [Google Scholar]
- 61.Xue J. et al. Enhanced in-Source Fragmentation Annotation Enables Novel Data Independent Acquisition and Autonomous METLIN Molecular Identification. Anal. Chem 92, 6051–6059 (2020). [DOI] [PMC free article] [PubMed] [Google Scholar]
- 62.Su X. et al. In-Source CID Ramping and Covariant Ion Analysis of Hydrophilic Interaction Chromatography Metabolomics. Anal. Chem 92, 4829–4837 (2020). [DOI] [PMC free article] [PubMed] [Google Scholar]
Methods Reference
- 63.Xu Y-F et al. Discovery and Functional Characterization of a Yeast Sugar Alcohol Phosphatase. ACS Chem. Biol 13, 3011–3020 (2018). [DOI] [PMC free article] [PubMed] [Google Scholar]
- 64.Hui S. et al. Glucose feeds the TCA cycle via circulating lactate. Nature 551, 115–118 (2017). [DOI] [PMC free article] [PubMed] [Google Scholar]
- 65.Chambers MC et al. A Cross-platform Toolkit for Mass Spectrometry and Proteomics. Nat Biotechnol 30, 918–920 (2012). [DOI] [PMC free article] [PubMed] [Google Scholar]
- 66.Xing S. et al. Recognizing Contamination Fragment Ions in Liquid Chromatography–Tandem Mass Spectrometry Data. J. Am. Soc. Mass Spectrom jasms.0c00478 (2021) doi: 10.1021/jasms.0c00478. [DOI] [PubMed]
- 67.Mitchell JM et al. New methods to identify high peak density artifacts in Fourier transform mass spectra and to mitigate their effects on high-throughput metabolomic data analysis. Metabolomics 14, 125 (2018). [DOI] [PMC free article] [PubMed] [Google Scholar]
Associated Data
This section collects any data citations, data availability statements, or supplementary materials included in this article.
Supplementary Materials
Data Availability Statement
All LC-MS data, including the yeast and mouse metabolomics datasets, the 13C labeling datasets, and over 2000 targeted MS2 files collected from the liver data in mzXML formats were deposited in MassIVE (ID = MSV000087434). R code for generating NetID statistics and performing FDR analysis in Figure 2 and Extended Data Fig. 1 are provided in GitHub (https://github.com/LiChenPU/NetID/releases/tag/v1.0) and Zenodo (https://zenodo.org/record/5508337). Atom difference rule table is provided in Supplementary Data 1, peak table for yeast data negative mode, including NetID annotation results, putative metabolite list, and manual curation results in Supplementary Data 2, an in-house retention time list for known metabolites in Supplementary Data 3, HMDB, YMDB, PubChemLite, PubChemLite_bio reference compound databases (customized to contain relevant information) in Supplementary Data 4-7, and MS2 spectra of newly-discovered metabolites in Supplementary Data 8.


