

Abstract
Aim:
There is a critical need to validate biofluid-based biomarkers as diagnostic and drug development tools for traumatic brain injury (TBI). As part of the TBI Endpoints Development Initiative, we identified four potentially predictive and pharmacodynamic biomarkers for TBI: astroglial markers GFAP and S100B and the neuronal markers UCH-L1 and Tau.
Materials & methods:
Several commonly used platforms for these four biomarkers were identified and compared on analytic performance and ability to detect gold standard recombinant protein antigens and to pool control versus TBI cerebrospinal fluid (CSF).
Results:
For each marker, only some assay formats could differentiate TBI CSF from the control CSF. Also, different assays for the same biomarker reported divergent biomarker values for the same biosamples.
Conclusion:
Due to the variability of TBI marker assay in performance and reported values, standardization strategies are recommended when comparing reported biomarker levels across assay platforms.
Keywords: : biomarker qualification, GFAP, neurodegeneration, protein biomarkers, S100B, Tau, traumatic brain injury, UCH-L1
Lay abstract
Traumatic brain injury (TBI) is a leading cause of mortality and morbidity around the world. There is a critical need to validate biofluid-based biomarker tests as diagnostic and drug development tools. For this study, we focused on four brain-derived proteins called GFAP, S100B, UCH-L1 and Tau. To measure these biomarker proteins in human biofluid, one relies on either commercial or home-brew assays. Here, we attempted to compare the performance of 2–4 assay formats for each biomarker. We compared their assay sensitivity, ability to detect ‘gold standard’ protein analyte we procured, as well as the ability to differentiated pooled TBI cerebrospinal fluid from healthy control cerebrospinal fluid. We found that there are high variabilities among TBI marker assays in assay performance, reported biomarker values and ability to differentiate TBI versus control biofluid. Thus, a standardization strategy is needed when comparing reported biomarker levels across assay platforms.
Traumatic brain injury (TBI) is a leading cause of mortality and morbidity around the world with a broad spectrum of symptoms and disabilities. There are approximately 2.8 million emergency department and hospital visits for TBI annually in the USA alone [1], with 136,000 lives lost annually (Centers for Disease Control and Prevention, 2015). TBI team and the TBI Endpoints Development (TED) Initiative Team put together a response document on ‘the use of biofluid-based TBI biomarkers as therapy development tools’ as a new context of use [2]. The US FDA’s Center for Drug Evaluation and Research (CDER) published a position paper describing different biomarker categories and stressed the importance of the biomarker qualification process [3]. Based on these concepts, several candidate TBI biomarkers have been intensively studied for their utility as predictive biomarkers (those that categorize patients by their likelihood of response to a particular treatment relative to no treatment) and pharmacodynamic or response biomarkers (those that show a biological response in patients after receiving a treatment intervention) [4]. A TBI predictive biomarker could have potential use in redefining TBI patient severity – beyond relying on the Glasgow Coma Scale (GCS) and/or computed tomography (CT) abnormality findings alone. If successfully implemented, such TBI predictive biomarkers could also help enrich probable therapy responders in a clinical trial. Similarly, a TBI pharmacodynamic biomarker could be used as a response indicator, in conjunction with primary outcome measures. Using an evidence-based multicriteria approach, we identified the top four biofluid-based TBI protein biomarkers with the highest potential for such purpose. They are the astroglial markers glial fibrillary acidic protein (GFAP) and S100 calcium-binding protein B (S100B), and the neuronal markers ubiquitin C-terminal hydrolase-L1 (UCH-L1) and Tau protein [5].
GFAP is an astrocyte-specific intermediate filament protein classically considered a marker of astrocyte activation. More recently, the GFAP-breakdown product was identified as a marker for astroglia cell injury [6]. GFAP is released into plasma in penetrating TBI models [7]. Serum GFAP levels in severe and moderate TBI with GCS <12 are associated with unfavorable outcomes at 6 months [8]. ELISAs for GFAP and its breakdown products have been reported to detect both mild to moderate TBI and the full spectrum of TBI in two independent studies [9,10].
S100B is a glia-specific protein. Serum S100B is elevated after blast brain injury in rats [11]. Elevated blood S100B level rise seems to precede intracerebral pressure, neuroimaging and neurological examination findings. There is in fact a large body of evidence of sign S100B as a TBI biomarker [12]. S100B has been considered a prognostic biomarker of blood–brain barrier (BBB) permeability and CNS injury. Serum S100B measured 24 h after an injury can predict the unfavorable outcome, in other words, GCS <4 or death at 3 months after injury in severe TBI patients [13]. Serum S100B elevations were found after mTBI [14] and in some concussion subjects [15]. Although S100B remains promising as an adjunctive marker, the main limitation of its use is the lack of specificity to brain trauma, particularly because S100B can be released from other injured organs [16].
UCH-L1 is a deubiquitinating enzyme highly expressed in neuronal cells [17]. It was one of the markers identified using proteomic methods and verified by us in the rat-controlled cortical impact model of TBI [18]. Cerebrospinal fluid (CSF) and serum UCH-L1 levels are elevated in patients with severe TBI correlating with the severity and outcome of injury [19]. Other studies showed detectability of UCH-L1 in blood following mild TBI and its levels correlate with the traditional clinical assessment [20,21]. UCH-L1 has been used to assess concussions and mild blast brain injury [22,23].
Tau protein is an intracellular, microtubule-associated protein (48–67 kDa) highly enriched in axons. Tau is known to be hyperphosphorylated (P-Tau) at many sites by several protein kinases at multi sites (e.g., Ser-202, Thr-181 and Thr-231) [24]. P-Tau is not capable of binding to the microtubule, but rather, is prone to form an intracellular aggregate (tauopathy). Elevated levels of P-Tau are seen in the postmortem brain of chronic traumatic encephalopathy (CTE) patients years after repetitive mTBI or concussions [25]. Using an ultrasensitive surround optical fiber immunosorbent assay (SOFIA) format for Tau/P-Tau detection, we have also detected acute Tau and P-tau (Ser-202) in serum in an animal model of repetitive closed head injury in mice [26]. We have also observed elevated serum Tau and P-Tau (Thr-231) following severity TBI (within 24 h) [27]. In addition, an independent study also showed that T-Tau elevation in post-concussion among hockey players using the sensitive Quanterix SIMOA assay platform [28]. Elevated Tau levels were observed in post-deployment blood samples from military veterans who experienced mild TBI (average of 18 months after deployment) [29]. Tau levels can be assayed with the Quanterix Neurology 4-plex A kit (that includes Tau, UCH-L1, GFAP, NF-L and Tau) in assessing human TBI blood samples [30] (Supplementary Table 1). Using a new version of Quanterix Neurology 4-plex B kit, Giza et al. reported increased blood UCH-L1 and GFAP after concussion in military cadets [31]. Lastly, McDonald et al. recently reported serum NF-L, tau and GFAP increase post-concussion among Australian footballers [32].
However, before one or more of these biomarkers could reach ‘regulatory readiness’ for use in clinical trials for TBI therapeutics, there are several critical knowledge gaps and barriers to address: identification of more than one assay format for each biomarker as there has yet to be standardization and the ability to cross-reference the results; incomplete assay performance datasets, including reproducibility, the lowest limit of detection and/or lowest limit of quantification; the ability of each assay to detect recombinant versus naturally released human biomarker analyte; and the lack of a systematic side-by-side comparison of all four biomarkers within the same TBI sample set. Lastly, for FDA to formally endorse the use of a biomarker as a drug development tool, such biomarker must undergo a formal ‘biomarker qualification program’ [3,33].
Materials &methods
Human TBI & control CSF procurement
The normal control CSF samples (n = 15) were purchased (Bioreclamation Co., NY, USA). Archived deidentified CSF samples (n = 25) from a severe TBI study were collected from consenting adult subjects presenting to the emergency department of the Ben Taub General Hospital, Baylor College of Medicine (TX, USA). The study protocol was approved by the Baylor College of Medicine IRB, for subjects sustaining blunt trauma to the head with a GCS ≤ 12 at 24 h postinjury (clinical trial registration: NCT00313716; study title: effects of erythropoietin on cerebral vascular dysfunction and anemia in traumatic brain injury). CSF samples were collected with buretrol for up to 10 days or until an intraventriculostomy was no longer clinically indicated. Timed CSF samples (10 ml) with a total collection time not exceeding 1 h were diverted to 15 ml conical polypropylene centrifuge tubes (BD Falcon, MI, USA) by a qualified and trained hospital employee according to the hospital’s standard procedures. These CSF samples (5–10 ml) were then centrifuged at 4000× g with a tabletop centrifuge at room temperature for 5–7 min to remove loose cells and debris. A volume of 1 ml aliquots of cleared CSF (supernatant) was pipetted into a 2-ml cryogenic tube, snap-frozen and stored at -80°C in an ultralow freezer until further use. For this study, timed CSF samples collected within 48 h of injury were used.
Generating pooled TBI CSF & pooled control CSF biosamples
Pooling of TBI CSF samples were done as follows: five 200 μl aliquots from five TBI subjects were pooled into one sample. This process was repeated with distinct subject biosamples until we had five pooled human TBI CSF biosamples (1 ml each). Similarly, five 200 μl aliquots from five control subjects were combined into one pooled sample. This process was repeated with distinct subject biosamples until we reach three pooled control CSF biosamples (1 ml each).
Biomarker assays
For UCH-L1, we included Neuromics #EL22001, LifeSpan Biosciences LS-F258 and the Quanterix SIMOA neurology 4-plex assay kit including UCH-L1. For GFAP, we used Biovendor #RD192072200R, LifeSpan Biosciences LS-F12897 and Quanterix SIMOA neurology 4-plex kit; S100B assays included Biovendor ELISA #RD192090100R, Millipore # EZHS100B-33K. Lastly, Tau assays included MSD assay, Fujirabio #Innotest-Tau, SOFIA Total Tau assay (conducted at SUNY-Downstate) and Quanterix SIMOA neurology 4-plex kit. Commercial assays were conducted according to the manufacturer’s instructions. The SOFIA assay (nonamplified) for Tau was performed as previously described [27] (Supplementary Table 1).
Biomarker protein antigens
Biomarker protein antigens were procured from the following sources: human recombinant GFAP protein (E. coli) DXAG-001 (Dx-sys, Inc., CA, USA), human recombinant UCH-L1 protein (E. coli) DXAG-002 (Dx-sys, Inc.), human S100B (#S6677) (Sigma-Aldrich Co., MO, USA) and recombinant human Tau-441 protein (2N4R isoform) (R-peptide; #T-1001) (GA, USA). Lot numbers for each protein antigen were tracked.
Statistical analysis
All statistical analyses were performed using GraphPad Prism (version 5.0). Data were expressed as mean ± standard error of the mean (SEM) or median (interquartile range), as appropriate. All statistical tests were two-tailed and a p-value <0.05 was considered significant.
Results
Procuring commonly used assay formats for the four key TBI biomarkers (UCH-L1, GFAP, S100B, Tau) & recombinant protein antigen as standards
Two to four commonly used assay formats we identified for the top four TBI biomarkers (UCH-L1, GFAP, S100B, Tau) are presented following and in Table 1. For UCH-L1, we tested the Neuromics #EL22001, LifeSpan Biosciences LS-F258, Quanterix SIMOA neurology 4-plex Neurology 4-Plex A (GFAP, NF-L, UCH-L1 and Tau) (#102153). For GFAP, we tested the Biovendor #RD192072200R, LifeSpan Biosciences LS-F12897 and Quanterix SIMOA neurology 4-plex A (#102153). S100B assays included the Biovendor ELISA #RD192090100R, Millipore #EZHS100B-33K. Lastly, Tau assays tested were the Fujirabio #Innotest-Tau, SOFIA Total Tau assay (conducted at SUNY-Downstate) and Quanterix SIMOA neurology 4-plex A (#102153) and MesoScale Discovery (#K15121D-1).
Table 1. . Composite performance on biomarker assay platforms in human traumatic brain injury and control cerebrospinal fluid testing results.
| Biomarker | Assay format | Detection range | Ability to detect NNBR standard | NNBR std/kit standard ratio | Reported pooled human TBI CSF (ng/ml) | Reported pooled human control CSF (ng/ml) | Ratio TBI CSF/con CSF | NNBR standards adjusted average pooled human TBI CSF levels (ng/ml) | Comparison ratio based on Quanterix GFAP, UCH-L1, Tau and Millipore S100B |
|---|---|---|---|---|---|---|---|---|---|
| GFAP | Biovendor ELISA #RD192072200R (lot #E16-056) | 0.25–25 ng/ml | Yes | 1.276 | 243.55 ± 10.0 (ng/ml) | 0.49 ± 0.25 (ng/ml) | 494 | 310.8 | 0.26 |
| LifeSpan Biosciences LS-F258 (lot #5594) | 0.156–10.0 ng/ml | No | (Not detected) | 8.82 ± 0.06 (ng/ml) | 8.84 ± 0.02 (ng/ml) | 1.0 | n.a. | 7.05 | |
| Quanterix Neurology 4-plex GFAP (Batch #58) | 3.6–2250 pg/ml | Yes | 0.49 | 62.19 ± 20.46 (ng/ml) | 0.870 ± 0.341 (ng/ml) | 71.5 | 30.5 | 1.00 | |
| UCH-L1 | Neuromic #EL22001 (lot #08042016) | 0.078–5.00 ng/ml | Yes | 0.343 | 4.85 ± 2.12 (ng/ml) | 1.43 ± 0.68 (ng/ml) | 3.4 | 1.7 | 0.48 |
| LifeSpan Biosciences LS-F12897 (lot #5542) | 0.078–5.00 ng/ml | No | (Not detected) | 3.50 ± 0.04 (ng/ml) | 3.7 ± 0.08 (ng/ml) | 0.9 | n.a. | 0.35 | |
| Quanterix Neurology 4-plex UCH-L1 (Batch #58) | 49–3600 pg/ml | Yes | 0.813 | 10.02 ± 3.47 (ng/ml) | 1.54 ± 0.07 (ng/ml) | 6.5 | 12.3 | 1.00 | |
| S100B | Biovendor ELISA #RD192090100R (lot #E16-052P01) | 5.0–320 pg/ml | Yes | 0.053 | 3.03 ± 2.56 (pg/ml) | 0.072 ± 0.011 (pg/ml) | 42 | 0.16 | 0.069 |
| Millipore #EZHS100B-33K (lost #833-7K) | 2.74–2000 pg/ml | No | 43.66 ± 16.59 (pg/ml) | 0.073 ± 0.094 (pg/ml) | 599 | n.a. | 1.00 | ||
| Tau | MesoScale Ptau-Total Tau kit (K15121D-1) | 0.24–1000 pg/ml | Yes | 1.47 | 6005 ± 3554 (pg/ml) | 803 ± 257 (pg/ml) | 7.48 | 8483 (pg/ml) | 41.72 |
| SOFIA Tau assay | 0.01 pg/ml–10.0 ng/ml | Yes | 0.945 | 358.7 ± 12.31 (pg/ml) | 0.390 ± 0.20 (pg/ml) | 932 | 339.9 (pg/ml) | 0.25 | |
| Fujirebio INNOTEST® HTAU AG ELISA (lot #402905) | 42 pg/ml–2.39 ng/ml | Yes | 0.274 | 1285 ± 1111 (pg/ml) | 225 ± 3 (pg/ml) | 5.71 | 291.7 (pg/ml) | 8.86 | |
| Quanterix SIMOA Tau assay (batch #58) | 0.49–7360 pg/ml | Yes | 0.241 | 145 ± 48 (pg/ml) | 38.2 ± 16.6 (pg/ml) | 3.8 | 34.9 (pg/ml) | 1.00 |
CSF: Cerebrospinal fluid; GFAP: Glial fibrillary acidic protein; TBI: Traumatic brain injury.
We also searched for a number of recombinant protein antigen suppliers and identified the following human protein standards based on purity, accurately reported molecular weight and confirmation by gel electrophoresis or immunoblotting for authentication. We identified the following four recombinant human proteins: UCH-L1 (233 residues; Dx-Sys; DXAG-001), GFAP (432 residues; Dx-Sys; DXAG-002), S100B (92 residues; Sigma; #S6677) and Tau (four repeat isoform with 441 residues; R-peptide; #T-1001) (Figure 1 left).
Figure 1. . Human traumatic brain injury biomarker antigen used as a gold standard solution for this study.

Left: source of the protein antigen and properties. Right: purity quality control of the four protein biomarker standards (UCH-L1, GFAP, S100B and Tau-441). First batch: SDS (10–20%) gradient polyacrylamide. Gel electrophoresis was performed followed by Coomassie blue R250 staining. Purity is 93–95% by densitometry analysis.
To determine the concentrations of the four TBI biomarkers (UCH-L1, GFAP, S100B and Tau-441), during our preliminary method screens, we determined that while the MS/MS-MRM method is useful for antigen-positive identification, it is not robust enough for quantification. Therefore, we produced solutions for each of the four standard proteins adjusted to 0.500 mg/ml based on the manufactured-provided original protein amount or concentration. We then used two protein assay methods (pierce protein microplate assay and SDS-gel electrophoresis-Coomassie blue staining method). The former is a colorimetric 96-well-based assay. The latter was conducted by loading 10 μl of the unknown samples in an SDS-PAGE lane alongside lanes loaded with various protein amounts of BSA to generate a standard curve. Both of these assays gave variable results for each of the four protein markers – likely due to different degrees of dye binding (Supplementary Table 2). Finally, we turned to a UV absorbance (280 nm)-based quantification method. This is coupled with the target protein’s calculated molar extinction coefficient or molar absorptivity (8855 M-1 cm-1 for UCH-L1, 20,400 M-1 cm-1 for GFAP, 1615 M-1 cm-1 for S100B and 7575 M-1 cm-1 for Tau441) (https://www.biomol.net/en/tools/proteinextinction.htm) as an alternate protein biomarker qualification on a Quanterix 96-well plate (Supplementary Table 2) using this formula:
| (Eq. 1) |
where absorbance (A), molar concentration (c), the light path length in centimeters (L) and molar absorptivity (ε) for the dissolved substance is given at the specified wavelength (λ = 280 nm).
Taken together, we determined that the UV absorbance (280 nm)-based quantification method was the most reliable method, as it does not rely on dye binding. Based on these values, we readjusted the protein concentration to 0.5 mg/ml for each of the four protein stock solutions to be used as gold standards.
In addition, we also used the SDS-PAGE/Coomassie blue staining method to determine the quality of the four protein markers. We found that their gel mobility was consistent with their predicted molecular weight. For Tau, there is a high-molecular weight band – that is likely an oligomeric form of Tau411 – as it reacted with several Tau antibodies, we have tested (e.g., polyclonal DAKO A0024, monoclonal DA9, DA31). In addition, by the high-resolution scanner (Epson Flatbed scanner) and densitometry analysis with NIH Image J (version 1.7), we also determined that all four proteins have greater than 93% purity (Figure 1). We termed these UF’s NNBR standards.
Testing the four quantified gold-standard human TBI biomarker analyte solutions in all available assay formats
The performance study was completed on 2–3 assay formats for each of of the four biomarkers on antigen standard from a vendor along with UF’s NNBR standards as follows. For UCH-L1, Lifespan Biosciences and Neuromics both demonstrated a detection range of 0.078–5.00 ng/ml, but the Quanterix N4PA was more sensitive (49–3600 pg/ml). While the Quanterix assay could detect the UF’s NNBR standard almost 1:1, and Neuromics assay could also detect UF’s NNBR UCH-L1 standard but at 2.2-fold-lower signals. The Lifespan assay entirely failed to detect the NNBR standard UCH-L1 (Figure 2).
Figure 2. . Standard curve for three UCH-L1 assays based on vendors; standard and UF’s NNBR gold standard.

(Mean + SD are shown, n = 3).
SD: Standard deviation.
For GFAP, the Lifespan Biosciences assay detected a range of 0.156–10.0 ng/ml, Biovendor detected 0.195–12.5 ng/ml, while Quatnerix N4PA detected 3.6–2250 pg/ml. Quanterix detected the NNBR standard, but gave about twofold weaker signals (Figure 3). Again, the Lifespan assay failed to detect the NNBR GFAP standard. Biovendor detected NNBR GFAP at 1:1 (Figure 3).
Figure 3. . Standard curve for three GFAP assays based on vendors; standard and UF’s NNBR gold standard.

(Mean + SD are shown, n = 3).
SD: Standard deviation.
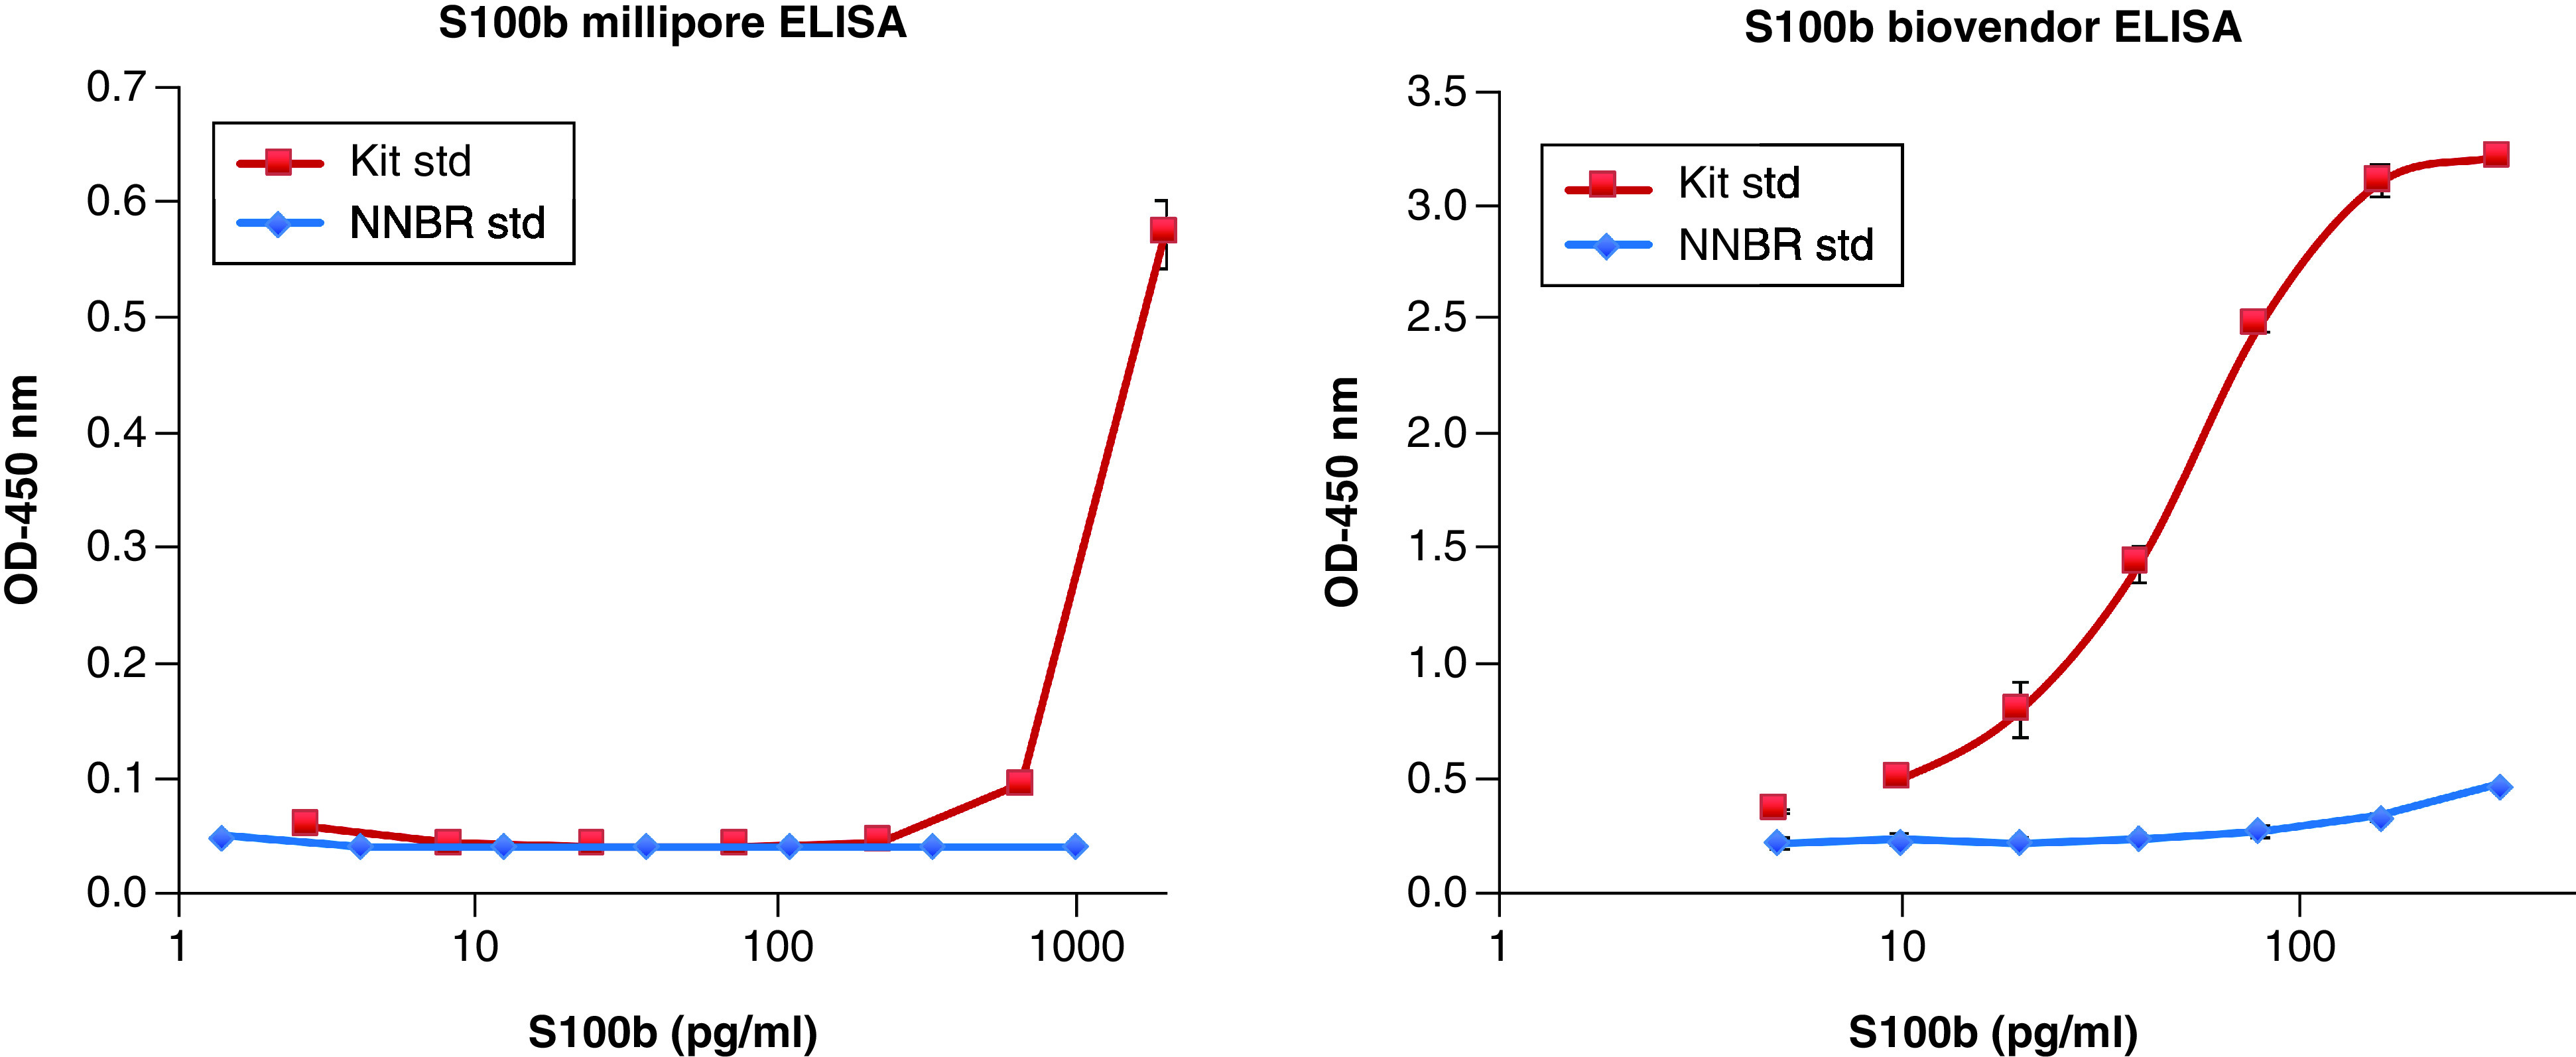
For S100B, the Biovendor assay demonstrated a detection range of 5.0–320 pg/ml, while the Millipore assay had a range of 2.74–2000 pg/ml. Both assays detected the vendor’s standards but failed to detect the NNBR S100B protein standard (Figure 4).
Figure 4. . Standard curve for two S100B assays based on vendors; standard and UF’s NNBR gold standard.
(Mean + SD are shown, n = 3).
SD: Standard deviation.
For Tau, the Fujirebio INNOTEST® HTAU AG had a range of detection of 42–2.39 ng/ml, the MesoScale Tau assay demonstrated a range of 0.24–1000 pg/ml, however, the Quanterix N4PA Tau assay (0.49–7360 pg/ml) and SOFIA Tau assay (0.01–10.0 ng/ml) were both more sensitive. All four assays detected the NNBR Tau standard, however, Fujirabio and Quanterix yielded only a third of the signals of the NNBR Tau standards (Figure 5).
Figure 5. . Standard curve for four Tau assays based on vendors; standard and UF’s NNBR gold standard.

(Mean + SD are shown, n = 3).
SD: Standard deviation; SOFIA: Surround optical fiber immunosorbent assay.
Since our recombinant protein standards were not detected in all assay formats – we also sought to identify natively released TBI protein biomarker sources. We used pooled human TBI CSF samples (each pooled sample is from five subjects with 200 μl of severe TBI CSF) and we used a total of five pooled CSF – thus – it represents pooled samples from 25 TBI subjects. Similarly, we pooled from five normal control CSF samples (200 μl) into one pooled control and utilized three such pooled sets.
Our collective results show that only some assay platforms were capable of detecting 5-μl positive controls human TBI samples and could distinguish them from negative controls with a fold-difference of at least threefold. For UCH-L1, the Lifespan UCH-L1 assay failed to distinguish pooled TBI CSF from pooled control CSF. The Neuromics and Quanterix assays could both distinguish TBI CSF versus control CSF, with a signal fold ratio TBI/control of 3.40- and 6.50-fold, respectively (Supplementary Figure 1 & Table 1).
For GFAP, the Lifespan assay failed to distinguish pooled TBI CSF from pooled control CSF samples, while both the Biovendor and Quanterix assays were able to do so, with a TBI/control CSF ratio of 494- and 71.5-fold, respectively (Supplementary Figure 2 & Table 1).
For S100B, both the Millipore and Biovendor assays could readily distinguish pooled TBI CSF and from pooled control CSF samples, with a TBI/control CSF ratio of 42- and 559-fold, respectively (Supplementary Figure 3 & Table 1).
For Tau, all vendor assays tested could detect and distinguish Tau protein present in human-pooled TBI CSF versus pooled control CSF. MesoScale, SOFIA, Fujirebio and Quanterix SIMOA Tau assays have a pooled TBI/control CSF ratio of 7.48-, 932-, 5.71- and 3.8-fold, respectively (Supplementary Figure 4 & Table 1).
Across-assay standardization
The ultimate objective of using these biomarker assays is to reliably detect and report on TBI biomarker protein levels and to be able to compare across existing studies and future studies. Thus, we used our findings to standardize assays across the various platform.
We created an NNBR standard/vendor kit standard ratio, based on the second-highest concentration in the standard curve. The second-highest concentration was chosen so we can compare performance with a subsaturation level for each assay. These ratios are shown in the column of the same name in (Table 1). On the third column from the right, we also applied this NNBR standard/vendor standard ratio to derive an adjusted pooled human TBI CSF levels (in pg/ml), as both Lifespan UCH-L1 and GFAP failed to distinguish TBI versus control – we did not include those in this analysis. Using this method, Biovendor versus Quanterix GFAP assays still reported tenfold different values (310.8 vs 30.5 ng/ml). Similarly, Neuromics versus Quanterix UCH-L1 assays has tenfold different values (1.7 vs 12.3 ng/ml). For S100B, the adjusted Biovendor assay versus nonadjusted Millipore assays reported (0.16 vs 43 ng/ml). For Tau, SOFIA and Quanterix are now reported similarly TBI CSF tau values (33.9 vs 34.9 pg/ml). While Fujirebio reported about the tenfold high value (352.1 pg/ml). MSD assay reported the highest Tau levels (8476 pg/ml; Table 1). Thus overall, despite the standardization attempts, these research-use assays still reported different biomarker levels on the same human TBI CSF biosamples.
Our final attempt to standardize assays was to select the most sensitive platform for GFAP, UCH-L1 and Tau (Quanterix) and S100B (Millipore) as standards, and calculate the comparison ratio based on the reported pooled TBI CSF biomarker values. Thus, Quanterix GFAP, UCH-L1 and Tau, and the Millipore S100B assay have a comparison ratio set to one, while the comparison ratio for the other assays are shown at the far right column of Table 1. Using this principle, we propose to potentially use of such a comparison ratio when comparing reported values from different assay platforms for these four TBI biomarkers.
Discussion
In this study, due to the emerging potential of using different TBi protein biomarkers in patient-derived biofluids, we examined the performance of different assays platforms for the four most frequently used TBI biomarkers, UCH-L1, GFAP, S100B and Tau. These four protein biomarkers were identified by a data-driven approach as candidate predictive biomarkers and/or pharmacodynamic biomarkers or as clinical trial patient enrichment tools in TBI therapeutic trials [4]. We also derived NNBR gold standard solutions using recombinant protein for these four markers (at 0.500 mg/ml). We identified at least one assay format for each of four biomarkers that can robustly detect 5-μl pooled TBI CSF and distinguish TBI CSF pooled from control CSF. We also noted that both S100B assays performed well, suggesting that they can recognize natively released S100B. The objective of this study is to systemically fill these gaps and to determine, which biomarker(s) are ‘regulatory ready’ and potentially enter these biomarkers into the FDA Biomarker quantification program [3,33].
We learned that both Lifespan assays for GFAP and UCH-L1 failed to detect the gold standard solution. Not surprisingly, they also fail to distinguish pooled TBI CSF versus pooled control CSF. The exception was the Millipore S100B that did not detect our NNBR gold standard S100B, but still performs well in distinguish TBI versus control pooled CSF. We also noted that even the Biovendor S100B only weakly detected the NNBR S100B standard. Perhaps going forward native S100B protein standard needs to be procured. Our results show that only some assay platforms can detect 5-μl positive controls human TBI samples and can distinguish them for negative controls with a fold-difference of at least three. Thus, this component shows that this is a good strategy to test assay platforms too with natively released protein antigens in human biofluid samples. We further derived a comparison ratio based on the reported pooled TBI CSF biomarker values, using values reported for GFAP, UCH-L1 with Quanterix platform, and Tau and the S100B with Millipore platform as the gold standard (Table 1). Thus, these comparison ratios can be used to compare reported values from different assay platforms for these four TBI biomarkers.
In summary, we have characterized several platforms of four TBI biomarkers. Gold standard solutions (0.500 mg/ml) for these markers using recombinant proteins have been generated with the absorbance/extinction coefficient method. We have also procured pooled positive control with a natively released biomarker (five pooled TBI CSF from five subjects each) and negative controls (three pooled control CSF from five controls each) generated (initial vol. 1 ml each). We intend to make aliquots of these standard solutions available to other researchers who might have additional biomarker assays for such markers upon request.
There are some limitations to our study. For example, our gold standard proteins are recombinant proteins expressed in the prokaryotic system (E. coli), which may not mimic the post-translational modifications of the eukaryotic systems. Secondary assay systems use different antibodies likely recognizing different epitopes. These factors can affect the observed discrepancies and differences. At the time of our study, only the Quanterix Neurology 4-plex ‘A’ assay was available. This was used in our study. Since then, a Quanterix has produced a Neurology 4-plex ‘B’ assay that has a tenfold higher upper range for GFAP (40,000 pg/ml instead of 4000 pg/ml). Thus, this assay might have better performance in quantifying GFAP levels. In addition, neurofilament-L has emerged as strong candidate biomarkers for tracking TBI disease progression. In future work, we should also examine the performance of TBI biomarker assays in TBI serum/plasma versus their health control counterparts.
Finally, the significance of this study is that our results show that currently available assay formats for the four TBI markers we examined are variable in performance, sensitivity and in detecting natively derived antigens. The implication is that caution should be exercised when comparing reported biomarker levels across assay platforms in clinical research studies. Standardization strategies are strongly recommended when comparing reported biomarker levels across assay platforms.
Conclusion
The currently available assay formats for these four TBI markers are variable in performance, sensitivity and in detecting natively derived antigens. Standardization strategies are recommended when comparing reported biomarker levels across assay platforms.
Summary points.
Currently, there are no US FDA-approved drugs to treat traumatic brain injury (TBI).
Biofluid-based TBI biomarker assays can be used as predictive and pharmacodynamic biomarkers and facilitate clinical trials for new drugs.
The astroglial markers GFAP and S100B, the neuronal markers UCH-L1 and Tau are among the top candidates for such purposes.
To measure these biomarker proteins in human biofluids, one relies on either commercial or home-brew assays.
However, when we compare two–four assay formats for each biomarker, we found that there are high variability among TBI marker assays in terms of assay analytic performance, reported biomarker values and ability to differentiate TBI versus healthy control biofluid.
Caution should be exercised when comparing reported biomarker levels across assay platforms.
Preferably, an assay standardization strategy should be applied.
Supplementary Material
Acknowledgments
The authors thank Claudia Robertson for providing archived human TBI CSF samples for use in this study. They thank the TBI Endpoints Development team and the TRACK-TBI team members for helpful discussions.
Footnotes
Supplementary data
To view the supplementary data that accompany this paper please visit the journal website at: www.futuremedicine.com/doi/suppl/10.2217/bmm-2021-0284
Financial & competing interests disclosure
This study is mainly supported by DOD TBI Endpoints Development (TED) Seed Project TED1506/ W81XWH-14-2-0176 (KK Wang) and DOD Grant W81XWH-14-2-0176 (KK Wang and Principal Investigator GT Manley). The study is also supported in part by NIH 1U01 NS086090-01 (KK Wang, overall Principal Investigator GT Manley) and DOD-Army grant W81XWH-14-2-0166 (R Rubenstein). The authors have no other relevant affiliations or financial involvement with any organization or entity with a financial interest in or financial conflict with the subject matter or materials discussed in the manuscript apart from those disclosed.
No writing assistance was utilized in the production of this manuscript.
References
- 1.Taylor CA, Bell JM, Breiding MJ, Xu L. Traumatic brain injury-related emergency department visits, hospitalizations, and deaths - United States, 2007 and 2013. MMWR Surveill. Summ. 66(9), 1–16 (2017). [DOI] [PMC free article] [PubMed] [Google Scholar]
- 2.Wang KKW, Stephenson D, Robbins A et al. FDA biomarkers RIF response appendix TRACK comment from TRACK-TBI and TED Investigators (2015). http://www.regulations.gov/#!documentDetail;D=FDA-2014-N-2187–0015
- 3.Amur S, LaVange L, Zineh I, Buckman-Garner S, Woodcock J. Biomarker qualification: toward a multiple stakeholder framework for biomarker development, regulatory acceptance, and utilization. Clin. Pharmacol. Ther. 98(1), 34–46 (2015). [DOI] [PubMed] [Google Scholar]
- 4.FDA-NIH Biomarker Working Group. BEST (Biomarkers, EndpointS, and other Tools) resource (2018). https://www.ncbi.nlm.nih.govbooksNBKpdfBookshelfNBK.pdf [PubMed]
- 5.Wang KK, Yang Z, Zhu T et al. An update on diagnostic and prognostic biomarkers for traumatic brain injury. Expert Rev. Mol. Diagn. 18(2), 2018 (2018). [DOI] [PMC free article] [PubMed] [Google Scholar]
- 6.Yang Z, Wang KKW. Glial fibrillary acidic protein: from intermediate filament assembly and gliosis to neurobiomarker. Trends Neurosci. 38(6), 364–374 (2015). [DOI] [PMC free article] [PubMed] [Google Scholar]
- 7.Zoltewicz JS, Mondello S, Yang B et al. Biomarkers track damage after graded injury severity in a rat model of penetrating brain injury. J. Neurotrauma 30(13), 1161–1169 (2013). [DOI] [PubMed] [Google Scholar]
- 8.Vos PE, Jacobs B, Andriessen TM et al. GFAP and S100B are biomarkers of traumatic brain injury: an observational cohort study. Neurology 75(20), 1786–1793 (2010). [DOI] [PubMed] [Google Scholar]
- 9.Okonkwo DO, Yue JK, Puccio AM et al. GFAP-BDP as an acute diagnostic marker in traumatic brain injury: results from the prospective transforming research and clinical knowledge in traumatic brain injury study. J. Neurotrauma 30(17), 1490–1497 (2013). [DOI] [PMC free article] [PubMed] [Google Scholar]
- 10.Papa L, Brophy GM, Welch RD et al. Time course and diagnostic accuracy of Glial and neuronal blood biomarkers GFAP and UCH-L1 in a large cohort of trauma patients with and without mild traumatic brain injury. JAMA Neurol. 73(5), 551–560 (2016). [DOI] [PMC free article] [PubMed] [Google Scholar]
- 11.Agoston DV, Elsayed M. Serum-based protein biomarkers in blast-induced traumatic brain injury spectrum disorder. Front. Neurol. 3, 107 (2012). [DOI] [PMC free article] [PubMed] [Google Scholar]
- 12.Thelin EP, Nelson DW, Bellander B-M. A review of the clinical utility of serum S100B protein levels in the assessment of traumatic brain injury. Acta Neurochir. 159(2), 209–225 (2017). [DOI] [PMC free article] [PubMed] [Google Scholar]
- 13.Rainey T, Lesko M, Sacho R, Lecky F, Childs C. Predicting outcome after severe traumatic brain injury using the serum S100B biomarker: results using a single (24h) time-point. Resuscitation 80(3), 341–345 (2009). [DOI] [PubMed] [Google Scholar]
- 14.Cervellin G, Benatti M, Carbucicchio A et al. Serum levels of protein S100B predict intracranial lesions in mild head injury. Clin. Biochem. 45(6), 408–411 (2012). [DOI] [PubMed] [Google Scholar]
- 15.Kiechle K, Bazarian JJ, Merchant-Borna K et al. Subject-specific increases in serum S-100B distinguish sports-related concussion from sports-related exertion. PLoS ONE 9(1), e84977 (2014). [DOI] [PMC free article] [PubMed] [Google Scholar]
- 16.Papa L, Silvestri S, Brophy GM et al. GFAP out-performs S100β in detecting traumatic intracranial lesions on computed tomography in trauma patients with mild traumatic brain injury and those with extracranial lesions. J. Neurotrauma 31(22), 1815–1822 (2014). [DOI] [PMC free article] [PubMed] [Google Scholar]
- 17.Wang KK, Yang Z, Sarkis G, Torres I, Raghavan V. Ubiquitin C-terminal hydrolase-L1 (UCH-L1) as a therapeutic and diagnostic target in neurodegeneration, neurotrauma and neuro-injuries. Expert Opin. Ther. Targets. 21(6), 627–638 (2017). [DOI] [PubMed] [Google Scholar]
- 18.Liu MC, Akinyi L, Scharf D et al. Ubiquitin C-terminal hydrolase-L1 as a biomarker for ischemic and traumatic brain injury in rats. Eur. J. Neurosci. 31(4), 722–732 (2010). [DOI] [PMC free article] [PubMed] [Google Scholar]
- 19.Brophy GM, Mondello S, Papa L et al. Biokinetic analysis of ubiquitin C-terminal hydrolase-L1 (UCH-L1) in severe traumatic brain injury patient biofluids. J. Neurotrauma 28(6), 861–870 (2011). [DOI] [PMC free article] [PubMed] [Google Scholar]
- 20.Papa L, Lewis LM, Silvestri S et al. Serum levels of ubiquitin C-terminal hydrolase distinguish mild traumatic brain injury from trauma controls and are elevated in mild and moderate traumatic brain injury patients with intracranial lesions and neurosurgical intervention. J. Trauma Acute Care Surg. 72(5), 1335–1344 (2012). [DOI] [PMC free article] [PubMed] [Google Scholar]
- 21.Diaz-Arrastia R, Wang KKW, Papa L et al. Acute biomarkers of traumatic brain injury: relationship between plasma levels of ubiquitin C-terminal hydrolase-L1 and Glial Fibrillary acidic protein | abstract. J. Neurotrauma 31(1), 19–25 (2014). [DOI] [PMC free article] [PubMed] [Google Scholar]
- 22.Tate CM, Wang KKW, Eonta S et al. Serum brain biomarker level, neurocognitive performance, and self-reported symptom changes in soldiers repeatedly exposed to low-level blast: a breacher pilot study. J. Neurotrauma 30(19), 1620–1630 (2013). [DOI] [PubMed] [Google Scholar]
- 23.Puvenna V, Brennan C, Shaw G et al. Significance of ubiquitin carboxy-terminal hydrolase L1 elevations in athletes after sub-concussive head hits. PLoS ONE 9(5), e96296 (2014). [DOI] [PMC free article] [PubMed] [Google Scholar]
- 24.Duan Y, Dong S, Gu F, Hu Y, Zhao Z. Advances in the pathogenesis of Alzheimer’s disease: focusing on tau-mediated neurodegeneration. Transl. Neurodegener. 1(1), 24 (2012). [DOI] [PMC free article] [PubMed] [Google Scholar]
- 25.McKee AC, Cantu RC, Nowinski CJ et al. Chronic traumatic encephalopathy in athletes: progressive tauopathy after repetitive head injury. J. Neuropathol. Exp. Neurol. 68(7), 709–735 (2009). [DOI] [PMC free article] [PubMed] [Google Scholar]
- 26.Yang Z, Wang P, Morgan D et al. Temporal MRI characterization, neurobiochemical and neurobehavioral changes in a mouse repetitive concussive head injury model. Sci. Rep. 5(1), 11178 (2015). [DOI] [PMC free article] [PubMed] [Google Scholar]
- 27.Rubenstein R, Chang B, Davies P, Wagner AK, Robertson CS, Wang KKW. A novel, ultrasensitive assay for tau: potential for assessing traumatic brain injury in tissues and biofluids. J. Neurotrauma 32(5), 342–352 (2015). [DOI] [PMC free article] [PubMed] [Google Scholar]
- 28.Shahim P, Tegner Y, Wilson DH et al. Blood biomarkers for brain injury in concussed professional ice hockey players. JAMA Neurol. 71(6), 684–692 (2014). [DOI] [PubMed] [Google Scholar]
- 29.Olivera A, Lejbman N, Jeromin A et al. Peripheral total tau in military personnel who sustain traumatic brain injuries during deployment. JAMA Neurol. 72(10), 1109–1116 (2015). [DOI] [PubMed] [Google Scholar]
- 30.Korley FK, Yue JK, Wilson DH et al. Performance evaluation of a multiplex assay for simultaneous detection of four clinically relevant traumatic brain injury biomarkers. J. Neurotrauma 36(1), 182–187 (2019). [DOI] [PMC free article] [PubMed] [Google Scholar]
- 31.Giza CC, McCrea M, Huber D et al. Assessment of blood biomarker profile after acute concussion during combative training among US military cadets: a prospective study from the NCAA and US Department of Defense CARE Consortium. JAMA Network Open. 4(2), e2037731–e2037731 (2021). [DOI] [PMC free article] [PubMed] [Google Scholar]
- 32.McDonald SJ, O’Brien WT, Symons GF et al. Prolonged elevation of serum neurofilament light after concussion in male Australian football players. Biomark. Res. 9(1), 4–9 (2021). [DOI] [PMC free article] [PubMed] [Google Scholar]
- 33.Amur SG, Sanyal S, Chakravarty AG et al. Building a roadmap to biomarker qualification: challenges and opportunities. Biomark. Med. 9(11), 1095–1105 (2015). [DOI] [PubMed] [Google Scholar]
Associated Data
This section collects any data citations, data availability statements, or supplementary materials included in this article.