Abstract
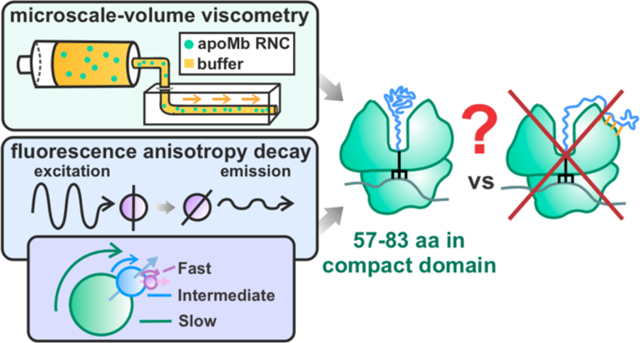
This work introduces a technology that combines fluorescence anisotropy decay with microscale-volume viscometry to investigate the compaction and dynamics of ribosome-bound nascent proteins. Protein folding in the cell, especially when nascent chains emerge from the ribosomal tunnel, is poorly understood. Previous investigations based on fluorescence anisotropy decay determined that a portion of the ribosome-bound nascent protein apomyoglobin (apoMb) forms a compact structure. This work, however, could not assess the size of the compact region. The combination of fluorescence anisotropy with microscale-volume viscometry, presented here, enables identifying the size of compact nascent-chain subdomains using a single fluorophore label. Our results demonstrate that the compact region of nascent apoMb contains 57–83 amino acids, and lacks residues corresponding to the two native C-terminal helices. These amino acids are necessary for fully burying the nonpolar residues in the native structure, yet they are not available for folding before ribosome release. Therefore, apoMb requires a significant degree of post-translational folding for the generation of its native structure. In summary, the combination of fluorescence anisotropy decay and microscale-volume viscometry is a powerful approach to determine the size of independently tumbling compact regions of biomolecules. This technology is of general applicability to compact macromolecules linked to larger frameworks.
Graphical Abstract
INTRODUCTION
Correct protein folding is essential for the proper function of living organisms and for the efficient large-scale production of biomedically relevant proteins in the context of biotechnology and pharmaceutical applications. While in vitro refolding of pure proteins has helped explain general aspects of the process and underlying trends,1–3 protein folding within the cellular environment, including the role of the ribosome and molecular chaperones, is still poorly understood. 4–7
Many proteins begin folding cotranslationally before they are released from the ribosome.4, 8–15 The ribosome plays an important role in protein folding. On one hand, it may act as a chaperone.16–21 On the other hand, the ribosome is known to influence cotranslational folding by confining the motion of nascent chains,9, 15, 22, 23 by enabling interactions between the nascent chain and the ribosomal tunnel24, 25 and(or) ribosomal surface26–29 and by promoting nascent-chain solubility.30 Immediately after release from the ribosome, single-domain nascent proteins must be properly kinetically channeled to their native state to prevent the formation of aggregated states.30 The ribosomal exit tunnel, which is approximately 100 Å long and has a width of 10–20 Å, can be divided into two regions: the tunnel core, and the vestibule, which encompasses the last 20 Å of the tunnel and is wider than the rest of the ribosomal tunnel.31, 32 The exit tunnel generally hosts approximately 30 – 40 amino acids, depending on the sequence and structure of the nascent protein.23, 33–35 More residues can be hosted if the nascent protein adopts tertiary structure within the tunnel.36, 37 Within the tunnel core, nascent chains can form α-helical secondary structure, 9, 23, 38, 39 tertiary interactions,10, 40 and even fully folded states.36, 37, 41 In addition, larger tertiary structures can form within the tunnel vestibule.12, 42, 43
In order to better understand the extent of protein folding during protein biogenesis, Ellis et al. addressed the development of nascent-protein compaction within stalled ribosome-bound nascent chains (RNCs).13 The protein apomyoglobin from sperm whale (apoMb) was selected as a model system for this work, and transcription-translation was carried out in cell-free systems.4, 44 These studies addressed RNC compaction as a function of chain elongation by fluorescence anisotropy-decay analysis.13 The investigations by Ellis et al. revealed two rotational motions of short nascent chains (less than 57 amino acids) that correspond solely to the dynamics of the ribosome and the fluorescently-labeled N-terminal region of the nascent chain.13 However, apoMb RNCs bearing nascent chains longer than 57 residues display a third component corresponding to a rotational correlation time of several ns.13 This component is absent from the anisotropy decay of RNCs carrying an intrinsically-disordered nascent protein, and it is characterized by a smaller rotational correlation time (ca. 4–7 ns) than the ribosome-released folded protein (ca. 40–50 ns). This anisotropy-decay component established the presence of a compact subdomain within the nascent chain.13
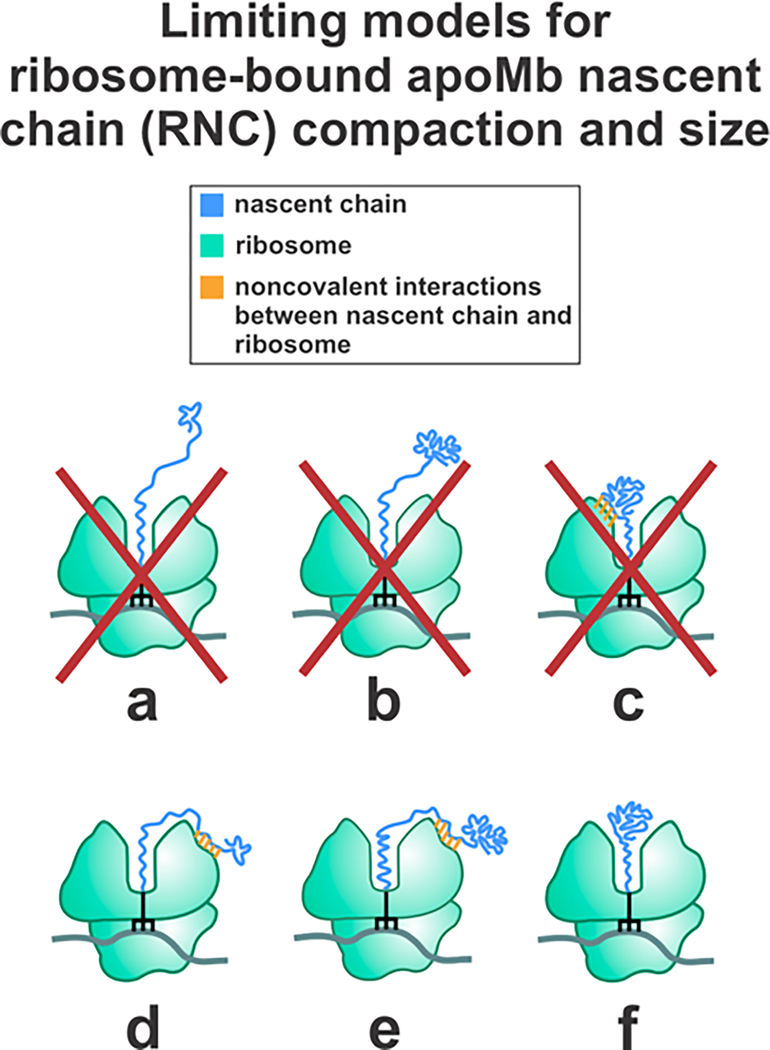
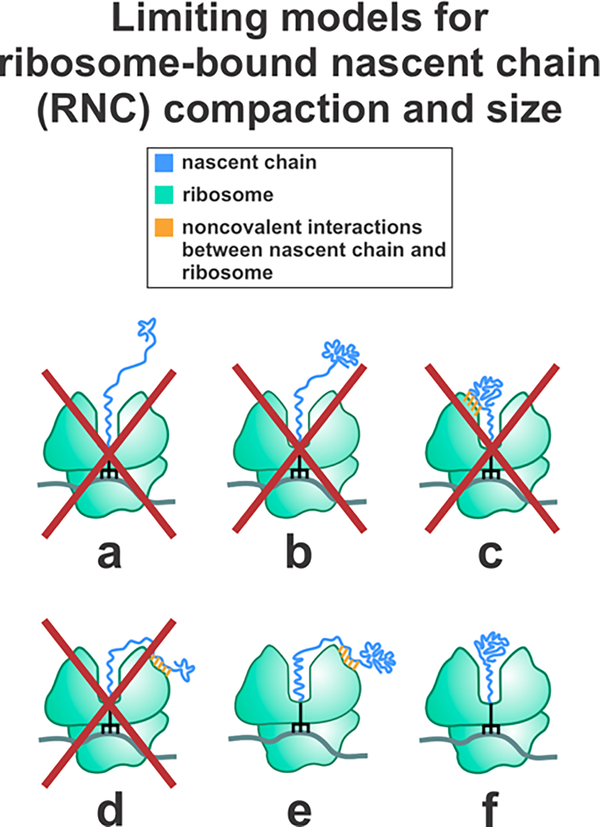
The abovementioned investigations, however, were unable to unequivocally determine the number of amino acids belonging to the compact nascent-chain domain, given that they relied on indirect information on solution viscosity inferred from fluorescence data. Specifically, the above studies estimated the viscosity of RNC solutions from the rotational correlation time of either a small fluorescent dye or ribosome-released apoMb.13 Given that the solution viscosity deduced from these two approaches were significantly different, it was impossible to draw clear conclusions on the size of the compact RNC subdomain. Therefore, while previous work demonstrated that RNCs longer than 57 residues bear a compact nascent chain, the number of amino acids corresponding to this compact region could not be assessed. This concept is pictorially illustrated in Figure 1, which shows that conformations a-c can be excluded due to previous studies reporting small-amplitude local RNC motions on the ns timescale.13 Until now, however, it has been impossible to discriminate between small (species d) and large (species e and f) nascent-chain conformations.
Figure 1.
Hypothetical limiting models describing the ribosome-bound apoMb nascent chain (RNC) compaction. Models a and b can be eliminated due to the known highly spatially confined environment of the nascent chain (cone semiangle = 20 ± 1°).15 Model c can be eliminated because the compact region explored in this work independently tumbles on the low-ns timescale (see fluorescence anisotropy decay analysis). This timescale is incompatible with the much slower tumbling of the ribosome.13 Models d, e, and f are consistent with previously published work but could not be discriminated from each other in the past.
In this work, we address the above gap of knowledge by combining fluorescence anisotropy decays with direct viscosity measurements to identify the size of compact nascent-chain domains of apoMb RNCs. Our results show that the compact nascent chain comprises 37 – 54% of the amino-acid sequence, hence it lacks C-terminal residues corresponding to 46 – 63% of the chain. Therefore, a significant portion of the RNC must fold post-translationally. In all, this work demonstrates that fluorescence anisotropy decays can be synergistically combined with microscale-volume viscometry to unveil the compaction of nascent chains. The technology introduced here is of wide applicability to any compact macromolecule linked to larger frameworks. In addition, this approach is particularly straightforward as it only requires a single fluorophore (extrinsic or intrinsic) per biomolecule of interest.
METHODS
Generation of RNC Complexes.
An E. coli cell-free transcription-translation system was used to produce ribosome-bound apoMb153 nascent-chain complexes as described.13, 45 This cell-free system included an E. coli S30 extract prepared from the K12 A19 strain45, 46 and a pET-Blue1 plasmid encoding the sperm-whale apomyoglobin gene with an E. coli-optimized nucleotide sequence.47 In addition, the cell-free system included oligodeoxynucleotides designed to carry a complementary sequence to that of the mRNA region immediately before the stop codon (see Supporting Information for more details). Consistent with the oligodeoxynucleotide-directed mRNA cleavage approach,4 the oligodeoxynucleotides bind the mRNA, followed by site-specific DNA-RNA-hybrid cleavage by endogenous RNaseH.48 The resulting stalled ribosome-bound nascent-chain complex carried the full-length apoMb protein. An anti-SsrA oligodeoxynucleotide was added to the cell-free system to prevent tmRNA-mediated release of nascent proteins from the ribosome.49 The N-terminal methionine was labeled with BODIPY-FL using BODIPY-FL Met-tRNAfMet, which was prepared and added to the cell-free system as described.13 Cell-free components were assembled at room temperature (0.75 – 1.05 ml total volume) followed by splitting into 75 μL equivolume aliquots and parallel incubation of all aliquots at 37 °C for 30 min.
Purification of RNC Complexes.
After cell-free transcription-translation, ribosome-bound nascent-chain complexes were purified upon centrifugation (160,000 rcf for 60 min at 4 °C) of each of the aliquots over a 150 μL of sucrose cushion (1.1 M sucrose, 20 mM tris-HCl, 10 mM Mg2+ acetate, 500 mM NH4Cl, 0.5 mM EDTA and 1 mM DL-dithiothreitol, pH adjusted to 7.0).50 Pellets containing ribosome-bound nascent-chain complexes were then solubilized in 15 μL of resuspension buffer (10 mM Tris HCl, 10 mM Mg(OAc)2, 60 mM NH4Cl, 0.5 mM EDTA, 1 mM dithiothreitol, pH 7.0). All 15 μL aliquots were then combined, mixed, and then further split for anisotropy decay and viscosity data collection, which were run in parallel each day. The ribosome-bound status of the nascent chains was verified via a puromycin assay (see Supporting Information for details and representative SDS-PAGE data) performed on the same samples previously subject to fluorescence measurements.51, 52
Concentration of Purified RNCs.
The total ribosome concentration of resuspended RNCs was assessed from sample absorbances at 260 nm, considering the extinction coefficient of the 70S E. coli. ribosome (3.91 × 10⁷ M−1 s−1).53 The concentration of BODIPY-FL labeled RNCs was determined from the fluorescence intensity of RNC gel bands, upon comparison with the fluorescence intensity of reference gel bands of BODIPY-FL Met-tRNAfMet of known concentration. ApoMb gel band intensities were determined with the ImageJ software.54, 55
Fluorescence Anisotropy Decay: Data Collection and Analysis.
Fluorescence anisotropy-decay data were collected with a Chronos frequency-domain fluorometer (ISS Inc.). Samples were excited at 477 nm with a laser diode. A 480 ± 5 nm band-pass filter was used for the excitation channel and a 520 ± 20 nm band-pass filter (Chroma Technology) was used for the emission channel. The excitation polarizer was set to vertical for lifetime and anisotropy measurements. The emission polarizer was set to 54.7° for lifetime measurements. Samples were incubated at 25 °C for at least 30 min prior to fluorescence measurements. Sample temperature was maintained at 25 ± 0.1 °C during fluorescence measurements with a circulating water bath.
Lifetime and anisotropy decay data were analyzed with the Globals software package (Laboratory for Fluorescence Dynamics, LFD).56 The standard deviation for phase and modulation were set to 0.2° and 0.004, respectively, to estimate reduced χ2 values.57 Lifetime data were fit to three discrete exponential decay components, one of which was fixed to 1 ps to account for light scattering, and the other two, corresponding to the actual fluorophore lifetimes, were allowed to float. Anisotropy data were corrected taking the experimental frequency-dependent G-factor into account. The latter parameter was determined on the same day as the anisotropy decay measurements. Then anisotropy data were then fit to multiexponential decays. The fundamental anisotropy r0 was fixed at 0.37. In order to assess best fits, all data were independently fit to both two and three-component decays and χ2 values were compared. Three-component fits were chosen if their χ2 values were ≤ 2.5x smaller than the χ2 values for two-component fit. The number of amino acids in the compact domain of the nascent protein was determined upon evaluating both spherical, prolate (representative axial ratio = 3.5) and oblate (representative axial ratio = 0.5) ellipsoid models. Order parameters and cone semiangles were determined as described.15 See Supporting Information for further details on χ2 and compact-domain calculations. Anisotropy-decay simulations were performed with the Vinci software (ISS, Inc.).
Derivation of Equations Used for Ellipsoidal Models.
Spherical, prolate ellipsoidal, and oblate ellipsoidal models were used to calculate the number of amino acids contained in the compact subdomain of the nascent protein. We used ellipsoids of revolution for the ellipsoid models, which have two axes with equivalent length (Figure 8). These ellipsoids can have three different rotational correlation times, but these three correlation times are nearly identical for oblate ellipsoids and prolate ellipsoids with an axial ratio less than five and are too close to be resolved via our method.58, 59 Therefore, for the ellipsoidal models, the harmonic-mean rotational correlation time tH was used, and determined according to60
| (1) |
where τ1, τ2 and τ3 were determined from the parallel and perpendicular components of the rotational diffusion coefficient according to
| (2) |
| (3) |
| (4) |
Substituting eqs 2 - 4 into eq 1 gives
| (5) |
which simplifies to
| (6) |
D∥ and D⊥ are defined as
| (7) |
| (8) |
where ρ is the aspect ratio and b is defined as
| (9) |
| (10) |
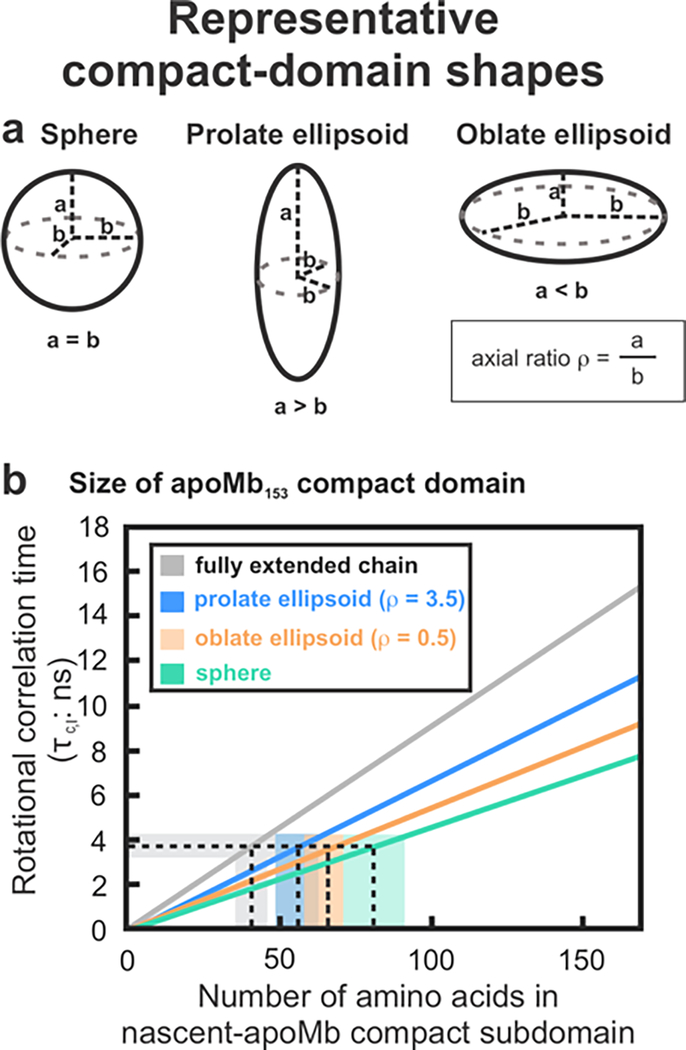
Figure 8.
The size of the RNC compact subdomain can be deduced from the experimental rotational correlation time (for the low-ns motion) and from the experimentally determined viscosity. Three limiting molecular shapes were considered: a. spherical, prolate ellipsoid (axial ratio = 3.5) and oblate ellipsoid (axial ratio = 0.5). b. Plot illustrating the experimentally determined rotational correlation time for the intermediate-timescale motions (τc,I) as a function of number of amino acids in the compact subdomain. Domain sizes compatible with experimentally determined rotational correlation times are shaded in color (blue, orange, green).
Viscosity Measurements.
The viscosity of apoMb RNC solutions was measured with a microVISC™ viscometer (Rheosense, Inc.), an apparatus tailored to small-volume samples (15–60 μL depending on shear rate). Samples were allowed to flow though the viscometer channel at constant shear rate, and pressure differences as the fluid flow within the channel were measured, to assess sample viscosity. The viscosity of apoMb RNC solutions was determined at shear rates 1500, 3000, 5000, 6500, and 8000 s−1, with a temperature control module set to 25 °C. Viscosity measurements with an R2 value lower than 0.995 were discarded. Plots of viscosity versus shear rate and student’s t-test calculations were used to compare viscosity values. This analysis let us to conclude that all samples analyzed in this work exhibit Newtonian behavior.
Fluorescence-Detected Gel Electrophoresis.
SDS-PAGE via three-layer tris-tricine low-pH gels61 was employed to analyze RNCs in the absence and presence of puromycin.45, 62 Fluorophore-labeled peptidyl tRNAs (carrying nascent proteins) were visualized directly on the gels with a FLA 9500 Typhoon Gel Imager (GE Healthcare Life Sciences, 473 nm excitation laser, BPB1 emission filter (525/50 nm band pass filter).
RESULTS AND DISCUSSION
Experimental Design.
This study employs apoMb as a model system. The holo form of this protein, containing the heme cofactor, occupies a special place in chemistry and biology as it was the very first protein whose structure was solved by X-ray crystallography. In addition, apoMb carries the ubiquitous all-α-helical globin fold.63, 64 and its in vitro refolding mechanism was extensively characterized via classical refolding experiments from denaturant 65–72 as well as within cell-relevant environments.13, 15, 30, 45, 73 The apoMb plasmid is codon-usage optimized for expression in E. coli.47
To explore the compaction and dynamics of apoMb in a cell-relevant environment, we generated stalled full-length RNCs of this protein in an E. coli cell-free system. The N-terminal methionine was labeled with the fluorophore BODIPY-FL. Ribosomes harboring nascent protein chains were purified and resuspended in a buffer solution to remove free fluorophore, tRNA, and released protein from the solution before performing fluorescence anisotropy decay and viscosity measurements. We verified that the nascent chain was bound to the ribosome with a puromycin assay, after completing the fluorescence anisotropy decay and viscosity measurements (Figure S1).
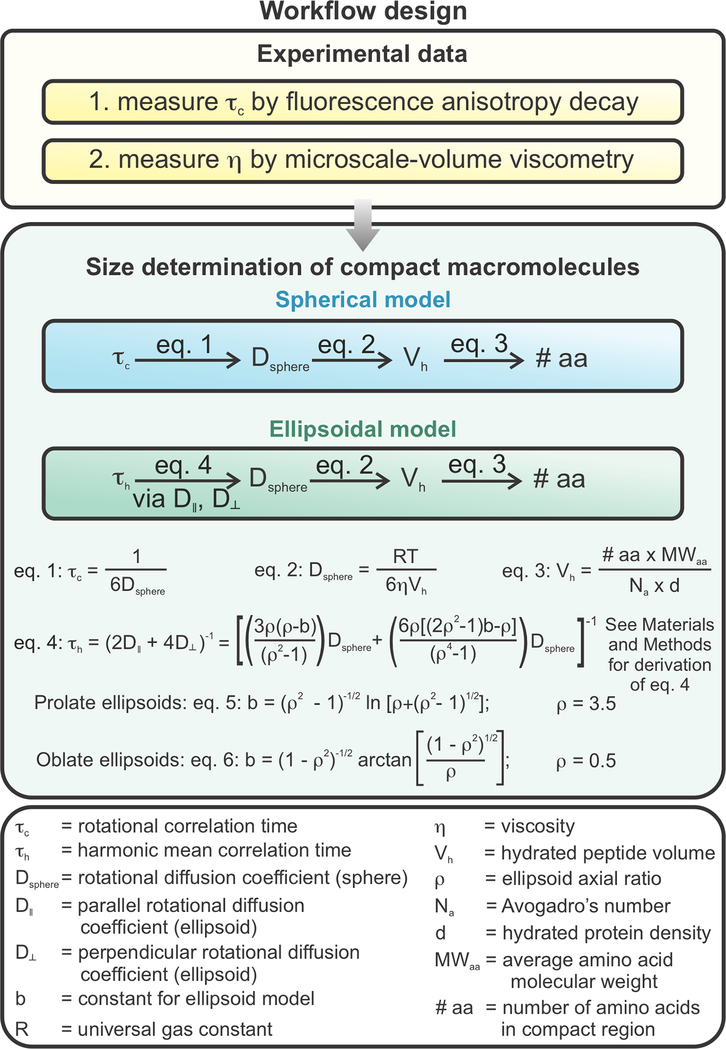
The overall experimental design is schematically illustrated in Figure 2. Briefly, we assessed fluorescence anisotropy decays in the frequency domain58, 74 and combined this technique with direct microscale-volume viscosity measurements on the same samples. In this way, we could determine the number of amino acids contained in the compact portion of the nascent chain. The rotational correlation time (τc) of a molecular system of interest depends on its size (e.g., its number of amino acids, #aa), shape, and solution viscosity (η). Therefore, the τc of the nascent chain was determined via fluorescence anisotropy decay and the η was assessed with a microscale-volume viscometer. Then, we employed the Stokes-Einstein Debye equation to determine the hydrated volume (Vh) of the compact domain of the nascent chain from experimental rotational correlation time and solution viscosity values, assuming spherical, prolate or oblate ellipsoidal shapes of representative aspect ratios ρ=3.5 or ρ=0.5, respectively. We then calculated the number of amino acids (# aa) from the volume (Vh) considering that the standard protein dry volume of 0.75 mL/g includes 0.2 mL of water per g of protein60 and the average molecular weight of amino acids is 110 g/mol.
Figure 2.
Summary of workflow design to determine degree of compaction of RNCs. The rotational correlation time (τc) describing nascent-chain compact-subdomain motions and RNC macroscopic viscosity (ηmacro) were determined via fluorescence anisotropy decay in the frequency domain and microscale-volume viscometry, respectively. Experimentally determined values were employed to determine the size of the compact subdomain. Spherical, prolate ellipsoidal, and oblate ellipsoidal models were used to model the compact region of the nascent chain.
Combining Anisotropy Decay with Microscale-Volume Viscometry is a Convenient Approach to Determine the Size of Independently tumbling Compact Regions of Biomolecules, Including RNCs.
Fluorescence anisotropy decay and microscale-volume viscometry can be synergistically combined to determine the size and dynamics of compact independently tumbling regions of biomolecules. This method is non-perturbative and can be used to study both compaction and dynamics of nascent proteins in solution. Our approach does not need extrinsic SecM sequences to stall translation, and is particularly convenient because it only requires a single fluorophore, making it easily applied to any protein of interest. We attached the fluorophore to the protein N-terminus, but the fluorescent label can be located anywhere on the independently tumbling region of the macromolecule where it does not interact with immobilized or slowly tumbling species.
Fluorescence anisotropy decay alone has been previously used to study conformation and dynamics of biomolecules such as foldable and intrinsically-disordered proteins,75–77 nucleic acids,78, 79 the actin-myosin system,75 and antibodies.75 Fluorescence anisotropy decay can be used to resolve local and global dynamics not only in nascent-protein-ribosome complexes, but also in ribosome-released foldable and intrinsically-disordered proteins13, 80 and in protein fibrils.81
The method introduced here is versatile because it can be straightforwardly applied to any complex biomolecule containing an independently tumbling compact region.
Viscosity Measurements and Newtonian Versus Non-Newtonian Fluids.
The rotational correlation time of a molecule depends on its size and solution viscosity, as shown in Figure 2. Therefore, viscosity measurements are required to determine the size of compact domains of RNCs. Here, we solve this challenge by performing direct solution viscosity measurements in situ. As shown in the sections below, we also took into account how shear rate, molecular crowding, and the highly negatively charged surface of the ribosome may affect the local viscosity in proximity of the nascent protein surface.
Solution viscosity may depend on the shear rate, (i.e., the flow rate) of the fluid of interest. Newtonian fluids have a constant viscosity that is not affected by shear rate. Non-Newtonian fluids include shear-thinning fluids, which undergo a decrease in viscosity as shear rate increases, and shear-thickening solutions, which experience an increase in viscosity as shear rate increases.82 Many fluids show Newtonian behavior at low shear rates and then Non-Newtonian behavior at higher shear rates.83–85 However, several globular proteins including globulins, especially bovine globulin serum albumin, ovalbumin, and β-lactoglobulin, display shear-thinning behavior at low shear rates and Newtonian behavior at higher shear rates.86–91 For these proteins, shear-thinning behavior occurs at low shear rates (less than 100 s−1) because the proteins form a film at the liquid-gas interface. Within this film, the solution is viscoelastic and experiences a higher viscosity compared to the experimentally measured macroscopic viscosity ηmacro. As the shear rate increases, the increased flow breaks up the film, decreasing the solution viscosity.90 Non-globulin proteins,92 E. coli ribosomes,93 mixtures of RNA and proteins,94 and DNA solutions,95, 96 on the other hand, show Newtonian behavior at low shear rates. In order to assess whether a given solution displays Newtonian or non-Newtonian behavior, it is necessary to perform experimental measurements at different shear rates.
Effect of Molecular Crowding and Excluded Volume on Viscosity.
The Stokes-Einstein (SE) and Stokes-Einstein-Debye (SED) relations (see eqs 11 and 12 below, respectively) show how a particle’s translational and rotational diffusion depend on solution viscosity
| (11) |
| (12) |
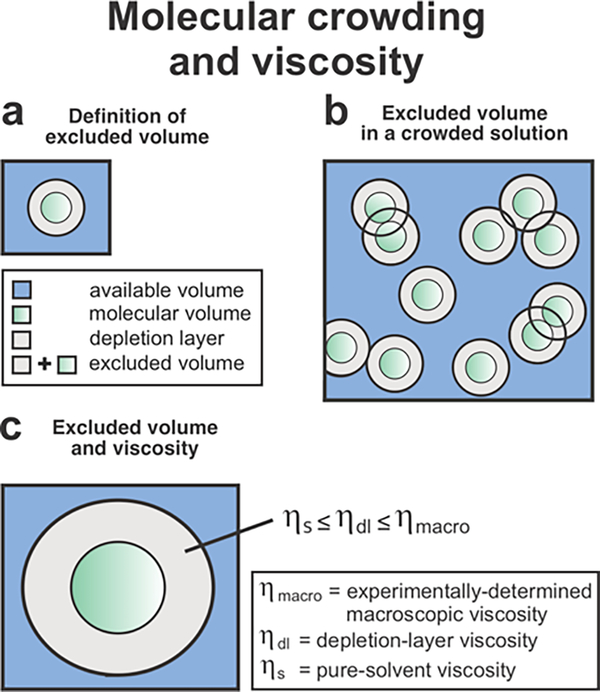
where kB is the Boltzmann constant, T is temperature in Kelvin, η is the solution viscosity, r is the radius of the particle, Vh is the hydrated volume of the molecule of interest, and R is the universal gas constant. The above equations assume homogeneous solution viscosity and non-interacting spherical particles. Within physiologically relevant systems, however, molecular crowding may cause experimental diffusion coefficients to differ from the values predicted from experimental macroscopic viscosity (ηmacro) and the SE and SED equations.97–101 Both negative and positive deviations, leading to faster and slower experimental diffusion than predicted from eqs 11 and 12, respectively, were observed to date. Negative deviations were observed for protein translational and rotational diffusion in the presence of polymer102–105 and selected protein106 crowders. This solution behavior was predicted by a Brownian dynamics model.107 This negative deviation from the SE and SED equations can be explained by the excluded volume effect. The space unavailable to a molecule, known as the excluded volume, includes the space occupied by other molecules and a depletion layer, which is the region surrounding a particle that is depleted in other particles compared to the bulk solution (Figure 3).108–110 Given that the depletion layer is inaccessible to crowder molecules, the viscosity within this space, denoted as ηdl, is lower than ηmacro, and approaches the pure solvent viscosity ηs.101, 108 In summary, ηs ≤ ηdl ≤ ηmacro (Figure 3c).When ηdl is less than ηmacro, both translational and rotational diffusion can be faster than the diffusion behavior predicted from eqs 11 and 12. The deviation for rotational diffusion, however, is greater because rotational tumbling occurs entirely within the depletion layer.100, 101
Figure 3.
Effect of molecular crowding and excluded volume on microscale-volume viscosity. (a) The excluded volume comprises the space occupied by molecules (green) and the depletion layer surrounding them (gray). (b) Within a crowded solution, two molecules cannot occupy the same space, but their depletion layers can overlap. (c) The viscosity within the depletion layer (ηdl) surrounding a particle is between the pure-buffer (solvent system) viscosity (ηs) and the experimentally measured macroscopic viscosity (ηmacro).108
In the case of most protein crowders, however, experimental results97 and molecular dynamics simulations111 showed positive deviations. These results are explained by transient cluster formation between proteins, which becomes significant at high protein concentration (>100 mg/mL) and increases the apparent radius of the rotating species, thus slowing down translational and rotational diffusion.97, 111 In these concentrated protein solutions, the effect of transient associative interactions counteracts the effect of the depletion layer.
In our experiments, we employed a BODIPY-FL labeled RNC concentrations of ca. 0.1 mg/mL (40 nM) and total ribosome concentrations of ca. 2 mg/mL (790 nM). See the Methods section for procedures employed to determine RNC concentrations. Given that these values are significantly lower than 100 mg/mL, we do not expect clustering to play a significant role.
Effect of Charge on Viscosity.
The local environment of the nascent chain is affected by the presence of the ribosome. The ribosomal RNA and charge segregation of ribosomal proteins112 render the ribosomal surface highly negatively charged, with a formal charge of nearly −4000.32, 113 In general, the charge of polyelectrolytes alters solution characteristics relative to solutions of uncharged polyelectrolytes. This phenomenon is known as the “polyelectrolyte effect.”114, 115 Specifically, the negative surface charge of the ribosome32, 112, 113 is likely surrounded by a high-density mostly positively-charged counterion layer, based on model studies on RNA and proteins.116 The Coulombic interactions between counterion layer and negatively charged ribosome surface shields repulsive interactions.112 Therefore, given that the environment surrounding ribosome-bound nascent proteins has a higher ion concentration than the surrounding solution, we asked whether this environment could affect the local viscosity experienced by the nascent chain.
Under high-salt solution conditions relevant to our work (0.1 – 1 M), the experimental viscosity of highly charged negatively or positively electrolytes approaches the viscosity of the pure buffer.117, 118 Therefore, we measured the viscosity of the pure buffer (ηs) and the viscosity of the RNC solution in buffer (ηmacro) to assess the effect of charge on the local viscosity near the surface of the ribosome.
Experimental Viscosity of apoMb RNC Solutions.
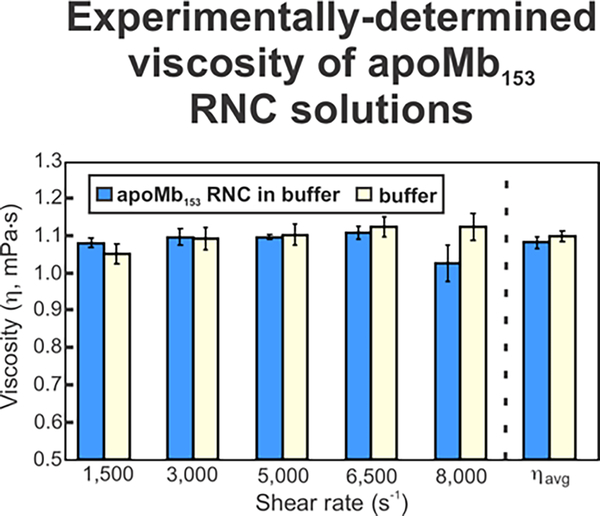
The viscosities of apoMb RNC solutions at shear rates ranging from 1500 s−1 to 8000 s−1 were not statistically different, according to the two-tailed Student t test (Figure 4). This result demonstrates that the apoMb RNC solution behaves as a Newtonian fluid over the tested shear-rate range. We could not directly measure the viscosity at shear rates lower than 1500 s−1 due to the limitations of the microscale-volume viscometer. However, we expect RNC solutions to also show Newtonian behavior at lower shear rates because most fluids including DNA, non-globulin proteins, and ribosomes in aqueous solutions show Newtonian behavior at low shear rates.83–85, 92–96 It is worth mentioning that some globulin and albumin protein solutions display shear-thinning behavior at low shear rates due to their tendency to bind other molecules at the air-water surface interface.86–91 We expect the our RNC samples, however, to show Newtonian behavior at low shear rates given that surface effects are negligible and that fluorescence anisotropy is a solution property, not pertinent to the air-water interface of RNC samples. In addition, previous work showed that ribosome solutions show Newtonian behavior at low shear rates.93
Figure 4.
Experimentally measured viscosity of RNC solutions (blue) and buffer (yellow).
Regarding the potential effect of transient clustering (i.e., non-specific macromolecular interactions), we expect it to be negligible because the total ribosome concentration in our samples (ca. 2 mg/mL) is significantly lower than the concentration required for significant clustering (>100 mg/mL). We considered the effects of the depletion layer and charge on local viscosity by comparing ηmacro of the RNC solution to the pure buffer viscosity (ηs). For our sample, ηs (1.10 ± 0.06 mPa-s) is the same within error as ηmacro for the RNC solution (1.08 ± 0.02 mPa-s) (Figure 4). These viscosity values are close to the previously reported value of 0.94 ± 0.02 mPa-s for ribosome solutions.93 Given that ηmacro and ηs are identical within error, we determined that the effective rotational viscosity is the same as the ηmacro measured via microscale-volume viscometry.
In conclusion, the viscosity of our RNC solutions is not significantly affected by depletion layer, clustering, or charge effects. Therefore, the experimentally measured RNC solution viscosity (ηmacro) over all tested shear rates was used to assess the number of amino acids corresponding to the nascent-chain compact subdomain.
Fluorescence Anisotropy Decays are an Effective Probe of Rotational Dynamics.
During anisotropy measurements, a sample labeled with a fluorescent molecule is irradiated with polarized light, which preferentially excites fluorophores with transition dipoles aligned with the electric field of the incoming light.58 Rotation of the fluorophores while in the excited state results in a depolarization of the emitted light compared to the excitation light. The degree of depolarization can be described quantitatively by the fluorescence anisotropy, which is defined as
| (13) |
I∥ and I⊥ are the parallel and perpendicular intensities of the emitted light, respectively, and r is the fluorescence anisotropy.119
The anisotropy of a frozen sample that does not rotate is the fundamental anisotropy r0, which depends on the angle ξ between the absorption and emission transition dipole moments as described by:120
| (14) |
For a sample in solution, rotation of excited-state fluorophores leads to emission-dipole spatial displacement relative to a corresponding frozen sample, resulting in depolarization of the emitted light and a fluorescence anisotropy value smaller than r0. The degree of depolarization depends on the extent of rotational diffusion of the fluorophores during their fluorescent lifetime. Therefore, anisotropy measurements can be used to measure the rotational diffusion of the sample, which can provide information about the shape, size, and dynamics of the molecule. Importantly, fluorescence anisotropy can only sense dynamics that occur on timescales similar or faster than the lifetime of the fluorophore, which typically range from 0.1–20 ns.121 While steady-state anisotropy reports on the average anisotropy for all rotational motions, anisotropy decay measurements can resolve the timescales and amplitudes of different motions experienced by the fluorophore (Figure 5). In this work, we measure fluorescence anisotropy decay in the frequency domain to resolve the rotational motion of the compact portion of the nascent chain from the motions of the ribosome and fluorescent probe (see Supporting Information and Figure S2 for further discussion on steady-state versus time-decay and time-domain versus frequency-domain approaches).
Figure 5.
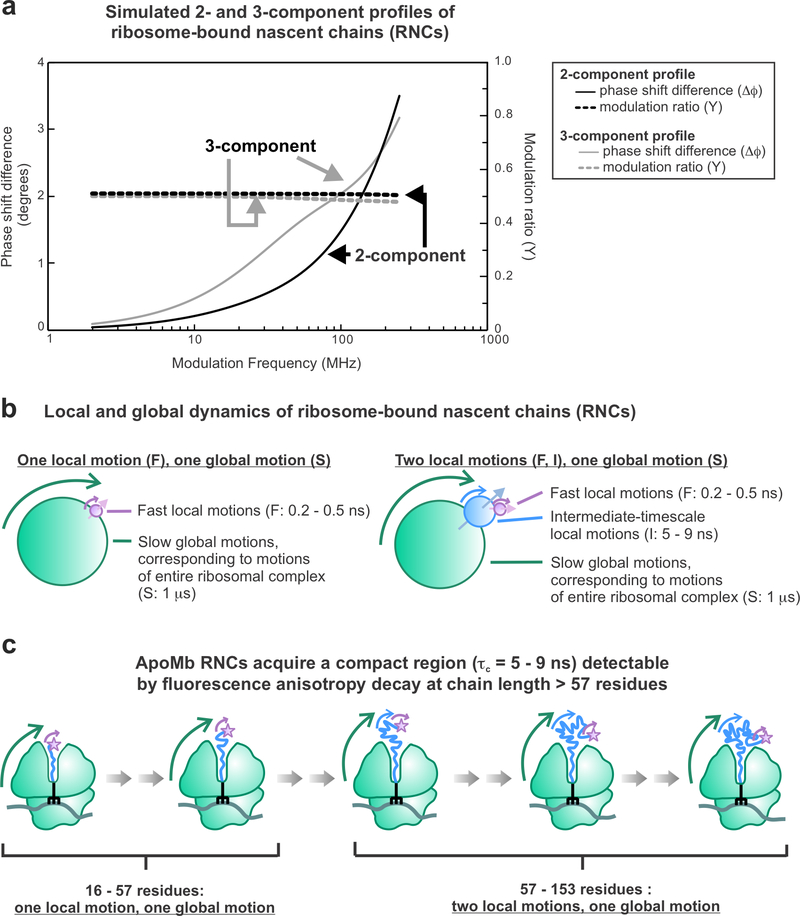
Fluorescence anisotropy decay in the frequency domain enables resolving multiple rotational modes, including one corresponding to an apoMb RNC compact subdomain (rotational correlation time τc = 5–9 ns). (a) Simulations of 2- and 3-component frequency-domain anisotropy decay data. (b) Representative physical models for samples with one global tumbling motion one or two local tumbling motions. (c) Prior anisotropy decay data revealed that ApoMb nascent chains become compact and tumble independently starting from chain lengths of ca. 57 residues.13
Order Parameters and Cone Semiangles Define the Spatial Confinement of Rotational Motions.
In addition to sensing the compaction of nascent chains, fluorescence anisotropy decay measurements also provide information on the spatial confinement of nascent-chain dynamics. The Lipari-Szabo approach provides a model-free method to determine an order parameter that describes the spatial confinement of a rotational motion based on that motion’s fractional contribution to the anisotropy decay.58, 122 Order parameters range from 0 to 1, where higher order parameters describe more highly constrained motions. The Lipari-Szabo method does not require a specific model to describe the motions, but it does depend on the following five assumptions: (i) The fluorophore has axial symmetry. (ii) Either the fluorescence absorption or emission dipole is colinear with the fluorophore’s symmetry axis. (iii) The local fast motions are random and do not depend on the azimuthal angle ϕ (Figure 6). (iv) The local and global motions are independent of each other. (v) The rotational correlation times of the motions differ by an order of magnitude or more.58 For a system that meets these requirements, the anisotropy decay is described by eqs 15 and 16 in the case of two and three rotational motions, respectively15
| (15) |
| (16) |
Specific models can be used to gain a more intuitive appreciation for the nature of the spatial confinement encoded by the order parameter. We employed a model by Kinosita et al. that assumes local motions to be confined across a cone according to a square-well potential. 123 In this way, we were able to determine limiting cone semiangles from order parameters, thus gaining a more physically meaningful description, as shown in Figure 6.123 The position of the symmetry axis of the rotating species can be described by123
| (17) |
| (18) |
where peq(θ) is the normalized equilibrium distribution of the angle θ, and θ0 is the limiting cone semiangle. Within this model, the order parameter can be converted to the cone semiangle according to
| (19) |
The abovementioned equations are powerful because they enable assessing the spatial confinement of rotational motions.
Figure 6.
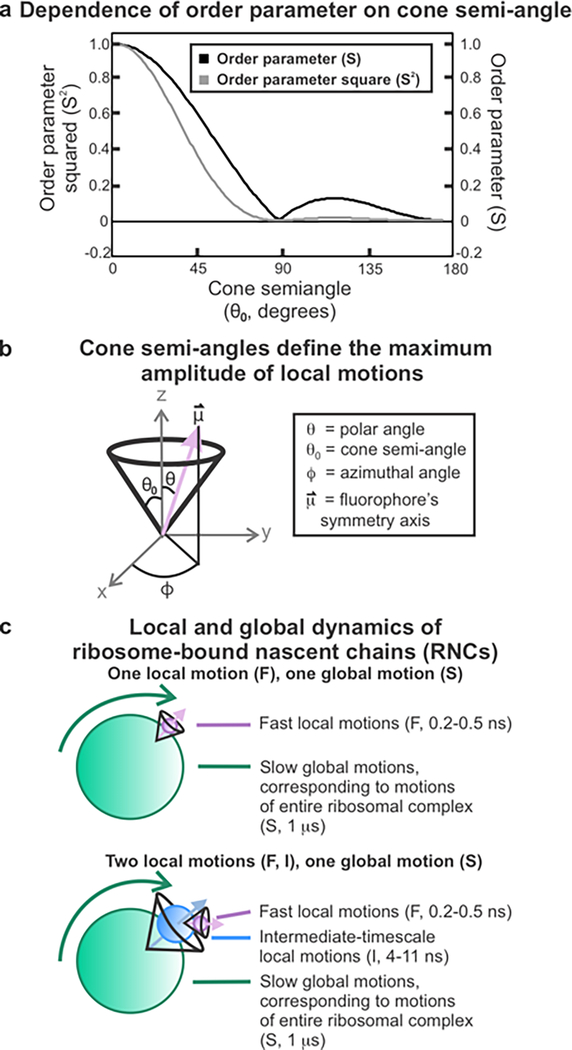
Order parameters and cone semiangles define the spatial confinement of nascent chain dynamics. (a) Dependence of order parameter on cone semiangle, assuming a square-well potential. (b) General features of cone-semi angle models. The vector defines the fluorophore’s symmetry axis, whose orientation can fluctuate so that its angle with the z-axis (θ) is less than or equal to the cone semiangle θ0. The motions are randomly distributed within the XY plane and can assume any value of the azimuthal angle ϕ) The z-axis is defined to be perpendicular to the macromolecular surface the tumbling species is attached to. (c) Cartoon description of macromolecules bearing either one or two local motions that are spatially confined within a cone.
Biologically Significant Application: Identification of Size and Dynamics of a Ribosome-Bound Nascent-Chain.
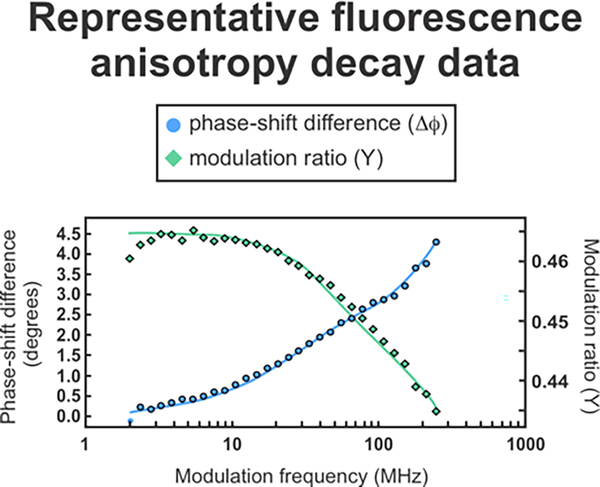
Full-length apoMb ribosome-nascent protein complexes displayed three rotational motions, consistent with previous results.13 Figure 7 shows representative fluorescence anisotropy decays in the frequency domain. Lifetime and anisotropy decay data for all samples are shown in Supporting Figure S3. The rotational correlation times corresponding to these motions are summarized in Table 1. The rotational correlation time for the global tumbling of the ribosomal complex was fixed to 1000 ns. This global rotational correlation time cannot be detected directly because it occurs on a significantly longer timescale than the lifetime of BODIPY-FL (5.9 ns). On the other hand, its presence (in the context of spatially biased faster local motions) is evident from the fact that the anisotropy does not completely decay to zero.13 The fast motions (τc = 0.14 ± 0.01 ns) have a rotational correlation time corresponding to free BODIPY-FL linked to 1–2 residues, hence these motions describe the dynamics of the RNC N-terminus.15 The intermediate-timescale motions (τc = 3.7 ± 0.5 ns) correspond to the motions of a compact region of the nascent chain that tumbles independently from the ribosome. These results agree with previous anisotropy-decay investigations.13
Figure 7.
Representative frequency-domain fluorescence anisotropy-decay data for full-length apoMb RNCs.
Table 1.
Summary of rotational correlation times and number of amino acids in compact nascent-chain domains.
| Regimes of Motiona | Number of amino acids in compact domain | Percent of chain in compact domain | ||||||
|---|---|---|---|---|---|---|---|---|
| Slow (~microsecond or slower) | Intermediate (~s) | Fast (~ps) | ||||||
| τc,S (ns) | τc,I (ns) | τc,F (ns) | Sphere | Prolate ellipsoid (ρ = 3.5) | Oblate ellipsoid (ρ = 0.5) | Sphere | Prolate ellipsoid | Oblate ellipsoid |
| 1000 | 3.7 ± 0.5 | 0.14 ± 0.01 | 83 ± 10 | 57 ± 7 | 68 ± 9 | 54% ± 7% | 37% ± 5% | 45% ± 6% |
Data are reported as average ± SE for n = 9.
In order to determine the size of the compact domain, apoMb nascent chains were modeled as either spheres, prolate ellipsoids or oblate ellipsoids (Figure 8). Full-length apoMb nascent chains are unlikely to exist as an extended chain because the persistence length of proteins is typically only 4–6 amino acids.13 The experimentally-measured solution viscosity and rotational correlation times were used to determine the number of amino acids contained in the compact region of the nascent chain. The SED relation (eq 12) was used to determine the size of the compact domain assuming spherical shape. The nascent chain was also modeled as a prolate ellipsoid (representative axial ratio of 3.5) and an oblate ellipsoid (representative axial ratio 0.5). The equations used for these models are included in Figure 2 and in the Supporting Information.
Our results show that the RNC compact region comprises 57 to 83 amino acids (37% - 54% of the nascent chain, see Table 1). Therefore, we are able to eliminate Figure 1‘s model d, which entails a small-size compact subdomain (Figure 9). It is worth noting that our data are insensitive to other potential extended or compact RNC conformations interacting with the ribosome or molecular chaperones.
Figure 9.
RNC models compatible with experimentally determined rotational correlation times and viscosity values.
Spatial Confinement of Nascent-Chain Motions.
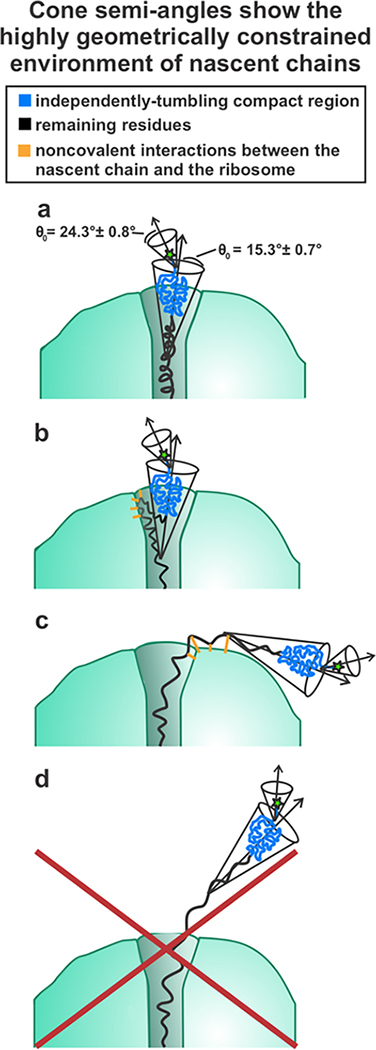
In addition to determining the size of the compact domain, we also determined the spatial confinement of the nascent chain dynamics (see Table 2). The cone semiangles for the fast and intermediate motions are 24.3° ± 0.8° and 15.3° ± 0.7° respectively.15 These cone semiangles are quite small as the maximum size for a cone semiangle is 180°, indicating that the amplitude of the compact RNC-domain motions are spatially constrained.15 The small cone semiangles suggest that the compact subdomain may be confined within the ribosomal vestibule or near the ribosome surface (Figure 10). Previous work showed that the ribosomal vestibule is sufficiently large to accommodate nascent protein tertiary structure10, 12 and even proteins as large as 108 amino acids.43 Therefore, it is possible the vestibule accommodates the apoMb compact structure which contains 57–83 amino acids. Alternatively, a portion of the chain prior to compact region may interact with the outer ribosomal surface, causing the compact subdomain to be outside of the ribosomal tunnel altogether.
Table 2.
Summary of order parameters and cone semiangles for apoMb rotational motions.
| Regimes of Motiona | |||
|---|---|---|---|
| Intermediate (~microsecond or slower) | Fast (~ps) | ||
| SI | θ0(°) | SF | θ0(°) |
| 0.947 +/− 0.005 | 15.3 ± 0.7 | SF = 0.87 +/− 0.01 | 24.3 ± 0.8 |
Data are reported as average ± SE for n = 9.
Figure 10.
RNC models compatible with spatially-confined dynamics described by experimental cone-semi angles. The spatial confinement of the nascent chain dynamics suggests that the compact domain lies within the ribosomal vestibule or is somehow spatially confined within the outer surface of the ribosome.
Potential Interactions of Nascent Chains and Ribosome (or Chaperones) Do not Affect the Estimated Size of the Compact Region of the Nascent Chain.
Until now, this work disregarded any potential interactions between nascent chains and the ribosomal surface or molecular chaperones. In principle, these interactions may affect the size of the compact region. We show here that the presence of any interactions does not affect the estimated size of the compact region.
Recent studies show that some nascent chains include populations experiencing noncovalent contacts with the ribosome26, 124, 125 and/or chaperones.13, 126–129A study by Ellis et al.13 showed that the observed rotational correlation time of apoMb RNCs is the same in the absence and presence of trigger factor and DnaK. This work showed that, although chaperone-bound RNC populations are likely present, their effect on fluorescence anisotropy decays is spectroscopically undetectable.13 The arguments below show that a similar conclusion applies to nascent-chain interactions with the ribosomal surface.
First, even the most rapid (i.e., diffusion-controlled) conformational exchange of RNCs with the ribosomal surface is too slow to be fully averaged during the fluorescence anisotropy decay timescale (see derivation in Supporting Information). Thus, any interacting populations are in slow exchange on the fluorescence timescale of our measurements, and therefore correspond to distinct non-averaged contributions. Second, the effect of ribosome-interacting and non-interacting populations on the observed anisotropy-decay parameters was explicitly evaluated, and shown not to affect observed rotational correction times corresponding to low-ns intermediate-timescale RNC motions.
Briefly, let us denote independently tumbling compact RNC populations as contributing (C) and populations interacting with the ribosomal surface as noncontributing (NC). Noncontributing RNCs show two rotational correlation times (fast and slow) and contributing RNCs show a third intermediate-timescale (ns) rotational correlation time corresponding to the independently tumbling nascent protein. A mixture including both populations has an anisotropy decay described by the relation below15
| (20) |
where xC and xNC are the mole fractions of the contributing and noncontributing species, respectively. Equation 20 is explicitly derived in the Supporting Information. This relation follows a three-component exponential decay.
In summary, eq 20 shows that the presence of RNCs interacting with the ribosome does not affect the experimental rotational correlation times and the estimated size of the compact domain experiencing the low-ns intermediate-timescale motions.
Next, we asked whether the presence of ribosome (or chaperone) nascent-chain interactions may affect the observed amplitude of RNC ns motions. On the other hand, eq 20 also shows that the presence of any ribosome-interacting population is expected to affect the observed order parameter and cone semiangle corresponding to the intermediate-timescale motion. Hence these parameters are numerically different in the absence and presence of interactions with the ribosomal surface, as shown in Supporting Table S2. Interestingly, Table S2 shows that even if the contributing (i.e., non-interacting) species has a mole fraction of only 0.2, the cone-semi angle for the intermediate timescale motions is at most 39°, which is significantly less than the maximum value of 180°. This small cone semiangle value confirms that, regardless of any ribosome (or chaperone) interactions with the nascent protein, the nascent-chain motions are highly spatially confined.
Compact Region of Full-Length apoMb RNCs Lacks Residues Corresponding to the Two Native C-Terminal Helices.
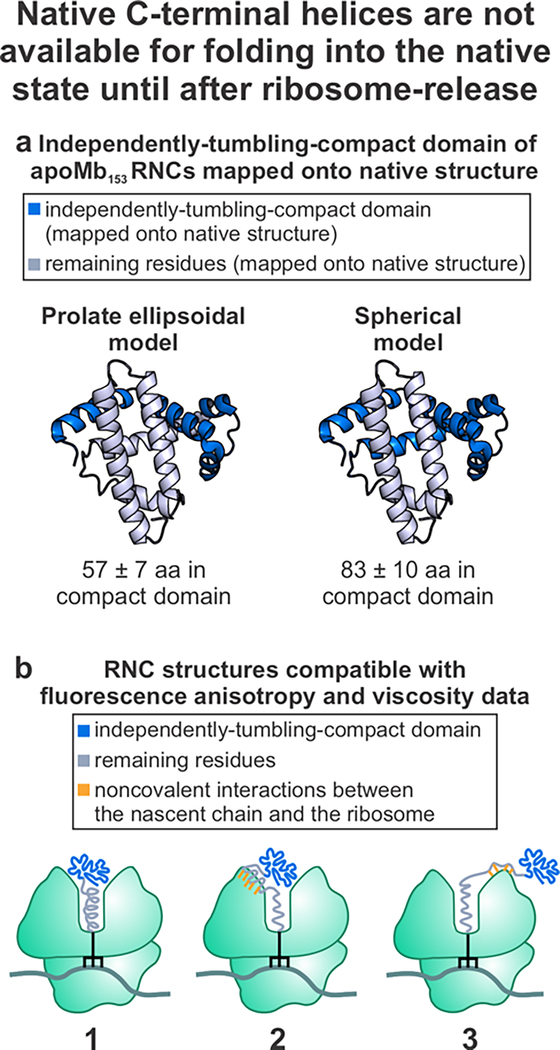
The combined anisotropy/microscale-volume viscometry approach reveals that the compact subdomain of full-length apoMb RNCs lacks residues corresponding to the two native C-terminal helices, denoted as the G and H helices (Figure 11). While previous work demonstrated that the C-terminal H helix plays an important role in enabling apoMb to fold into its native state, this study provides the first experimental evidence that the major RNC compact subdomain of apoMb does not contain the residues corresponding to the G helix.
Figure 11.
Compact nascent-apoMb subdomain does not include residues corresponding to the native C-terminal helices. a. Size of independently tumbling compact subdomain mapped onto the structure of native apoMb. b. RNC structures compatible with our experimental data.
Most single-domain proteins require the C-terminal region in order to fold into their native state. The C-terminal region is important for folding because it buries nonpolar resides.130 Fragments of these proteins without the C-terminal region have more nonpolar solvent accessible surface area than the full-length native structure, making them more likely to misfold and aggregate.130 The C-terminal region is also important for folding because the native structures of many single domain proteins have interactions between the protein N and C-terminal regions.131, 132 These long range interactions with the C-terminal region make post-translational folding important for the protein to reach its final native structure.30, 133
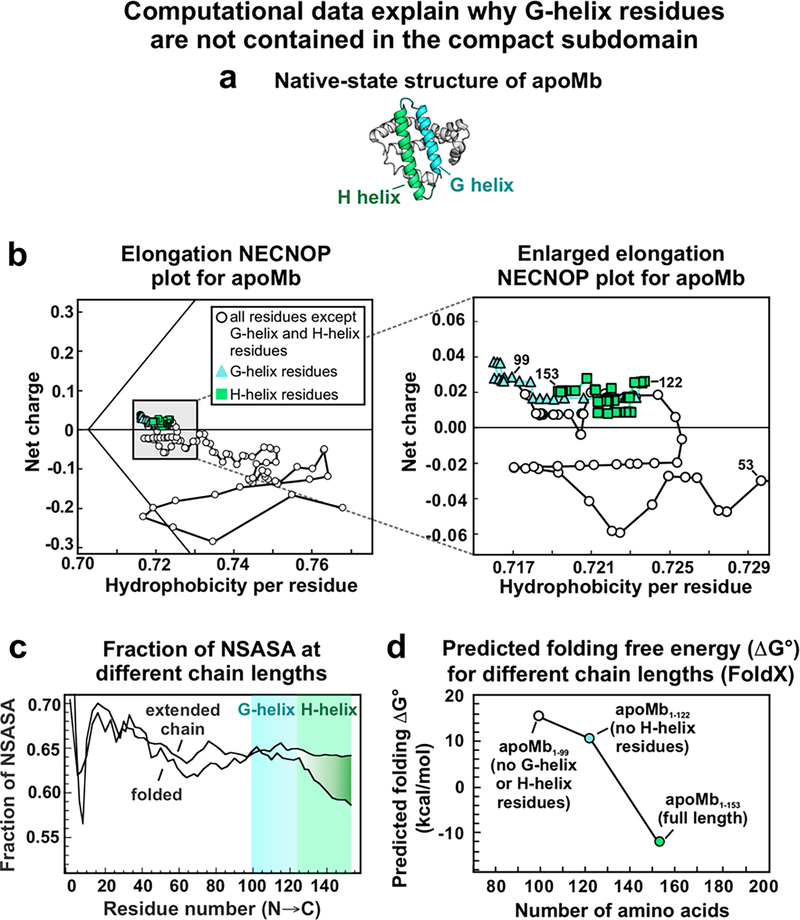
The experimental finding that the residues corresponding to the G helix are not contained in the compact region can be rationalized with the help of NECNOP plots. These plots predict whether proteins are capable of being folded or disordered at ambient temperature and pressure based solely on net-charge and nonpolar content.134 NECNOP plots contain a discriminant line that separates folded proteins (right side of the line) from unfolded proteins or intrinsically-disordered proteins (left side of line). The discriminant line is defined as134
| (21) |
where |MNC| is the absolute value of mean net charge per residue and MNPC is the mean nonpolar content per residue.
Importantly, the NECNOP plot demonstrates that the G helix adds nonpolar residues to the chain, increasing the overall hydrophobicity of the protein. However, our work demonstrates that the full-length ribosome-bound apoMb does not bury the G-helix residues in a compact structure. Additionally, the predicted folding free energy of apoMb fragments containing the residues corresponding to the G helix but excluding the residues corresponding to the H helix is unfavorable (Figure 12d, predicted folding free energy calculated with FoldX version 5135). Folding into the native state without the H helix present is likely unfavorable because the G-helix residues do not play a significant role in burying nonpolar residues, as shown by Kurt et al. and Figure 12c.130 Given that residues corresponding to the native G helix are not included in the compact subdomain of ribosome-bound apoMb, they must bury their nonpolar content in another way, perhaps by interacting with the ribosome or by forming some structure (potentially helical)136 a compatible with the ribosomal tunnel core (Figure 11b).
Figure 12.
Computational data rationalizing why the nascent-apoMb compact subdomain lacks residues corresponding to the native G helix. (a) Native apoMb structure of with G and H helices colored in blue and green, respectively. (b) Elongation net-charge nonpolar (NECNOP) plot for apoMb generated according to Yaeger-Weiss et al.134 The black discriminant line separates regions corresponding to folded (right of line) and disordered proteins (left of line). (c) Fraction of nonpolar solvent-accessible surface area (NSASA) at different apoMb chain lengths. Adapted with permission from Kurt, N.; Cavagnero, S. J. Am. Chem. Soc. 2005, 127 (45), 15690–15691.130 Copyright (2005) American Chemical Society. (d) Predicted free energy of folding for different apoMb chain lengths. See Figure S6 for predicted folding free energies of additional chain lengths. All free energy calculations were carried out with FoldX version 5.135 PDB files for apoMb (RCSB PDB: 1mbc) were generated with Pymol version 2.0.0.
The NECNOP plot also shows that the H-helix residues decrease the overall hydrophobicity of the protein. Therefore, the residues belonging to the H helix are not particularly nonpolar, but they are very effective at burying nonpolar residues (Figure 12c).130 Additionally, the H helix has a higher residue-specific contact order (RCO) and residue contact breadth (RCB) compared to the middle region of the protein.131 RCO is a measure of the number of long-range interactions, such as interactions between the C-terminal residues and the N-terminal residues, within a given region of a protein. RCB is a measure of the spread in sequence of the interactions.131 Therefore, the relatively high RCO and RCB of the H-helix residues demonstrate that this region interacts with regions spanning a large sequence range of the protein, including the N-terminal residues. Therefore, the H-helix residues form an integral part of the native structure. The breadth of interactions that the H-helix residues have with the rest of the protein and their ability to bury nonpolar residues contribute to the favorable folding energy when the H helix is present (Figure 12d).
Implications for Cotranslational Conformation of Full-Length apoMb RNCs.
Our results demonstrate that the residues corresponding to the G helix of full-length ribosome-bound apoMb do not belong to the compact subdomain. Therefore, this region must bury its nonpolar residues through other interactions, which suggests that these residues either interact with the ribosomal vestibule or surface, or are involved in tight secondary structure within spatially constrained core regions of the ribosomal tunnel (Figure 11b) Additionally, because the compact subdomain does not contain the H helix that plays an important role in burying nonpolar residues, this compact region may be a non-native conformation that buries the N-terminal nonpolar residues until the H helix is available for folding. The compaction of nascent chain and the interaction of the residues corresponding to the G helix with the ribosome may help to keep the nascent chain soluble and prevent it from misfolding until the H-helix residues are available for folding into the native structure.
Implications for Post-translational Folding.
Previous work demonstrated that cotranslational folding is not sufficient for apoMb to fold into its native structure, but rather that immediately post-translational events are vital for folding.30 Immediately post-translational folding is a critical and potentially dangerous time during which nascent chains must be kinetically channeled to their native state, or they risk forming an aggregated state.30 Our findings explain why this post-translational period is so critical because they quantify the amount of required post-translational folding, revealing that apoMb must incorporate more than 60 amino acids into the final structure post-translationally, not just the final 30–40 residues contained within the ribosomal exit tunnel. These results demonstrate that while apoMb undergoes cotranslational compaction, this protein still requires significant post-translational folding to obtain its final native structure.
CONCLUSIONS
In summary, our results demonstrate that only a portion (57–83 amino acids, 37% - 54% of the chain) of the full-length apoMb ribosome-bound nascent chain forms a compact core. Specifically, residues belonging to the native G and H helices do not belong to this compact domain. In all, our results demonstrate that the model single-domain protein apoMb must undergo considerable additional folding after ribosome release. Therefore, our data suggest that the immediately post-translational folding of single-domain proteins is a prominent theme whose importance has been underestimated to date. Further, our findings underscore the importance of a proper supporting machinery (e.g., molecular chaperones) to prevent protein aggregation upon nascent-protein release from the ribosome. The spatial confinement of the nascent-protein local dynamics suggest that the compact subdomain is located within the ribosomal vestibule or within spatially biased regions of the outer surface of the ribosome.
Furthermore, our results demonstrate that microscale-volume viscometry combined with fluorescence anisotropy decay is a powerful approach to investigate the compaction and dynamics of ribosome-bound nascent chains. The technology presented in this work is simple, versatile, and of general applicability. Conveniently, this method only requires a single fluorophore and no C-terminal linkers.
Supplementary Material
ACKNOWLEDGMENTS
We thank to the National Science Foundation (NSF) for funding (grants MCB-1616459 and CBET 1912259 to S.C.). In addition, R.H. thanks the National Institute of General Medical Sciences of the National Institutes of Health for a TEAM-Science Fellowship (award number R25GM083252). The content of this publication is solely the responsibility of the authors and does not necessarily represent the official views of the National Institutes of Health. We are thankful for a grant from the Graduate School and the Office of the Vice Chancellor for Research and Graduate Education at the University of Wisconsin-Madison (to S.C.). We are grateful to Valeria Guzman-Luna for help with the generation of Figure S5. Finally, we thank Grace Baek and Gordon Stack (Rheosense), Javier Delgado Blanco (FoldX expert), Shih-Chu Liao (ISS) and all members of the Cavagnero group for technical assistance and helpful discussions.
Footnotes
The authors declare no competing financial interest.
SUPPORTING INFORMATION DESCRIPTION
Puromycin-assay description and representative SDS-PAGE gels, comparisons between steady-state anisotropy and time-domain and frequency-domain anisotropy decays, determination of reduced χ2 values, potential effect of ribosome–nascent-chain interactions on anisotropy parameters, oligonucleotide sequences used in cell-free reactions, anisotropy-decay graphs for all the data collected in this work, and predicted standard-state folding free energies for several nascent-chain lengths
REFERENCES
- 1.Dill KA; MacCallum JL The protein-folding problem, 50 years on. Science 2012, 338, 1042–1046. [DOI] [PubMed] [Google Scholar]
- 2.Sosnick TR; Barrick D The folding of single domain proteins—have we reached a consensus? Curr. Opin. Struct. Biol. 2011, 21, 12–24. [DOI] [PMC free article] [PubMed] [Google Scholar]
- 3.Udgaonkar JB Polypeptide chain collapse and protein folding. Arch. Biochem. Biophys. 2013, 531, 24–33. [DOI] [PubMed] [Google Scholar]
- 4.Fedyukina DV; Cavagnero S Protein folding at the exit tunnel. Annu. Rev. Biophys. 2011, 40, 337–359. [DOI] [PMC free article] [PubMed] [Google Scholar]
- 5.Balchin D; Hayer-Hartl M; Hartl FU In vivo aspects of protein folding and quality control. Science 2016, 353, aac4354. [DOI] [PubMed] [Google Scholar]
- 6.Braselmann E; Chaney JL; Clark PL Folding the proteome. Trends Biochem. Sci. 2013, 38, 337–344. [DOI] [PMC free article] [PubMed] [Google Scholar]
- 7.Gruebele M; Dave K; Sukenik S Globular protein folding in vitro and in vivo. Annu. Rev. Biophys. 2016, 45, 233–251. [DOI] [PubMed] [Google Scholar]
- 8.Waudby CA; Dobson CM; Christodoulou J Nature and regulation of protein folding on the ribosome. Trends Biochem. Sci. 2019, 44, 914–926. [DOI] [PMC free article] [PubMed] [Google Scholar]
- 9.Lu J; Deutsch C Folding zones inside the ribosomal exit tunnel. Nat. Struct. Mol. Biol. 2005, 12, 1123–1129. [DOI] [PubMed] [Google Scholar]
- 10.Kosolapov A; Deutsch C Tertiary interactions within the ribosomal exit tunnel. Nat. Struct. Mol. Biol. 2009, 16, 405–411. [DOI] [PMC free article] [PubMed] [Google Scholar]
- 11.Tu LW; Deutsch C A folding zone in the ribosomal exit tunnel for Kv1.3 helix formation. J. Mol. Biol. 2010, 396, 1346–1360. [DOI] [PMC free article] [PubMed] [Google Scholar]
- 12.Tu L; Khanna P; Deutsch C Transmembrane segments form tertiary hairpins in the folding vestibule of the ribosome. J. Mol. Biol. 2014, 426, 185–198. [DOI] [PMC free article] [PubMed] [Google Scholar]
- 13.Ellis JP; Bakke CK; Kirchdoerfer RN; Jungbauer LM; Cavagnero S Chain dynamics of nascent polypeptides emerging from the ribosome. ACS Chem. Biol. 2008, 3, 555–566. [DOI] [PMC free article] [PubMed] [Google Scholar]
- 14.Hardesty B; Kramer G Folding of a nascent peptide on the ribosome. Prog. Nucleic Acid Res. Mol. Biol. 2001, 66, 41–66. [DOI] [PubMed] [Google Scholar]
- 15.Ellis JP; Culviner PH; Cavagnero S Confined dynamics of a ribosome-bound nascent globin: Cone angle analysis of fluorescence depolarization decays in the presence of two local motions. Protein Sci. 2009, 18, 2003–2015. [DOI] [PMC free article] [PubMed] [Google Scholar]
- 16.Kudlicki W; Coffman A; Kramer G; Hardesty B Ribosomes and ribosomal RNA as chaperones for folding of proteins. Fold. Des. 1997, 2, 101–108. [DOI] [PubMed] [Google Scholar]
- 17.Chattopadhyay S; Das B; Dasgupta C Reactivation of denatured proteins by 23S ribosomal RNA: Role of domain V. Proc. Natl. Acad. Sci. U. S. A. 1996, 93, 8284–8287. [DOI] [PMC free article] [PubMed] [Google Scholar]
- 18.Das B; Chattopadhyay S; Dasgupta C Reactivation of denatured fungal glucose 6-phosphate dehydrogenase and E. coli alkaline phosphatase with E. coli ribosome. Biochem. Biophys. Res. Commun. 1992, 183, 774–780. [DOI] [PubMed] [Google Scholar]
- 19.Samanta D; Das A; Bhattacharya A; Basu A; Das D; DasGupta C Mechanism of ribosome assisted protein folding: A new insight into rRNA functions. Biochem. Biophys. Res. Commun. 2009, 384, 137–140. [DOI] [PubMed] [Google Scholar]
- 20.Das D; Samanta D; Hasan S; Das A; Bhattacharya A; Dasgupta S; Chakrabarti A; Ghorai P; Das Gupta C Identical RNA-protein interactions in vivo and in vitro and a scheme of folding the newly synthesized proteins by ribosomes. J. Biol. Chem. 2012, 287, 37508–37521. [DOI] [PMC free article] [PubMed] [Google Scholar]
- 21.Pang YH; Kovachev P; Sanyal S Ribosomal RNA modulates aggregation of the podospora prion protein HET-s. Int. J. Mol. Sci. 2020, 21, ijms21176340. [DOI] [PMC free article] [PubMed] [Google Scholar]
- 22.Ziv G; Haran G; Thirumalai D Ribosome exit tunnel can entropically stabilize α-helices. Proc. Natl. Acad. Sci. U. S. A. 2005, 102, 18956–18961. [DOI] [PMC free article] [PubMed] [Google Scholar]
- 23.Woolhead CA; McCormick PJ; Johnson AE Nascent membrane and secretory proteins differ in FRET-detected folding far inside the ribosome and in their exposure to ribosomal proteins. Cell 2004, 116, 725–736. [DOI] [PubMed] [Google Scholar]
- 24.Cruz-Vera LR; Rajagopal S; Squires C; Yanofsky C Features of ribosome-peptidyl-tRNA interactions essential for tryptophan induction of tna operon expression. Mol. Cell 2005, 19, 333–343. [DOI] [PubMed] [Google Scholar]
- 25.Houben ENG; Zarivach R; Oudega B; Luirink J Early encounters of a nascent membrane protein : specificity and timing of contacts inside and outside the ribosome. J. Cell Biol. 2005, 170, 27–35. [DOI] [PMC free article] [PubMed] [Google Scholar]
- 26.Guzman-Luna V; Fuchs AM; Cavagnero S Interaction of an intrinsically disordered nascent protein with specific regions of the ribosomal surface. 2021, Under revision. [DOI] [PMC free article] [PubMed]
- 27.Ullers RS; Houben EN; Raine A; ten Hagen-Jongman CM; Ehrenberg M; Brunner J; Oudega B; Harms N; Luirink J Interplay of signal recognition particle and trigger factor at L23 near the nascent chain exit site on the Escherichia coli ribosome. J. Cell Biol. 2003, 161, 679–684. [DOI] [PMC free article] [PubMed] [Google Scholar]
- 28.Peterson JH; Woolhead CA; Bernstein HD The conformation of a nascent polypeptide inside the ribosome tunnel affects protein targeting and protein folding. Mol. Microbiol. 2010, 78, 203–217. [DOI] [PMC free article] [PubMed] [Google Scholar]
- 29.Wang S; Jomaa A; Jaskolowski M; Yang C; Ban N; Shan S The molecular mechanism of cotranslational membrane protein recognition and targeting by SecA. Nat. Struct. Mol. Biol. 2019, 26, 919–929. [DOI] [PMC free article] [PubMed] [Google Scholar]
- 30.Addabbo RM; Dalphin MD; Mecha MF; Liu Y; Staikos A; Guzman-Luna V; Cavagnero S Complementary role of co- and post-translational events in de novo protein biogenesis. J. Phys. Chem. B 2020, 124, 6488–6507. [DOI] [PubMed] [Google Scholar]
- 31.Dao Duc K; Batra SS; Bhattacharya N; Cate Jamie H. D.; Song Yun S. Differences in the path to exit the ribosome across the three domains of life. Nucleic Acids Res. 2019, 47, 4198–4210. [DOI] [PMC free article] [PubMed] [Google Scholar]
- 32.Noeske J; Wasserman MR; Terry DS; Altman RB; Blanchard SC; Cate JHD High-resolution structure of the Escherichia coli ribosome. Nat. Struct. Mol. Biol. 2015, 22, 336–341. [DOI] [PMC free article] [PubMed] [Google Scholar]
- 33.Tsalkova T; Odom OW; Kramer G; Hardesty B Different conformations of nascent peptides on ribosomes. J. Mol. Biol. 1998, 278, 713–723. [DOI] [PubMed] [Google Scholar]
- 34.Kramer G; Ramachandiran V; Hardesty B Cotranslational folding — omnia mea mecum porto? Int. J. Biochem. Cell B 2001, 33, 541–553. [DOI] [PubMed] [Google Scholar]
- 35.Malkin LI; Rich A Partial resistance of nascent polypeptide chains to proteolytic digestion due to ribosomal shielding. J. Mol. Biol. 1967, 26, 329–346. [DOI] [PubMed] [Google Scholar]
- 36.Nilsson Ola B.; Hedman R; Marino J; Wickles S; Bischoff L; Johansson M; Müller-Lucks A; Trovato F; Puglisi Joseph D.; O’Brien Edward P., et al. Cotranslational protein folding inside the ribosome exit tunnel. Cell Rep. 2015, 12, 1533–1540. [DOI] [PMC free article] [PubMed] [Google Scholar]
- 37.Marino J; von Heijne G; Beckmann R Small protein domains fold inside the ribosome exit tunnel. FEBS Lett. 2016, 590, 655–660. [DOI] [PubMed] [Google Scholar]
- 38.Bhushan S; Gartmann M; Halic M; Armache J-P; Jarasch A; Mielke T; Berninghausen O; Wilson DN; Beckmann R α-Helical nascent polypeptide chains visualized within distinct regions of the ribosomal exit tunnel. Nat. Struct. Mol. Biol. 2010, 17, 313–317. [DOI] [PubMed] [Google Scholar]
- 39.Lu J; Deutsch C Secondary structure formation of a transmembrane segment in Kv channels. Biochemistry 2005, 44, 8230–8243. [DOI] [PubMed] [Google Scholar]
- 40.Liutkute M; Maiti M; Samatova E; Enderlein J; Rodnina MV Gradual compaction of the nascent peptide during cotranslational folding on the ribosome. eLife 2020, 9, e60895. [DOI] [PMC free article] [PubMed] [Google Scholar]
- 41.Farías-Rico JA; Ruud Selin F; Myronidi I; Frühauf M; von Heijne G Effects of protein size, thermodynamic stability, and net charge on cotranslational folding on the ribosome. Proc. Natl. Acad. Sci. U. S. A. 2018, 115, E9280–E9287. [DOI] [PMC free article] [PubMed] [Google Scholar]
- 42.Tian P; Steward A; Kudva R; Su T; Shilling PJ; Nickson AA; Hollins JJ; Beckmann R; von Heijne G; Clarke J, et al. Folding pathway of an Ig domain is conserved on and off the ribosome. Proc. Natl. Acad. Sci. U. S. A. 2018, 115, E11284–E11293. [DOI] [PMC free article] [PubMed] [Google Scholar]
- 43.Nilsson OB; Nickson AA; Hollins JJ; Wickles S; Steward A; Beckmann R; von Heijne G; Clarke J Cotranslational folding of spectrin domains via partially structured states. Nat. Struct. Mol. Biol. 2017, 24, 221–225. [DOI] [PubMed] [Google Scholar]
- 44.Liutkute M; Samatova E; Rodnina MV Cotranslational folding of proteins on the ribosome. Biomolecules 2020, 10, biom10010097. [DOI] [PMC free article] [PubMed] [Google Scholar]
- 45.Bakke CK; Jungbauer LM; Cavagnero S In vitro expression and characterization of native apomyoglobin under low molecular crowding conditions. Protein Expr. Purif. 2006, 45, 381–392. [DOI] [PubMed] [Google Scholar]
- 46.Gesteland RF Isolation and characterization of ribonuclease I mutants of Escherichia coli. J. Mol. Biol. 1966, 16, 67–84. [DOI] [PubMed] [Google Scholar]
- 47.Springer BA; Sligar SG High-level expression of sperm whale myoglobin in Escherichia coli. Proc. Natl. Acad. Sci. U. S. A. 1987, 84, 8961–8965. [DOI] [PMC free article] [PubMed] [Google Scholar]
- 48.Behrmann M; Koch HG; Hengelage T; Wieseler B; Hoffschulte HK; Müller M Requirements for the translocation of elongation-arrested, ribosome-associated OmpA across the plasma membrane of Escherichia coli. J. Biol. Chem. 1998, 273, 13898–13904. [DOI] [PubMed] [Google Scholar]
- 49.Hanes J; Plückthun A In vitro selection and evolution of functional proteins by using ribosome display. Proc. Natl. Acad. Sci. U. S. A. 1997, 94, 4937–4942. [DOI] [PMC free article] [PubMed] [Google Scholar]
- 50.Isolation and analysis of ribosomes from prokaryotes, eukaryotes, and organelles. In Ribosomes and Protein Synthesis: A Practical Approach, Spedding G, Ed.; Oxford University Press: Oxford, U.K., 1990; pp 1–27. [Google Scholar]
- 51.Odom OW; Hardesty B Use of 50 S-binding antibiotics to characterize the ribosomal site to which peptidyl-tRNA is bound. J. Biol. Chem. 1992, 267, 19117–19122. [PubMed] [Google Scholar]
- 52.Ziehr DR; Ellis JP; Culviner PH; Cavagnero S Production of ribosome-released nascent proteins with optimal physical properties. Anal. Chem. 2010, 82, 4637–4643. [DOI] [PubMed] [Google Scholar]
- 53.Moore SD; Baker TA; Sauer RT Forced extraction of targeted components from complex macromolecular assemblies. Proc. Natl. Acad. Sci. U. S. A. 2008, 105, 11685–11690. [DOI] [PMC free article] [PubMed] [Google Scholar]
- 54.Schneider CA; Rasband WS; Eliceiri KW NIH image to ImageJ: 25 years of image analysis. Nat. Methods 2012, 9, 671–675. [DOI] [PMC free article] [PubMed] [Google Scholar]
- 55.Abràmoff MD; Magalhães PJ; Ram SJ Image processing with ImageJ. Biophotonics international 2004, 11, 36–42. [Google Scholar]
- 56.Beechem JM; Gratton E Fluorescence spectroscopy data analysis environment: a second generation global analysis program. In Time-Resolved Laser Spectroscopy in Biochemistry, Lakowicz JR, Ed.; SPIE, Bellingham, 1988; pp 70–81. [Google Scholar]
- 57.Ross JA; Jameson DM Time-resolved methods in biophysics. 8. Frequency domain fluorometry: applications to intrinsic protein fluorescence. Photochem. Photobiol. Sci. 2008, 7, 1301–1312. [DOI] [PubMed] [Google Scholar]
- 58.Weinreis SA; Ellis JP; Cavagnero S Dynamic fluorescence depolarization: A powerful tool to explore protein folding on the ribosome. Methods 2010, 52, 57–73. [DOI] [PMC free article] [PubMed] [Google Scholar]
- 59.Small EW; Isenberg I Hydrodynamic properties of a rigid molecule: Rotational and linear diffusion and fluorescence anisotropy. Biopolymers 1977, 16, 1907–1928. [DOI] [PubMed] [Google Scholar]
- 60.Lakowicz JR Principles of fluorescence spectroscopy. 3rd ed.; New York: : Plenum Press: 2006. [Google Scholar]
- 61.Kirchdoerfer RN; Huang JJ; Isola MK; Cavagnero S Fluorescence-based analysis of aminoacyl- and peptidyl-tRNA by low-pH sodium dodecyl sulfate-polyacrylamide gel electrophoresis. Anal. Biochem. 2007, 364, 92–4. [DOI] [PMC free article] [PubMed] [Google Scholar]
- 62.Schägger H; von Jagow G Tricine-sodium dodecyl sulfate-polyacrylamide gel electrophoresis for the separation of proteins in the range from 1 to 100 kDa. Anal. Biochem. 1987, 166, 368–79. [DOI] [PubMed] [Google Scholar]
- 63.Kendrew JC; Bodo G; Dintzis HM; Parrish RG; Wyckoff H; Phillips DC A three-dimensional model of the myoglobin molecule obtained by x-ray analysis. Nature 1958, 181, 662–666. [DOI] [PubMed] [Google Scholar]
- 64.Kendrew JC; Dickerson RE; Strandberg BE; Hart RG; Davies DR; Phillips DC; Shore VC Structure of myoglobin: a three-dimensional fourier synthesis at 2 Å. resolution. Nature 1960, 185, 422–427. [DOI] [PubMed] [Google Scholar]
- 65.Jennings PA; Wright PE Formation of a molten globule intermediate early in the kinetic folding pathway of apomyoglobin. Science 1993, 262, 892. [DOI] [PubMed] [Google Scholar]
- 66.Nishimura C; Dyson HJ; Wright PE Identification of native and non-native structure in kinetic folding intermediates of apomyoglobin. J. Mol. Biol. 2006, 355, 139–156. [DOI] [PubMed] [Google Scholar]
- 67.Eliezer D; Wright PE Is apomyoglobin a molten globule? Structural characterization by NMR. J. Mol. Biol. 1996, 263, 531–8. [DOI] [PubMed] [Google Scholar]
- 68.Dyson HJ; Wright PE How does your protein fold? Elucidating the apomyoglobin folding pathway. Acc. Chem. Res. 2017, 50, 105–111. [DOI] [PMC free article] [PubMed] [Google Scholar]
- 69.Armstrong BD; Choi J; Lopez C; Wesener DA; Hubbell W; Cavagnero S; Han S Site-specific hydration dynamics in the nonpolar core of a molten globule by dynamic nuclear polarization of water. J. Am. Chem. Soc. 2011, 133, 5987–5995. [DOI] [PMC free article] [PubMed] [Google Scholar]
- 70.Samatova EN; Melnik BS; Balobanov VA; Katina NS; Dolgikh DA; Semisotnov GV; Finkelstein AV; Bychkova VE Folding intermediate and folding nucleus for I→N and U→I→N transitions in apomyoglobin: contributions by conserved and nonconserved residues. Biophys. J. 2010, 98, 1694–1702. [DOI] [PMC free article] [PubMed] [Google Scholar]
- 71.Balobanov VA; Katina NS; Finkelstein AV; Bychkova VE Intermediate states of apomyoglobin: Are they parts of the same area of conformations diagram? Biochem.-Moscow 2017, 82, 625–631. [DOI] [PubMed] [Google Scholar]
- 72.Ptitsyn OB Molten globule and protein folding. Adv. Protein Chem. 1995, 47, 83–229. [DOI] [PubMed] [Google Scholar]
- 73.Jungbauer LM; Bakke CK; Cavagnero S Experimental and computational analysis of translation products in apomyoglobin expression. J. Mol. Biol. 2006, 357, 1121–1143. [DOI] [PubMed] [Google Scholar]
- 74.Jameson DM; Gratton E; Hall RD The measurement and analysis of heterogeneous emissions by multifrequency phase and modulation fluorometry. Appl. Spectrosc. Rev. 1984, 20, 55–106. [DOI] [PubMed] [Google Scholar]
- 75.Bucci E; Steiner RF Anisotropy decay of fluorescence as an experimental approach to protein dynamics. Biophys. Chem. 1988, 30, 199–224. [DOI] [PubMed] [Google Scholar]
- 76.Feinstein E; Deikus G; Rusinova E; Rachofsky EL; Ross JBA; Laws WR Constrained analysis of fluorescence anisotropy decay:application to experimental protein dynamics. Biophys. J. 2003, 84, 599–611. [DOI] [PMC free article] [PubMed] [Google Scholar]
- 77.Majumdar A; Mukhopadhyay S Fluorescence depolarization kinetics to study the conformational preference, structural plasticity, binding, and assembly of intrinsically disordered proteins. Methods Enzymol. 2018, 611, 347–381. [DOI] [PubMed] [Google Scholar]
- 78.Shi X; Herschlag D Fluorescence polarization anisotropy to measure RNA dynamics. Methods Enzymol. 2009, 469, 287–302. [DOI] [PubMed] [Google Scholar]
- 79.Liu C; Liang G; Liu Z; Zu L Time-resolved fluorescence anisotropy study of the interaction between DNA and a peptide truncated from the p53 protein core domain. J. Fluoresc 2014, 24, 533–539. [DOI] [PubMed] [Google Scholar]
- 80.Jain N; Narang D; Bhasne K; Dalal V; Arya S; Bhattacharya M; Mukhopadhyay S Direct observation of the Iintrinsic backbone torsional mobility of disordered proteins. Biophys. J. 2016, 111, 768–774. [DOI] [PMC free article] [PubMed] [Google Scholar]
- 81.Sahay S; Anoop A; Krishnamoorthy G; Maji SK Site-specific fluorescence dynamics of α-synuclein fibrils using time-resolved fluorescence studies: effect of familial Parkinson’s disease-associated mutations. Biochemistry 2014, 53, 807–809. [DOI] [PubMed] [Google Scholar]
- 82.Motyka AL An introduction to rheology with an emphasis on application to dispersions. J. Chem. Educ. 1996, 73, 374–380. [Google Scholar]
- 83.Jary D; Sikorav JL; Lairez D Nonlinear viscoelasticity of entangled DNA molecules. EPL 1999, 46, 251–255. [Google Scholar]
- 84.Picchi D; Poesio P; Ullmann A; Brauner N Characteristics of stratified flows of Newtonian/non-Newtonian shear-thinning fluids. Int. J. Multiph. Flow 2017, 97, 109–133. [Google Scholar]
- 85.Chhabra RP Non-newtonian fluids: an introduction. In Rheology of Complex Fluids Krishnan J; Deshpande A; Kumar P, Eds.; Springer: New York, 2010; pp 3–34. [Google Scholar]
- 86.Ikeda S; Nishinari K Solid-like mechanical behaviors of ovalbumin aqueous solutions. Int. J. Biol. Macromol. 2001, 28, 315–320. [DOI] [PubMed] [Google Scholar]
- 87.Ikeda S; Nishinari K On solid-like rheological behaviors of globular protein solutions. Food Hydrocoll. 2001, 15, 401–406. [Google Scholar]
- 88.Matsumoto T; Inoue H Colloidal structure and properties of bovine serum globulin aqueous systems using SAXS and rheological measurements. Chem. Phys. 1996, 207, 167–172. [Google Scholar]
- 89.Inoue H; Matsumoto T Viscoelastic characterization of solid-like structure in aqueous colloids of globular proteins. Colloids Surf. A Physicochem. Eng. Asp 1996, 109, 89–96. [Google Scholar]
- 90.Sharma V; Jaishankar A; Wang Y-C; McKinley GH Rheology of globular proteins: apparent yield stress, high shear rate viscosity and interfacial viscoelasticity of bovine serum albumin solutions. Soft Matter 2011, 7, 5150–5160. [Google Scholar]
- 91.Lu JR; Su TJ; Thomas RK Structural conformation of bovine serum albumin layers at the air–water interface studied by neutron reflection. J. Colloid Interface Sci. 1999, 213, 426–437. [DOI] [PubMed] [Google Scholar]
- 92.Gouveia SM; Tiffany JM Human tear viscosity: An interactive role for proteins and lipids. Biochim. Biophys. Acta. Proteins Proteom. 2005, 1753, 155–163. [DOI] [PubMed] [Google Scholar]
- 93.Allen SH; Wong K-P A comparative study on the hydrodynamic shape, conformation, and stability of E. coli ribosomal subunits in reconstitution buffer. Arch. Biochem. Biophys. 1979, 195, 112–120. [DOI] [PubMed] [Google Scholar]
- 94.Taylor N; Elbaum-Garfinkle S; Vaidya N; Zhang H; Stone HA; Brangwynne CP Biophysical characterization of organelle-based RNA/protein liquid phases using microfluidics. Soft Matter 2016, 12, 9142–9150. [DOI] [PMC free article] [PubMed] [Google Scholar]
- 95.Juarez G; Arratia PE Extensional rheology of DNA suspensions in microfluidic devices. Soft Matter 2011, 7, 9444–9452. [Google Scholar]
- 96.Ciccolini LAS; Ayazi Shamlou P; Titchener-Hooker NJ; Ward JM; Dunnill P Rheological properties of chromosomal and plasmid DNA during alkaline lysis reaction. Bioprocess Eng. 1999, 21, 231–237. [Google Scholar]
- 97.Wang Y; Li C; Pielak GJ Effects of proteins on protein diffusion. J. Am. Chem. Soc. 2010, 132, 9392–9397. [DOI] [PMC free article] [PubMed] [Google Scholar]
- 98.Mika JT; Poolman B Macromolecule diffusion and confinement in prokaryotic cells. Curr. Opin. Biotechnol. 2011, 22, 117–126. [DOI] [PubMed] [Google Scholar]
- 99.Dix JA; Verkman AS Crowding effects on diffusion in solutions and cells. Annu. Rev. Biophys. 2008, 37, 247–263. [DOI] [PubMed] [Google Scholar]
- 100.Tabaka M; Kalwarczyk T; Szymanski J; Hou S; Holyst R The effect of macromolecular crowding on mobility of biomolecules, association kinetics, and gene expression in living cells. Front. Phys. 2014, 2, fphy.2014.00054. [Google Scholar]
- 101.Theillet F-X; Binolfi A; Frembgen-Kesner T; Hingorani K; Sarkar M; Kyne C; Li C; Crowley PB; Gierasch L; Pielak GJ, et al. Physicochemical properties of cells and their effects on intrinsically disordered proteins (IDPs). Chem. Rev. 2014, 114, 6661–6714. [DOI] [PMC free article] [PubMed] [Google Scholar]
- 102.Li C; Wang Y; Pielak GJ Translational and rotational diffusion of a small globular protein under crowded conditions. J. Phys. Chem. B 2009, 113, 13390–13392. [DOI] [PMC free article] [PubMed] [Google Scholar]
- 103.Kuttner YY; Kozer N; Segal E; Schreiber G; Haran G Separating the contribution of translational and rotational diffusion to protein association. J. Am. Chem. Soc. 2005, 127, 15138–15144. [DOI] [PubMed] [Google Scholar]
- 104.Wiśniewska A; Sozański K; Kalwarczyk T; Kędra-Królik K; Pieper C; Wieczorek SA; Jakieła S; Enderlein J; Hołyst R Scaling of activation energy for macroscopic flow in poly(ethylene glycol) solutions: Entangled – Non-entangled crossover. Polymer 2014, 55, 4651–4657. [Google Scholar]
- 105.Zosel F; Soranno A; Buholzer KJ; Nettels D; Schuler B Depletion interactions modulate the binding between disordered proteins in crowded environments. Proc. Natl. Acad. Sci. U. S. A. 2020, 117, 13480–13489. [DOI] [PMC free article] [PubMed] [Google Scholar]
- 106.Zorrilla S; Hink MA; Visser AJWG; Lillo MP Translational and rotational motions of proteins in a protein crowded environment. Biophys. Chem. 2007, 125, 298–305. [DOI] [PubMed] [Google Scholar]
- 107.McGuffee SR; Elcock AH Diffusion, crowding & protein stability in a dynamic molecular model of the bacterial cytoplasm. PLOS Comput. Biol. 2010, 6, e1000694. [DOI] [PMC free article] [PubMed] [Google Scholar]
- 108.Tuinier R; Dhont JKG; Fan TH How depletion affects sphere motion through solutions containing macromolecules. EPL 2006, 75, 929–935. [Google Scholar]
- 109.Asakura S; Oosawa F Interaction between particles suspended in solutions of macromolecules. J. Polym. Sci. 1958, 33, 183–192. [Google Scholar]
- 110.Vrij A Polymers at interfaces and the interactions in colloidal dispersions. Pure Appl. Chem. 1976, 48, 471–483. [Google Scholar]
- 111.von Bülow S; Siggel M; Linke M; Hummer G Dynamic cluster formation determines viscosity and diffusion in dense protein solutions. Proc. Natl. Acad. Sci. U. S. A. 2019, 116, 9843–9852. [DOI] [PMC free article] [PubMed] [Google Scholar]
- 112.Fedyukina DV; Jennaro TS; Cavagnero S Charge segregation and low hydrophobicity are key features of ribosomal proteins from different organisms. J. Biol. Chem. 2014, 289, 6740–6750. [DOI] [PMC free article] [PubMed] [Google Scholar]
- 113.Baker NA; Sept D; Joseph S; Holst MJ; McCammon JA Electrostatics of nanosystems: application to microtubules and the ribosome. Proc. Natl. Acad. Sci. U. S. A. 2001, 98, 10037–10041. [DOI] [PMC free article] [PubMed] [Google Scholar]
- 114.Record MT Jr.; Zhang W; Anderson CF Analysis of effects of salts and uncharged solutes on protein and nucleic acid equilibria and processes: a practical guide to recognizing and interpreting polyelectrolyte effects, Hofmeister effects, and osmotic effects of salts. Adv. Protein Chem. 1998, 51, 281–353. [DOI] [PubMed] [Google Scholar]
- 115.Anderson CF; Record MT Salt-nucleic acid interactions. Annu. Rev. Phys. Chem. 1995, 46, 657–700. [DOI] [PubMed] [Google Scholar]
- 116.García-García C; Draper DE Electrostatic interactions in a peptide--RNA complex. J. Mol. Biol. 2003, 331, 75–88. [DOI] [PubMed] [Google Scholar]
- 117.Suresha PR; Badiger MV; Wolf BA Polyelectrolytes in dilute solution: viscometric access to coil dimensions and salt effects. RSC Adv. 2015, 5, 27674–27681. [Google Scholar]
- 118.Izzo D; Cloitre M; Leibler L The viscosity of short polyelectrolyte solutions. Soft Matter 2014, 10, 1714–1722. [DOI] [PubMed] [Google Scholar]
- 119.Jameson DM; Hazlett TL In Biophysical and Biochemical Aspects of Fluorescence Spectroscopy, Dewey TG, Ed.; Plenum Press: New York, 1991; pp 105–133. [Google Scholar]
- 120.Cantor CR; Schimmel PR Biophysical Chemistry. W.H. Freeman and Company: New York, 1980. [Google Scholar]
- 121.Berezin MY; Achilefu S Fluorescence lifetime measurements and biological imaging. Chem. Rev. 2010, 110, 2641–2684. [DOI] [PMC free article] [PubMed] [Google Scholar]
- 122.Lipari G; Szabo A Effect of librational motion on fluorescence depolarization and nuclear magnetic resonance relaxation in macromolecules and membranes. Biophys. J. 1980, 30, 489–506. [DOI] [PMC free article] [PubMed] [Google Scholar]
- 123.Kinosita K; Ikegami A; Kawato S On the wobbling-in-cone analysis of fluorescence anisotropy decay. Biophys. J. 1982, 37, 461–464. [DOI] [PMC free article] [PubMed] [Google Scholar]
- 124.Knight AM; Culviner PH; Kurt-Yilmaz N; Zou T; Ozkan SB; Cavagnero S Electrostatic effect of the ribosomal surface on nascent polypeptide dynamics. ACS Chem. Biol. 2013, 8, 1195–1204. [DOI] [PubMed] [Google Scholar]
- 125.Deckert A; Waudby CA; Wlodarski T; Wentink AS; Wang X; Kirkpatrick JP; Paton JFS; Camilloni C; Kukic P; Dobson CM, et al. Structural characterization of the interaction of α-synuclein nascent chains with the ribosomal surface and trigger factor. Proc. Natl. Acad. Sci. U. S. A. 2016, 113, 5012–5017. [DOI] [PMC free article] [PubMed] [Google Scholar]
- 126.Hoffmann A; Merz F; Rutkowska A; Zachmann-Brand B; Deuerling E; Bukau B Trigger factor forms a protective shield for nascent polypeptides at the ribosome. J. Biol. Chem. 2006, 281, 6539–6545. [DOI] [PubMed] [Google Scholar]
- 127.Hoffmann A; Bukau B; Kramer G Structure and function of the molecular chaperone Trigger Factor. Biochim. Biophys. Acta Mol. Cell Res. 2010, 1803, 650–661. [DOI] [PubMed] [Google Scholar]
- 128.Kramer G; Shiber A; Bukau B Mechanisms of cotranslational maturation of newly synthesized proteins. Annu. Rev. Biochem. 2019, 88, 337–364. [DOI] [PubMed] [Google Scholar]
- 129.Mayer MP; Bukau B Hsp70 chaperones: cellular functions and molecular mechanism. Cell. Mol. Life Sci. 2005, 62, 670–684. [DOI] [PMC free article] [PubMed] [Google Scholar]
- 130.Kurt N; Cavagnero S The burial of solvent-accessible surface area is a predictor of polypeptide folding and misfolding as a function of chain elongation. J. Am. Chem. Soc. 2005, 127, 15690–15691. [DOI] [PMC free article] [PubMed] [Google Scholar]
- 131.Kurt N; Mounce BC; Ellison PA; Cavagnero S Residue-specific contact order and contact breadth in single-domain proteins: implications for folding as a function of chain elongation. Biotechnol. Prog. 2008, 24, 570–575. [DOI] [PubMed] [Google Scholar]
- 132.Mounce BC; Kurt N; Ellison PA; Cavagnero S Nonrandom distribution of intramolecular contacts in native single-domain proteins. Proteins 2009, 75, 404–412. [DOI] [PubMed] [Google Scholar]
- 133.Zhao V; Jacobs WM; Shakhnovich E Effect of protein structure on evolution of cotranslational folding. Biophys. J. 2020, 119, 1123–1134. [DOI] [PMC free article] [PubMed] [Google Scholar]
- 134.Yaeger-Weiss SK; Jennaro TS; Mecha M; Becker JH; Yang H; Winkler GLW; Cavagnero S Net charge and nonpolar content guide the identification of folded and prion proteins. Biochemistry 2020, 59, 1881–1895. [DOI] [PubMed] [Google Scholar]
- 135.Schymkowitz J; Borg J; Stricher F; Nys R; Rousseau F; Serrano L The FoldX web server: an online force field. Nucleic Acids Res. 2005, 33, W382–W388. [DOI] [PMC free article] [PubMed] [Google Scholar]
- 136.Wilson DN; Beckmann R The ribosomal tunnel as a functional environment for nascent polypeptide folding and translational stalling. Curr. Opin. Struct. Biol. 2011, 21, 274–282. [DOI] [PubMed] [Google Scholar]
Associated Data
This section collects any data citations, data availability statements, or supplementary materials included in this article.


