Abstract
Objective:
Needle electromyography (EMG) is used to study the electrical behavior of myofiber properties in patients with neuromuscular disorders. However, due to the complexity of electrical potential spatial propagation in nonhomogeneous diseased muscle, a comprehensive understanding of volume conduction effects remains elusive. Here, we develop a framework to study the conduction effect of extracellular abnormalities and electrode positioning on extracellular local field potential (LFP) recordings.
Methods:
The framework describes the macroscopic conduction of electrical potential in an isotropic, nonhomogeneous (i.e., two tissue) model. Numerical and finite element model simulations are provided to study the conduction effect in prototypical monopolar EMG measurements.
Results:
LFPs recorded are influenced in amplitude, phase and duration by the electrode position in regards to the vicinity of tissue with different electrical properties.
Conclusion:
The framework reveals the influence of multiple mechanisms affecting LFPs including changes in the distance between the source – electrode and tissue electrical properties.
Clinical significance:
Our modeled predictions may lead to new ways for interpreting volume conduction effects on recorded EMG activity, for example in neuromuscular diseases that cause structural and compositional changes in muscle tissue. These change will manifest itself by changing the electric properties of the conductor media and will impact recorded potentials in the area of affected tissue.
Keywords: Needle electromyography, neuromuscular disorders, local field potential, skeletal muscle
1. Introduction
Needle electromyography (EMG) remains the standard “go-to” test used to evaluate neuromuscular disorders in adult population (Katirji 2014). In standard EMG (Figure 1 A), a monopolar (1-electrode) or concentric (2-electrode) needle is inserted through the skin and subcutaneous fat into a muscle of interest using anatomical landmarks. Once placed in the muscle, it is gently maneuvered through the tissue to intentionally irritate and injure individual myocyte membranes with the limb at rest. With each passage of the needle, electrical discharges are observed from the resulting membrane depolarization. Through pattern recognition, the examiner seeks to identify abnormal spontaneous electrical potentials, including repetitive discharges from single muscle fibers (e.g., fibrillation potentials and myotonic potentials) or from groups of muscle fibers (e.g., fasciculation potentials and myokymic potentials). Once this part of the procedure is completed, the patient is then asked to contract the muscle and the characteristics of the voluntary motor unit potentials are evaluated as well as the recruitment patterns.
Figure 1.
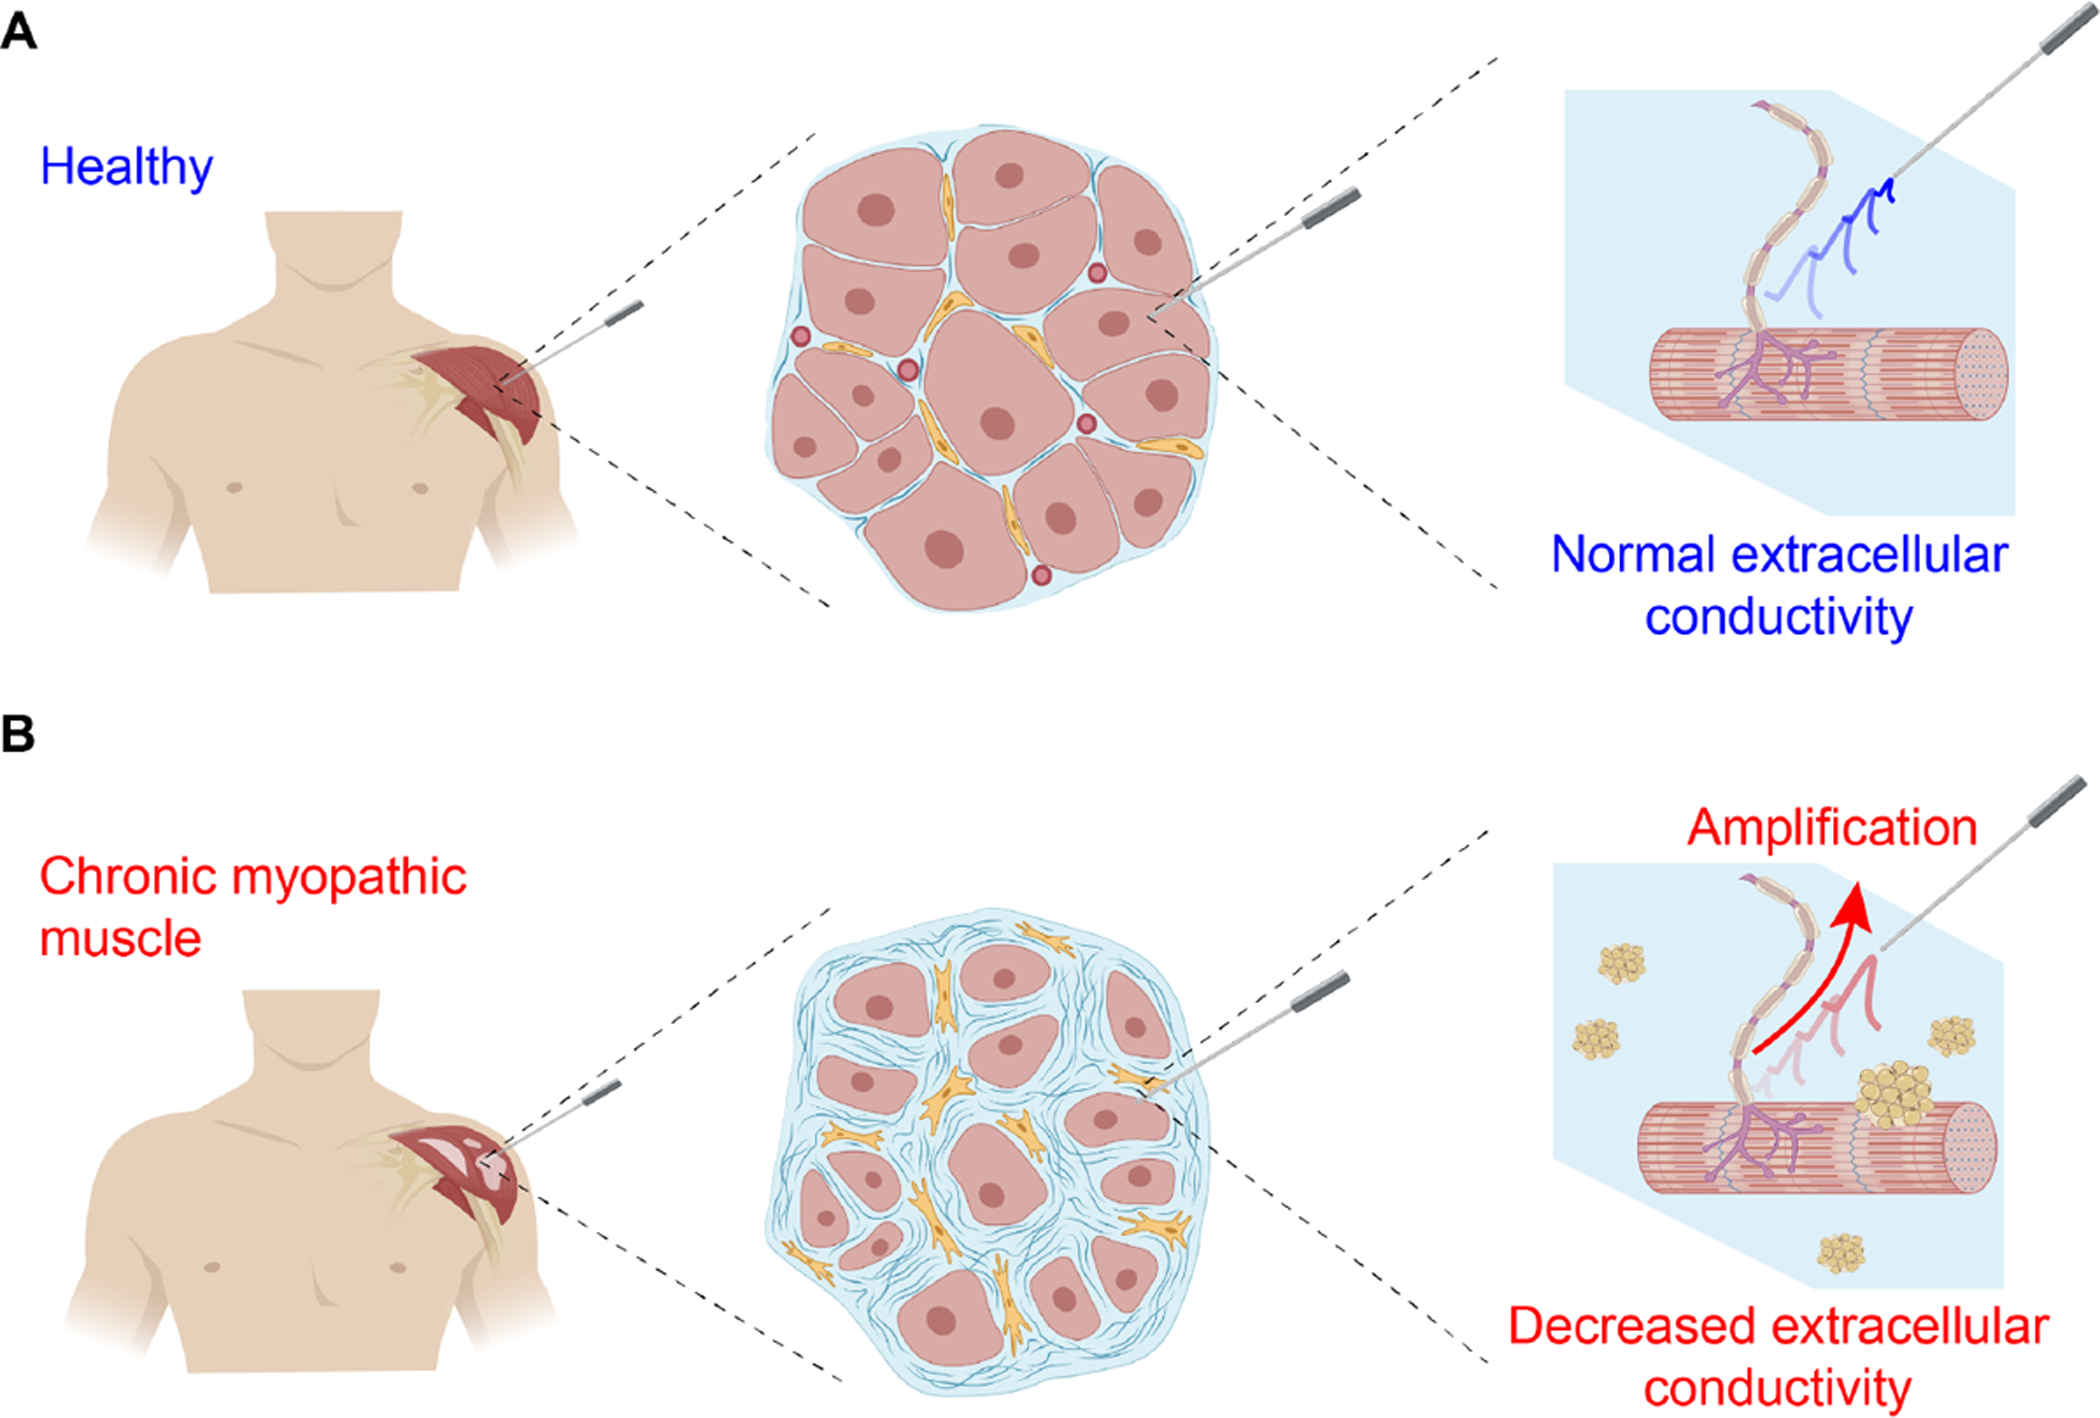
Illustration of extracellular local field potentials (LFPs) spatial propagation in needle electromyography towards a distant recording needle electrode. The LFPs are filtered (attenuated or amplified) by the frequency characteristics determined by the electrical properties (EP) of diseased muscle extracellular environment. In the figure, decreased conductivity illustrated by pockets of fat infiltration as seen in chronic myopathic disease increase the amplitude of LFPs (Fukada et al. 2010).
EMG records low frequency extracellular local field potentials (LFPs) generated by “electrically-active” motor units. In nonhomogeneous diseased muscle as shown in Figure 1, the filtering characteristics of the tissue affecting the morphology (i.e., in amplitude, latency and phase) of LFPs are likely determined by structural (e.g., myofiber atrophy or tissue necrosis) and compositional (e.g., fatty infiltration or interstitial edema) alterations affecting the extracellular conducting medium (Nagy et al. 2019). These tissue alterations are a main determinant of the frequency-filtering properties of LFPs and their effect on far-distant surface EMG recordings has been exhaustively studied in (Mesin & Farina 2004, Mesin 2013a, Mesin 2013b). Here, we expand these studies and develop simplified analytical models to describe electrical potentials recorded in nonhomogeneous muscle during a needle EMG test, i.e., the clinical approach to diagnose neuromuscular disorders (de Morentin et al. 2021).
Experimental observation of volume conduction and its relevance to features on needle EMG has been studied for decades. Work going back to the 1980s assessed the impact of depolarizing neurons or myofibers through a volume conductor. For example, studies have assessed how the distance between the source of the potential and recording electrodes will impact the observed responses and were especially important in the field of evoked potentials (Machida et al. 1983, Yamada et al. 1982). Dimitru also investigated the effects of the position of the recording electrodes to the potential source in a review paper in 1991 that summarized beautifully our understanding of potentials that stands to this day (Dumitru & Delisa 1991). These studies showed how the amplitude and morphology of common waveforms, including fibrillation and motor unit potentials, would change depending on the distance between the recording electrode and source. However, there was always an assumption of homogeneous, conductive media. In most neurological disorders, in contrast, this is known not to be the case. In disorders with inflammation, the presence of edema could actually increase tissue conductivity with the muscle (Sanchez & Rutkove 2017). Conversely, in conditions in which there is substantial fat deposition, such as in a muscular dystrophy or chronic neurogenic disease, the overall conductivity may decrease. Although some have studied the impact of subcutaneous fat on surface EMG measurements (Lowery et al. 2002, Blok et al. 2002, Lowery et al. 2004), to our knowledge, none have sought to assess the impact of such additional components in a nonhomogeneous pattern within the muscle itself.
This work aims to contribute to the understanding macroscopic nonhomogeneous volume conduction effects on monopolar needle EMG. For this, we develop a theoretical framework to model electrical potential recordings in a nonhomogeneous volume conductor composed of two separate, interspersed and both tissues with different electrical properties. The framework is general enough to describe an arbitrary boundary between the tissues with the voltage recording electrode in a different tissue from the (current) source or even at the boundary between tissues. We develop in Section 2 and 3 a framework to model quasi-stationary and transient LFPs, respectively. Two simplified case studies are analyzed in Section 4 considering the effect of subcutaneous fat and muscle fat deposition in Section 5. Section 6 compares our theoretical prediction against FEM simulations, which confirm the usefulness of the novel framework presented. Finally, the main findings are discussed in Section 7.
2. Quasi-stationary volume conduction framework in a nonhomogeneous domain
We consider a nonhomogeneous tissue containing two arbitary domains Ω1, Ω2 and their boundary Ψ ≔ Ω1 ∩ Ω2 in full space. The boundary can be either an inifnite surface (Figure 2 A, B, C) or a limited closed surface (Figure 2 D, E, F). The system of coordinates r ≔ (x, y, z) ∈ Λ defines the position of the current source and voltage measuring electrodes S at rS ≔ (xS, yS, zS) and E at rE ≔ (xE, yE, zE), respectively, with rS ≠ rE. Electrode S, E are capable to locate in the same domain (Figure 2 A, D) and in different domains (Figure 2 B, E). In addition, either of S, E can be placed on the boundary (Figure 2 C, F). To develop a biophysic-driven model for aforementioned nonhomogeneous tissue, we make the following assumptions: (1), the source and voltage recording electrodes are dimensionless; (2), each sub-domain has isotropic, frequency-dependent electrical properties; and (3), there are no free charges in the model.
Figure 2.
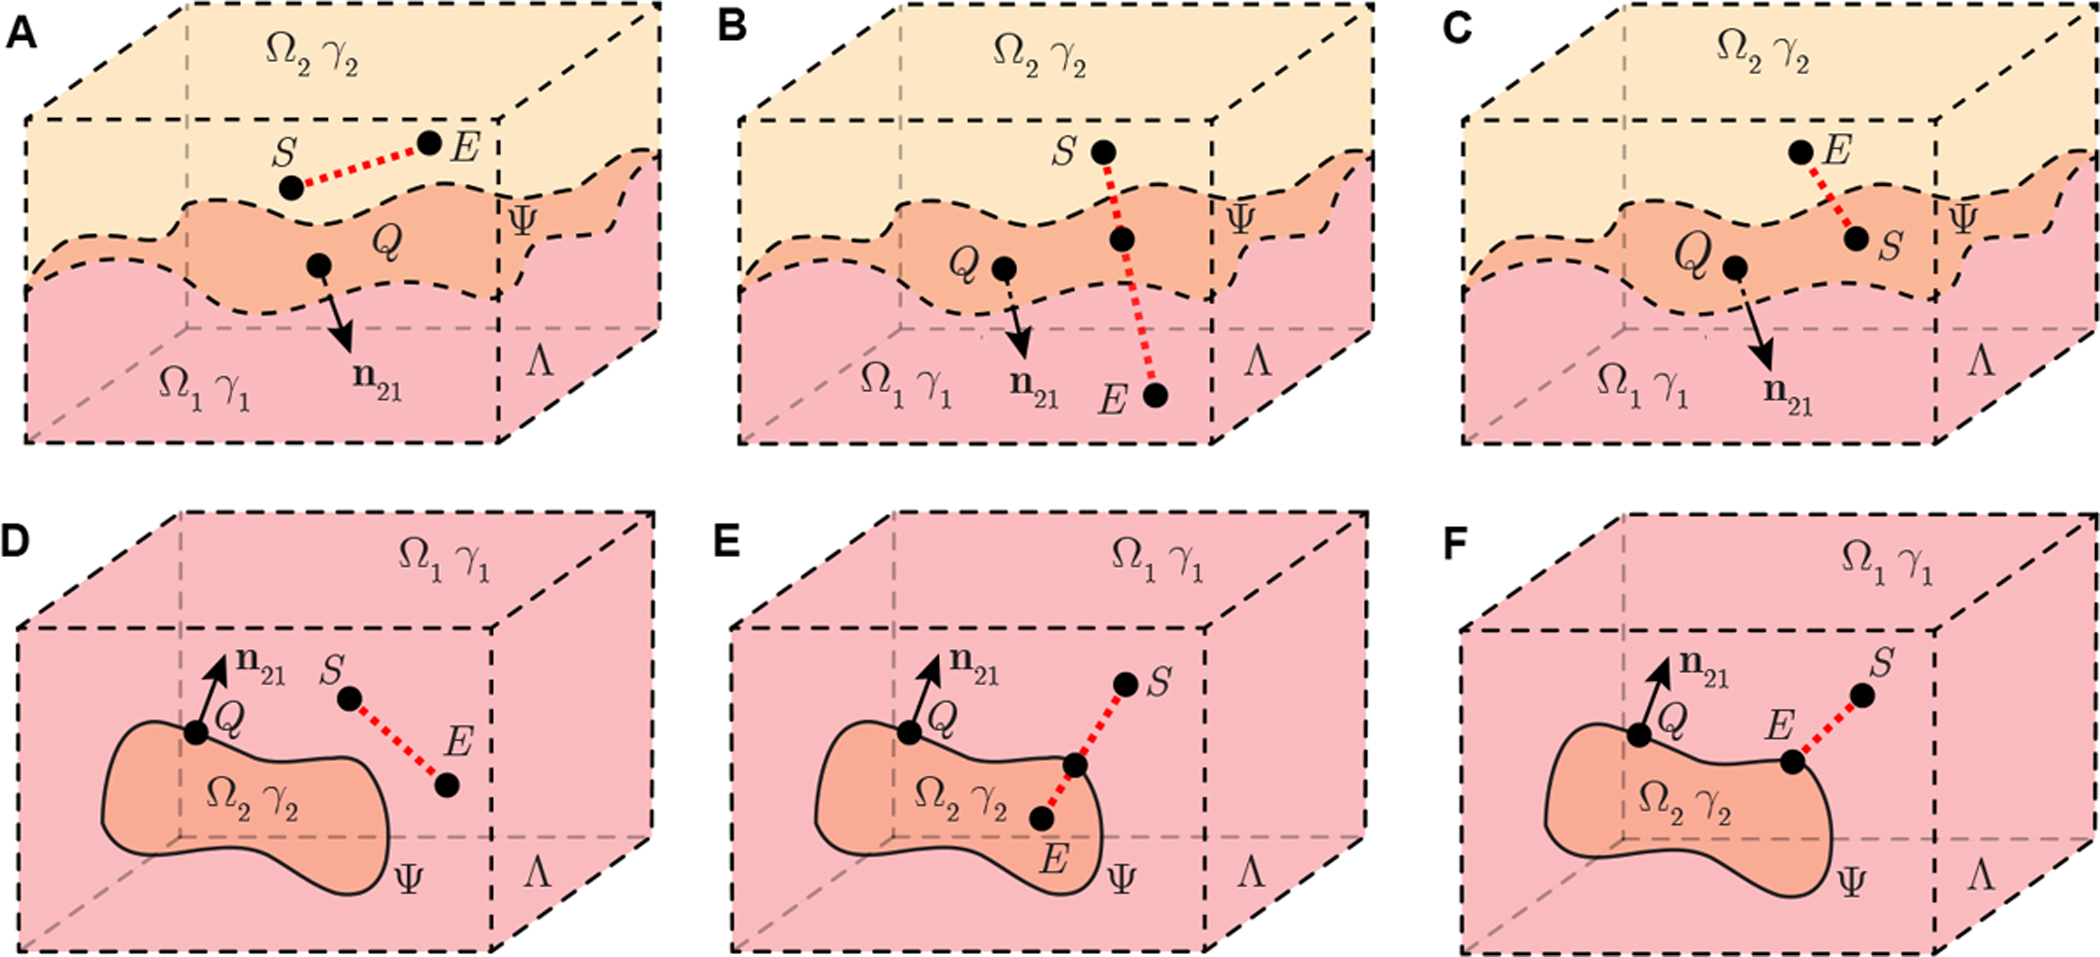
Schematic illustrating a nonhomogeneous tissue containing two sub-domains Ω1 and Ω2 in full space Λ with isotropic admittivity γ1 and γ2, respectively. Domain Ω2 is a infinite open region (A, B, C) or limited closed region (D, E, F). In this model, the point Q with coordinates rQ ≔ (xQ, yQ, zQ) is on Ψ, the latter the surface which defines the boundary between Ω1 and Ω2. Vector n21 is a normal vector of Ψ at rQ, which is pointing from Ω2 to Ω1. A current source S at rS ≔ (xS, yS, zS) generates current in the model. Electrode E at rE ≔ (xE, yE, zE) records the resultant electrical potential. The current source S and voltage measuring electrode E are placed in the same domain (A, D) or in different domains (B, E). In addition, either of S and E can be on the boundary Ψ (C, F).
2.1. Governing equation
In order to build an analytical model describing the spatial propagation of electrical potential through skeletal muscle tissue as a volume conductor requires to define the genesis of electrical current, either endogenously (e.g., action current) or exogenously (e.g., externally induced electrical current), generated within the model. Firstly we consider a sinusoidal electrical current i(t) ≔ I cos(ωkt) generated by the current source S positioned at rS with current sink at infinity, where is the time variable, is the current amplitude at the measurement frequency . An electrode E is placed at rE to determine the electrical potential with reference zero potential at infinity (in practice, this is the ground electrode in EMG measurements). Since the electrical potential generated by sink infinitely far away, it has no impact on the region of source S that we are interested to study. Thus the electrical potential recorded by E is stimulated by source S only. The admittivity in Λ expressed explicitly as a function of the position and measurement frequency is
| (1) |
where i ∈ {1, 2} is the domain index, , and are the isotropic conductivity and permittivity, i.e., γ1 in Ω1 and γ2 in Ω2, respectively, and is the imaginary unit (dimensionless).
From Maxwell equations in quasi-stationary regime (Maxwell 1873), the generalized Poisson equation with respect to the electrical potential distribution generated by the current source S applying current I is
| (2) |
in which ∇ is the vector differential operator, and δ(r) is the Dirac delta function. Henceforth, we omit both the spatial and the frequency dependence of both the admittivity γ(r, ωk) and potential U(r, ωk) as γ and U, respectively, for the sake of notation clarity.
Next, we define an arbitrary point Q with coordinates rQ ≔ (xQ, yQ, zQ) on boundary Ψ. Vector n21 (rQ) is a normal vector of surface Ψ at rQ pointing from Ω2 to Ω1 and is its unit vector, i.e., , where |·| is the L2 norm. According to (1) and considering that the gradient of admittivity is , (2) gives
| (3) |
where r ≠ rS and is the reflection coefficient (dimensionless) on Ψ between Ω1 and Ω2 defined as Γ ≔ (γ1 − γ2)/(γ1 + γ2). Finally, (3) determines the electrical potential distribution U in Λ generated by unique current source S at an arbitrary position rS.
2.2. Electrical potential distribution
To solve (3), we define an integral transformation operator here with respect to arbitrary surface Ψ as
where is an arbitrary function defined in , and dΨ (rQ) represents the area of the micro-elements dΨ on surface Ψ at position rQ. Based on , we can also define a mth-order iterative transform as
where . Then, applying the method of Green’s function (Cohl & Tohline 1999) to (3) gives an integral equation for the electrical potential, namely
| (4) |
where γS ≔ γ (rS) refers to the admittivity at position rS. Using variational iteration method (He 1999, Wazwaz 2007) to solve (4), we define the approximated electrical potential as
| (5) |
where is the order of the approximation. Then U can be approximated as . Since |Γ| < 1, we can apply operator to simplify (5) as
| (6) |
where
| (7) |
is a mth-order geometrical constant (m−1) determined by the shape of surface Ψ and the relative position between the source rS and the potential evaluating point r with respect to Ψ. Then, the 1st-order p = 1 approximated electrical potential measured by the voltage recording electrode E is
| (8) |
3. Transient volume conduction framework in a nonhomogeneous domain
The 1st-order approximated model (8) developed from (2) describes the electrical potential in quasi-stationary state generated by a sinusoidal current source I at specific frequency ωk. Using the Fourier transform method as the same rationale in (Miceli et al. 2017), it can be extended to a transient model with an arbitrary waveform current source in time domain . Then, the 1st-order temporal electrical potential approximation recorded by voltage measuring electrode E follows from (8), namely
| (9) |
where is the current spectrum of an arbitrary current signal i(t); is the (angular) frequency variable; Re{·} is the real operator; and , are the (inverse) Fourier transform operator.
4. Case study
4.1. Case study 1: planar boundary model
To analyze the planar boundary model, here we provide a compact analytical expression of 1st-order geometrical parameter in (8) when boundary Ψ is a plane (i.e., the curvature of surface Ψ is 0). That is to consider near the recording site, subcutaneous fat tissue and underlying muscle can be seen as a plane. In this case, the source S can be placed either on the plane Ψ (Figure 3 A) or in Ω{1,2} (Figure 3 B). The voltage recording electrode E can be positioned anywhere else in this model. According to (7) and Lemma 1 in Part A of the Supplementary Information, we have the 1st-order geometrical parameter for framework in case study 1 as
| (10) |
where i ∈ {1, 2}, S′ at rS′ is the mirrored image source, i.e., (rS + rS′)/2 ∈ Ψ. Substituting (10) into (8), we can find that rS on Ψ and when rS in Ωi, rE in Ω3−i or on Ψ share the same 1st-order electrical potential model , namely
| (11) |
Using (9) we can also find transient potential propagating model .
Figure 3.
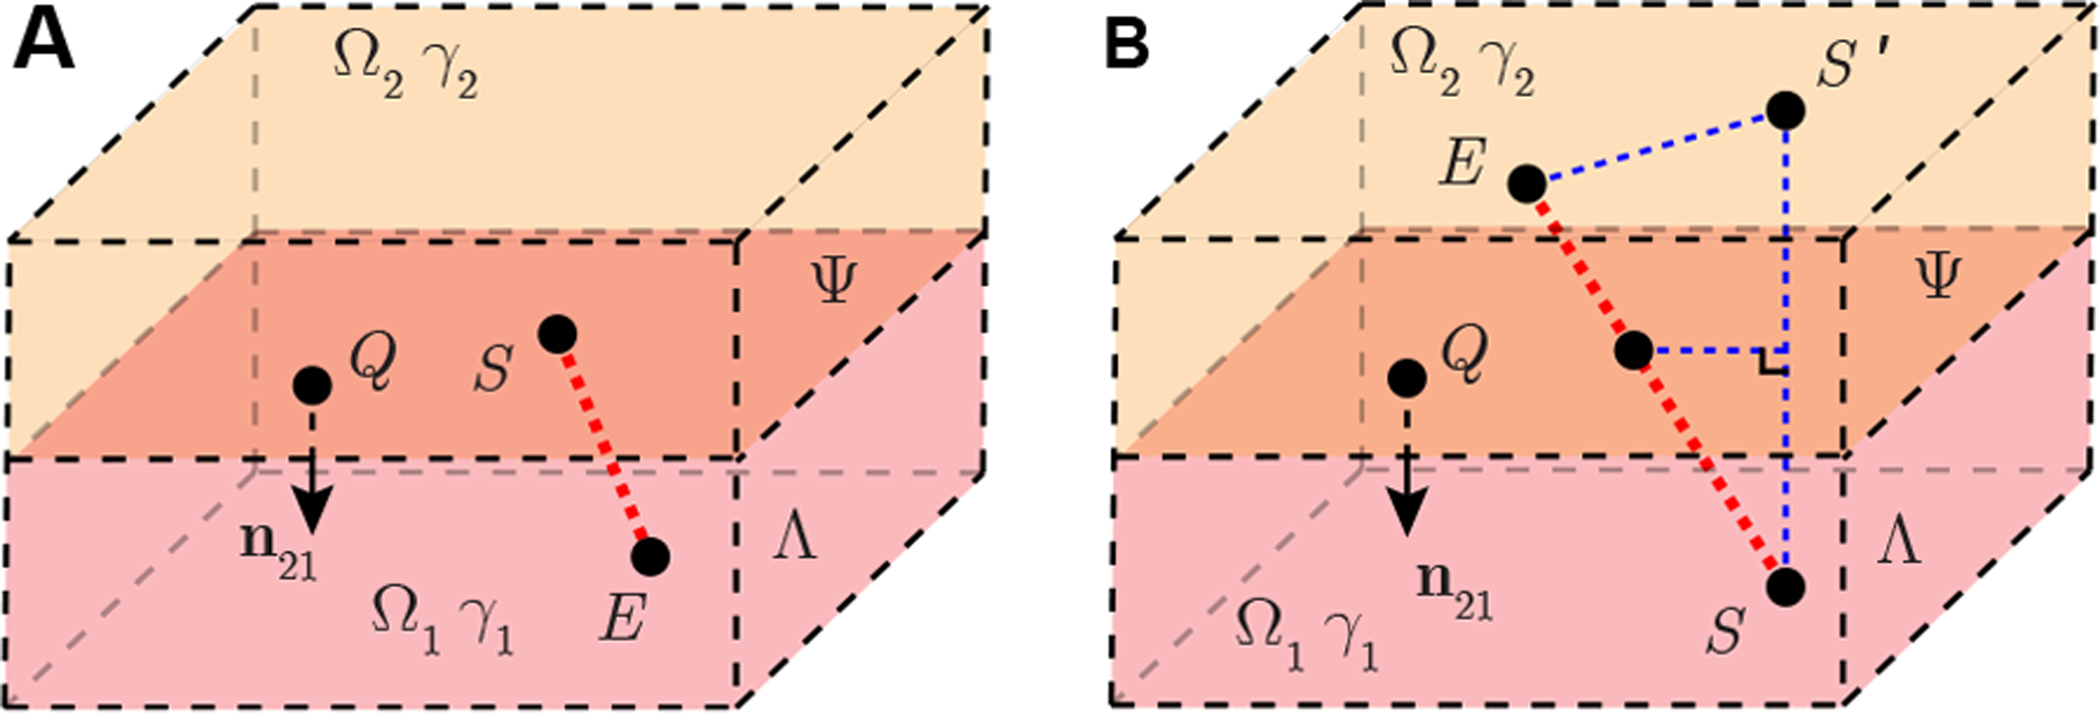
Case study 1 of a nonhomogeneous EMG measurement with a planar boundary in full space Λ. Plane Ψ divide full space into two half space domains Ω1 and Ω2 with isotropic admittivity γ1, γ2, respectively. Point Q with coordinates rQ is on Ψ. Vector n21 is a normal vector of Ψ at rQ, which is pointing from Ω2 to Ω1. A point source S located at rS generates current in the model. Electrode E at rE is another point recording the electrical potential. Electrode S is available to be placed on plane Ψ (A) and inside a domain (B). Electrode E is placed at anywhere else in Λ. If rS ∉ Ψ, S′ is the mirrored point of S at rS′. They are mirror symmetry with respect to plane Ψ.
4.2. Case study 2: spherical boundary model
Here we study the effect of a spherical boundary between tissues Ψ on recorded EMG. This model is an abstraction of fat deposition within the muscle as can be seen in chronic neurogenic muscle for example. In this case, the source S can be placed either on the spherical surface Ψ (Figure 4 A) or in domain Ω{1,2} (Figure 4 B). The electrical potential recording electrode E can be placed anywhere else in Λ. Point C at rC is the center of the spherical surface Ψ. According to (7) and Lemma 2 in Part B of Supplementary Information, we have the 1st-order geometrical parameter for framework in case study 2 as
| (12) |
where distance b is the radius of spherical surface Ψ, distance RS ≔ |rS − rC| is the distance between the current source and center of the sphere, distance RE ≔ |rE − rC| is the distance between voltage recording electrode and the center of the sphere, θC ≔ cos−1 ((rS − rC) · (rE − rC)/(|rS − rC||rE − rC|)) is the angle between line segment |SC| and |EC|, Pn(x) are Legendre polynomials. Substituting (12) into (8), one can obtain 1st-order electrical potential model . Using (9), we can also yield transient potential spatial propagation model for case study 2.
Figure 4.
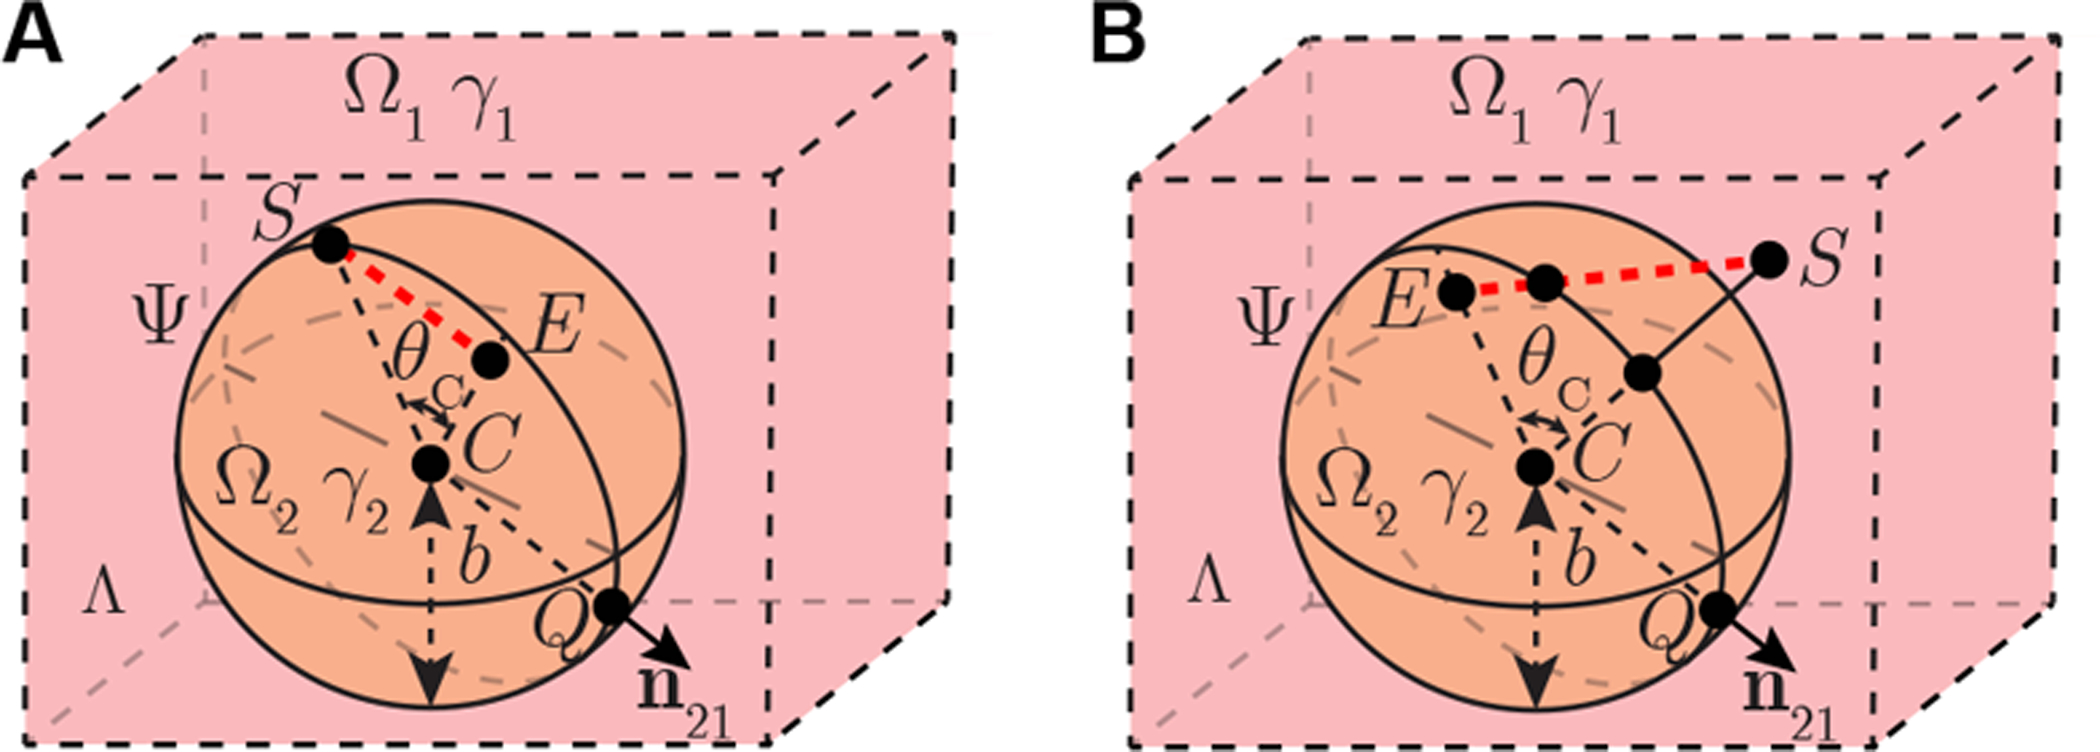
Case study 2 of nonhomogeneous EMG measurement with a spherical boundary in full space Λ. Spherical surface Ψ divide full space into two domains Ω1 and Ω2 with isotropic admittivity γ1, γ2, respectively. Point Q with coordinates rQ is on Ψ. Vector n21 is a normal vector of Ψ at rQ, which is pointing from Ω2 to Ω1. A point source S located at rS generates current in the model. Electrode E at rE is another point recording the electrical potential. Electrode S is available to be placed on plane Ψ (A) and inside a domain (B). Electrode E is placed anywhere else in Λ.
5. Materials and methods
5.1. Numerical potential spatial propagation
Domain Ω1 and Ω2 in case case study 1 and 2 are considered as skeletal muscle and fat, respectively. As shown in Figure 5 A, an experimentally recorded action current recorded by voltage clamp (Hernández-Ochoa & Schneider 2012) is considered as a current source S in Ω1. The recording potential stimulated by sinusoidal current (I = 20 nA at 1 kHz) and membrane current (Figure 5 A) are computed in MATLAB (The Mathworks, Natick, MA, USA) using (8) and (9), respectively. The conductivity and relative permittivity of muscle and fat tissues (Figure 5 B) are obtained from an online dataset (Gabriel et al. 1996). Of note, the conductivity and relative permittivity of muscle are geometrical mean values of longitudinal and transverse electrical property in anisotropic skeletal muscle.
Figure 5.
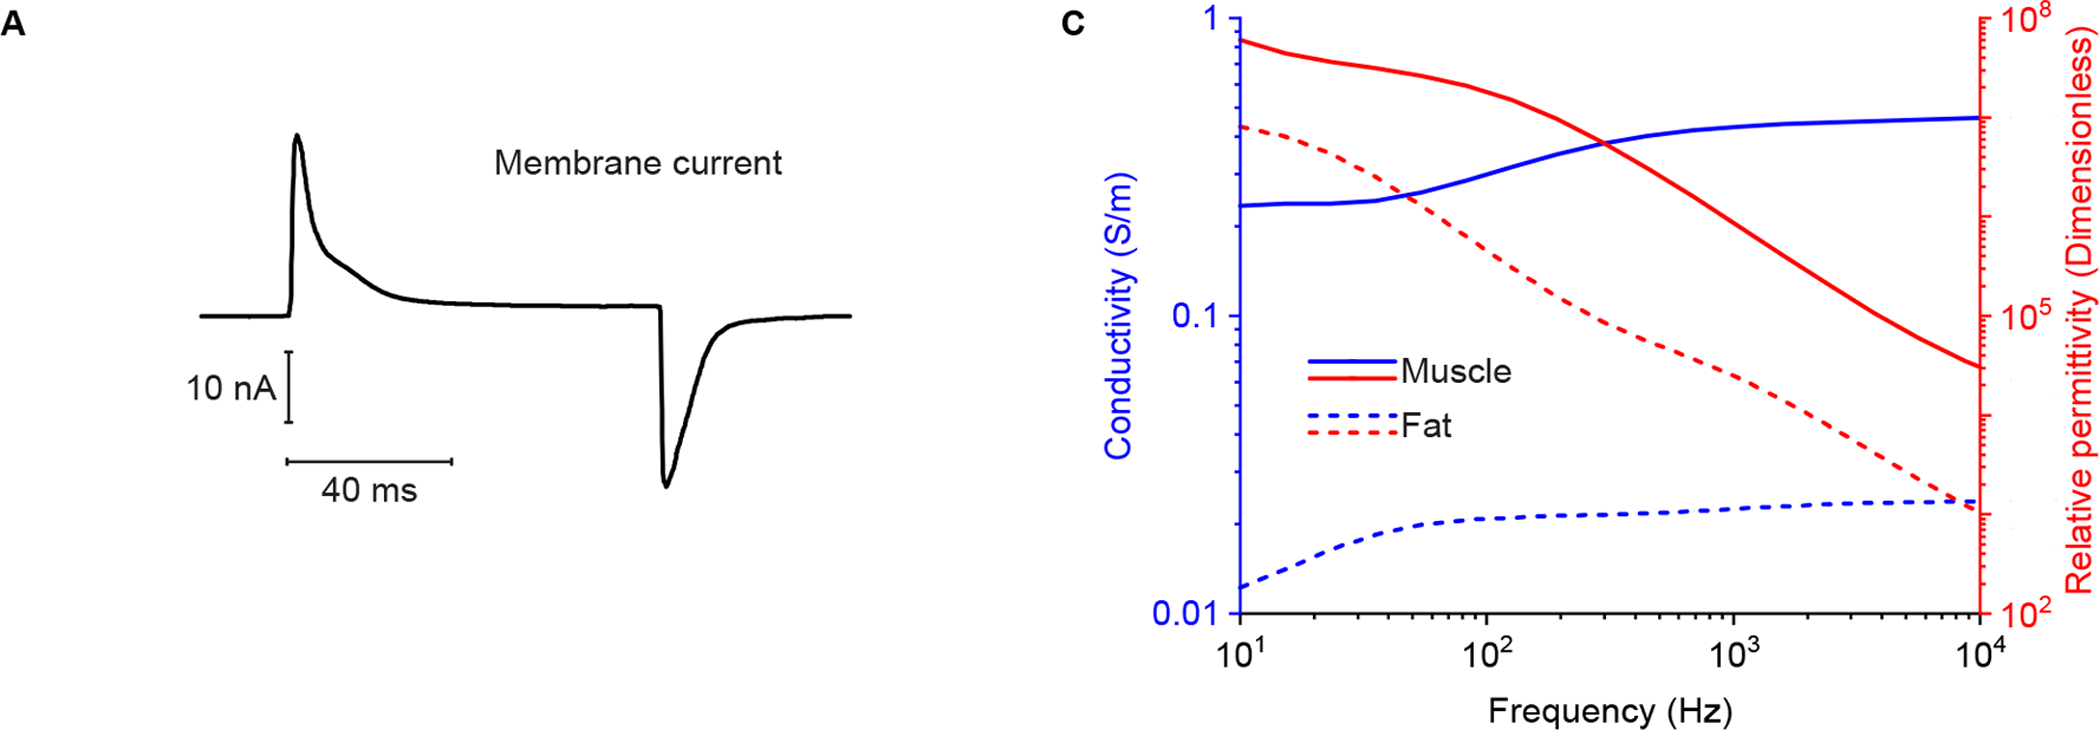
(A) Muscle transient current simulated. The membrane current waveform was recorded via voltage clamp in response to an 80 ms step depolarization to 0 mV from a membrane potential of −80 mV (Hernández-Ochoa & Schneider 2012). (B) Simulated conductivity (in blue color) and relative permittivity (in red color) of skeletal muscle (solid lines) and fat (dotted lines) tissue (Gabriel et al. 1996).
In case study 1, the recording electrode E is simulated in Ω1 (Figure 6 A) and Ω2 (Figure 6 B). Length hS, hE are the distances from source S, electrode E to boundary Ψ, respectively, while dSE is the distance between S and E. The geometrical parameters are set as hS = [1, 9] mm, hE = [0, 10] mm, dSE = [1, 19] mm. In case study 2, the recording electrode E is simulated in Ω1 (Figure 7 A) and Ω2 (Figure 7 B). Length RS, RE are the distances from source S, electrode E to spherical center C, respectively, while θC is the angle between line segment |SC| and |EC|. The radius of spherical volume b is configured as b = 5 mm. Other geometrical parameters are set as RS = [6, 15] mm, RE = [0, 15] mm, θc = [0°, 180°] mm.
Figure 6.
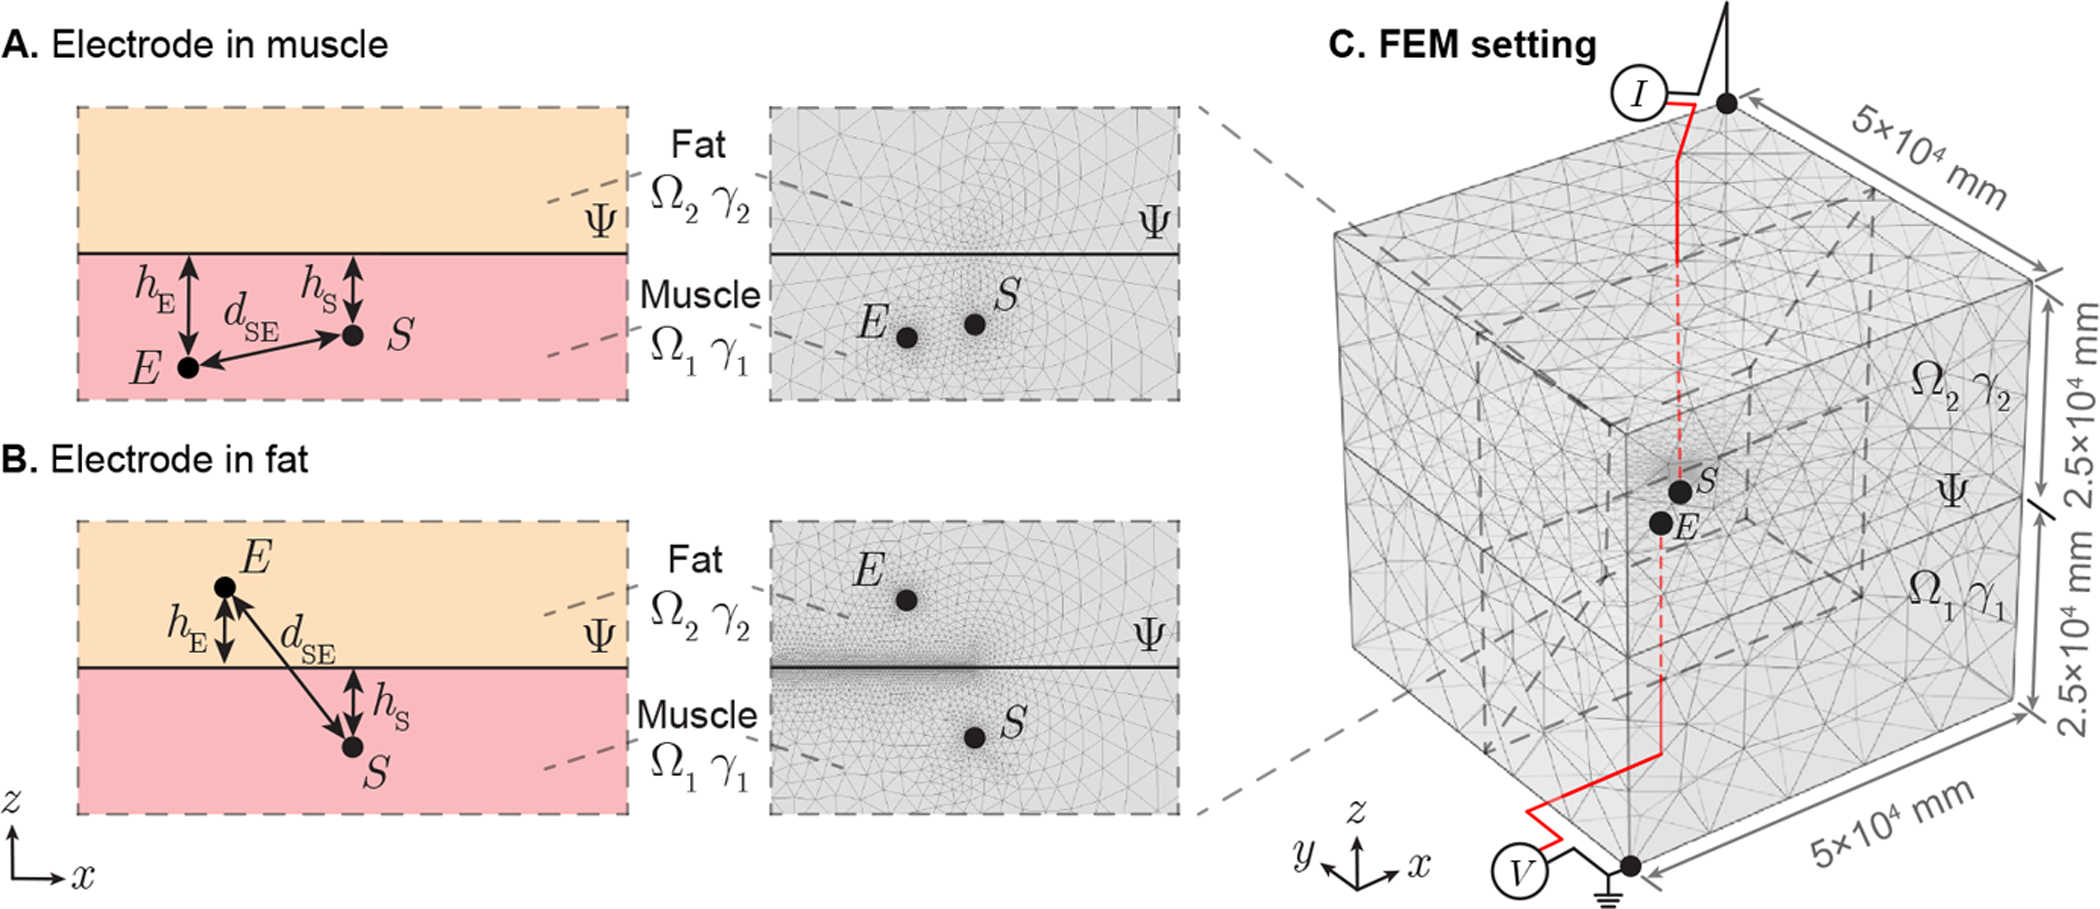
Illustration of case study 1 applied in needle EMG recording affected by subcutaneous fat. A plane Ψ divide full space into two half-space domains Ω1 and Ω2 with admittivity γ1 and γ2, which are configured as muscle and fat, respectively. A point-like current source S is located in muscle and potential recording electrode can be placed in skeletal muscle (A) or subcutaneous fat (B). Length hS, hE are the distances from point S, E to boundary Ψ, respectively, while dSE is the distance between S and E. A finite element model (FEM) is built in a 5 × 5 × 5 (×104 mm) region with current sink and zero potential reference at opposite vertexs of this cube (C). The interested potential disribution area determined by source S is located in the cubic center.
Figure 7.
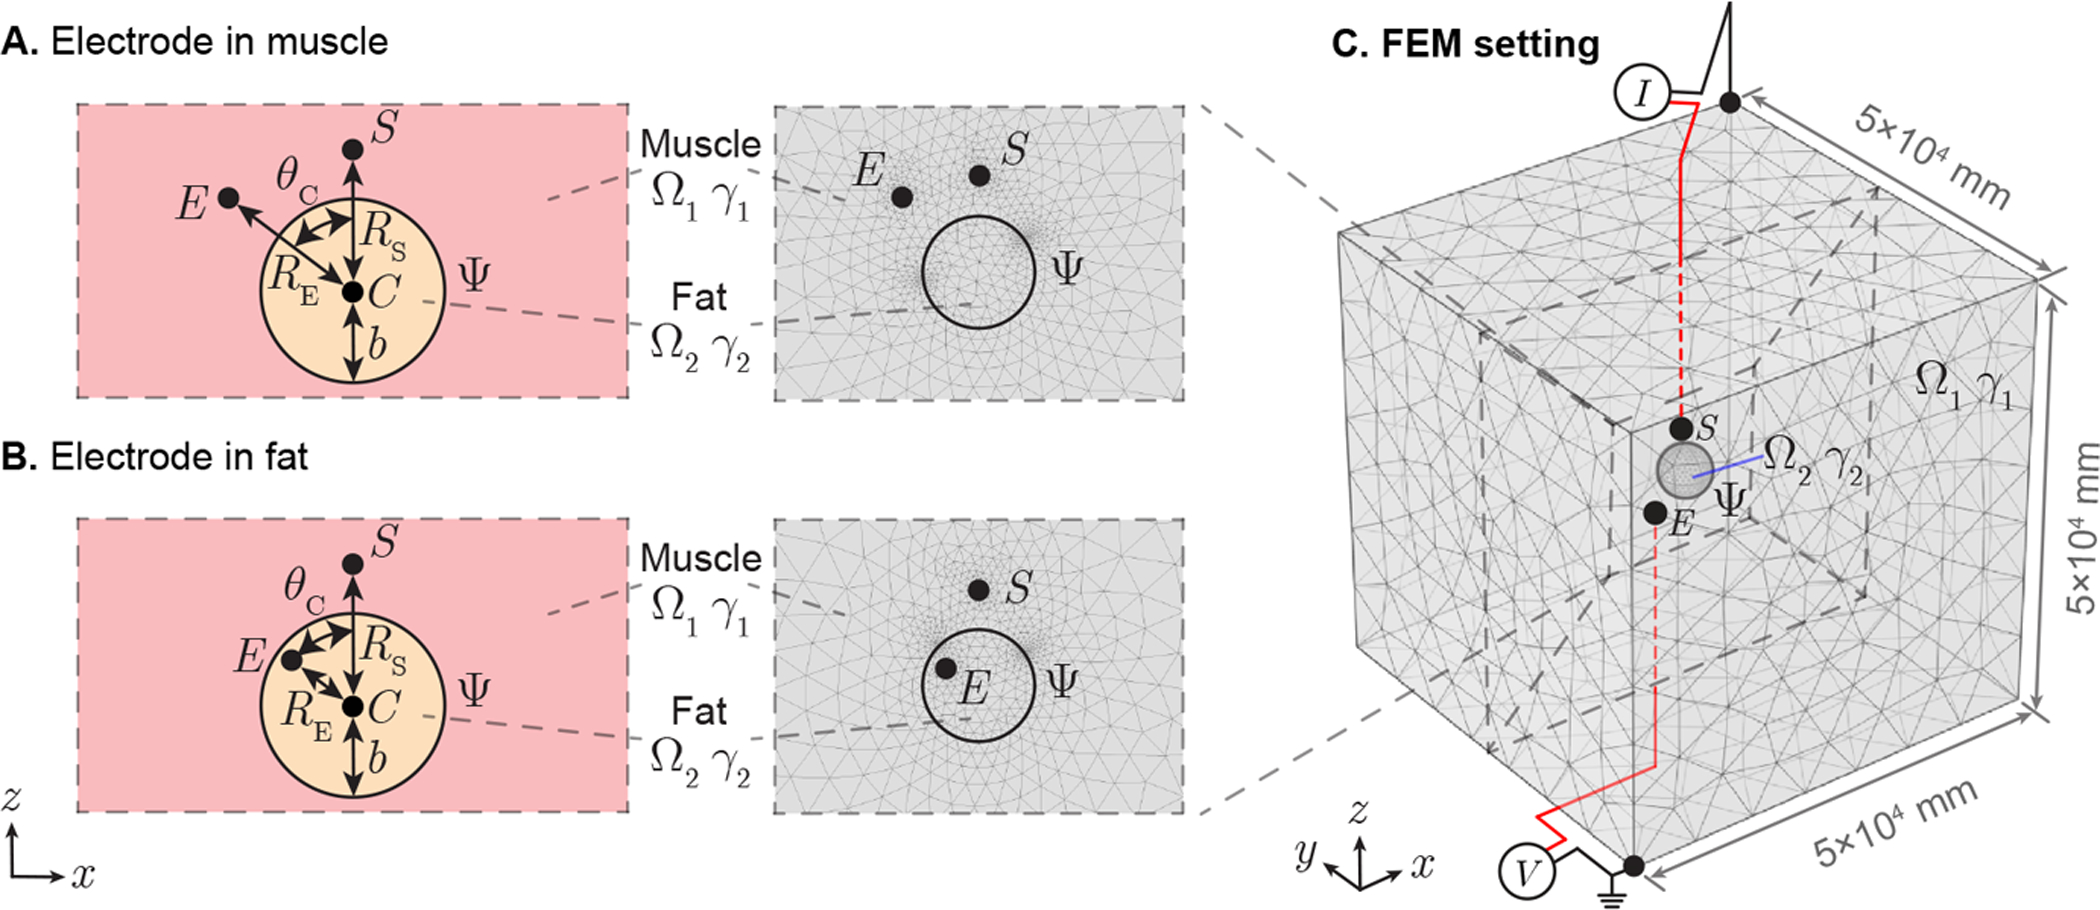
Application of spherical boundary case in needle EMG recording affected by intruded fat. A spherical surface Ψ divide full space into open domain Ω1 and closed domain Ω2 with admittivity γ1 and γ2, which are configured as muscle and fat, respectively. The spherical volume Ω2 centered at point C with radius b. A point-like current source S is located in muscle and potential recording electrode can be placed in muscle (A) or fat (B). Length RS, RS are the distances from point S, E to C, respectively, while θC is the angle between line segment |SC| and |EC|. A finite element model (FEM) is built in a 5 × 5 × 5 (×104 mm) region with current sink and zero potential reference at opposite vertexs of this cube (C). The interested potential disribution area determined by source S is in the cubic center.
5.2. Finite element model simulations
FEM simulations were performed in Comsol Multiphysics (Comsol, Inc., Burlington, MA, USA) to determine the potential spatial propagation generated by a sinusoidal current (I = 20 nA at 1 kHz). The simulating region was 50 × 50 × 50 m3 with current sink and zero potential reference at opposite vertexs of this cubic region (see Figure 6 C and Figure 7 C). Simultaneously, the current source S and potential recording electrode E are placed in the central area of cube, where we are interested to study the electrical potential distribution. The conductivity and the relative permittivity at 1 kHz are 4.31 × 10⁻¹ S/m, 8.67 × 10⁵ (dimensionless) for Ω1, 2.25 × 10⁻² S/m and 2.48×10⁴ (dimensionless) for Ω2 (Gabriel et al. 1996). Adaptive mesh was used, where the maximum and minimum mesh element size are configured as 103 mm and 10−3 mm, respectively. The maximum element growth rate is set as 1.2 and the curvature factor is 0.2. The number of degrees of freedom are 534,570 in case study 1 and 535,054 in case study 2.
6. Results
Figure 8 shows the electrical potential obtained with analytical and FEM models changing the voltage electrode position. The isopotential lines are plotted for case study 1 (Figure 8 A and E) and case study 2 (Figure 8 I and M). Unlike a homogeneous volume conductor, the distribution of potential lines are distorted by the vicinity of Ω2 with different electrical properties than Ω1. Also, the spacing between adjacent isopotential lines is smaller in Ω2 than that in Ω1. For case study 1, the magnitude and phase of the electrical potential with the voltage recording electrode in Ω1 is shown in Figure 8 B, C, D; and Ω2 in Figure 8 F, G, H. Similarly for case study 2, the magnitude and phase of the electrical potential with the voltage recording electrode in Ω1 is shown in Figure 8 J, K, L; and Ω1 in Figure 8 N, O, P. Overall, theory and FEM predicted magnitude and phase of electrical potential are in good agreement. Interestingly, when potential recording electrode is positioned in Ω2 in case study 1 (see Figure 8 F, G, H), the phase of measured potential is a constant wherever the electrode is, and the magnitude is only determined by the distance between current source and electrode.
Figure 8.
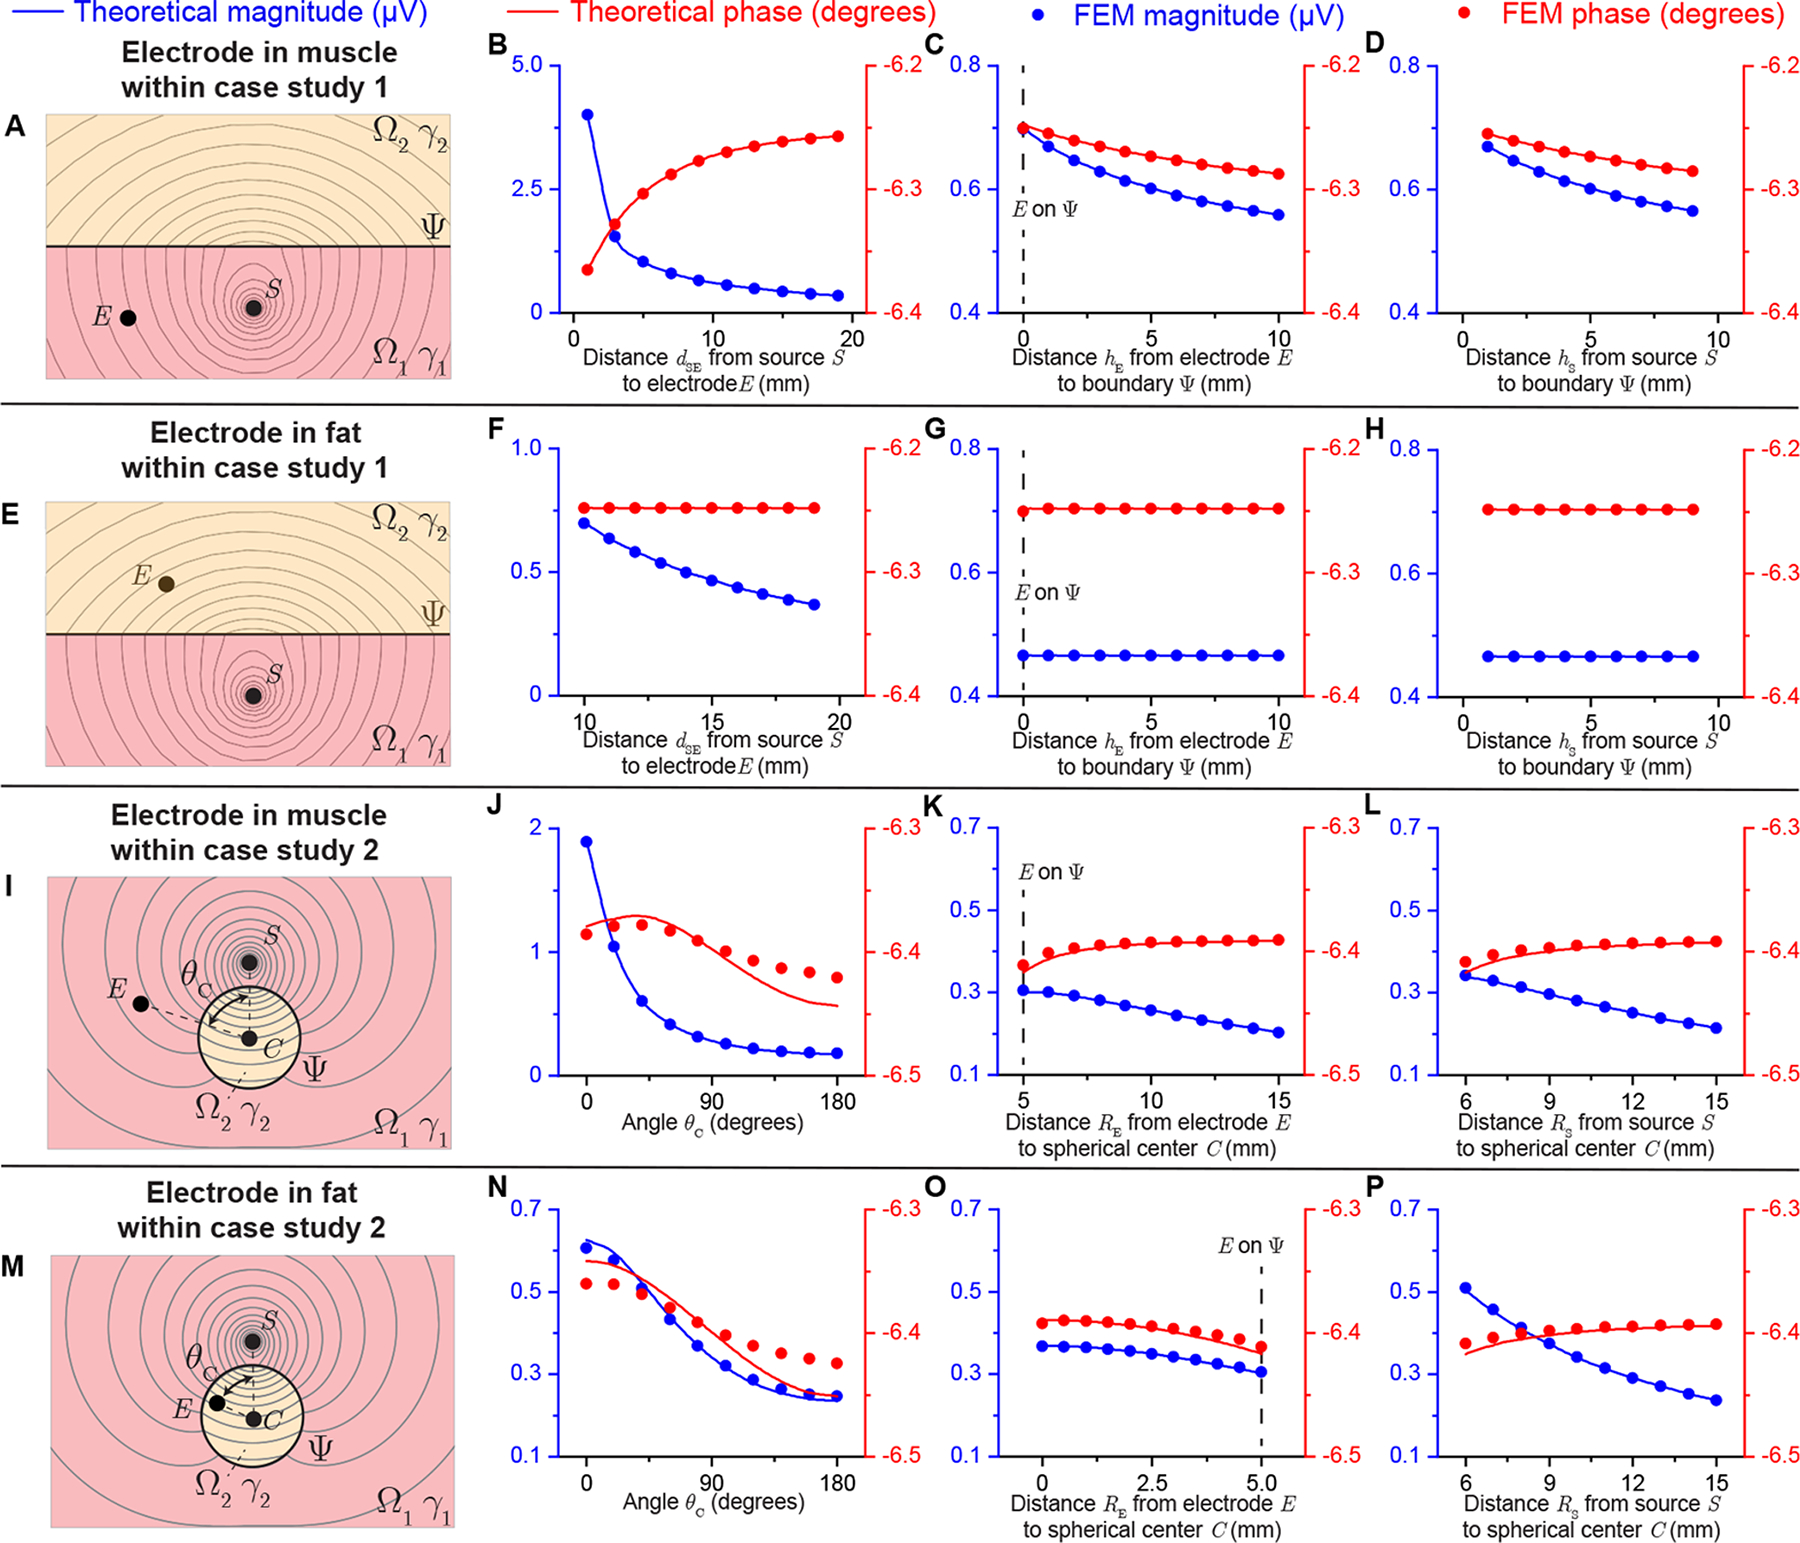
Analytical and FEM-simulated electrical potential results of case study 1 (see Figure 6) and case study 2 (see Figure 7) varying the electrodes position with sinusoidal current (I = 20 nA at 1 kHz) source. Panels (A, E, I, M) show the resultant isopotential lines in case study 1 and 2 with the source S in Ω1 and the electrode E in Ω1 and Ω2. The magnitude (in blue) and phase (in red) of electrical potential are compared between theoretical prediction (solid line) and FEM simulation (circles) changing dSE = [1, 19] mm (B), hE = [0, 10] mm (C), hS = [1, 9] mm (D) with dSE = 10 mm, hE = hS = 5 mm when the electrode E is in muscle for case study 1; changing dSE = [10, 19] mm (F), hE = [0, 10] mm (G), hS = [1, 9] mm (H) with dSE = 15 mm, hE = hS = 5 mm when the electrode E is in fat for case study 1 (i.e., (8) with geometrical parameter (10)); changing θC = [0°, 180°] (J), RE = [5, 15] mm (K), RS = [6, 15] mm (L) with θC = 90°, RE = 8 mm, RS = 10 mm, b = 5 mm when the electrode E is in muscle for case study 2; changing θC = [0°, 180°] (N), RE = [0, 5] mm (O), RS = [6, 15] mm (P) with θC = 90°, RE = 3 mm, RS = 10 mm, b = 5 mm when the electrode E is in muscle for case study 2 (i.e., (8) with geometrical parameter (12)).
Figure 9 shows the electrical potential normalized by the sinusoidal current source (i.e., units of electrical impedance) changing the frequency from 10 Hz to 10 kHz, that is the frequency bandwidth of the EMG signal. Overall, the theoretical prediction does agree with FEM simulation. As expected, the frequency response of the tissue filtering characteristics is that of a low pass filter, with a minimum of the phase value at the frequency of 100 Hz.
Figure 9.
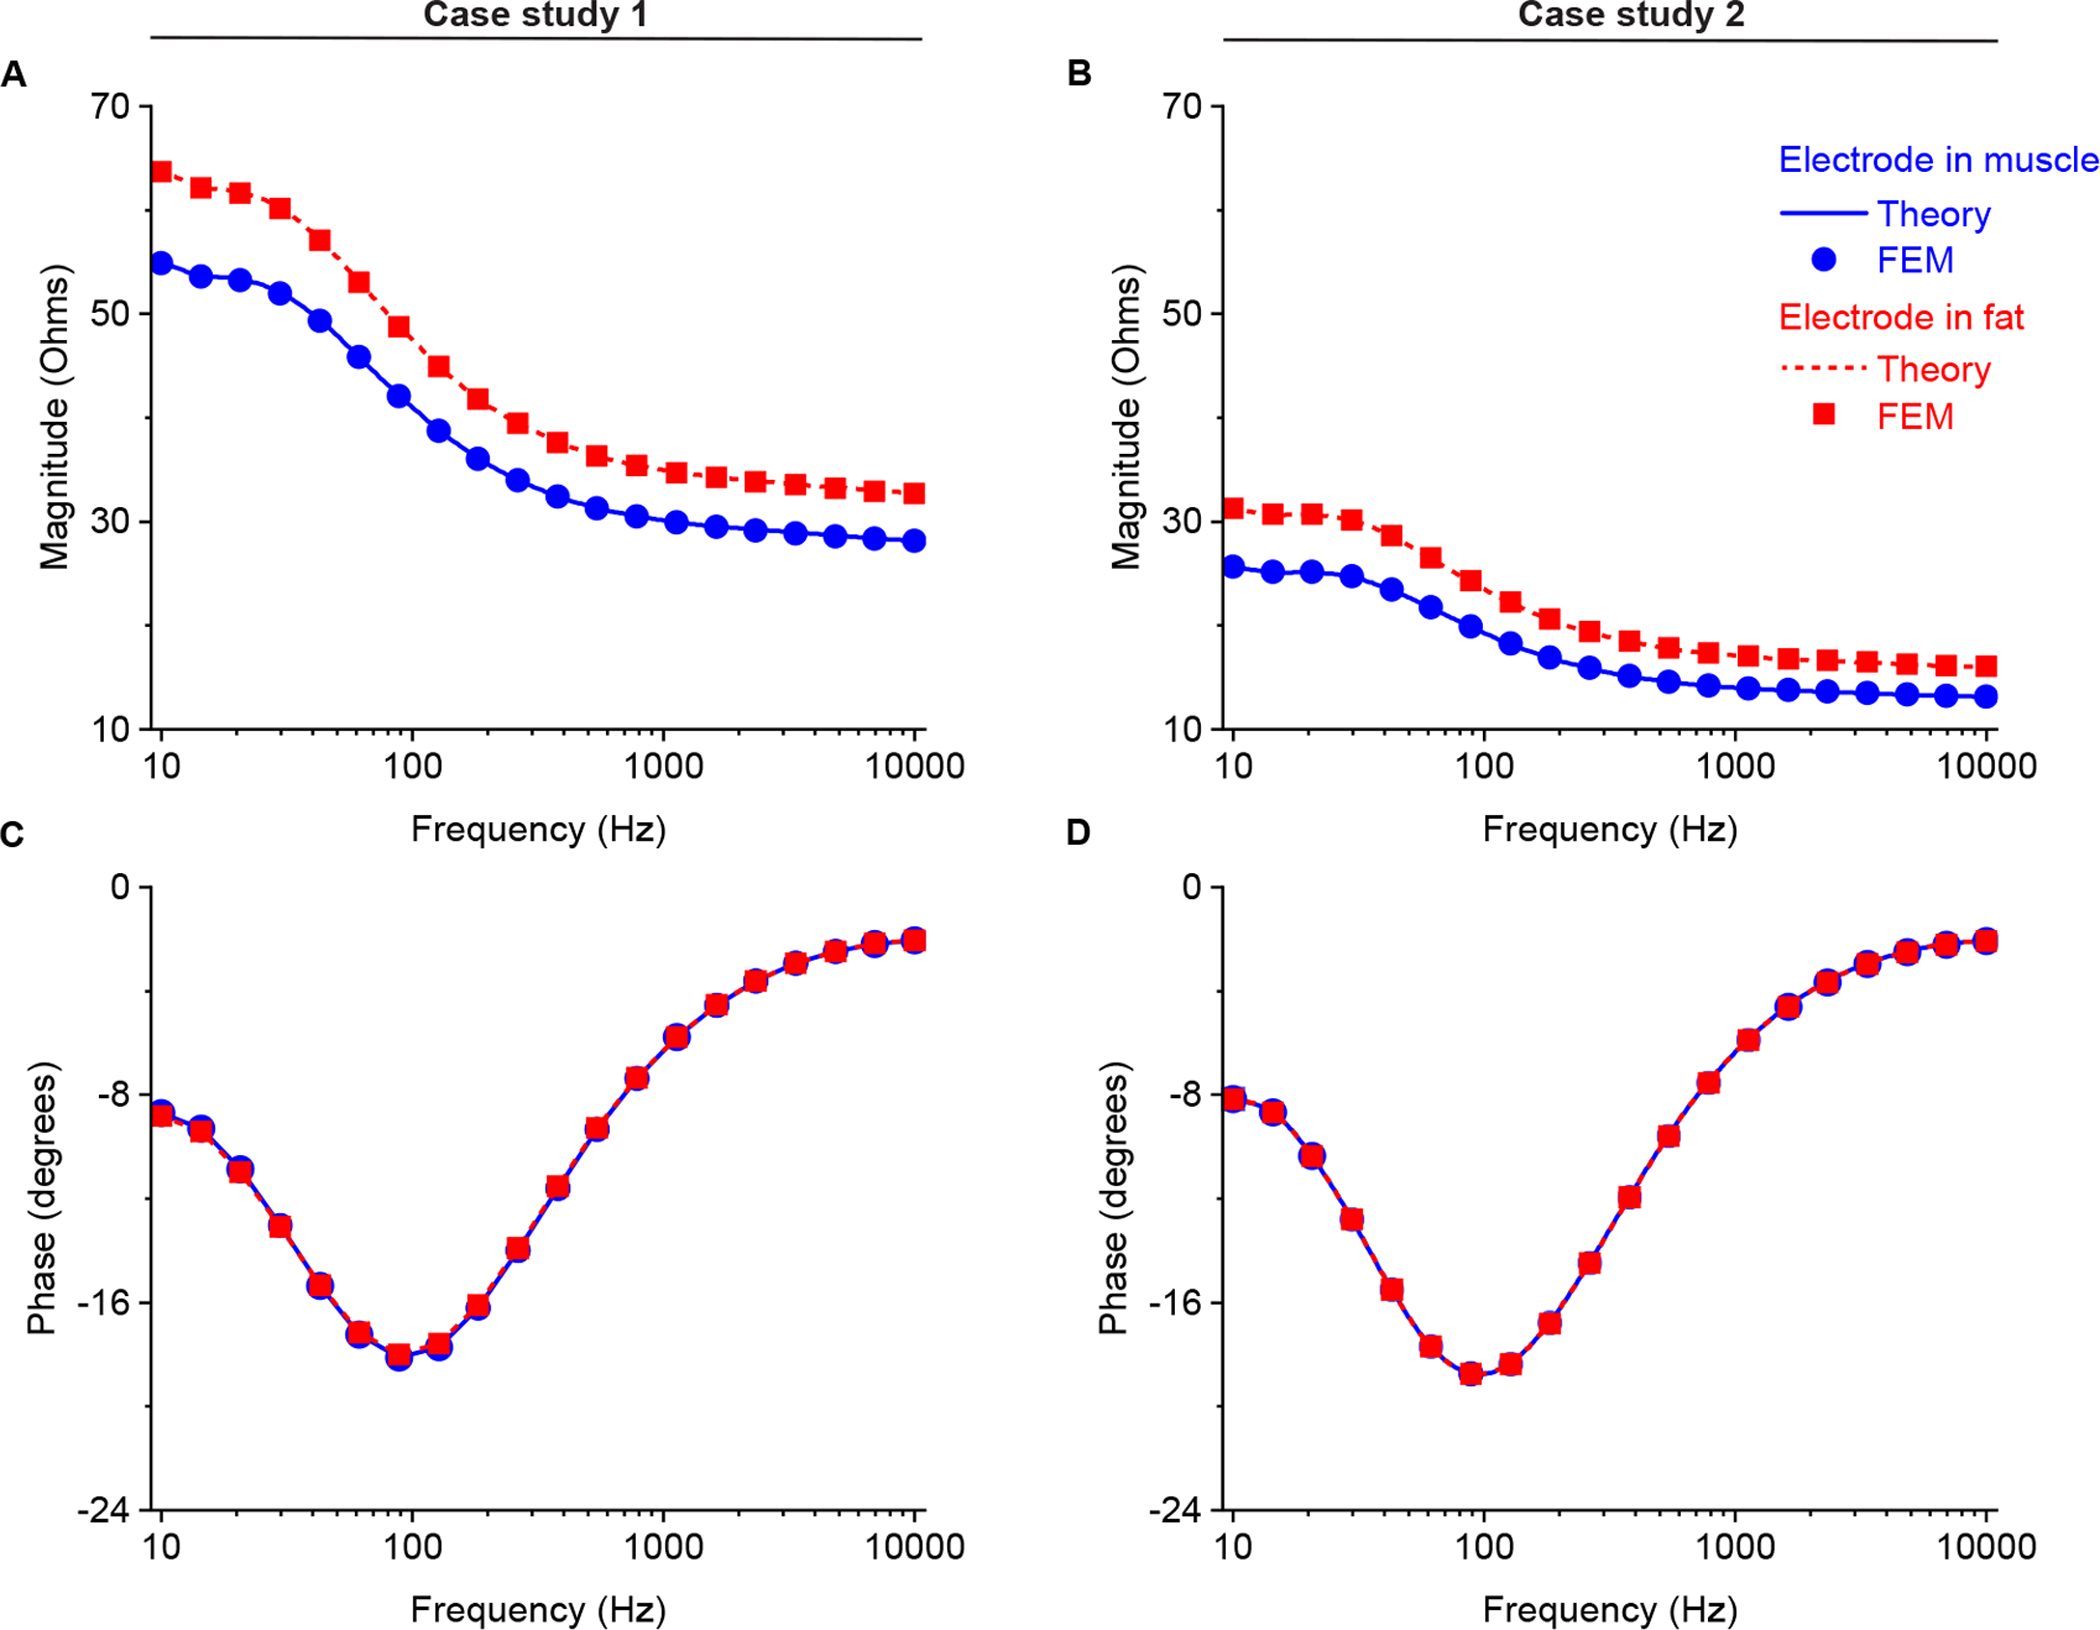
Analytical (solid and dotted lines) and finite element model (circles and squares) magnitude (A and B for case study 1 and 2, respectively) and phase (C and D for case study 1 and 2, respectively) of filter impedance calculated as the ratio of recorded potential to current from 10 Hz to 10 kHz. The potential recording electrode E is considered to be placed in muscle (in blue) and fat (in red). Simulation setting: (8) with geometrical parameters (10) and (12) in the frequency domain. Additional simulation parameters are: hSE = 10 mm, hE = 5 mm, hS = 5 mm, b = 5 mm, RS = 10 mm, θC = 90°, RE = 8 when the electrode is in muscle, RE = 3 mm when the electrode is in fat.
Figure 10 illustrates the transient potential waveform excited by membrane current and recorded at different positions in case studies. The evaluating electrode can be placed in muscle and fat in case study 1 (Figure 10 A and B) and in case study 2 (Figure 10 C and D). respectively. As expected, the waveform amplitude decreases with distance from recording electrode to current source. However, the waveform recorded in muscle attenuates faster than that in fat.
Figure 10.
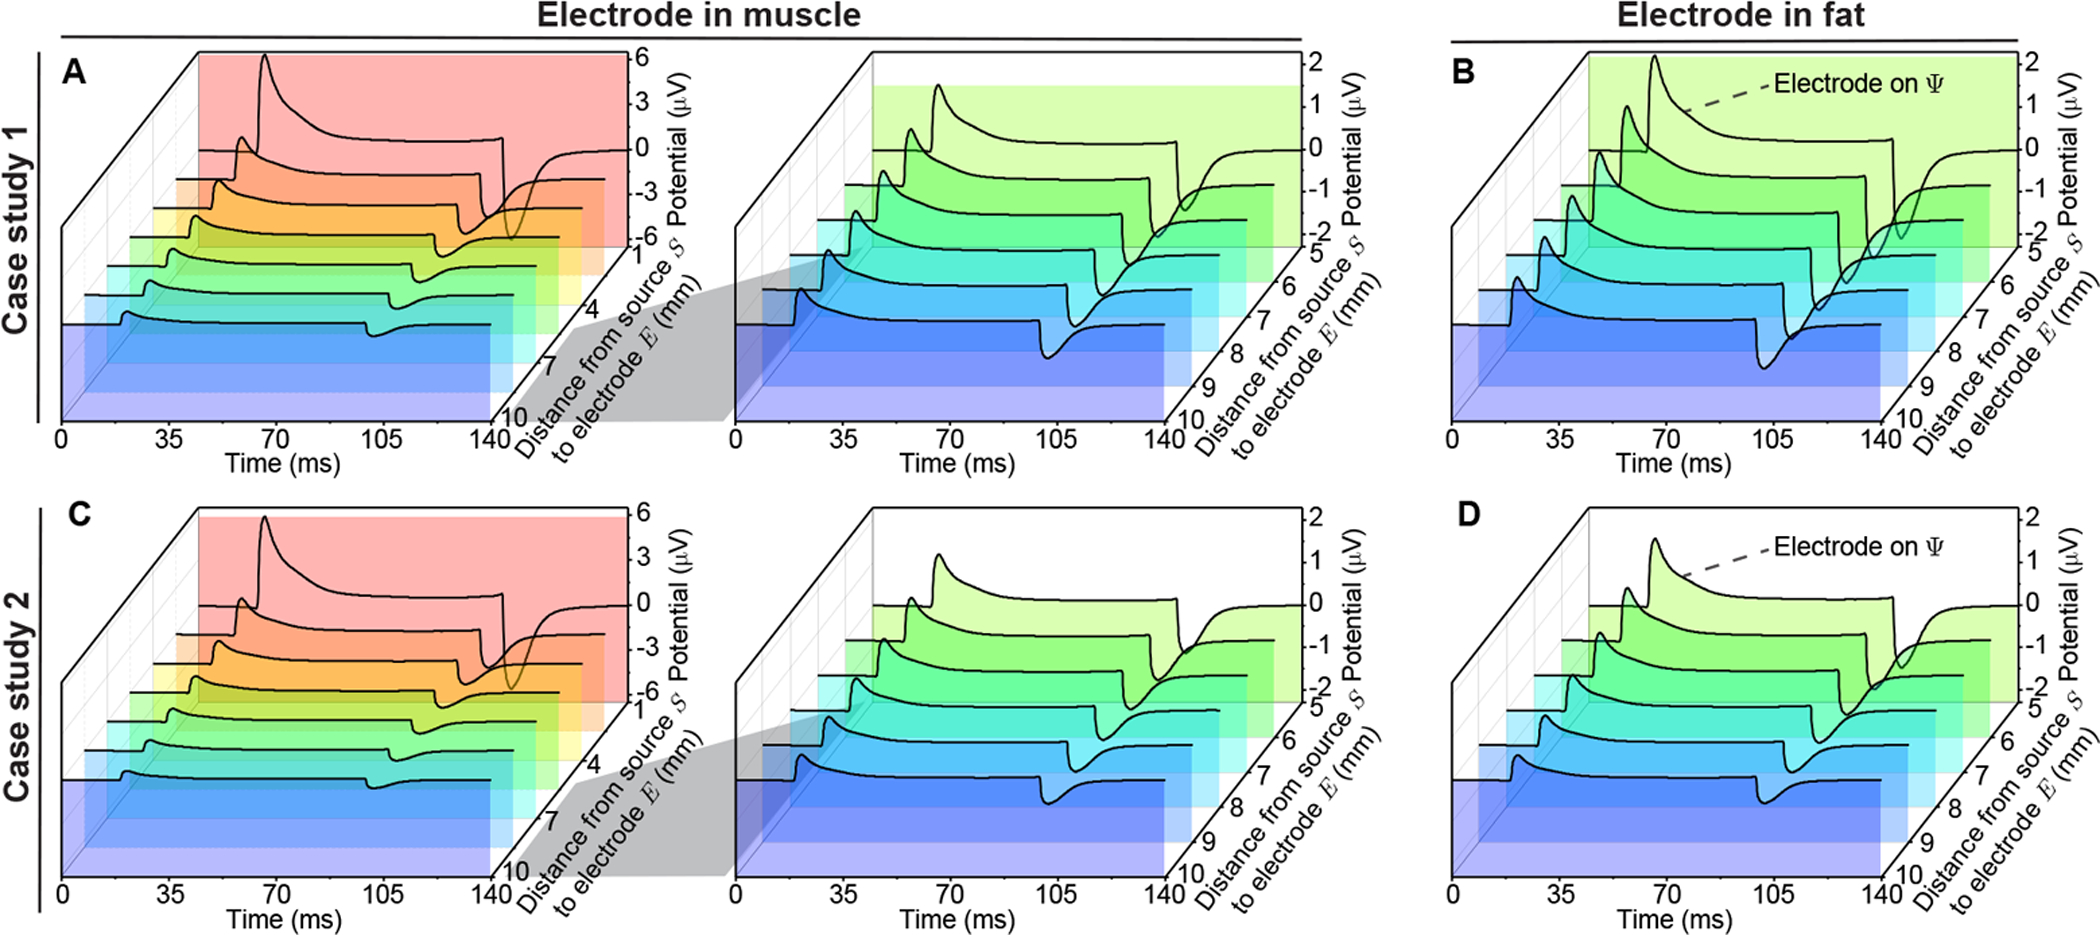
Simulated electrical potential propagation in nonhomogeneous muscle varying the distance from the potential recording electrode E to the current source S. The transmembrane current waveform (see Figure 5 A) is injected at S in case study 1 with the electrode E in muscle and hE = hS + dSE mm (A), also when the electrode E is in fat with hE = dSE − hS (B). In case study 2, the electrode E is in muscle with RE = RS + dSE (C) and fat with RE = RS − dSE (D). Simulation setting: (9) with geometrical parameters (10) and (12) in time domain. Additional simulation parameters: hS = 5 mm, b = 5 mm, RS = 10 mm, θC = 0°.
7. Discussion
This paper provides a framework to model monopolar EMG recordings in a nonhomogeneous conductor volume. The key contribution of our approach is that it is geometrically generic to model a changing distance between the current source and the voltage recording electrode. The framework (6) is based on perturbation theory, where the reflection coefficient Γ acts as the perturbation parameters. We then apply the first order approximation of our model (8) to study the nonhomogeneous potential spatial propagation. We analyzed the electrical potential distribution and confirmed the usefulness of our framework performing numerical and FEM simulations in two simplified cases considering a planar and spherical boundary between muscle and fat. We found the accuracy of our theoretical predictions is dependent on Γ, namely the difference between muscle and fat electrical properties. We validated the accuracy to be ≤ 0.5% even when with tissue properties differing by two orders of magnitude (Sanchez et al. 2020, Nagy et al. 2019) (Supplementary information).
Our work extends the existing scientific knowledge by modeling the effect of changing the distance between current source and electrode affecting LFPs in a nonhomogeneous measurement including the frequency-dependence of both tissues’ electrical properties conductivity and permittivity. There are also several additional observations worth discussing. Of note, if one simplifies the curvature of the boundary between domains to a plane (and neglects the permittivity property), our framework provides the same potential model as the principle of image charges used in (Ness et al. 2015). Also, if one assumes the conductivity is zero and the permittivity equals vacuum permittivity in one of the domains, then our framework equips the reader with the electrical potential distribution within a finite, homogeneous, isotropic, arbitrary volume surrounded by vacuum. In this case, if the boundary surface is a plane, our framework then provides the well known electrical potential in a half space domain.
Our work has several limitations. First, the framework developed assumes the current sources are point-like. In practice, motor unit in skeletal muscle has finite size which can be modeled as a “moving” point (Duchene & Hogrel 2000), line source (Stegeman et al. 2000), curved fiber (Roth & Beaudoin 2003) and other specific geometries (Merletti, Conte, Avignone & Guglielminotti 1999, Merletti, Roy, Kupa, Roatta & Granata 1999, Farina & Merletti 2001). Of note, our framework can be extended to model a line source using multiple discrete point-like sources with delaying waveform to consider the dimension (length) of the muscle fiber. Another limitation is the fact that the size of EMG recording electrode is not considered (Moffitt & McIntyre 2005). Further, the tissues’ electrical properties are assumed to be isotropic, i.e., the same in all directions, whereas muscle is known to be anisotropic. In general, these are spatially-dependent as in the case of fusiform muscle with different values along and perpendicular to the major myofiber direction (Nagy et al. 2019). To account for this simplification in our framework, the anisotropic dependence is calculated in an average sense based on the geometrical mean of longitudinal and transverse electrical properties (Kwon et al. 2017, Kwon, Guasch, Nagy, Rutkove & Sanchez 2019, Kwon, de Morentin, Nagy, Rutkove & Sanchez 2019). Also, our model assumes that the electrical properties do not change within the tissues considered while a more realistic model will also include this spatial dependency. However, to the best of our knowledge, the authors are not aware of any experimental dataset available that has measured the spatial dependence of the electrical properties in diseased muscle. Finally, the framework only contemplates a domain model including two tissues and therefore the number of boundaries is limited to one. We are currently working to circumvent this limitation and extend the framework to model multiple nonhomogeneities with a larger number of tissues within the domain.
Despite these limitations, this work allows the reader to gain physical understanding on volume conduction mechanisms in nonhomogeneous domains affecting monopolar EMG recordings. Here, we have focused mainly on the (passive) volume conduction electrical properties of the bulk of the muscle and the effects on a measured LFPs using an intramuscular electrode. Our results provide some initial insights into how the deposition of fat within the muscle, a common sequela of many neuromuscular disorders, may impact the observed electrical potentials. Modeling a prototypical membrane current waveform, our predictions suggest an increase (amplification) of the recorded voltage. Extending our analyses to include transmembrane current waveforms as seen in neuromuscular disorders is an obvious next step to this initial work.
Supplementary Material
Acknowledgment
This work was funded by the China Scholarship Council grant 201906020024 (XL) and National Institutes of Health grant R41 NS112029-01A1 (BS).
Footnotes
Conflict of interest
Dr. Sanchez holds equity in Haystack Diagnostics, a company that develops clinical needle impedance technology for neuromuscular evaluation. The company has an option to license patented needle impedance technology where the author is named an inventor. He also holds equity and serves as Scientific Advisory Committee Member of Ioniq Sciencies, a company that develops clinical impedance technology for early cancer detection. Dr. Sanchez holds equity and serves as Scientific Advisor To The Board of B-Secur, a company that develops ECG and bioimpedance technology. He consults for Myolex, Inc., a company that develops surface impedance technology. The company has an option to license patented surface EIM technology where the author is named an inventor. Dr. Sanchez also serves as a consultant to Impedimed, a company that develops clinical impedance technology, and Texas Instruments, Happy Health, and Analog Devices, companies that develop impedance technology for consumer use.
8. References
- Blok JH, Stegeman DF & Van Oosterom A 2002. Annals of biomedical engineering 30(4), 566–577. [DOI] [PubMed] [Google Scholar]
- Cohl HS & Tohline JE 1999. The astrophysical journal 527(1), 86. [Google Scholar]
- de Morentin MM, Kwon H, Pulido HVG, Nagy JA, Rutkove SB & Sanchez B 2021. IEEE Transactions on Biomedical Engineering.
- Duchene J & Hogrel JY 2000. IEEE transactions on biomedical engineering 47(2), 192–201. [DOI] [PubMed] [Google Scholar]
- Dumitru D & Delisa JA 1991. Muscle & Nerve: Official Journal of the American Association of Electrodiagnostic Medicine 14(7), 605–624. [DOI] [PubMed] [Google Scholar]
- Farina D & Merletti R 2001. IEEE transactions on biomedical engineering 48(6), 637–646. [DOI] [PubMed] [Google Scholar]
- Fukada S i, Morikawa D, Yamamoto Y, Yoshida T, Sumie N, Yamaguchi M, Ito T, Miyagoe-Suzuki Y, Takeda S, Tsujikawa K et al. 2010. The American journal of pathology 176(5), 2414–2424. [DOI] [PMC free article] [PubMed] [Google Scholar]
- Gabriel S, Lau R & Gabriel C 1996. Physics in medicine & biology 41(11), 2251. [DOI] [PubMed] [Google Scholar]
- He JH 1999. International journal of non-linear mechanics 34(4), 699–708. [Google Scholar]
- Hernández-Ochoa EO & Schneider MF 2012. Progress in biophysics and molecular biology 108(3), 98–118. [DOI] [PMC free article] [PubMed] [Google Scholar]
- Katirji B 2014. in ‘Neuromuscular Disorders in Clinical Practice’ Springer; pp. 3–20. [Google Scholar]
- Kwon H, de Morentin MM, Nagy J, Rutkove S & Sanchez B 2019. Physiological measurement 40(8), 085008. [DOI] [PubMed] [Google Scholar]
- Kwon H, Guasch M, Nagy J, Rutkove S & Sanchez B 2019. Scientific reports 9(1), 1–16. [DOI] [PMC free article] [PubMed] [Google Scholar]
- Kwon H, Nagy J, Taylor R, Rutkove S & Sanchez B 2017. Physics in Medicine & Biology 62(22), 8616. [DOI] [PubMed] [Google Scholar]
- Lowery MM, Stoykov NS, Dewald JP & Kuiken TA 2004. IEEE Transactions on Biomedical Engineering 51(12), 2138–2147. [DOI] [PubMed] [Google Scholar]
- Lowery MM, Stoykov NS, Taflove A & Kuiken TA 2002. IEEE Transactions on Biomedical Engineering 49(5), 446–454. [DOI] [PubMed] [Google Scholar]
- Machida M, Yamada T & Kimura J 1983. Nihon Seikeigeka Gakkai Zasshi 57(3), 271–284. [PubMed] [Google Scholar]
- Maxwell JC 1873. A treatise on electricity and magnetism Oxford: Clarendon Press. [Google Scholar]
- Merletti R, Conte LL, Avignone E & Guglielminotti P 1999. IEEE transactions on biomedical engineering 46(7), 810–820. [DOI] [PubMed] [Google Scholar]
- Merletti R, Roy SH, Kupa E, Roatta S & Granata A 1999. IEEE Transactions on biomedical engineering 46(7), 821–829. [DOI] [PubMed] [Google Scholar]
- Mesin L 2013a. Computers in biology and medicine 43(7), 953–961. [DOI] [PubMed] [Google Scholar]
- Mesin L 2013b. Computers in biology and medicine 43(7), 942–952. [DOI] [PubMed] [Google Scholar]
- Mesin L & Farina D 2004. IEEE transactions on biomedical engineering 51(9), 1521–1529. [DOI] [PubMed] [Google Scholar]
- Miceli S, Ness TV, Einevoll GT & Schubert D 2017. Eneuro 4(1). [DOI] [PMC free article] [PubMed] [Google Scholar]
- Moffitt MA & McIntyre CC 2005. Clinical neurophysiology 116(9), 2240–2250. [DOI] [PubMed] [Google Scholar]
- Nagy J, DiDonato C, Rutkove S & Sanchez B 2019. Scientific data 6(1), 1–11. [DOI] [PMC free article] [PubMed] [Google Scholar]
- Ness TV, Chintaluri C, Potworowski J, Łęski S, Głąbska H, Wójcik DK & Einevoll GT 2015. Neuroinformatics 13(4), 403–426. [DOI] [PMC free article] [PubMed] [Google Scholar]
- Roth BJ & Beaudoin DL 2003. Physical Review E 67(5), 051925. [DOI] [PubMed] [Google Scholar]
- Sanchez B, Martinsen OG, Freeborn TJ & Furse CM 2020. Clinical Neurophysiology. [DOI] [PMC free article] [PubMed]
- Sanchez B & Rutkove SB 2017. Neurotherapeutics 14(1), 107–118. [DOI] [PMC free article] [PubMed] [Google Scholar]
- Stegeman DF, Blok JH, Hermens HJ & Roeleveld K 2000. Journal of Electromyography and Kinesiology 10(5), 313–326. [DOI] [PubMed] [Google Scholar]
- Wazwaz AM 2007. Computers & Mathematics with Applications 54(7–8), 926–932. [Google Scholar]
- Yamada T, Machida M & Kimura J 1982. Neurology 32(10), 1151–1151. [DOI] [PubMed] [Google Scholar]
Associated Data
This section collects any data citations, data availability statements, or supplementary materials included in this article.


