

Abstract
Objective
Electrocorticography (ECoG) based Brain-Computer Interfaces (BCIs) can be used to restore communication in individuals with locked-in syndrome. In motor-based BCIs, the number of degrees-of-freedom, and thus the speed of the BCI, directly depends on the number of classes that can be discriminated from the neural activity in the sensorimotor cortex. When considering minimally invasive BCI implants, the size of the subdural ECoG implant must be minimized without compromising the number of degrees-of-freedom.
Approach
Here we investigated if four hand gestures could be decoded using a single ECoG strip of four consecutive electrodes spaced 1 cm apart and compared the performance between a unipolar and a bipolar montage. For that we collected data of seven individuals with intractable epilepsy implanted with ECoG grids, covering the hand region of the sensorimotor cortex. Based on the implanted grids, we generated virtual ECoG strips and compared the decoding accuracy between 1) a single unipolar electrode (Unipolar Electrode), 2) a combination of 4 unipolar electrodes (Unipolar Strip), 3) a single bipolar pair (Bipolar Pair) and 4) a combination of 6 bipolar pairs (Bipolar Strip).
Main Results
We show that four hand gestures can be equally well decoded using ‘Unipolar Strips’ (mean 67.4 ± 11.7%), ‘Bipolar Strips’ (mean 66.6 ± 12.1%) and ‘Bipolar Pairs’ (mean 67.6 ± 9.4%), while ‘Unipolar Electrodes’ (61.6 ± 5.9%) performed significantly worse compared to ‘Unipolar Strips’ and ‘Bipolar Pairs’.
Significance
We conclude that a single bipolar pair is a potential candidate for minimally invasive motor-based BCIs and encourage the use of ECoG as a robust and reliable BCI platform for multi-class movement decoding.
Keywords: brain-computer interface, minimally invasive, electrocorticography, bipolar, unipolar, sign language
1. Introduction
Fully implantable electrocorticography (ECoG)-based Brain-Computer Interfaces (BCIs) are a promising solution to restore communication of individuals with severe paralysis and associated communication problems (Benabid et al., 2019; Matsushita et al., 2018; Rouanne, Śliwowski, Costecalde, Benabid, & Aksenova, 2021; Vansteensel et al., 2016; for a review see Miller, Hermes, & Staff, 2020). While many potential users show a strong interest in implantable BCIs, full user acceptance relies on factors such as the risks associated with surgery (e.g., Blabe et al., 2015; Lahr et al., 2015) and the usability aspects of the device, including speed and reliability of control (e.g., Blabe et al., 2015; Huggins, Moinuddin, Chiodo, & Wren, 2015; Huggins, Wren, & Gruis, 2011; Lahr et al., 2015). Interestingly, improvements in some of these factors can be difficult to combine. To minimize the surgical risk of ECoG-BCIs, for example, small electrode arrays, such as electrode strips could be a preferred option. Indeed, electrode strips have been associated with low complication risk (Behrens, Schramm, Zentner, & König, 1997; Rydenhag & Silander, 2001), likely because surgical placement on the cortex can be performed using burr-holes rather than the large craniotomies required for ECoG grid implantation (e.g., Voorhies & Cohen-Gadol, 2013). In earlier work, electrode strips have allowed for accurate and stable, albeit slow, BCI-based communication for home-use (Vansteensel et al., 2016). Studies aiming at a higher communication speed with ECoG, on the other hand, typically involve multiple degrees of freedom and a large number of implanted grid electrodes (Bleichner et al., 2016; Branco et al., 2017; Herff et al., 2015; Leonard, Lucas, Blau, Corina, & Chang, 2020; Mercier et al., 2017; Rabbani, Milsap, & Crone, 2019; Ramsey et al., 2018; Salari et al., 2019).
With the intent to design multi-degrees-of-freedom BCIs based on a limited number of implanted electrodes, several groups have investigated the minimum number of electrodes required for accurate decoding of, for example, multiple arm movements (Milekovic et al., 2012), visual stimuli (Zhang et al., 2013), mouth articulators and tongue movements (Salari et al., 2019) and hand gestures (Li et al., 2017). The above studies provide evidence for the feasibility of multi-class decoding using a very limited number of electrodes. However, the pre-processing steps in these studies required the availability of additional electrodes for referencing (for example for common-average referencing), which is contradictory to the intent of a minimally invasive BCI. To allow for decoding of BCI signals obtained with minimally invasive electrode strips, the signal of proximal electrodes can be subtracted (bipolar referencing) for decoding, thereby eliminating the need for a common-average signal with additional electrodes. To our knowledge, it is currently unknown to what extent multiple degrees-of-freedom can be decoded using a single, or a limited number of, bipolar channel(s) from a small ECoG strip.
Here we investigated to what extent a single ECoG strip of four electrodes spaced 1 cm apart can be used to decode multiple classes and compared unipolar referencing (standard common-average involving many electrodes) and bipolar referencing. For that we employed a well-described strategy of decoding four hand gestures from the American sign language alphabet from the hand region of the sensorimotor cortex (Bleichner et al., 2016; Branco et al., 2017). In particular, we compared the decoding performance between four channel-selection schemes applied to a set of virtual four-electrode strips: 1) a single electrode within a strip (Unipolar Electrode), 2) the combination of all four electrodes within a strip (Unipolar Strip), 3) a single bipolar pair within a strip (Bipolar Pair) and 4) the combination of all six bipolar pairs within a strip (Bipolar Strip). The ‘Bipolar Pair’ scheme was additionally compared to a control scheme that combines all unipolar electrodes over the sensorimotor cortex. Lastly, we examined which positions and orientations of virtual strips in our dataset led to the best performance. The results of our study are of relevance for future implantations aimed at extracting multiple degrees-of-freedom from the sensorimotor hand area.
2. Materials and Methods
2.1. Participants
In this study we included seven individuals with epilepsy (mean age 28; Table 1). The participants were implanted with subdural ECoG grids and strips (inter-electrode distance 1 cm center-to-center and 2.3 mm exposed surface; Ad-Tech, Racine, USA) to localize the origin epilepsy. They agreed to participate in this study and signed informed consent according to the Declaration of Helsinki (2013). The study was approved by the Medical Ethical Committee of the University Medical Center Utrecht.
Table 1.
Participant characteristics and number of included channels. M - Male; F - Female; L - Left; R – Right.
| P1 | P2 | P3 | P4 | P5 | P6 | P7 | |
|---|---|---|---|---|---|---|---|
| Age | 24 | 26 | 35 | 29 | 38 | 23 | 24 |
| Gender | M | M | F | M | F | M | M |
| Handedness | R | R | R | R | R | R | R |
| Hemisphere implant | L | L | L | L | R | R | R |
| Fronto-centro-parietal (leg) L | Fronto-central L | Frontal L | Fronto-polar L | Central Sulcus (hand) R | Medial sensorimotor (leg and foot) R | Dorsal sensorimotor (arm and hand) R |
The ECoG grids and strips fully or partially covered the hand region of the sensorimotor cortex. The exact location and number of electrodes differed per participant (Figure 1) and depended on the clinical plan to determine the epileptic seizure onset location. Electrodes were localized with a procedure described in Hermes et al. (2010) and Branco et al. (2018), where a post-implantation Computerized Tomography (CT) scan (Philips Tomoscan SR7000, Best, the Netherlands) is co-registered with a pre-implantation T1-weighted anatomical magnetic resonance imaging (MRI) scan (Philips 3T Ingenia or 7T Achieva, Best, the Netherlands; 1 mm isotropic), and displayed on a Freesurfer pial surface (recon-all, http://surfer.nmr.mgh.harvard.edu/).
Figure 1 |.
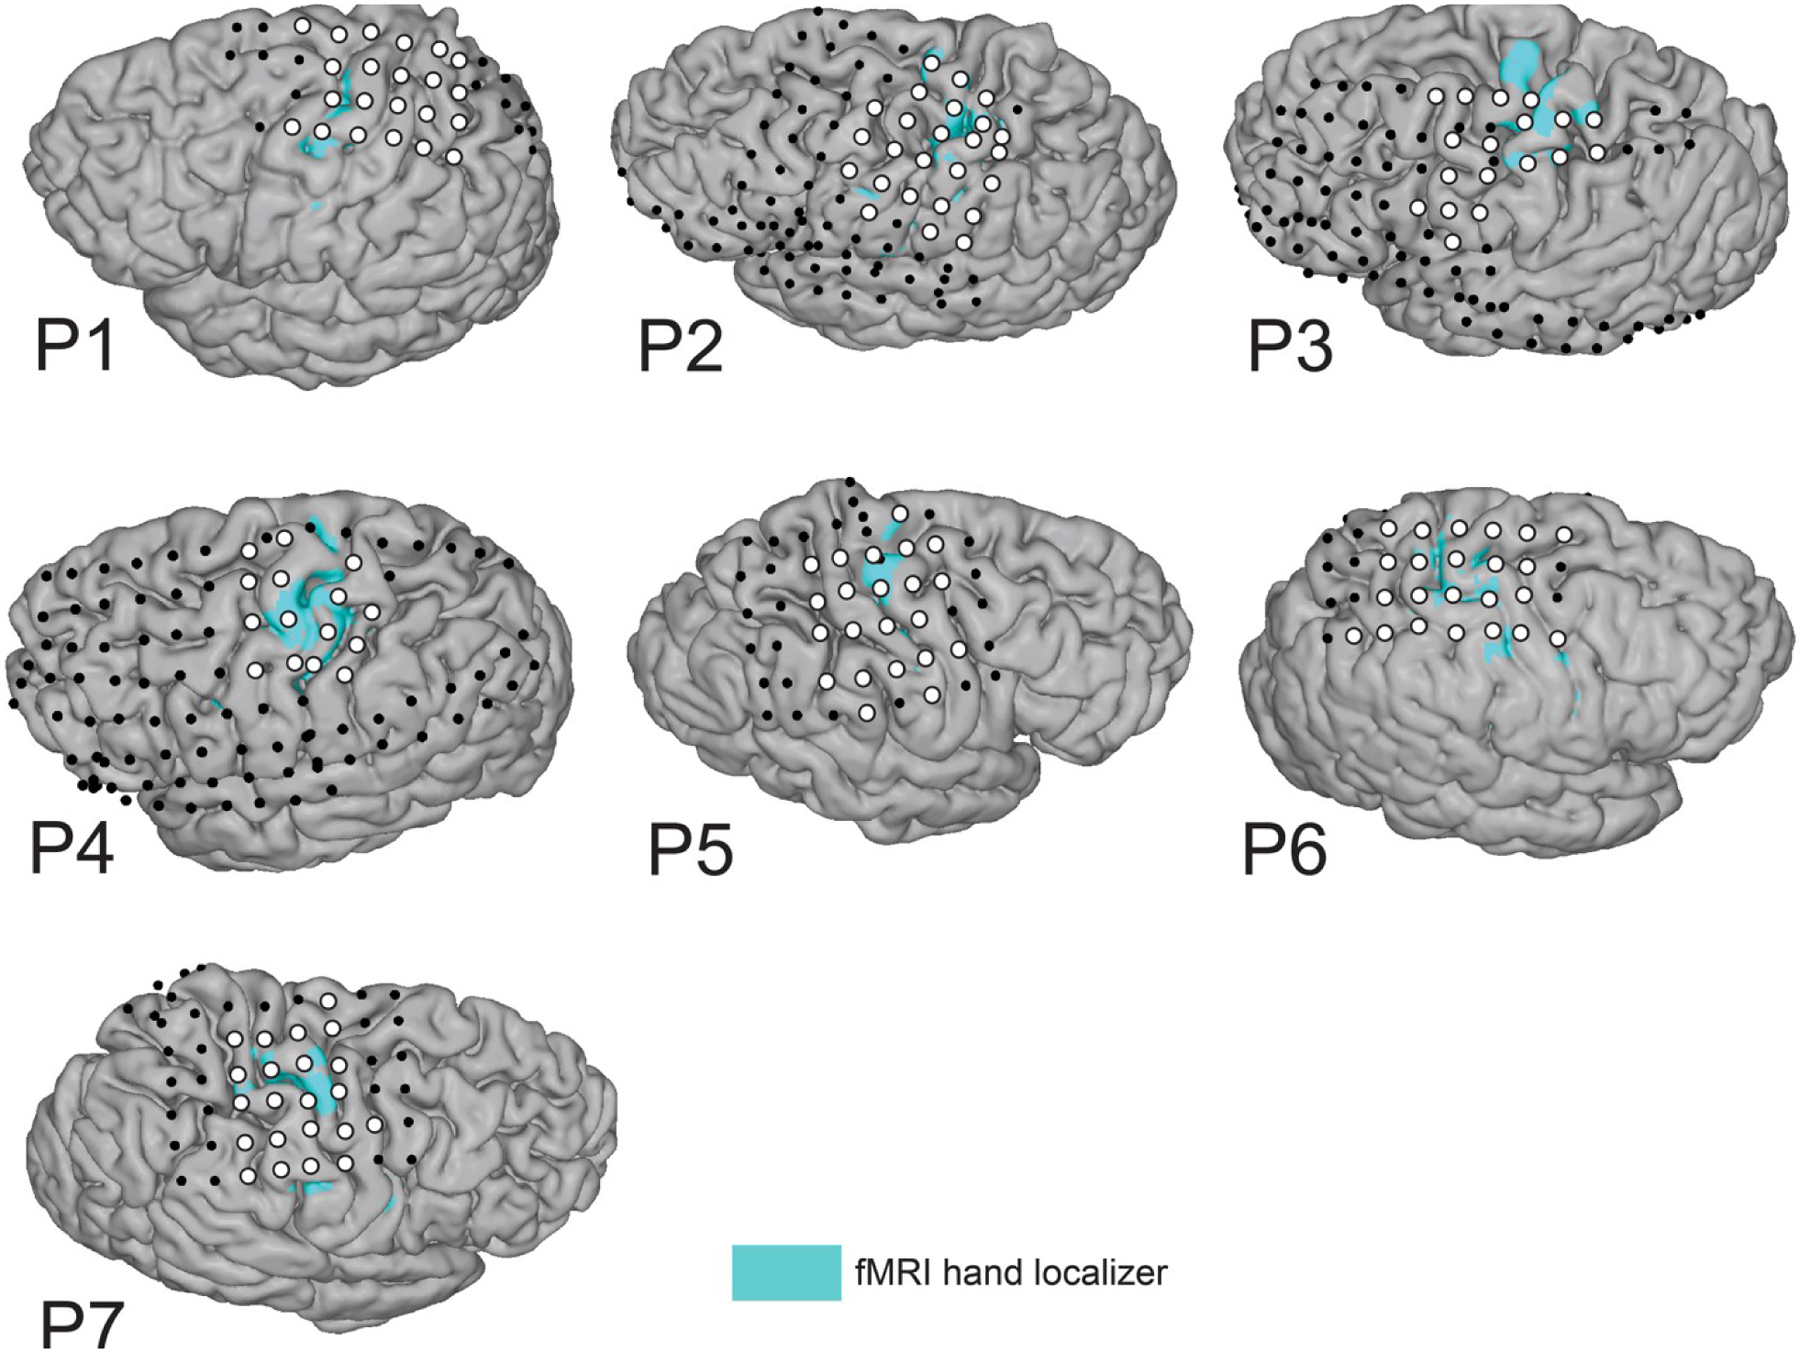
Electrode selection. Position of implanted electrodes of all individual participants, overlayed on the participant’s anatomical T1-weighted scan and the fMRI activity pattern of the course finger-tapping movement (blue areas; t > 5–16). White circles indicate electrodes of interest included in one or more of the virtual electrode strips, whereas black circles indicate other implanted electrodes that were included in the common-average re-reference associated with the ‘Unipolar’ selection schemes. Of note, P1 and P3-P7 also had interhemispheric electrodes (included in CAR) that are not visualized here.
2.2. Task
The participants performed a hand gestures task previously described in two former studies from our group (Bleichner et al., 2016; Branco et al., 2017). The task involved making four different hand gestures that represent the letters ‘D’, ‘F’, ‘V’ and ‘Y’ of the American Sign Language finger alphabet and holding the respective positions (total trial duration of 5.5s). Participants were asked to copy the gesture presented on the screen with the hand contralateral to their ECoG grid implantation. Gesture trials (N=10 per gesture) were presented in random order and alternated with rest periods in which participants’ hands were in a relaxed open position for 6.5s. One participant (P6) performed a modified faster version of the task in which the trial duration was reduced to 3s. Two participants (P4 and P7) completed two runs of the same task. A data glove (5DT Inc., Irvine, USA) was used to record and evaluate the participants’ performance (Figure 2B). Incorrect, inconsistent, or missed trials (i.e., moving incorrect fingers, performing a different gesture or correcting the gesture during the trial) were excluded from the analysis based on the data glove traces and video recordings of the hand (Supplementary Table 1).
Figure 2 |. Task description and channel selection scheme.
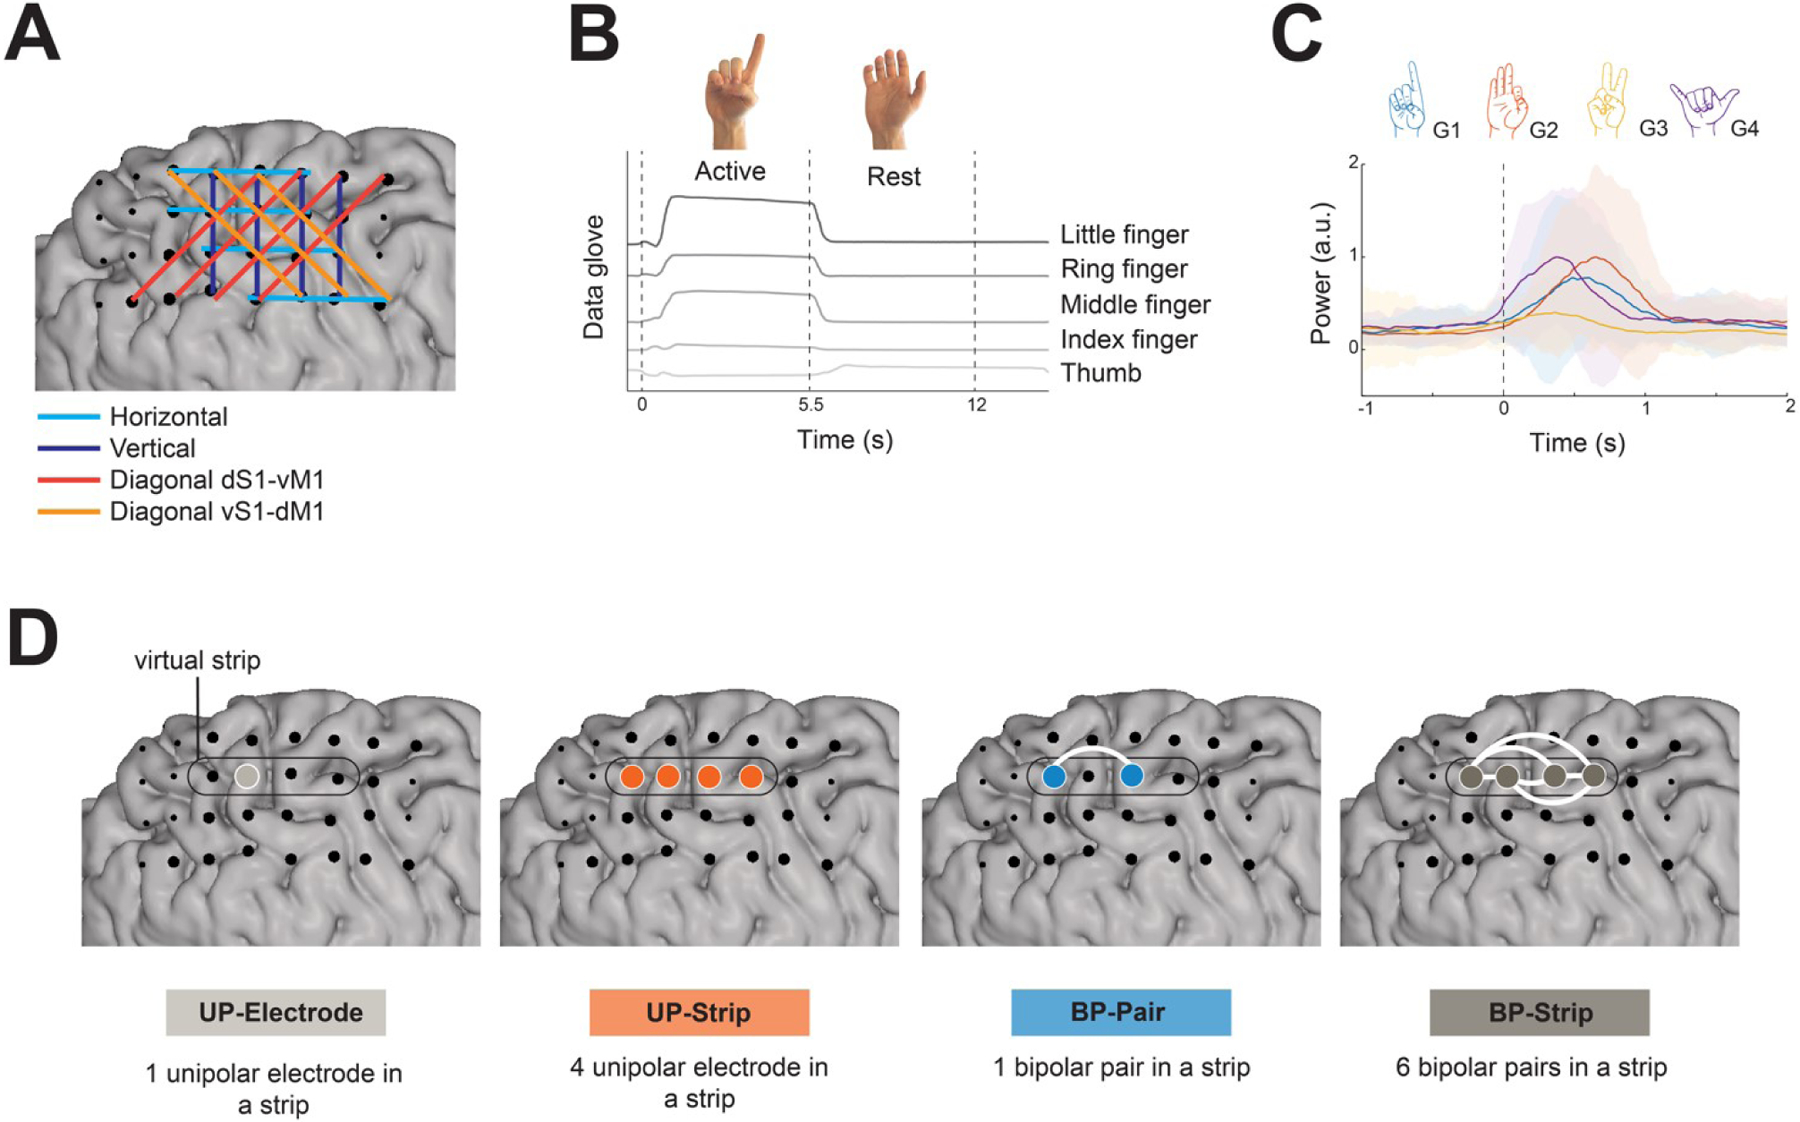
A) Example of the strip definition and channel selection method. B) A representative data glove trace of an active trial of the gesture ‘D’ and subsequent rest trial. C) The mean power amplitude (60–130 Hz; arbitrary units, a.u.) over trials per gesture of one representative channel of P4, centered on movement onset (t = 0s). The standard deviation across trials is represented by the shaded region with colors corresponding to the respective gesture (G1 = ‘D’; G2 = ‘F’; G3 = ‘V’; G4 = ‘Y’). D) Channel selection schemes. ‘Unipolar electrode’ consists of a single electrode within a strip. ‘Unipolar strip’ consists of four electrodes within a strip. ‘Bipolar Pair’ consists of a single bipolar pair within a strip. ‘Bipolar strip’ consists of the combination of six bipolar pairs within a strip. Example of a virtual strip is delineated by the black line. The white lines indicate the bipolar referencing, that is the subtraction between electrodes. Large black circles correspond to all the electrodes included in the four schemes. UP – unipolar; BP- Bipolar.
2.3. Movement onset detection
Movement onset per trial was detected using the data glove recordings. The traces were z-scored and plotted together along with a cue for every trial. In each trial, the sample corresponding to the first finger movement (visible deviation from previous baseline period) was manually marked as the movement onset. The movement onsets were identified by one of the authors (MV) and validated by another author (MPB).
2.4. Channel selection
In order to select the electrodes of interest, the hand knob region of the sensorimotor cortex was identified for each participant based on their anatomical scan and the functional localization of the hand region using pre-existing functional MRI data acquired at a 3 Tesla (P2-P7; 4mm isotropic and repetition time 22.5ms) or 7 Tesla (P1; 1mm isotropic and repetition time 850ms) MRI scanners (see also Figure 1). The fMRI tasks consisted of coarse finger-tapping movements of the hand contralateral to the grid implantation. The fMRI data were analyzed using SPM8 or SPM12 (Wellcome Trust Centre for Neuroimaging, London, United Kingdom). Processing steps included re-alignment to the mean functional scan, co-registration of the functional images to the individual anatomical scan and the computation of threshold maps (t-maps) for the contrast ‘move > rest’ using a general linear model. The fMRI activity maps (t > 5–16) were visualized on the individual anatomical scans along with the position of implanted electrodes (Figure 1).
Virtual strips of four neighboring electrodes were manually defined over the hand knob region. The strips were drawn in vertical, horizontal and diagonal (from the dorsal postcentral gyrus to the ventral precentral gyrus and vice-versa) orientations (Figure 2A). For data analysis we used four different channel selection schemes (Figure 2D), all involving the virtual electrode strips over the sensorimotor cortex: 1) a single electrode within a strip (Unipolar Electrode), 2) four electrodes within a strip (Unipolar Strip), 3) a single bipolar pair within a strip (Bipolar Pair) and 4) the combination of six bipolar pairs within a strip (Bipolar Strip). The total number of channels used in the ‘Unipolar Electrode’ scheme comprised the combination of all the electrodes that were defined by the virtual strips (represented as large white circles in Figure 1; Table 2). A ‘Bipolar Pair’ was defined as the subtraction of two electrodes within one strip (6 possible bipolar pairs per strip).
Table 2.
Total number of virtually defined strips, total number of single electrodes and total number of bipolar pairs within the virtual strips that are included in the analysis. CAR - common-average re-referencing.
| P1 | P2 | P3 | P4 | P5 | P6 | P7 | |
|---|---|---|---|---|---|---|---|
| Number of strips | 16 | 17 | 9 | 8 | 13 | 14 | 12 |
| Number of unipolar electrodes | 22 | 25 | 18 | 15 | 22 | 23 | 22 |
| Number of bipolar pairs | 81 | 96 | 48 | 45 | 78 | 84 | 66 |
| Number of electrodes for CAR | 52 | 95 | 100 | 120 | 56 | 48 | 63 |
2.5. Preprocessing and feature extraction
The ECoG signals were recorded using a 128-channel 22-bit Micromed system (Treviso, Italy) with a hardware band-pass filter of 0.15–134.4 Hz and a sampling frequency of 512 Hz (P1-P4; P6; P7) or 2048 Hz (P5). Data recorded at 2048 Hz was downsampled to 512 Hz to speed up the analysis. The data was analyzed offline using MATLAB® (MathWorks Inc.) and the FieldTrip toolbox (Oostenveld, Fries, Maris, & Schoffelen, 2011). Channels with excessive line-noise or atypical noise content (as assessed using visual inspection by comparing the signal amplitude across channels) were excluded from the analysis. The preprocessing steps were as follows: 1) a notch-filter was applied to exclude 50 and 100 Hz line noise; 2) the data were re-referenced using the common-average reference (CAR, for the ‘Unipolar’ schemes) of all implanted electrodes not excluded from the analysis (Figure 1; Table 2) or using a bipolar montage with another electrode within the same strip (for the Bipolar schemes; see Section 2.4); 3) all trials were aligned to the movement onset (see Section 2.3). Subsequently, the high frequency band power (60–130 Hz; HFB) was extracted for each trial using the Gabor wavelet (as implemented in the FieldTrip toolbox). We focused on the broadband HFB range as it has been shown to be temporally- and spatially-locked to the execution of hand gestures (Bleichner et al., 2016; Branco et al., 2017). Power was extracted with a time window of −1 to 2 seconds relative to movement onset (Figure 2C). This resulted in a three-dimensional feature matrix (trials × channels × time) as the feature space for gesture decoding. Depending on the scheme, ‘channels’ represented either ‘Unipolar Electrodes’ (N=1 electrode within a strip), ‘Unipolar Strips’ (combination of N=4 single electrodes within a strip), ‘Bipolar Pairs’ (N=1 bipolar pair within a strip) or ‘Bipolar Strips’ (combination of N=6 bipolar pairs within a strip).
2.6. Classification
The gestures were classified using temporal template matching in a leave-one-out cross-validation scheme (Bleichner et al., 2016; Branco et al., 2017; Ramsey et al., 2018; Salari et al., 2019). A template was computed for each gesture by averaging over trials, leaving out the to-be-classified trial. The trial was compared with each gesture template using Euclidian distance. The trial was labeled as the gesture (template) with the smallest comparative distance across all time-points (winner-takes all approach). This method was repeated for each trial and computed for all four schemes (see section 2.4). The accuracy for each channel (see section 2.5) within the schemes was calculated as the percentage of trials classified correctly. The channel with the highest accuracy score per participant and scheme (defined as the 100th percentile across channels) was used to compare the accuracies across participants and schemes. Confusion-matrices were computed for the single or first run per participant and subsequently averaged across participants. The difference between the accuracy scores of the four schemes were tested with a one-way repeated-measures ANOVA.
Due to the low and imbalanced number of trials per gesture, the theoretical accuracy chance level cannot be assumed. We used permutation tests to compute an empirical chance level (Combrisson & Jerbi, 2015; Nichols & Holmes, 2003). The feature spaces of the four schemes for the first run of each participant were shuffled using random permutations, such that the label of each trial was randomized. This new feature space was fed into the classifier and the accuracy was calculated as usual. An average accuracy score per scheme was computed and saved 10,000 times. Finally, the mean accuracies and 95th percentiles were computed from the resulting distributions per participant (Supplementary Table 2). The highest value across participants (25%) was taken as the empirical chance level. Individual significance levels (95th percentiles) are reported where appropriate.
2.7. Repetition analysis
Two participants performed two runs of the same task (P4 and P7). This allowed us to assess the consistency of the classifier across repetitions of the same task. For that, run 2 was classified using the template of run 1 and vice-versa.
2.8. Optimal localization and orientation
The optimal localization and orientation of the strips was assessed by comparing the positions of the ‘Bipolar Pairs’ and ‘Bipolar Strips’ across participants, as these can be directly applied in minimally invasive implantable ECoG-BCIs. The results were visualized on the individual participant’s brains (for location) and on a standard brain (for orientation), the latter for which the electrode positions per participant were converted to the Montreal Neurological Institute (MNI) space (from SPM12 toolbox).
2.9. Comparison with spatial-temporal classifier
As a control condition, we additionally investigated how the results compared to those of a method using a combination of spatial and temporal features for classification (Branco et al., 2017; Ramsey et al., 2018). We concatenated all electrodes in the ‘Unipolar Electrode’ feature space to create a new spatial-temporal feature space, with spatial features covering the hand region of the sensorimotor cortex (Figure 1A; Table 1). This feature space was fed into the template-matching classifier described in section 2.6. Here we also applied a leave-one-out cross-validation scheme.
3. Results
3.1. Classification accuracies
Results show that, on average, more than 66% of the channels (i.e., single electrodes for ‘Unipolar Electrodes’, strips of 4 electrodes for ‘Unipolar Strips’, single bipolar pairs for ‘Bipolar Pairs’, and strips of 6 bipolar pairs for ‘Bipolar Strips’) per scheme showed a classification score significantly above chance level (see Figure 3A for a representative participant; and Supplementary Table 2 and 3 for individual chance levels and percentage of channels above chance level per scheme, respectively). Furthermore, multiple channels resulted in similarly high accuracies (see Supplementary Table 4 for scores within and above the 90th percentile).
Figure 3 |.
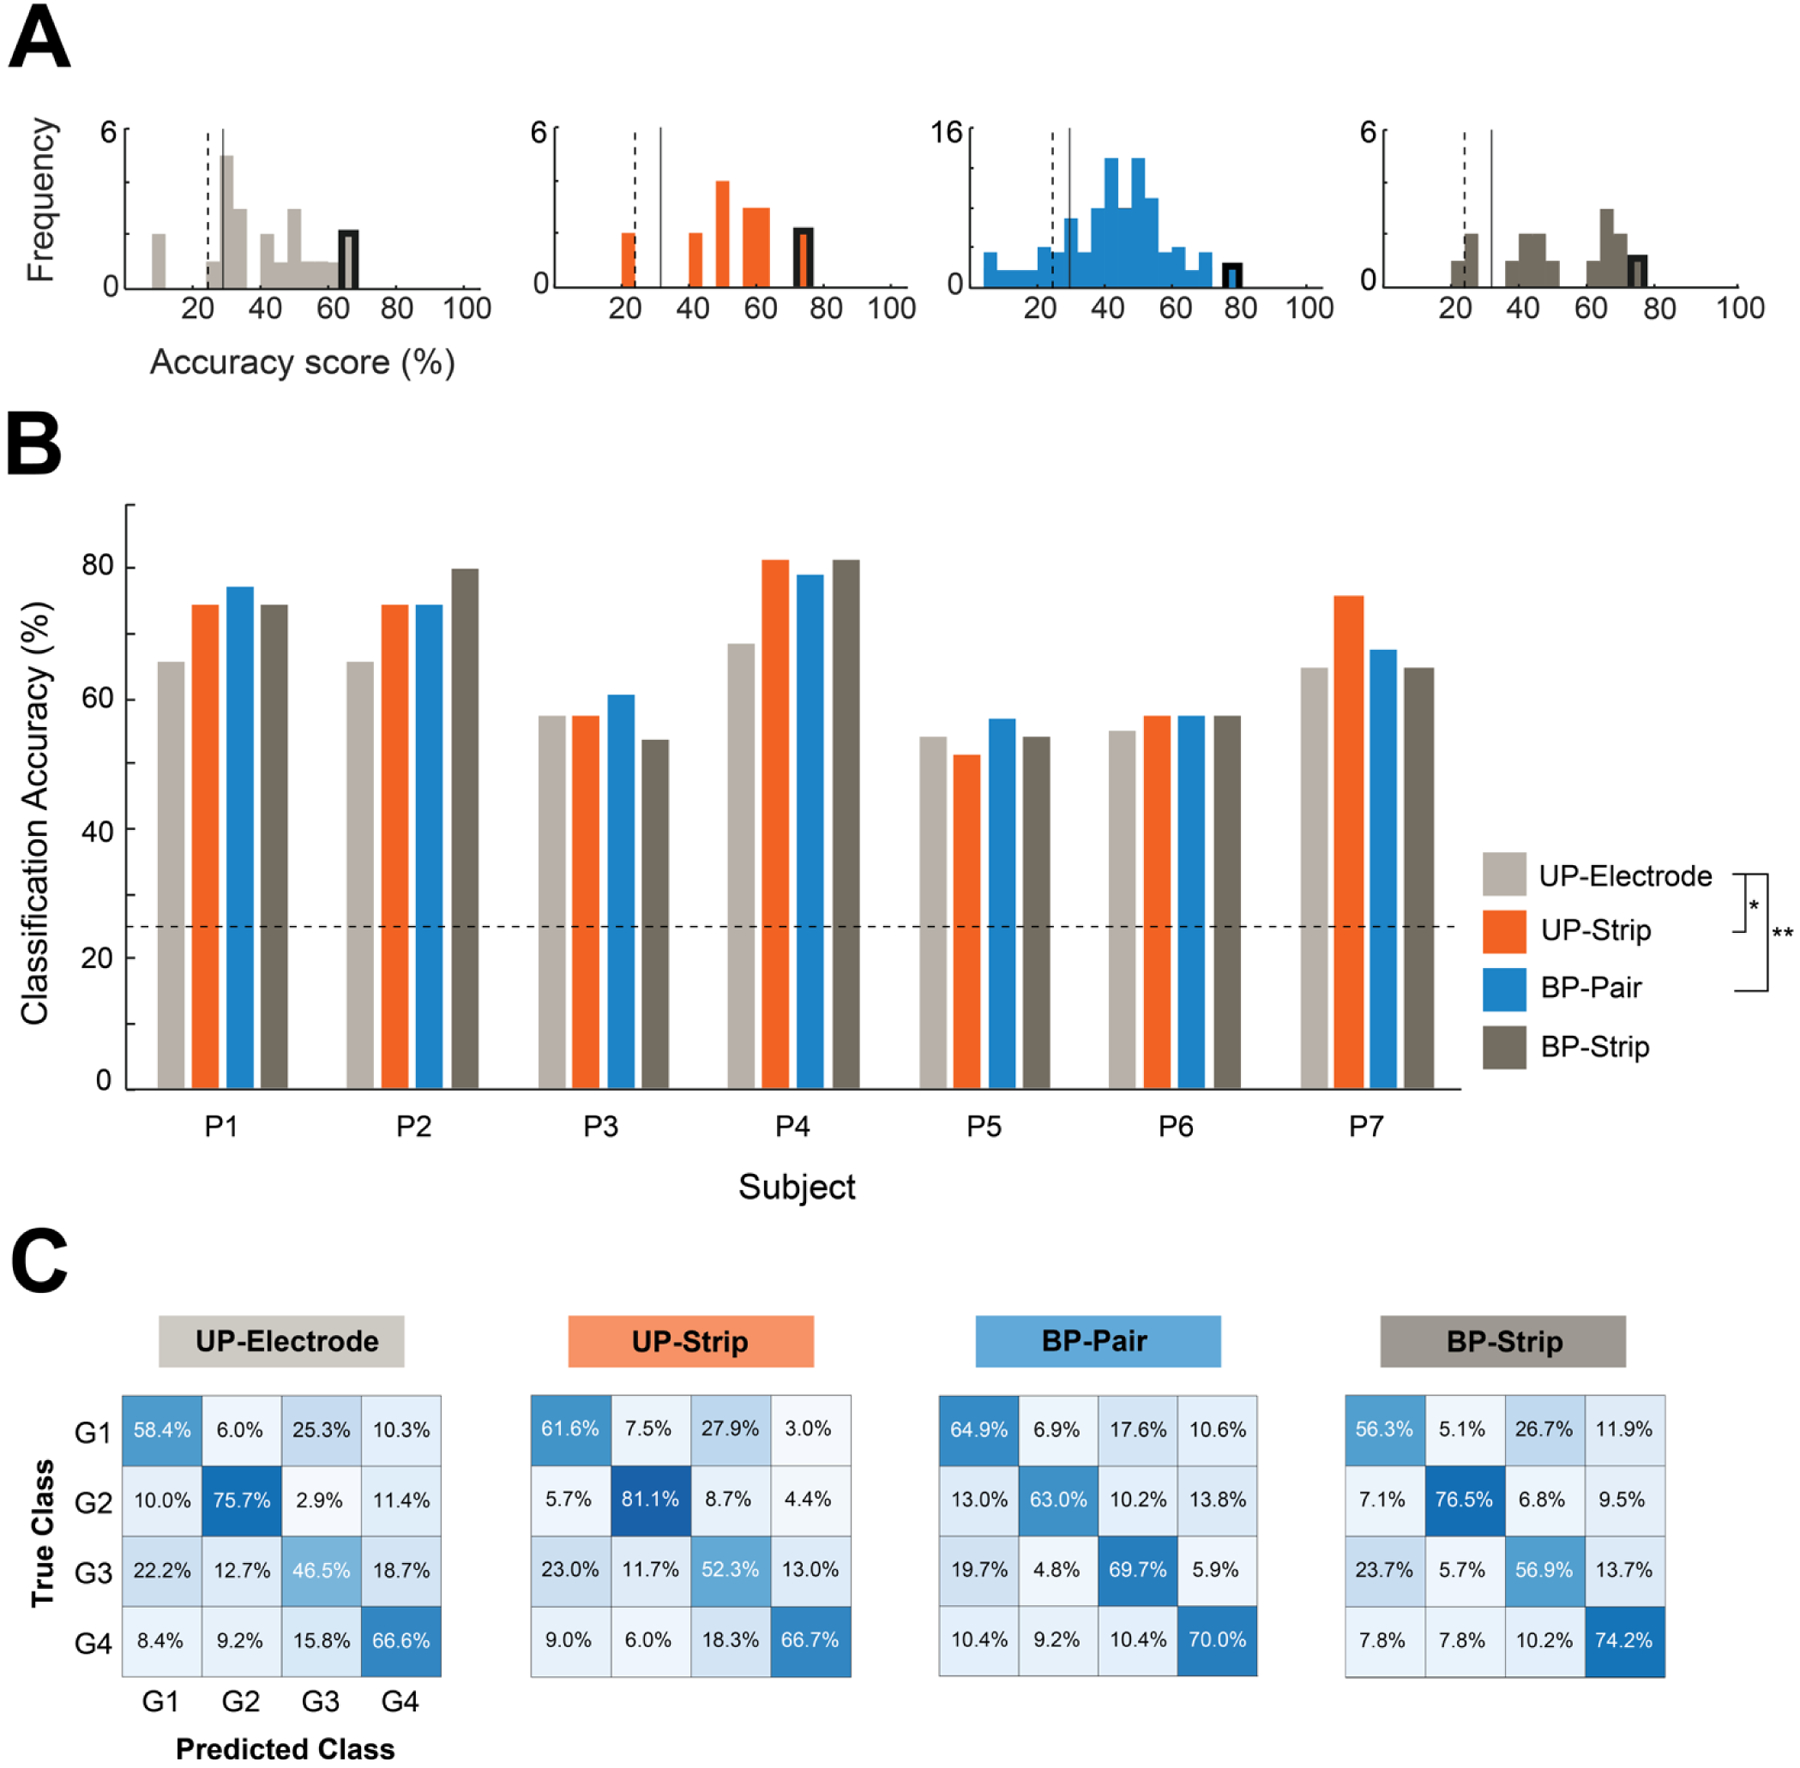
Classification scores. A) Histograms of the classification scores for P1. The frequency plots display the distribution of classification scores of all channels of each scheme. The highest scores (outlined in black) were selected for subsequent analyses. The dashed and solid lines indicate the individual’s chance level and significance (p = 0.05) level, respectively. B) The highest classification score per method for the first run of each participant. The dashed line indicates the overall chance level. Individual’s chance and significance levels can be found in Supplementary Table 2. Significant pairwise comparisons at * p< 0.05, ** p< 0.01. C) Confusion-matrices averaged across participant’s highest classification scores. A dark blue diagonal from the upper left to the lower right indicates perfect classification. UP - Unipolar; BP - Bipolar.
The highest classification score per participant and scheme was selected for comparison between schemes (Figure 3B). Results of a one-way repeated measures ANOVA indicate that the classification accuracy was significantly affected by the scheme (F(3, 18) = 4.09, p < 0.05). Post-hoc pairwise comparisons revealed that the classification accuracy of the ‘Unipolar Electrodes’ (61.56 ± 5.94%) was significantly lower than that of the ‘Unipolar Strips’ (67.40 ± 11.73%; p < 0.05) and ‘Bipolar Pairs’ (67.56 ± 9.41%; p < 0.01), but not compared to the classification accuracy of the ‘Bipolar Strips’ (66.55 ± 12.08%; ns). Confusion-matrices (Figure 3C) displayed a clear blue diagonal, suggesting that all gestures contributed to the overall accuracy and that the pattern was similar across the four schemes.
3.2. Repetition analysis
Two participants performed an additional run, which was used to test how consistent the classification results were across runs. Results (Table 3) showed a maximum difference of 10% in classification accuracy when using one run for training and the other for testing.
Table 3.
Reproducibility of the maximum classification accuracies across runs.
| Participant | Test set | Training set | Unipolar Electrode | Unipolar Strip | Bipolar Pair | Bipolar Strip |
|---|---|---|---|---|---|---|
| P4 | 1 | 1 | 68% | 82% | 79% | 82% |
| P4 | 2 | 2 | 74% | 74% | 77% | 71% |
| P4 | 1 | 2 | 76% | 82% | 82% | 79% |
| P4 | 2 | 1 | 66% | 74% | 74% | 74% |
| P7 | 1 | 1 | 65% | 76% | 68% | 65% |
| P7 | 2 | 2 | 50% | 65% | 55% | 58% |
| P7 | 1 | 2 | 59% | 76% | 59% | 70% |
| P7 | 2 | 1 | 58% | 68% | 58% | 60% |
3.3. Optimal localization and orientation
Comparison of the location of the best ‘Bipolar Pairs’ and ‘Bipolar Strips’ across participants revealed that at least one of the electrodes in a strip is ideally placed close to or crossing the central sulcus (Figure 4A). This result suggests that the information of both the pre- and post-central gyrus contribute to decoding. To infer the preferred orientation of the ‘Bipolar Pairs’ and ‘Bipolar Strips’, we used a MNI brain (Figure 4B). Results show that in the left hemisphere there is a slight preference for a horizontal or diagonal (dorsal postcentral to ventral precentral) orientation, whereas in the right hemisphere no consistent strip orientation was found.
Figure 4 |.
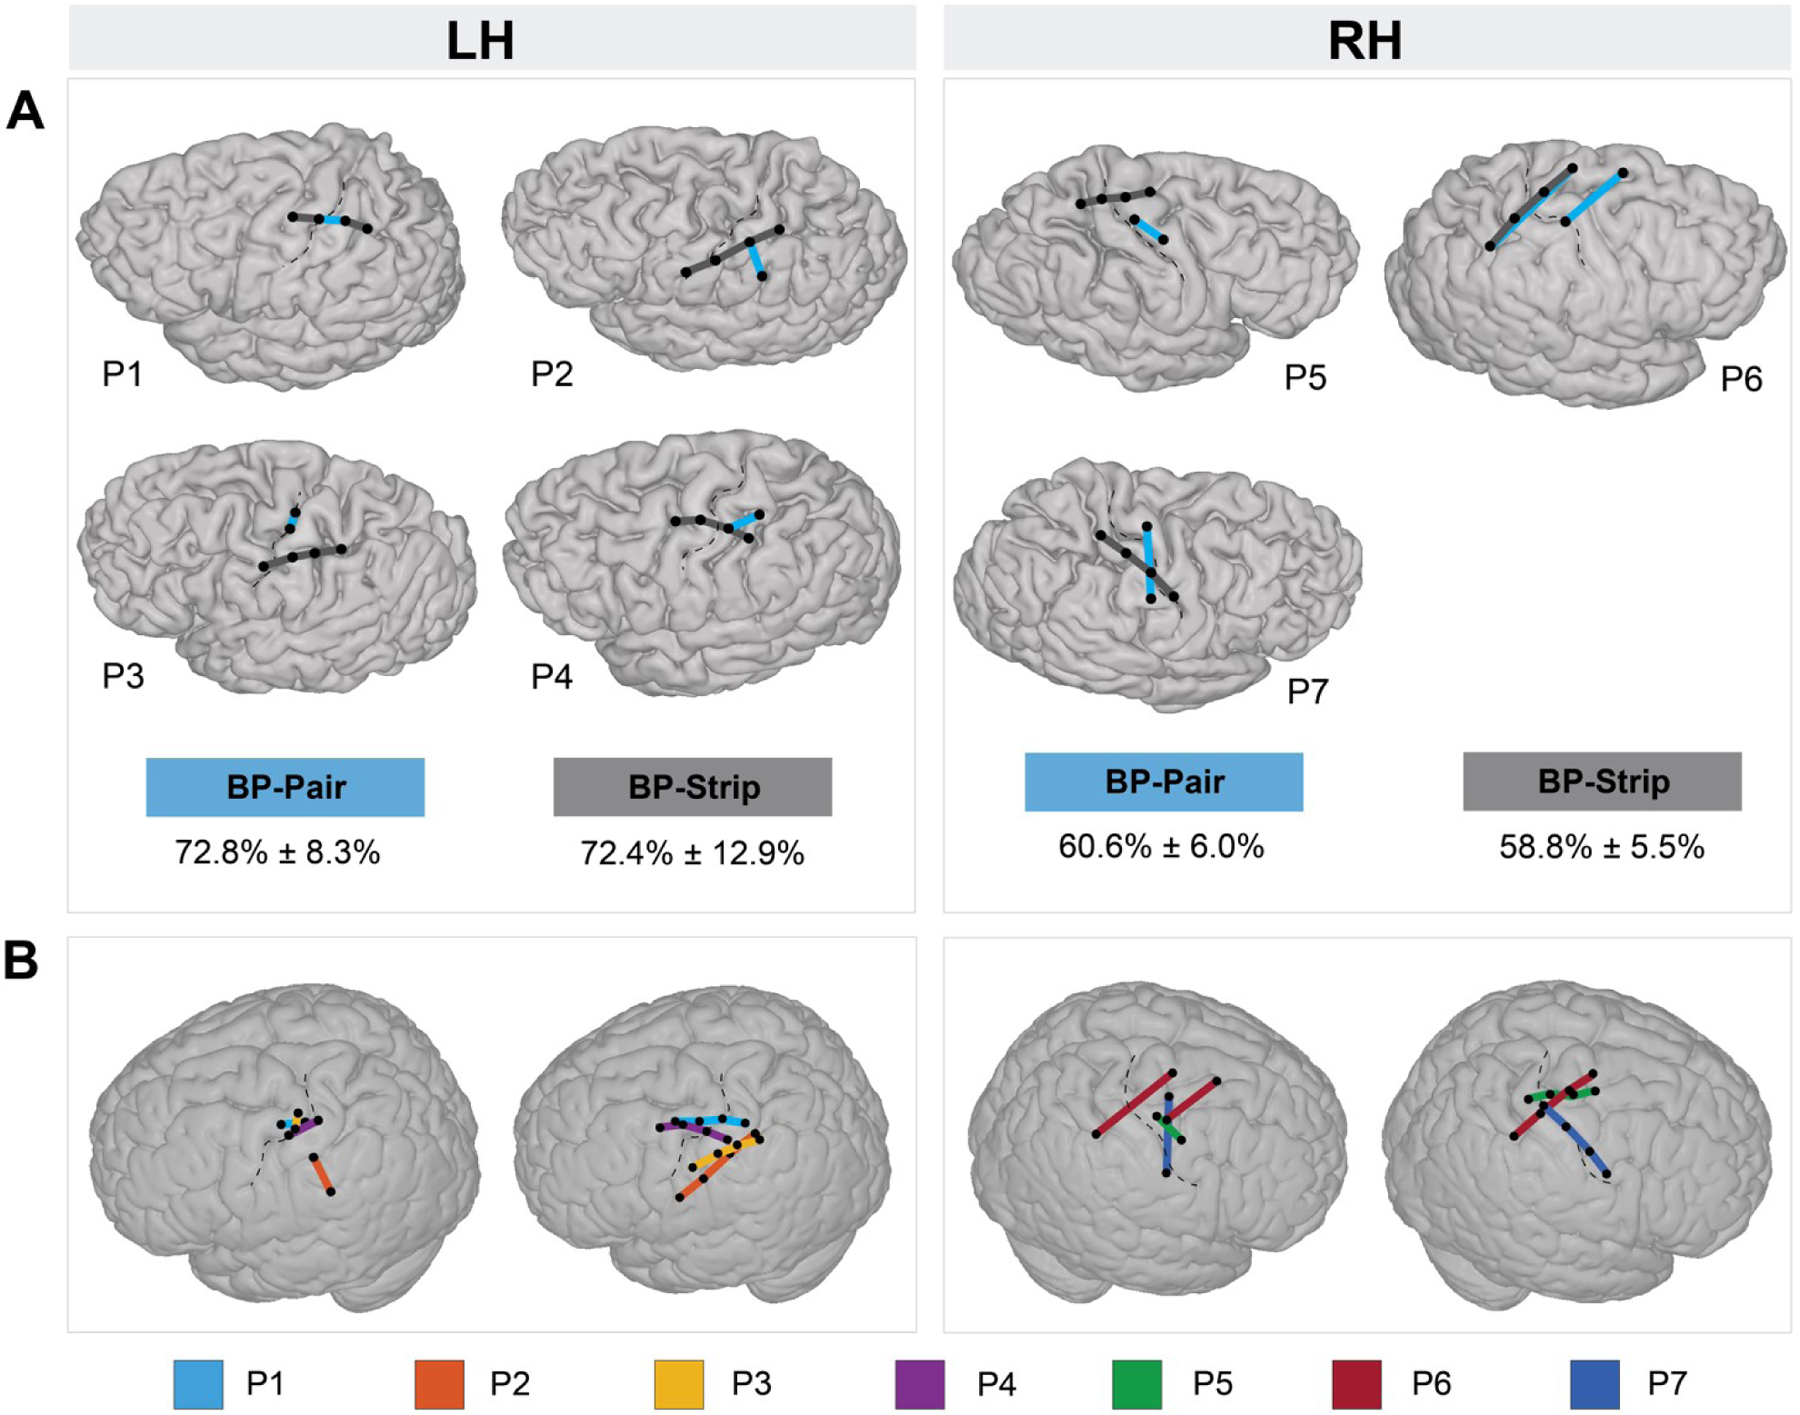
Optimal localization and orientation of ‘Bipolar Strips’ and ‘Bipolar Pairs’. A) Localization of ‘Bipolar Pairs’ (blue lines) and ‘Bipolar Strips’ (dark gray lines) with maximum classification scores (100th percentile) on the individual participant’s brain, per hemisphere. The mean (± standard deviation) of these maximum classification scores across participants, per hemisphere, is given below the brains for both ‘Bipolar Pairs’ and ‘Bipolar Strips’ schemes. B) The 100th percentile ‘Bipolar Pairs’ and ‘Bipolar Strips’ displayed on a MNI standard brain in order to compare the optimal spatial orientation across participants. Each colored line represents a participant. BP - bipolar; LH - left hemisphere; RH - right hemisphere.
3.4. Comparison with spatial-temporal classifier
Classification scores using temporal template-matching of the ‘Bipolar Pair’ scheme were compared with scores obtained using a richer spatial-temporal feature matrix (control condition). The average scores across participant were 70.69% (± 10.88%) for the spatial-temporal template-matching method. Paired samples t-tests revealed no statistical significance between the temporal (67.56 ± 9.41%) to the spatial-temporal template-matching method (t(6) = −1.47, ns), suggesting that spatial information does not improve classification.
4. Discussion
The possibility to decode several mental states from a limited number of electrodes may allow for multi-dimensional, minimally invasive, implanted ECoG-based BCIs. In this study we investigated whether four hand gestures can be decoded from small strips of four neighboring electrodes. For that, we compared the classification accuracy between unipolar and bipolar montages using four channel selection schemes (‘Unipolar Electrode’, ‘Unipolar Strip’, ‘Bipolar Pair’ and ‘Bipolar Strip’) and showed that one single bipolar pair is sufficient to decode four hand gestures with reasonable accuracy and that a combination of four unipolar electrodes that are re-referenced to the common average of a larger number of electrodes does not outperform one single bipolar pair. The added benefit of a bipolar pair is its direct useability for minimally invasive implantable BCIs as only two electrodes are necessary, whereas for a unipolar montage the implementation of multiple additional electrodes is required.
The collected data allowed us to simulate electrode strips of four consecutive electrodes placed at multiple locations and with multiple orientations across the sensorimotor cortex. We restricted the comparison of the electrode selection schemes to the best performing channel per scheme, as a proxy for a minimally invasive BCI. However, our results showed that multiple channels performed equally and consistently well within and across participants (Supplementary Table 3 and 4), suggesting that strips can offer a promising solution for multiple-class motor-based BCI control. Furthermore, the results indicate a clustering of high-performing strips and pairs around the central sulcus, which is not surprising since 2/3 of the cerebral cortex falls inside the sulci (Ribas, 2010). We did not observe a clustering preference for either the pre- or post-central gyrus, indicating that both gyri provide valuable information. The role of somatosensory information beyond sensory feedback has been previously suggested and confirmed in other studies that showed that the somatosensory cortex provides informative signals for decoding even in the absence of sensory input (Branco et al., 2017; Bruurmijn et al., 2017; Degenhart et al., 2018; Gharabaghi et al., 2014; Kikkert et al., 2016; Pandarinath et al., 2017; Sun et al., 2015; Yanagisawa et al., 2012).
The optimal orientation of the strips revealed subtle differences between hemispheres. The left hemisphere showed a more consistent dorsal postcentral to ventral precentral orientation when compared with the right hemisphere. This difference could be attributed to several factors. All participants were right-handed, which may be associated with larger cortical overlap of the representation of different hand muscles (Melgari, Pasqualetti, Pauri, & Rossini, 2008) and therefore a more localized representation (Nicolini, Harasym, Turco, & Nelson, 2019) in the left hemisphere when compared with the right hemisphere. In addition, even though for P2 the location of best strip and pair were found more posterior when compared with other participants, this location coincided with the hand region as defined by the clinical stimulation mapping. To conclusively establish a relation between performance and location and orientation of the strip, however, a larger sample would be required.
Even though our results show consistent classification scores across participants, three participants performed less well (P3, P5 and P6). Many factors can influence classification performance, such as the amount of practice with the task (e.g., Bleichner, Jansma, Sellmeijer, Raemaekers, & Ramsey, 2014) and mental and physical fitness of the participants at the time they performed the task (e.g., Myrden & Chau, 2015; Nijboer, Birbaumer, & Kübler, 2010). Indeed, earlier work found a relationship between hand gesture task performance and classification accuracy (Bleichner et al. 2014; Branco et al., 2017), indicating that consistency of the movement is an important factor. Since our participants were not trained beforehand and there were only 10 trials per gesture, it may be speculated that training for consistent gesture execution could increase the classification accuracy to a level that could be used in a real application. Additionally, P5 and P6 revealed the lowest scores and a different optimal strip orientation in the right hemisphere compared with P7 and the participants with left hemispheric coverage. For these two participants the epilepsy onset was clinically described close to the hand region of interest, which could potentially affect the usual cortical response.
To attest whether better decoding accuracies would be reached using a richer feature set and more advanced classification methods, we compared our scores with those computed using spatial-temporal features. Interestingly, the results showed that information given by the electrodes’ spatial location does not significantly improve classification, suggesting that temporal features of a single electrode (or pair) could be sufficient for accurate BCI control. This finding is also in line with previous studies that suggested that temporal features drive the distinguishability of complex hand movements (e.g., Branco et al., 2017; Willett, Avansino, Hochberg, Henderson, & Shenoy, 2021). Furthermore, in this study we aligned trials using movement onset markers. We have shown in a previous study that systematic differences in the execution of hand gestures, such as finger movement order or speed of movement, may influence classification and have therefore developed a method for trial alignment that is independent of the hand movement (Branco et al., 2017). Such a method could be applied to the current analysis in order to further validate the performance of the bipolar schemes. Lastly, in the current study we only performed classification based on the high-frequency band. In the future, the low-frequency band may also be included in the classification and compared with the high-frequency band.
5. Conclusion
Increasing the number of classes that can be decoded from the sensorimotor cortex can potentially increase the communication speed of ECoG-based BCIs. In this study we showed that four hand gestures of the American sign language alphabet can be distinguished from a single bipolar pair. We found that single bipolar pairs performed better or equally well to a single unipolar electrode or a combination of four unipolar electrodes, and that bipolar temporal features were as rich as spatial-temporal features for decoding. These results advocate the employment of ECoG strips and a bipolar montage for minimally invasive BCIs.
Supplementary Material
Acknowledgements
The authors thank the participants for their time and effort, and the epilepsy clinical team for their help in collecting the data. This research was funded by the National Institute On Deafness and Other Communication Disorders of the National Institutes of Health (U01DC016686) (NFR).
Footnotes
Conflict of Interest: The authors declare that they have no conflict of interest.
Data Availability:
The data generated and/or analyzed during the current study are available from the corresponding author upon reasonable request.
References
- Behrens E, Schramm J, Zentner J, & König R (1997). Surgical and Neurological Complications in a Series of 708 Epilepsy Surgery Procedures. Neurosurgery, 41(1), 1–10. 10.1097/00006123-199707000-00004 [DOI] [PubMed] [Google Scholar]
- Benabid AL, Costecalde T, Eliseyev A, Charvet G, Verney A, Karakas S, … Chabardes S (2019). An exoskeleton controlled by an epidural wireless brain–machine interface in a tetraplegic patient: a proof-of-concept demonstration. The Lancet Neurology, 18(12), 1112–1122. 10.1016/S1474-4422(19)30321-7 [DOI] [PubMed] [Google Scholar]
- Blabe CH, Gilja V, Chestek CA, Shenoy KV, Anderson KD, & Henderson JM (2015). Assessment of brain-machine interfaces from the perspective of people with paralysis. Journal of Neural Engineering, 12(4). 10.1088/1741-2560/12/4/043002 [DOI] [PMC free article] [PubMed] [Google Scholar]
- Bleichner MG, Freudenburg ZV, Jansma JM, Aarnoutse EJ, Vansteensel MJ, & Ramsey NF (2016). Give me a sign: decoding four complex hand gestures based on high-density ECoG. Brain Structure and Function, 221(1), 203–216. 10.1007/s00429-014-0902-x [DOI] [PMC free article] [PubMed] [Google Scholar]
- Bleichner Martin G., Jansma JM, Sellmeijer J, Raemaekers M, & Ramsey NF (2014). Give me a sign: Decoding complex coordinated hand movements using high-field fMRI. Brain Topography, 27(2), 248–257. 10.1007/s10548-013-0322-x [DOI] [PubMed] [Google Scholar]
- Branco MP, Freudenburg ZV, Aarnoutse EJ, Bleichner MG, Vansteensel MJ, & Ramsey NF (2017). Decoding hand gestures from primary somatosensory cortex using high-density ECoG. NeuroImage, 147(May 2016), 130–142. 10.1016/j.neuroimage.2016.12.004 [DOI] [PMC free article] [PubMed] [Google Scholar]
- Branco MP, Gaglianese A, Glen DR, Hermes D, Saad ZS, Petridou N, & Ramsey NF (2018). ALICE: A tool for automatic localization of intra-cranial electrodes for clinical and high-density grids. Journal of Neuroscience Methods, 301, 43–51. 10.1016/j.jneumeth.2017.10.022 [DOI] [PMC free article] [PubMed] [Google Scholar]
- Bruurmijn MLCM, Pereboom IPL, Vansteensel MJ, Raemaekers MAH, & Ramsey NF (2017). Preservation of hand movement representation in the sensorimotor areas of amputees. Brain, 140(12), 3166–3178. 10.1093/brain/awx274 [DOI] [PMC free article] [PubMed] [Google Scholar]
- Combrisson E, & Jerbi K (2015). Exceeding chance level by chance: The caveat of theoretical chance levels in brain signal classification and statistical assessment of decoding accuracy. Journal of Neuroscience Methods, 250(December 2018), 126–136. 10.1016/j.jneumeth.2015.01.010 [DOI] [PubMed] [Google Scholar]
- Degenhart AD, Hiremath SV, Yang Y, Foldes S, Collinger JL, Boninger M, … Wang W (2018). Remapping cortical modulation for electrocorticographic brain-computer interfaces: A somatotopy-based approach in individuals with upper-limb paralysis. Journal of Neural Engineering, 15(2). 10.1088/1741-2552/aa9bfb [DOI] [PMC free article] [PubMed] [Google Scholar]
- Gharabaghi A, Naros G, Walter A, Roth A, Bogdan M, Rosenstiel W, … Birbaumer N (2014). Epidural electrocorticography of phantom hand movement following long-term upper-limb amputation. Frontiers in Human Neuroscience, 8(MAY), 1–8. 10.3389/fnhum.2014.00285 [DOI] [PMC free article] [PubMed] [Google Scholar]
- Herff C, Heger D, de Pesters A, Telaar D, Brunner P, Schalk G, & Schultz T (2015). Brain-to-text: Decoding spoken phrases from phone representations in the brain. Frontiers in Neuroscience, 9(MAY), 1–11. 10.3389/fnins.2015.00217 [DOI] [PMC free article] [PubMed] [Google Scholar]
- Hermes D, Miller KJ, Noordmans HJ, Vansteensel MJ, & Ramsey NF (2010). Automated electrocorticographic electrode localization on individually rendered brain surfaces. Journal of Neuroscience Methods, 185(2), 293–298. 10.1016/j.jneumeth.2009.10.005 [DOI] [PubMed] [Google Scholar]
- Huggins JE, Moinuddin AA, Chiodo AE, & Wren PA (2015). What would brain-computer interface users want: Opinions and priorities of potential users with spinal cord injury. Archives of Physical Medicine and Rehabilitation, 96(3), S38–S45.e5. 10.1016/j.apmr.2014.05.028 [DOI] [PubMed] [Google Scholar]
- Huggins JE, Wren PA, & Gruis KL (2011). What would brain-computer interface users want? Opinions and priorities of potential users with amyotrophic lateral sclerosis. Amyotrophic Lateral Sclerosis, 12(5), 318–324. 10.3109/17482968.2011.572978 [DOI] [PMC free article] [PubMed] [Google Scholar]
- Kikkert S, Kolasinski J, Jbabdi S, Tracey I, Beckmann CF, Berg HJ, & Makin TR (2016). Revealing the neural fingerprints of a missing hand. ELife, 5(AUGUST), 1–19. 10.7554/eLife.15292 [DOI] [PMC free article] [PubMed] [Google Scholar]
- Lahr J, Schwartz C, Heimbach B, Aertsen A, Rickert J, & Ball T (2015). Invasive brain-machine interfaces: A survey of paralyzed patients’ attitudes, knowledge and methods of information retrieval. Journal of Neural Engineering, 12(4). 10.1088/1741-2560/12/4/043001 [DOI] [PubMed] [Google Scholar]
- Leonard MK, Lucas B, Blau S, Corina DP, & Chang EF (2020). Cortical Encoding of Manual Articulatory and Linguistic Features in American Sign Language. Current Biology, 30(22), 4342–4351.e3. 10.1016/j.cub.2020.08.048 [DOI] [PMC free article] [PubMed] [Google Scholar]
- Li Y, Zhang S, Jin Y, Cai B, Controzzi M, Zhu J, … Zheng X (2017). Gesture Decoding Using ECoG Signals from Human Sensorimotor Cortex: A Pilot Study. Behavioural Neurology, 2017. 10.1155/2017/3435686 [DOI] [PMC free article] [PubMed] [Google Scholar]
- Matsushita K, Hirata M, Suzuki T, Ando H, Yoshida T, Ota Y, … Yoshimine T (2018). A fully implantable wireless ECoG 128-channel recording device for human brain–machine interfaces: W-HERBS. Frontiers in Neuroscience, 12(July), 1–11. 10.3389/fnins.2018.00511 [DOI] [PMC free article] [PubMed] [Google Scholar]
- Melgari JM, Pasqualetti P, Pauri F, & Rossini PM (2008). Muscles in “Concert”: Study of primary motor cortex upper limb functional topography. PLoS ONE, 3(8), 1–11. 10.1371/journal.pone.0003069 [DOI] [PMC free article] [PubMed] [Google Scholar]
- Mercier MR, Bickel S, Megevand P, Groppe DM, Schroeder CE, Mehta AD, & Lado FA (2017). Evaluation of cortical local field potential diffusion in stereotactic electro-encephalography recordings: A glimpse on white matter signal. NeuroImage, 147, 219–232. 10.1016/j.neuroimage.2016.08.037 [DOI] [PubMed] [Google Scholar]
- Milekovic T, Fischer J, Pistohl T, Ruescher J, Schulze-Bonhage A, Aertsen A, … Mehring C (2012). An online brain-machine interface using decoding of movement direction from the human electrocorticogram. Journal of Neural Engineering, 9(4). 10.1088/1741-2560/9/4/046003 [DOI] [PubMed] [Google Scholar]
- Miller KJ, Hermes D, & Staff NP (2020). The current state of electrocorticography-based brain-computer interfaces. Neurosurgical Focus, 49(1), 1–8. 10.3171/2020.4.FOCUS20185 [DOI] [PubMed] [Google Scholar]
- Myrden A, & Chau T (2015). Effects of user mental state on EEG-BCI performance. Frontiers in Human Neuroscience, 9(JUNE), 1–11. 10.3389/fnhum.2015.00308 [DOI] [PMC free article] [PubMed] [Google Scholar]
- Nichols T, & Holmes A (2003). Nonparametric Permutation Tests for Functional Neuroimaging. Human Brain Function: Second Edition, 25(July), 887–910. 10.1016/B978-012264841-0/50048-2 [DOI] [PMC free article] [PubMed] [Google Scholar]
- Nicolini C, Harasym D, Turco CV, & Nelson AJ (2019). Human motor cortical organization is influenced by handedness. Cortex, 115, 172–183. 10.1016/j.cortex.2019.01.017 [DOI] [PubMed] [Google Scholar]
- Nijboer F, Birbaumer N, & Kübler A (2010). The influence of psychological state and motivation on brain-computer interface performance in patients with amyotrophic lateral sclerosis - a longitudinal study. Frontiers in Neuroscience, 4(JUL), 1–13. 10.3389/fnins.2010.00055 [DOI] [PMC free article] [PubMed] [Google Scholar]
- Oostenveld R, Fries P, Maris E, & Schoffelen JM (2011). FieldTrip: Open source software for advanced analysis of MEG, EEG, and invasive electrophysiological data. Computational Intelligence and Neuroscience, 2011. 10.1155/2011/156869 [DOI] [PMC free article] [PubMed] [Google Scholar]
- Pandarinath C, Nuyujukian P, Blabe CH, Sorice BL, Saab J, Willett FR, … Henderson JM (2017). High performance communication by people with paralysis using an intracortical brain-computer interface. ELife, 6, 1–27. 10.7554/eLife.18554 [DOI] [PMC free article] [PubMed] [Google Scholar]
- Rabbani Q, Milsap G, & Crone NE (2019). The Potential for a Speech Brain–Computer Interface Using Chronic Electrocorticography. Neurotherapeutics, 16(1), 144–165. 10.1007/s13311-018-00692-2 [DOI] [PMC free article] [PubMed] [Google Scholar]
- Ramsey NF, Salari E, Aarnoutse EJ, Vansteensel MJ, Bleichner MG, & Freudenburg ZV (2018). Decoding spoken phonemes from sensorimotor cortex with high-density ECoG grids. NeuroImage, 180(April 2017), 301–311. 10.1016/j.neuroimage.2017.10.011 [DOI] [PMC free article] [PubMed] [Google Scholar]
- Ribas CG (2010). The cerebral sulci and gyri. Neurosurgical Focus, 28(2). 10.3171/2009.11.FOCUS09245 [DOI] [PubMed] [Google Scholar]
- Rouanne V, Śliwowski M, Costecalde T, Benabid A, & Aksenova T (2021). Detection of Error Correlates in the Motor Cortex in a Long Term Clinical Trial of ECoG based Brain Computer Interface, 4(Biostec), 26–34. 10.5220/0010227800260034 [DOI] [Google Scholar]
- Rydenhag B, & Silander HC (2001). Complications of epilepsy surgery after 654 procedures in Sweden, September 1990–1995: A multicenter study based on the Swedish National Epilepsy Surgery Register. Neurosurgery, 49(1), 51–57. 10.1227/00006123-200107000-00007 [DOI] [PubMed] [Google Scholar]
- Salari E, Freudenburg ZV, Branco MP, Aarnoutse EJ, Vansteensel MJ, & Ramsey NF (2019). Classification of Articulator Movements and Movement Direction from Sensorimotor Cortex Activity. Scientific Reports, 9(1), 1–12. 10.1038/s41598-019-50834-5 [DOI] [PMC free article] [PubMed] [Google Scholar]
- Silversmith DB, Abiri R, Hardy NF, Natraj N, Tu-Chan A, Chang EF, & Ganguly K (2021). Plug-and-play control of a brain–computer interface through neural map stabilization. Nature Biotechnology, 39(3), 326–335. 10.1038/s41587-020-0662-5 [DOI] [PubMed] [Google Scholar]
- Sun H, Blakely TM, Darvas F, Wander JD, Johnson LA, Su DK, … Ojemann JG (2015). Sequential activation of premotor, primary somatosensory and primary motor areas in humans during cued finger movements. Clinical Neurophysiology, 126(11), 2150–2161. 10.1016/j.clinph.2015.01.005 [DOI] [PMC free article] [PubMed] [Google Scholar]
- Vansteensel MJ, Pels EGM, Bleichner MG, Branco MP, Denison T, Freudenburg ZV, … Ramsey NF (2016). Fully Implanted Brain–Computer Interface in a Locked-In Patient with ALS. New England Journal of Medicine, 375(21), 2060–2066. 10.1056/nejmoa1608085 [DOI] [PMC free article] [PubMed] [Google Scholar]
- Voorhies JM, & Cohen-Gadol A (2013). Techniques for placement of grid and strip electrodes for intracranial epilepsy surgery monitoring: Pearls and pitfalls. Surgical Neurology International, 4, 98. 10.4103/2152-7806.115707 [DOI] [PMC free article] [PubMed] [Google Scholar]
- Willett FR, Avansino DT, Hochberg LR, Henderson JM, & Shenoy KV (2021). High-performance brain-to-text communication via handwriting. Nature, 593(7858), 249–254. 10.1038/s41586-021-03506-2 [DOI] [PMC free article] [PubMed] [Google Scholar]
- Yanagisawa T, Hirata M, Saitoh Y, Kishima H, Matsushita K, Goto T, … Yoshimine T (2012). Electrocorticographic control of a prosthetic arm in paralyzed patients. Annals of Neurology, 71(3), 353–361. 10.1002/ana.22613 [DOI] [PubMed] [Google Scholar]
- Zhang D, Song H, Xu R, Zhou W, Ling Z, & Hong B (2013). Toward a minimally invasive brain-computer interface using a single subdural channel: A visual speller study. NeuroImage, 71, 30–41. 10.1016/j.neuroimage.2012.12.069 [DOI] [PubMed] [Google Scholar]
Associated Data
This section collects any data citations, data availability statements, or supplementary materials included in this article.
Supplementary Materials
Data Availability Statement
The data generated and/or analyzed during the current study are available from the corresponding author upon reasonable request.