

Abstract
The decidua is a hallmark of reproduction in many placental mammals. Differentiation of decidual stromal cells is known to be induced by progesterone and the cyclic AMP/protein kinase A (cAMP/PKA) pathway. Several candidates have been identified as the physiological stimulus for adenylyl cyclase activation, but their relative importance remains unclear. To bypass this uncertainty, the standard approach for in vitro experiments uses membrane-permeable cAMP and progestin. We phylogenetically infer that prostaglandin E2 (PGE2) likely was the signal that ancestrally induced decidualization in conjunction with progesterone. This suggests that PGE2 and progestin should be able to activate the core gene regulatory network of decidual cells. To test this prediction, we performed a genome-wide study of gene expression in human endometrial fibroblasts decidualized with PGE2 and progestin. Comparison to a cAMP-based protocol revealed shared activation of core decidual genes and decreased induction of senescence-associated genes. Single-cell transcriptomics of PGE2-mediated decidualization revealed a distinct, early-activated state transitioning to a differentiated decidual state. PGE2-mediated decidualization was found to depend upon progestin-dependent induction of PGE2 receptor 2 (PTGER2) which in turn leads to PKA activation upon PGE2 stimulation. Progesterone-dependent induction of PTGER2 is absent in opossum, an outgroup taxon of placental mammals which is incapable of decidualization. Together, these findings suggest that the origin of decidualization involved the evolution of progesterone-dependent activation of the PGE2/PTGER2/PKA axis, facilitating entry into a PKA-dominant rather than AKT-dominant cellular state. We propose the use of PGE2 for in vitro decidualization as an alternative to 8-Br-cAMP.
Keywords: prostaglandin E2, decidua, evolution of mammalian pregnancy, cell type origination, decidual stromal cell, endometrial stromal fibroblast, PTGER2, senescence
In vitro decidualization of human endometrial stromal fibroblasts with PGE2 and progestin induces a different but genuine decidual cell state through PTGER2-dependent PKA activation when compared to the conventional cyclic AMP/MPA protocol.
Graphical Abstract
Graphical Abstract.
Introduction
The uterine decidua, the transient tissue that forms the maternal side of the fetal–maternal interface, plays an essential role in the reproduction of mammals with invasive placentation [1]. The decidua evolved in the stem lineage of placental (eutherian) mammals [2] and was a key innovation for the evolution of extended gestation in this clade [3–5]. Decidual development entails the differentiation of the endometrial stromal fibroblasts (ESF) into mature decidual stromal cells (DSC). ESF are routinely differentiated into DSC in vitro by stimulation with ovarian hormones and signals that activate the cyclic AMP (cAMP)/protein kinase A (PKA) pathway. Most commonly, this is achieved by membrane-permeable 8-Br-cAMP. Based upon recent findings from endometrial stromal cell biology ([6, 7]; and see below), we infer prostaglandin E2 (PGE2) to have been a physiological cAMP-activating signal present at the time the decidual cell type evolved. While this molecule has been shown to enhance decidual marker expression (e.g., [8]), in vitro deciudalization with PGE2 has since fallen out of favor. We used bulk and single-cell transcriptomics to characterize the process of PGE2 and progestin-mediated human in vitro decidualization and to quantify the production of cells in a senescence-like state in comparison to the conventional cAMP + MPA method. Additionally, we identify that the receptor through which this signal is received, PTGER2, is facultatively expressed in response to progestin in a manner which is lacking in the opossum, a nondeciduate outgroup.
Background and evolutionary scenario
The ability of ESF to differentiate into DSC is an evolutionarily derived trait [9], and the stromal cells that are able to form DSC can be considered to be “neo-ESF” [10]. The neo-ESF and DSC evolved from an ancestral endometrial cell type unable to decidualize, or “paleo-ESF.” paleo-ESF are still found in the gray short-tailed opossum, Monodelphis domestica [6, 11]. The paleo-ESF of this species can be distinguished from the nondeciduate state found in some placental mammals, such as horses and cows, as the latter have likely lost the decidual reaction secondarily [2]. It follows that the comparative study of the paleo- and neo-ESF’s response to deciduogenic stimuli is a way to identify the molecular innovations that underlie the evolutionary origin of the DSC differentiation pathway.
The most recent common ancestor of placental mammals and marsupials lacked a decidua and likely had a short gestation [12]. The gray short-tailed opossum is a useful proxy for this ancestral state as this species retains many aspects of this inferred ancestral state in its reproductive biology–for instance, lacking derived features present in macropods, such as kangaroos and wallabies [13]. In this species, the embryo attaches to the uterine epithelium for a short 2-day period immediately before birth [14, 15]. During attachment, the embryo elicits an inflammatory attachment reaction (IAR) similar to the inflammatory processes observed during implantation in placental mammals [14, 16]. These processes must be induced by the embryo because they are not observed during pseudo-pregnancy/the sterile ovarian cycle [17]. Based upon this biological scenario, we can infer that the IAR existed before the origin of the decidua. The IAR thus provides part of the physiological environment within which ESF evolved into neo-ESF and DSC. The initial biological role of the DSC likely was to control uterine inflammation to allow extended gestation [4, 12], with their differentiation occurring in the presence of cues and signals from an inflammatory response.
Inferring the minimal ancestral deciduogenic network
In humans, the decidualization process is complex, involving an array of deciduogenic signals and transcription factors [1]. This complexity likely is the result of the evolution of multiple layers of regulation and modifications after the evolutionary origin of DSC. In order to understand the molecular mechanisms that led to the evolutionary origin of the DSC, we aim at stripping this down to a minimal ancestral deciduogenic signaling network. Such a minimal ancestral network then could lead us to the core gene regulatory mechanisms specific for decidual cell type identity and toward understanding the various specializations the decidualization process has acquired after the origin of DSC.
We take the IAR as described in the opossum [14, 16] and the concurrent endocrine status to be a model for the signaling environment in which DSC evolved. Therefore, the physiological environment of the paleo-ESF before they evolved into neo-ESF and DSC must have consisted of at least two types of signals: (1) post-ovulatory ovarian hormones, most notably progesterone (P4) and relaxin (RLN) and (2) the paracrine environment caused by the IAR, which includes PGE2, IL6, IL10, IL1, TNF, and others [14, 16]. To identify candidate ancestral deciduogenic signals, we can intersect the physiological environment in which the DSC likely evolved (see above) and the list of known deciduogenic stimuli as identified by in vitro experiments, mostly on human and rodent ESF [1] and then ask which of these signals and receptors is broadly conserved among placental mammals. Our criteria for candidate ancestral deciduogenic signals are as follows: (1) presence during the IAR in opossum (or other outgroup species), (2) causal effectiveness in vitro, and (3) conservation among species that retained the decidual reaction.
A broadly accepted model for the molecular basis of human decidualization closely mirrors our two kinds of ancestral stimuli, holding that decidualization occurs through the convergence of two signaling pathways, progesterone signaling via isoform A of the nuclear progesterone receptor, PR-A, and the cAMP/PKA pathway [18]. The standard protocol for in vitro decidualization of human ESF consists of medroxyprogesterone acetate (MPA) and 8-bromo cAMP [19]. MPA is a stable progestin, replacing the in vivo role of P4 in vitro, and 8-Br-cAMP is a membrane-permeable analog of cAMP. This protocol circumvents the question of which signal leads to the activation of adenylyl cyclase, and thus is not informative about the in vivo deciduogenic signal, other than it has to be a ligand acting through cAMP. Other decidualization signals that have been verified to be deciduogenic or to enhance decidulization in vitro, other than progestin which is always essential, are the following: PGE2 ([8]), RLN ([20]), human chorionic gonadotropin (hCG; [21]), and TGFB1 [22]. Of these, three bind receptors signal through the cAMP-PKA pathway: RLN, hCG, and PGE2, and therefore they rise to the top of the candidate list.
The first of these candidates is RLN. In humans, the RLN gene family consists of three members, with one limited to the brain and with RLN1 and RLN2 playing various roles in peripheral organs, most notably in female reproduction [23]. It is produced by the corpus luteum in many animals, including marsupials [24, 25]; thus, RLN signaling is likely ancestral for placental mammals. RLN2 acting through its receptor RXFP1 signals through the cAMP pathway and plays a well-documented role in parturition. It is also expressed in the placental trophoblast in humans [26]. It has been shown to contribute to decidualization of human ESF in vitro [20, 27], although whether RLN (±progestin) is sufficient is questionable, as it has been found to require supplementation by cAMP-degrading phosphodiesterase [28] or forced expression of RXFP1 [29]. RLN is thus a good candidate for being one of the ancestral deciduogenic signals. To further investigate this possibility, we surveyed the expression of mRNA for receptors for RLN and various other candidate ligands in primary ESF of 11 mammalian species collected for an independent project (Figure 1) [7]. Within this dataset, we detected the RNA for the two cAMP-activating RLN receptors (RXFP1 and RXFP2) only in primary ESF of rodents (i.e., rat and guinea pig) and cat (Figure 1) but not in other species, including the opossum. This phylogenetic distribution of receptor expression makes it likely that RLN signaling was not part of the ancestral deciduogenic signaling network but was recruited to this role later in mammalian evolution.
Figure 1.
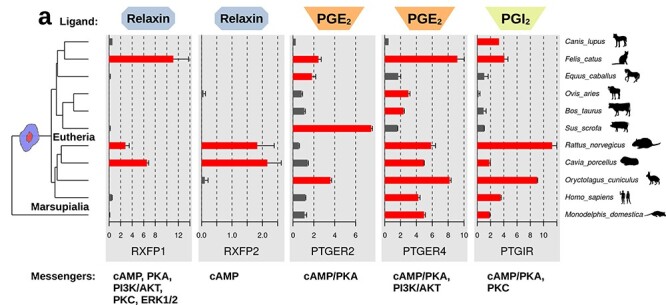
Expression of receptors for potential deciduogenic ligands in unstimulated primary ESF from 11 species. RLN receptors: RXFP1, RXFP2; PGE2 receptors: PTGER2, PTGER4; and prostaglandin I2 receptor: PTGIR. Data from Ma et al. [7] depicted as mean square-root TPM from all replicates. Error bars represent standard error of the mean. Tree topology from dos Reis et al. [90].
Next, gonadotropins, such as follicle stimulating hormone (FSH), luteinizing hormone (LH), and hCG, have also been linked to decidualization [21]. These proteins are heterodimers consisting of an alpha subunit shared between hCG and LH, FSH and thyroid stimulating hormone, and a beta subunit that is specific to the individual hormones. While the most prominent of the gonadotropins linked to decidualization in humans is hCG, this role of hCG is controversial [30]. Furthermore, the beta subunit of hCG (hCGβ) originated from a gene duplication of the LHB gene in the stem lineage of anthropoid primates [31]. Even though some in vitro studies have shown that hCG can support or enhance decidualization of human ESF [21], hCG has phylogenetically originated too recently to be part of the ancestral deciduogenic signaling network.
Finally, PGE2 is a small molecule of the eicosanoid family with well-established roles in inflammation and the female reproductive tract. In conjunction with progesterone, PGE2 has been shown to be effective in in-vitro decidualization (see [8], and earlier references summarized in [32]: 256). The PGE2 and other prostaglandins are synthesized in vivo at the implantation site after embryo attachment in a wide range of eutherian mammals, including the mouse and rat, the dog [33], as well as those with less-invasive types of placentation, such as the sheep [34], cow [35, 36], pig [37], and horse [38], often involving production by the luminal epithelium in response to stimulation from the embryo [39]. Outside of eutherians, prostaglandin H synthase 2 (PTGS2) and PGE2 itself are detected in the uterus of the opossum following embryo attachment [6, 14], and PGE2 has roles even more broadly in amniote reproduction [40]. Beyond the ubiquity of PGE2, ESF sensitivity to it is also widespread. The mRNA of the PGE2 receptor PTGER4 was detected in primary ESF of 10 out of 11 eutherian species from Ma et al. [7] (Figure 1), with dog being the only exception (but see [41]). Hence, it can be inferred that PGE2 has both been induced by the uterine attachment reaction and has been detectable by ESF via PTGER4 as far back as the most recent common ancestor of opossum and human. It thus was likely part of the paracrine milieu in which DSC evolved. This inference is bolstered by the finding that exposure of opossum paleo-ESF to either PGE2 or 8-Br-cAMP in vitro induced prostaglandin catabolic processes and reduced prostaglandin anabolic processes [6]: such regulatory behavior of the cells suggests that they “interpret” excess cAMP stimulation as prostaglandin overload, a behavior which only makes sense if it evolved under conditions where the cAMP-activating stimulus is reliably due to prostaglandin.
Based upon this process of elimination and reappraisal of the natural history of known decidualizing signals, two of the most likely candidates for membership in the minimal ancestral deciduogenic signaling network are progesterone and PGE2. This model does not imply that other factors are not involved in decidualization of the human ESF or that of other species. For instance, another prostaglandin, PGI2, also has a receptor which activates cAMP and is fairly widely expressed in ESF (Figure 1), but comparatively little is known about this molecule and the conservation of its production, whereas PGE2 production at the fetal–maternal interface is well established (Supplementary Table S1 and references therein). It is certain that the number and kind of signals involved in human and primate decidualization has increased during evolution after the cell type originated in the stem of placental mammals. This is most clearly demonstrated by the evolutionary history of hCG, for instance, which only evolved among primates (see above). Since RLN and hCG are also acting through cAMP/PKA, their role is likely that of additive or enhancing factors, making primate decidualization more robust. The question that follows is, how much of the core decidualization phenotype can be reproduced by progesterone and PGE2 alone and how it compares to the standard decidualization protocol.
In the present study, we asked to what extent a regime of progestin and PGE2 stimulation can produce DSC in vitro and what cell states ESF assume in response to MPA and PGE2. We hypothesized that PGE2 + MPA would induce a transcriptome-wide decidual transformation, including but not limited to the markers PRL and IGFBP1, and that the substitution of a potentially more physiological stimulus than membrane-permeable cAMP would prevent the production of senescent cells as recently reported from cAMP-based protocols [42, 43]. We failed to reject the former, finding what appeared to be successful PGE2-mediated decidualization. However, with respect to the latter, we did identify in our single-cell analysis a portion of cells expressing a senescence-associated genetic program as a divergent endpoint. Finally, through follow-up research, we also identified a receptor switch mechanism by which progestin induces the expression of PTGER2, which is driving decidualization. This mechanism was not activated in the cells becoming senescent and is also not active in the paleo-ESF from opossum [6]. We thus infer that the progestin-dependent induction of PTGER2 was a key gene regulatory innovation, which is essential for the evolutionary origin of DSC and thus for eutherian pregnancy.
Materials and methods
Cell culture and in vitro decidualization
Immortalized human ESF (ATCC line CRL-4003) were cultured in growth media containing the following: 1× antibiotic-antimycotic (15240, Gibco; contains penicillin, streptomycin, and amphotericin B), 15.56 g/L DMEM/F-12 without phenol red (D2906, Sigma-Aldrich), 1.2 g/L sodium bicarbonate, 10 mL/L sodium pyruvate (11360, Thermo Fisher), and 1 mL/L ITS supplement (354350, VWR) in 10% charcoal-stripped fetal bovine serum (100–199, Gemini). Media was replaced every 3–4 days during cell growth.
Primary human ESF (HsESF_217S), which had been previously isolated from a patient undergoing a polypectomy [44], were grown identically to the above. Those used in the senescence assay were in their 12th passage since isolation.
For in vitro decidualization, cells were grown in a base medium containing antibiotic-antimycotic (15240, Gibco), 15.56 g/L DMEM/F-12 (D8900, Sigma-Aldrich), and 1.2 g/L sodium bicarbonate in 2% fetal bovine serum (100–106, Gemini). Additives included MPA (M1629, Sigma-Aldrich) at a concentration of 1 μM or progesterone (P4) at a concentration of 1 or 50 μM (P0130, Sigma-Aldrich), PGE2 at a concentration of 1 μM (HY-101952, MedChemExpress; in DMSO for a final concentration of <0.2%), or 0.5 mM 8-bromoadenosine 3′-5′-cyclic monophosphate (B7880, Sigma-Aldrich). Unless otherwise noted, media was changed daily during the decidualization process. Decidualization was begun when cells had reached approximately 80% confluency in six-well (9 cm2) culture plates unless otherwise stated.
For inhibitor experiments, in vitro decidualization was conducted with the addition of either 1 μM PTGER2 inhibitor (PF-04418948, Sigma), 1 μM PTGER4 inhibitor (ER-819762, Sellek), or 5 μM of the PKA inhibitor H-89 (B1427, Sigma). Concentrations were determined based upon published literature (PF-04418948: [45]; ER-819762: [46]; H-89: [47, 48]) and preliminary experiments.
Bulk RNA sequencing
Cells for RNA-seq analysis were prepared as outlined above and were treated in duplicate (base media; cAMP + MPA; PGE2 + MPA) or quadruplicate (MPA alone; PGE2 alone) for 6 days. The RNA was isolated from cells lysed using Qiagen Buffer RLT and was processed using the RNeasy Mini Kit (74104, Qiagen) according to the manufacturer’s specifications. Transcriptome libraries were generated from isolated RNA by the Yale Center for Genomic Analysis by using poly-A selection and were sequenced by using an Illumina HiSeq 2500 apparatus.
Sequencing reads were mapped to the Ensembl human transcriptome GRCh38 version 96 by using the pseudoalignment software kallisto (version 0.45.0; [49]). Transcript read counts were normalized by using the transcripts per million (TPM) metric [50] and were aggregated into gene-wise expression values for comparison between samples. The Pvclust software package [51] was used to ascertain the uncertainty in the hierarchical clustering of samples. Principal component analysis was conducted on a subset of TPM transcriptomes by only taking into consideration genes with an average expression of between 3 and 1000 TPM across all conditions.
Differential expression analysis was conducted using edgeR (version 3.34.0; [52]). The resulting differentially expressed genes were filtered to only those expressed at greater than 3 TPM, an operational threshold for active expression in bulk RNA-seq data [53]. Furthermore, only genes with a false discovery rate that is lower than 10−6 and an average fold change of greater than 1.5 between treatment and control (treatment/control expression >1.5 for upregulated, or control/treatment >1.5 for downregulated) were considered. Then, this list was subset to genes up- or downregulated in any one treatment, relative to base media treatment or under multiple treatment conditions, following a Venn diagram approach. For analyses that only took protein-coding genes into consideration, filtering using the Ensembl BioMart “protein_coding” gene-type annotation reduced the total number of genes from 35,571 to 19,968, and TPM were recalculated accordingly.
The K-means clustering of genes by square root-transformed TPM values was conducted to generate a number of clusters ranging from 2 to 14. Following silhouette score comparison, k = 9 clusters appeared to capture the most prominent patterns from our heatmap including all genes, so more extensive analysis was conducted on these nine clusters. Pathway analysis and gene ontology annotation were performed using the Enrichr database [54].
Single-cell RNA sequencing
Single-cell RNA sequencing was conducted on two independent batches of ESF decidualized in vitro for 2 or 6 days by daily administration of media containing 1 μM PGE2 and 1 μM MPA. Single-cell suspensions were prepared by a protocol modified from the 10X Genomics Sample Preparation Demonstrated Protocol for Cultured Cells (CG00054 Rev. B). Briefly, cells were rinsed with TrypLE express (12604, Thermo Fisher) and were treated with TrypLE express for 5–10 min at 37°C. Ten milliliters of the growth medium was added and the cells were pelleted by centrifugation for 5 min at 400g, then resuspended in 5 mL growth medium by pipetting up and down for 10–20 times. Next, an 18-gauge needle was used to transfer the cells onto a 40-μm strainer, and the flowthrough was centrifuged and resuspended in PBS containing 0.04% bovine serum albumin (A9647, Sigma). The resulting suspension was passed through a 30-μm cell strainer and was used for single-cell library preparation using the 10× Chromium platform (3′ chemistry, version 3) and was sequenced by using an Illumina NovaSeq apparatus for an average of 39,116 reads per unique capture bead barcode.
Initial alignment of raw sequencing reads to the human genome (GRCh38 3.0.0 preparation by 10× Genomics), filtering, barcode, and unique molecular indicator counting was conducted using 10× Genomics cellranger software versions 3.1.0 (replicate 1) or 5.1.0 (replicate 2). Resulting feature-barcode matrices were processed using scprep software version 1.0.5 (github.com/KrishnaswamyLab/scprep). In attempt to remove data points originating from beads that had captured ambient RNA (low library size), multiple cells (high library size), or cells having lost membrane integrity (disproportionately high mitochondrial genes), data were further thresholded based on library size at values after examination of distributions among cells (lower cutoffs of 4332, 3900, 5625, and 5414 features/cell and higher cutoffs of 20 380, 22 674, 17 647, and 43 252 features/cell for 2d replicate 1, 6d replicate 1, 2d replicate 2, and 6d replicate 2, respectively) and below the 93rd percentile of mitochondrial gene content of the library after examination of distributions (Supplementary Figure S2). Genes expressed in fewer than five cells from either sample were also excluded from the analysis. The final result from filtering was 6437 2-day cells and 6140 6-day cells for a total of 12 577 cells and 18 077 genes considered in downstream analyses.
Read counts were normalized to counts per million and were square root-transformed. Replicates of identical stages were combined by using mutual nearest neighbor matching to correct for batch effect [55]. Low-dimensional embedding was performed using PHATE (version 1.0.5; [56]) For the purpose of visualizing individual gene expression, denoising was performed by using MAGIC (version 2.0; [57]). The statistical dependency between genes was quantified by using k-nearest neighbor conditional density resampled estimate of mutual information (knn-DREMI: [57, 58]) where indicated.
Cells were partitioned using k-means clustering with increasing k parameters (Supplementary Figure S5), and the lowest number of clusters was chosen for which each prominent region of the embedding was partitioned into a unique cluster but before a precipitous drop in silhouette score. Marker genes for each cluster were identified using scprep’s differential expression function which performed Welch’s t-test between cells within and without each cluster. Cell cycle stage prediction [59] was calculated using built-in functionality of scanpy (v1.7.2; [60]). Automated annotation of single cells with their most similar bulk RNA-seq treatment condition out of base media, PGE2 + MPA, or cAMP + MPA was performed using SingleR (v1.0.6; [61]), which identified one end of the trajectories to be most ESF-like (highest similarity to base media-treated ESF). This predicted trajectory was further scrutinized by using RNA velocity, first by identifying spliced and unspliced reads using the velocyto pipeline [62] and then using the scVelo algorithm (v0.2.3; [63]) with the algorithm’s stochastic model of transcriptional dynamics for plotting and dynamical model for latent time calculation. Velocity-informed terminal cell states and absorption probabilities [64] were calculated using CellRank (v1.3.1; [65]).
Quantitative PCR
Quantitative real-time PCR (qPCR) was conducted to quantify transcript abundance using the Thermo Fisher TaqMan assay system with the following commercial probes of standard sequence: human TBP (Hs99999910_m1), human PRL (Hs04987233_m1), human IGFBP1 (Hs00236877_m1), human PTGER2 (Hs00168754_m1), and human PTGER4 (Hs00168761_m1). The complementary DNA (cDNA) libraries were constructed by using the High-Capacity cDNA Reverse Transcription kit (4368814, Applied Biosystems) from RNA isolated as was done for bulk sequencing (RNeasy Mini Kit; 74104, Qiagen). PCR was executed on a StepOne Plus Real Time PCR System 482 (Applied Biosystems).
PCR reactions were ran in sets of three technical replicates unless otherwise noted. Expression of target genes was quantified as linear expression relative to that of the endogenous control TBP (E):
 |
where the mean Ct value of the gene of interest (GOI) was subtracted from the mean Ct value of TBP to yield ΔCt. Error values (bars plotted as ±1 standard deviation) were calculated by propagation of uncertainty through the aforementioned equation. Differences of sample mean delta Ct values by treatment were estimated by using analysis of variance. Pairwise comparisons between treatment conditions were then made using Tukey’s Honestly Significant Difference method and were depicted in plots using the letter-based system developed by Piepho [66], where non-overlap of letters indicates a P value of <0.05.
Senescence-associated β-galactosidase
Immortalized (CRL-4003) or primary (HsESF_217S) human ESF were cultured in base differentiation media, with one of the following sets of additives: none (control), 1 μM MPA, 1 μM MPA plus 1 μM PGE2, or 1 μM MPA plus 0.5 mM cAMP. Media was replenished daily over the course of 3 (visualization only) or 6 days. At the end of the time course, senescence-associated β-galactosidase (SAβG) activity was ascertained using a chromogenic (5,5′-dibromo-4,4′-dichloro-indigo) staining kit (9860S, Cell Signaling) or quantitative fluorimetric assay (CBA-231, Cell Biolabs) following the manufacturer’s instructions. In the chromogenic protocol, cells were rinsed in PBS and were treated with fixative solution for 10–15 min, rinsed with PBS twice, incubated overnight in staining solution at 37°C, and thereafter imaged. For the fluorimetric assay, cells grown in 24-well plates were processed following the manufacturer’s specifications. Fluorescence was measured on a Modulus II plate reader with UV module, with an excitation wavelength of 365 nm and emission wavelength of 460 nm. Protein from cell lysates was quantified using a Pierce BCA Protein Assay Kit (23225, Thermo Fisher) according to the manufacturer’s specifications and was measured on a Modulus II plate reader with an absorbance wavelength of 560 nm. Pairwise significance values were determined via t-test.
Results
Progestin + PGE2 treatment activates classical hallmarks of decidualization
Immortalized human ESF were treated with either progestin (MPA) and/or PGE2, progestin and cAMP, or with base culture media alone. The PGE2 + MPA treatment induced a morphological change from an elongate fusiform morphology to a more laterally expanded shape (Figure 2a). The expression of key decidual marker genes prolactin (PRL) and insulin-like growth factor-binding protein 1 (IGFBP1) were upregulated to a similar extent in response to both treatments as determined by qPCR (Figure 2b). The PGE2 + MPA effect on PRL was non-additive in that the effect was only observed in the presence of both ligands, whereas the effect of MPA alone was insignificant and that of PGE2 alone was significant but negligible. The IGFBP1 responded to PGE2 alone but not to MPA alone.
Figure 2.
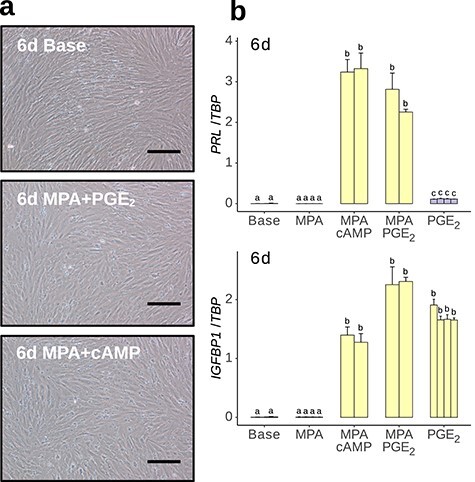
In vitro decidualization of human ESF using PGE2 + MPA. (a) Cells treated with culture media for 6 days (6d Base) retained spindle morphology, whereas cells treated with MPA plus PGE2 or cAMP for 6 days became more globular. Scale bar = 20 μm. (b) qPCR quantification of decidual markers PRL and IGFBP1 in response to various decidualization regimes, measured as linearized expression relative to control gene TBP. Technical n = 3 for all conditions.
PGE2 + MPA and cAMP + MPA treatments affect overlapping sets of genes
Bulk transcriptome sequencing was conducted on cells exposed to both decidualization regimes for 6 days as well as to a base media control. Hierarchical clustering, correlation, and covariance analyses (Supplementary Figure S1a–c) found that PGE2 + MPA-treated cells clustered with cAMP + MPA-treated cells, then with PGE2-only-treated cells, to the exclusion of the base media and MPA-only control groups. Of all treatment pairings, MPA + cAMP and MPA + PGE2 treatments lay closest to each other in expression space by Euclidean distance (Supplementary Figure S1d). Principal component analysis (Figure 3a) was used to visualize the collective similarity of the three gene expression states. Transcriptomes were found to separate along the first two principal component axes grouping primarily by treatment condition. The first axis, explaining 33.8% of variance, separated the two deciduogenic treatments from the control treatments. The second principal component axis, explaining 24.3% of the variance, separated the three MPA-containing treatments from the base media treatment and also from the PGE2-alone treatment.
Figure 3.
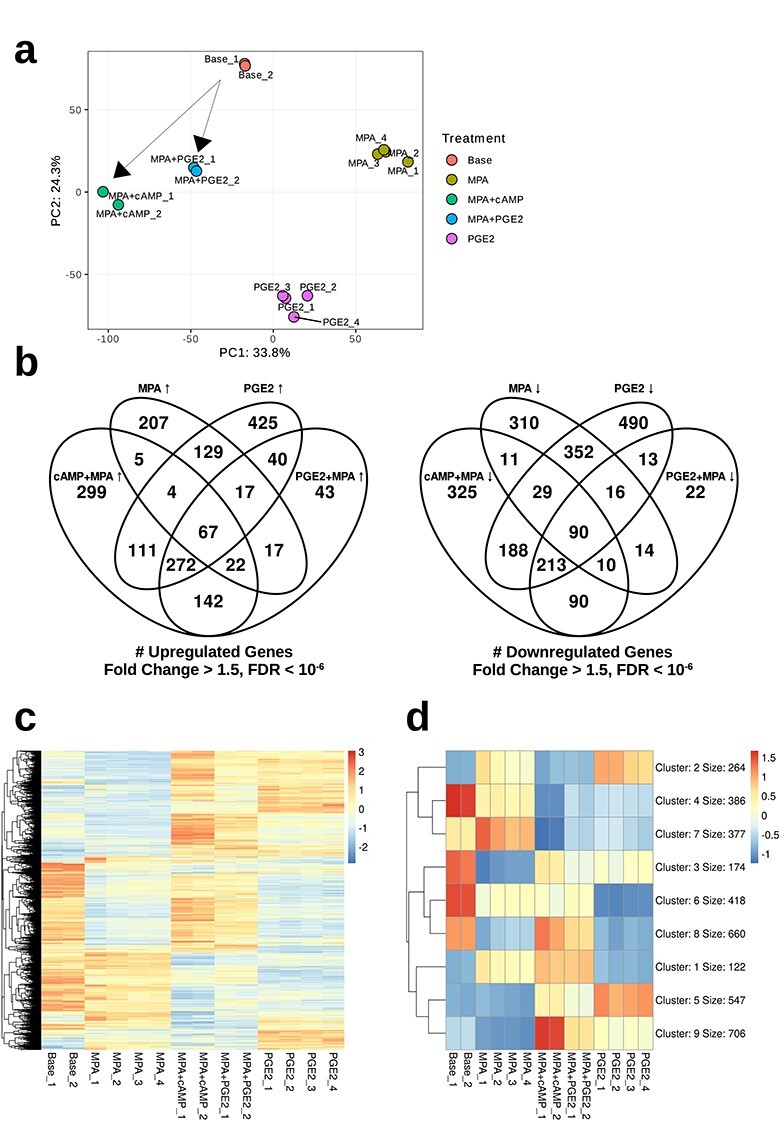
Bulk RNA sequencing analysis. (a) Principal component analysis conducted on protein-coding genes. Transcriptomes cluster by treatment. Arrows drawn represent putative decidualization trajectories. (b) Venn diagrams of genes differentially upregulated or downregulated in response to cAMP + MPA or PGE2 + MPA treatments with respect to control treatments. (c) Heatmap of differentially expressed protein-coding genes. (d) K-means clustered (k = 9) heatmap of differentially expressed protein-coding genes showing major patterns of comparative gene expression among the treatment conditions.
Differential gene expression analysis was conducted on all pairings of the four treatment regimes with the base media group. There was substantial overlap of 503 genes found to be upregulated under cAMP + MPA treatment (55% of 922 genes) as well as under PGE2 + MPA treatment (81% of 620 genes) (Figure 3b). Top genes following this pattern belonged to the gene sets “BMP2-WNT4-FOXO1 pathway in human primary endometrial stromal cell differentiation” (WP3876, P = 7.7 × 10⁻¹⁰) and “TGF-beta signaling pathway” (KEGG, P = 1.3 × 10⁻⁵). The overlap of downregulated genes (403 of 956, 42%, under cAMP + MPA, and 403 of 468, 86%, under PGE2 + MPA) was similarly large. In both cases, the set of genes differentially expressed in response to cAMP + MPA treatment was larger than the number of genes uniquely responsive to PGE2 + MPA (419 vs. 117 genes uniquely upregulated, and 553 vs. 65 genes uniquely downregulated). This asymmetrical pattern suggests that cAMP is inducing expression of genes that are not affected by PGE2. Next, the question arose whether the similarities between cAMP + MPA and PGE2 + MPA treatment groups was due to their shared use of progestin, or the fact that both activated cAMP-PKA signaling. Comparison to PGE2-alone and MPA-alone control groups revealed that a large number of genes were shared between the two deciduogenic treatments and PGE2 alone (329 up and 303 down) compared to those shared between the deciduogenic treatments and MPA alone (89 up and 100 down). Pathways shared with PGE2 alone included “cAMP-mediated signaling” (GO:0019933, P = 2.3 × 10⁻²) and “cAMP catabolic process” (GO:000619, P = 1.9 × 10⁻²) such as the phosphodiesterase enzymes PDE4B, PDE4D, and PDE3A, as well as “prostaglandin synthesis and regulation” (WP98, p = 1.1 × 10⁻⁴) pathway genes prostaglandin F receptor PTGFR, prostaglandin H synthase 1 PTGS1, and prostaglandin E synthase PTGES.
Both PGE2 + MPA and cAMP + MPA activate the decidual cell core regulatory network
Hierarchical clustering of differentially expressed genes (Figure 3c) revealed several prominent patterns of gene expression under deciduogenic, MPA, and PGE2 treatments. To investigate this further, k-means gene clustering was conducted over a range of hyperparameters from k = 2 to k = 14 clusters. Data were best represented by nine major patterns of differential gene expression between the five treatment conditions, as more granular clustering resulted in a precipitous drop in silhouette score (Supplementary Figure S1e). The full output from this analysis is provided in Supplemental Data.
Four of the resulting gene clusters represented genes lowly expressed in the base media-treated group, and becoming activated in response to various treatments, whereas five represented genes moderately to highly expressed in ESF but downregulated in response to either cAMP + MPA, PGE2 + MPA, PGE2, or MPA treatment (Figure 3d). Of the former, cluster 1 included 122 genes which were generally upregulated in response to any of the treatments which contained MPA but not to PGE2 alone. This included prostaglandin-related genes, such as PTGER2 and prostaglandin D synthase PTGDS, as well as the decidual marker zinc finger and BTB domain-containing protein 16 ZBTB16. As may be expected for progestin response genes, the “Nuclear Receptors Meta-Pathway” (WP2882, P = 1.9 × 10⁻²) was enriched in this cluster. Cluster 2 contained genes associated with MPA-alone and PGE2-alone treatment but lacked a distinguishing functional pattern besides mitochondrial and ribosomal genes.
Major genes upregulated in response to deciduogenic treatments relative to the base media treatment group were split across two clusters, cluster 9 and cluster 5. Cluster 9 included 706 genes which generally were expressed in response to both deciduogenic regimes (occasionally to a greater degree in cAMP + MPA than in PGE2 + MPA) but were less affected by PGE2 or MPA alone. This cluster included several of the genes that have been identified as belonging to the decidual cell-type’s core gene regulatory network [6, 67], including transcription factors forkhead box protein O1 FOXO1, homeobox A11 HOXA11, heart- and neural crest derivatives-expressed protein 2 HAND2, Krueppel-like factor 9 KLF9, and zinc fingers and homeoboxes protein 2 ZHX2 (Supplementary Table S2). This cluster also included some effector genes encoding signaling peptides associated with decidual cells, such as PRL, IGFBP1, left–right determination factor 2 LEFTY2, and WNT4. The consistency of this pattern suggested that a true differentiation to the decidual cell type had taken place in both deciduogenic treatment regimes. Another group of 547 genes, cluster 5, showed a pattern of elevated expression following cAMP + MPA, PGE2 + MPA, as well as PGE2-only treatments, but not in response to base media or MPA alone. This included decidual transcription factors, Meis homeobox MEIS1, odd-skipped-related 2 OSR2, nuclear receptor 4A2 NR4A2, and zinc finger protein 331 ZNF331, as well as signaling genes such as bone morphogenetic protein 2 BMP2 and the decidual marker somatostatin SST. Gene sets enriched in clusters 5 and 9 included “TGF-beta signaling pathway” (KEGG, cluster 5 P = 1.2 × 10⁻², cluster 9 P = 2.1 × 10⁻³) as well as an endoplasmic reticulum-associated gene set, including “protein processing in endoplasmic reticulum” (KEGG, cluster 5 P = 1.2 × 10⁻⁶, Clutser 9 P = 4.1 × 10⁻³) and “response to endoplasmic reticulum stress” (GO:0034976, cluster 5 P = 4.5 × 10⁻⁴, cluster 9 P = 7.2 × 10⁻³). Genes associated with the lysosome (KEGG, cluster 5 P = 5.3 × 10⁻⁶, cluster 9 P = 1.8 × 10⁻³) also followed this pattern, such as α-galactosidase GLA, alpha and beta mannosidases MAN1A1 and MANBA, and fucosidase FUCA1, in cluster 5, and FUCA2 and MAN2A2 in cluster 9. Several of the decidual genes in cluster 5 were also upregulated by PGE2-only treatment, possibly indicative of genes responding to generic cAMP-PKA activation. These included genes functioning in “negative regulation of cAMP-dependent protein kinase activity” (GO:2000480, P = 2.7 × 10⁻²) such as cAMP-dependent protein kinase inhibitors, PKIA and PKIG, as well as regulatory subunits of PKA PRKAR1A and PRKAR2B: this may reflect the existence of negative feedback mechanisms.
The other identified gene clusters consisted of genes highly expressed in ESF to begin with. Clusters 4 and 7 included genes which tended to be downregulated by both deciduogenic regimes and by PGE2 alone (i.e., the cAMP pathway-activating treatments) but not by MPA alone. Pathway analysis of cluster 4 genes returned terms primarily associated with cell proliferation, including “cell cycle” (KEGG, P = 1.3 × 10⁻⁵), “DNA replication” (KEGG, P = 4.3 × 10⁻⁶), and “mitotic sister chromatid segregation” (GO:0007052, P = 7.2 × 10⁻⁹) and genes related to the cytoskeletally mediated cell division functions, including thrombospondin-2 THBS2, tubulins TUBB6, TUBB4B, TUBA1A, and TUBA1C. Cluster 7 contained 377 genes with a similar signal of cell cycle (“cell cycle,” KEGG, P = 1.6 × 10⁻³) in addition to genes having to do with translation such as the aminoacyl-tRNA synthetases WARS, YARS, MARS, GARS, and SARS. This cluster also included genes involved in epithelial–mesenchymal transition, such as periostin POSTN and SLUG SNAI2, which both exhibited markedly decreased expression in all three cAMP-activating treatments: POSTN was particularly outstanding with an average expression of greater than 50 TPM in base or MPA treatment groups and lesser than 1 TPM in cAMP + MPA and PGE2 + MPA groups. Furthermore, genes mediating cellular interactions, such as “tight junction” (KEGG, P = 1.3 × 10⁻²) and “focal adhesion” (KEGG, P = 1.6 × 10⁻³), including collagen VI COL6A1, COL6A2, and COL6A3, the hyaluronan-mediated motility receptor HMMR, ezrin EZR, and the claudin TMEM47, showed reduced expression following this pattern. This cluster also included the PGE2 receptor, PTGER4. In summary, gene clusters 4 and 7 suggested that cell cycle exit and changes to cell–cell and cell-matrix adhesive properties are gene network responses of ESF to both direct and indirect (via PGE2) cAMP-activating deciduogenic treatments.
Biology of the remaining gene clusters was more subtle. Cluster 3 included 174 genes for which MPA-alone and PGE2 + MPA treatment generally led to stronger downregulation than cAMP + MPA such as growth factors, such as pleiotropin PTN, neuregulin NRG1, and the GDNF receptor GFRA1. Osteopontin SPP1, associated with extracellular matrix production during decidualization, also shared this pattern. Cluster 6 comprised 418 genes downregulated in response to decidualization and to PGE2 alone, including those involved in “integrin-mediated cell adhesion” (WP185, P = 8.9 × 10⁻³) as well as genes regulated by the transcription factors JUN and FOS (ENCODE TF ChIP-seq 2015, FOSL2 SK-N-SH hg19 P = 3.4 × 10⁻⁸, FOSL1 K562 hg19 P = 3.7 × 10⁻⁵, JUND HeLa-S3 hg19 P = 2.5 × 10⁻⁴), whereas cluster 8 consisted of genes with greatest expression in base media and cAMP + MPA groups, including the notch receptors NOTCH1 and NOTCH3 as well as the SRY-related HMG-box transcription factor SOX4.
Markers of senescent cells preferentially induced by cAMP + MPA
Decidualization has been suggested to lead to two fates, decidualization and senescence, with both playing important biological roles in implantation [42, 43]. Specifically, these senescent decidual cells have been shown to arise in vitro after 4 days of cAMP + MPA stimulation [43]. To determine whether a similar population was being produced in response to PGE2 + MPA, transcriptomic markers for the senescent decidual state were examined. These markers included ABI family member 3-binding protein ABI3BP, A disintegrin and metalloproteinase with thrombospondin motifs 5 ADAMTS5, cell migration-inducing and hyaluronan-binding protein CEMIP (a.k.a. KIAA1199), clusterin CLU, type II iodothyronine deiodinase DIO2, insulin-like growth factor 2 IGF2, lumican LUM, epididymal secretory protein E1 NPC2, and the SRY-related HMG-box transcription factor SOX4 (Supplementary Table S3). Several of these genes showed elevated expression under both deciduogenic regimes but to a greater degree under cAMP + MPA, whereas others, such as ADAMTS5, CLU, and SOX4, were elevated in bulk transcriptomes only in cAMP + MPA-treated cells. The preferential elevation of this signature in cAMP + MPA decidualization compared to PGE2 + MPA treatment prompted further investigation of to what degree a senescent cell population existed in PGE2 + MPA-decidualized cells.
As a test for cellular senescence, fluorometric analysis of SAβG activity was conducted on ESF treated for 6 days with base media, cAMP + MPA, PGE2 + MPA, or MPA alone (Figure 4). In immortalized cells (Figure 4a), both cAMP + MPA and PGE2 + MPA treatments significantly increased this metric of cellular senescence relative to base treatment (+159%, P = 3.2 × 10⁻⁴ and +67%, P = 1.4 × 10⁻³), where cAMP + MPA-treated cells were induced to a greater degree than PGE2 + MPA (P = 1.3 × 10⁻²). By contrast, MPA treatment alone had a minimal, only a marginally significant effect (+10%, P = 4.5 × 10⁻²) To rule out the possibility of an artifact related to immortalization, the experiment was repeated with a primary cell line (Figure 4b). In these cells, cAMP + MPA, but not PGE2 + MPA treatment, elevated the senescence signal relative to base media (+77%, P = 3.0 × 10⁻² vs. +5%, P = 7.4 × 10⁻¹), whereas MPA alone induced lower senescence signal than base treatment (−44%, P = 4.9 × 10⁻³).
Figure 4.
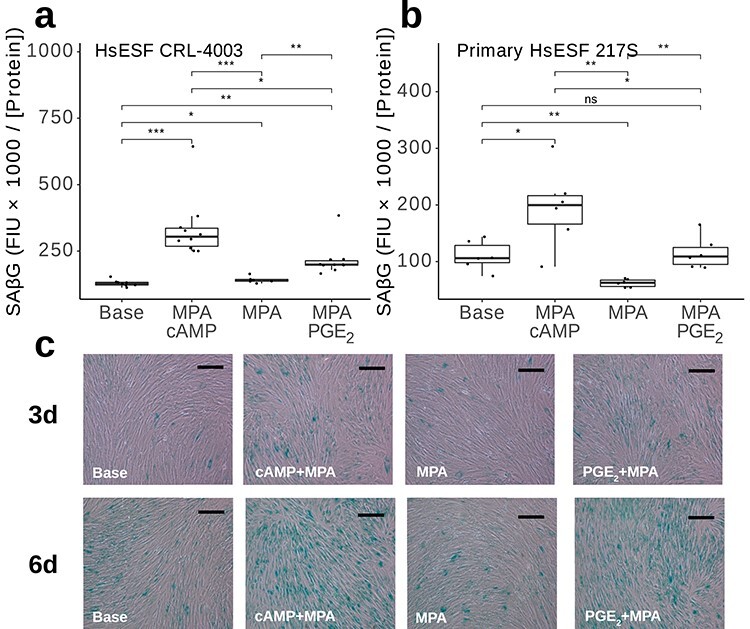
SAβG assays. (a, b) Fluorimetric quantification of SAβG in Fluorescence Intensity Units (FIU) divided by protein concentration in μg/μL for major treatments plus 250 nM dasatinib (Das) have been indicated by using immortalized (a) and primary (b) human ESF. t-test P values: ns: P > 0.05; *: P ≤ 0.05; ** P ≤ 0.01; ***: P ≤ 0.001. (c) Representative images of chromogenic SAβG assays on immortalized human ESF treated for 3 and 6 days as indicated. Scale bars = 20 μm.
A chromogenic test for SAβG activity was also conducted at 3- and 6-day time points (Figure 4c). Qualitatively, these demonstrated a pattern of increased SAβG+ staining overall at day 6 relative to day 3 and recapitulated the pattern of higher staining in PGE2 + MPA and cAMP + MPA-treated cells versus MPA-alone and base media treatments. We interpret this result as indicating that, under both deciduogenic treatment regimes, the cells experience cellular stress, possibly caused by the energy demand associated with transcriptional reprogramming, but given the reduced signal of senescence under PGE2 + MPA treatment from both bulk RNA-seq and SAβG assays, we further sought to evaluate the presence of senescent cells via single-cell RNA-seq.
Single-cell transcriptomic analysis of PGE2-induced decidualization
To gain a more detailed picture of PGE2-mediated decidualization, cell cultures were subjected to single-cell transcriptomic analysis after 2 and 6 days of PGE2 + MPA treatment. This design was chosen because according to Lucas et al. [43], senescent cells start to arise after 4 days of decidualization. Single-cell transcriptomes were embedded in two dimensions using PHATE, where the majority of cells at both time points were found to fall along a continuous curve, the putative trajectory of decidualization (Figure 5). In order to identify a possible branching or differentiation point in the data, intrinsic dimensionality was calculated with the prediction that cells in transition between cell types would have more complex transcriptomes (higher intrinsic dimensionality), whereas differentiated states would have lower intrinsic dimensionality [68]. This analysis identified a single locus of cells ranked highest in intrinsic dimensionality toward one end of each curve (Figure 5a). This indicated that the major transcriptomic transition was occurring in this region.
Figure 5.
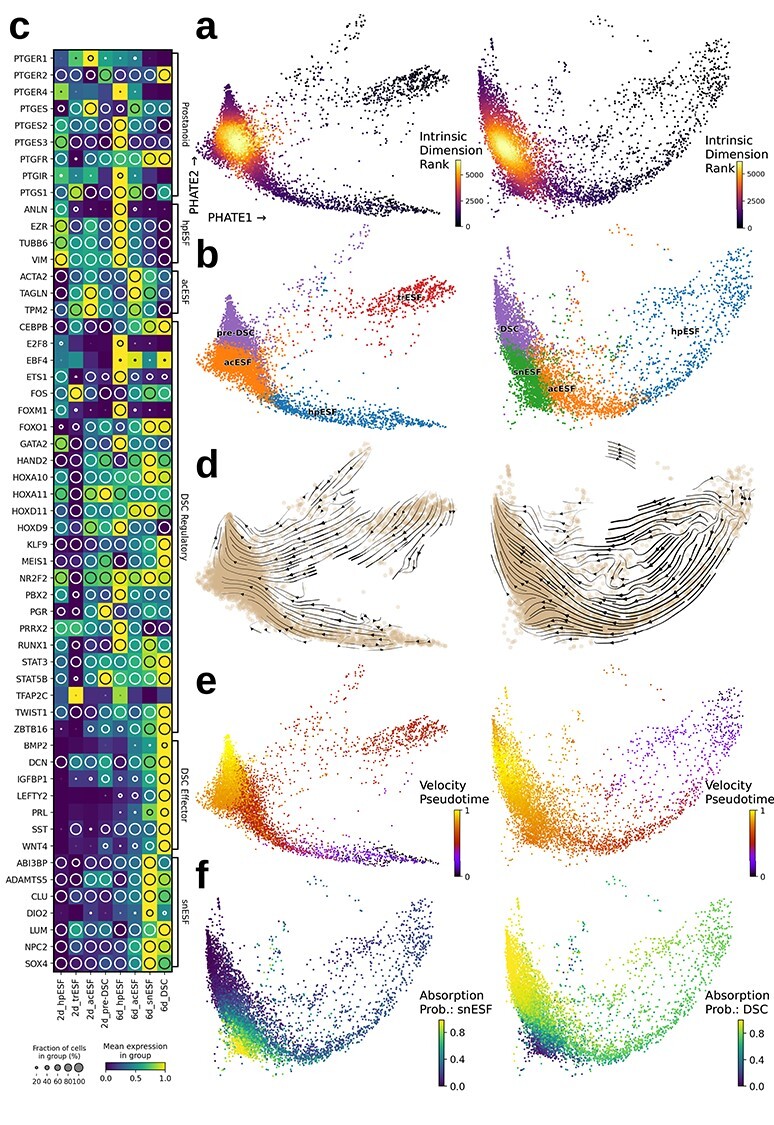
Single-cell clusters and their differentially expressed genes. (a) PHATE embedding of 2-day (left) and 6-day (right) DSC colored by intrinsic dimension (ordinal). (b) Labeled k-means cell clusters. (c) Normalized expression values of marker genes for identified clusters, with enclosed circle size corresponding to the percentage of cells expressing the gene at greater than 1 CPM. (d) RNA velocity stream embedding showing velocity-inferred direction of cellular state transition. (e) Velocity-informed pseudotime of cells showing progression toward. (f) Absorption probabilities for senescent (left) and mature (right) decidual end-points identified at day 6.
The next step was to identify which stages of ESF differentiation the cell states observed correspond to. Visualization of cell transcriptomes revealed that, at both time points, a sparse string of cells extended out to form a tail. The sparse tail leading into the more cell-dense area was hypothesized to represent ESF cells lingering in an undifferentiated state. This was tested by assignment of each cell to its transcriptomically most similar group from the bulk RNA-seq experiment, which revealed that the less-densely populated end of the curve was indeed most ESF-like (Supplementary Figure S3). Furthermore, cell-cycle phase inference revealed that cells at the tip of this sparse tail were actively cycling in either G2/M or S phase. By contrast, cells from the more densely populated end of the ordination plot were G1 phase, indicating an exit from active cell cycling (Supplementary Figure S4), and were most similar to PGE2 + MPA-decidualized bulk transcriptomes (Supplementary Figure S3).
Cells were partitioned into transcriptomically similar clusters by using k-means clustering (Figure 5b). The optimal number of clusters was determined manually to be 4 at each time point, after exploring a range of 2–10 (Supplementary Figure S5). The first partition recognized at k = 2 was roughly between the sparse tail of ESF-like cells and the rest, which presumably represented the exit from a proliferative state. For 2-day-treated cells, increasing to k = 3 partitioned off a subset of cells forming a second sparse tail and increasing to k = 4 created a division at the point of highest intrinsic dimensionality. For 6-day-treated cells, increasing to k = 3 created a division at the point of highest intrinsic dimensionality as well and increasing to k = 4 created a second division at this point. Further divisions either sharply reduced clustering silhouette scores or generated divisions which were not biologically interpretable divisions, so a total of four clusters was deemed to be the most meaningful classification of cells for both, the 2- and 6-day time points.
Differential gene expression analysis was used to identify marker genes for each cluster (Supplementary Data) and to explore expression of known markers of various DSC and ESF cell states (Figure 5c; Supplementary Figure S6). At the sparsely populated ESF-like end of the curve, ESF markers, such as VIM, EZR, and TUBB6 (Figure 5a), were most highly expressed at both 2 and 6 days. Furthermore, these cells also had a distinct cell cycle signature (e.g., GO:1901990, “regulation of mitotic cell cycle phase transition,” 2d P = 2.8 × 10⁻¹⁹, 6d P = 1.5 × 10⁻⁹), which is in agreement with the previous cell-cycle scoring result. Genes underlying this signal included the cytokinesis gene anillin ANLN (Figure 5a), which was previously identified as a marker of proliferative ESF [69], indicating a distinction between proliferation (highly proliferative ESF; hpESF) and differentiation. While regression out of cell cycle-associated genes is sometimes conducted in scRNA-seq analyses, it was not done here due to the potential to mask genuine biological signal [70] of a cell cycle-related nature of DSC differentiation.
The cluster of cells at the farthest end of the putative decidualization curve, above the transition point at 6 days, showed expression of decidual genes. This cluster was characterized by the gene set “BMP2-WNT4-FOXO1 Pathway in Human Primary Endometrial Stromal Cell Differentiation” (WikiPathways WP3876, 6d P = 3.3 × 10⁻³), indicating that these were indeed DSC. Decidual cell signaling peptides, such as PRL, IGFBP1, and LEFTY2, were expressed in this region along with decidual transcription factors appearing earlier, such as FOXO1 and HAND2, or later, such as KLF9 (Figure 5c). At 2 days, decidual regulatory markers were more lowly expressed but detectable at this end of the curve, although the genes considered to be decidual effector genes reached a much higher magnitude at 6 days (Figure 5c). At 2 days, the cluster at the decidual end of the trajectory were characterized by expression of FOXO1, decorin DCN, and the PGE2 receptor 2 (PTGER2), which was unexpressed in the more ESF-like cells, and therefore, this cluster was deemed to be pre-decidual (pre-DSC). Some of these cells also showed a signature of differential ribosomal gene expression (e.g., KEGG “Ribosome,” P = 6.4 × 10−61). This observation can be interpreted as a sign that cells are still undergoing reprogramming. An enigmatic sparse cluster observed at 2 days was found to express tumor suppressor p53 TP53 and the gene CDKN2A encoding the senescence marker p16INK4a, but notably, not the rest of the senescence-associated gene set identified by Lucas et al. [43], such as DIO2, SOX4, or ABI3BP, as well as the ribosomal gene signature (KEGG “Ribosome,” P = 4.8 × 10−48). These cells are labeled as possibly transient senescent ESF (trESF) in Figure 5 but were not the focus of further study, as ribosomal genes can obscure other biological patterns and are sometimes excluded from single-cell data analysis (e.g., [71]).
At both time points, a cluster of cells located at an intermediate position below the point of highest intrinsic dimensionality were also ESF-like, expressing some ESF markers, including tropomyosins TPM1 and TPM2 as well as alpha smooth muscle actin ACTA2 and transgelin TAGLN, but not the decidual markers PRL or IGFBP1 (Figure 5c). At both 2 and 6 days, this cluster was enriched in gene sets such as “regulation of cell migration” (GO:0030334, 2d P = 9.1 × 10⁻⁷, 6d P = 1.1 × 10⁻³), “homotypic cell-cell adhesion” (GO:0034109, 2d P = 6.4 × 10⁻⁸; 6d P = 1.2 × 10⁻⁸), “muscle contraction” (GO:0006936, 2d P = 6.7 × 10⁻¹⁷, 6d P = 6.2 × 10⁻⁵), and “wound healing, spreading of cells” (GO:0044319, 2d P = 8.2 × 10⁻⁴, 6d P = 5.8 × 10⁻³). This was interpreted as another pre-DSC state of ESF, and as it lies between the most ESF-like cells and the point of highest intrinsic dimensionality believed to resemble the transition to later-stage decidualization. To differentiate these early-stage decidualizing ESF from proliferative ESF, and in recognition of their gene expression profile reminiscent of contractile activated fibroblasts, we call them activated ESF (acESF).
Finally, marker genes of the senescent-/progesterone-resistant decidual cell state identified by Lucas et al. [43] were examined to see whether their expression characterized a subset of cells arising from our experiments with PGE2. Expression of most of these genes was at 2 days spread across the putative branch point at the decidual end rather than being exclusive to one clear endpoint, but at 6 days, several of these genes, including SOX4, ABI3BP, ADAMTS5, CEMIP, CLU, and DIO2, did become expressed in a small region at the corner of the curve abutting acESF cells and DSC; by increasing clustering granularity to k = 4, these cells could be partitioned into a distinct cluster which was termed senescent-like ESF or snESF cells. The emergence of the SOX4-associated gene program specifically after 6 days is supported by the finding that DREMI scores (a measure of the strength of interaction between two genes; [58]) between these genes and by the finding that the transcription factor SOX4 thought to regulate several of them [43] was increased at 6 days relative to 2 days in 6 out of 8 genes (Supplementary Table S4). In addition to the SOX4-associated gene set, these cells also gradated into the acESF, expressing shared marker genes such as THBS1 and TPM1. By contrast, other fibroblast markers, such as TPM2, ACTA2, and TAGLN, were more biased toward acESF. The SOX4high snESF cells also expressed a gene set enriched for the “phagosome” pathway (KEGG P = 1.5 × 10⁻⁵) and “PI3K-Akt signaling pathway” (KEGG P = 2.2 × 10⁻³). Notably, while ACTA2high TAGLNhigh-activated fibroblast-like cells were present at both 2 and 6 days, SOX4high snESF cells did not form a distinctly identifiable cluster at 2 days.
Having determined major gene expression patterns via marker gene identification and via comparison to bulk RNA-seq, directionality of the developmental trajectories was explored using RNA velocity, a method which takes advantage of mRNA splicing dynamics to use unprocessed mRNA to judge the nascent state of cells [62, 63]. This analysis revealed an overall direction of movement from the ESF to the DSC tail of the embedding, which is consistent with our interpretation above (Figure 5d). This method allowed for identification of basins of attraction, corresponding to more stable cell states. At 2 days, a basin of attraction was identified at the border between pre-DSC and acESF as well as one in the proliferative ESF tail exhibiting a spiral dynamic indicative of cell cycling. At 6 days, the hpESF basin of attraction had become less pronounced, whereas a prominent one at DSC had appeared. However, at 6 days, there was also a smaller basin of attraction corresponding to the most highly DIO2-expressing snESF visible at day 6 (Figure 5d). While velocity-informed pseudotime ranked these cells as earlier (less mature) than their later-on DSC counterparts, a fate-mapping analysis [65] found that although the vast majority of cells appear to progress toward DSC, cells which approach the most highly SOX4- and DIO2-positive snESF corner of the graph have a high absorption probability, or probability of remaining in the DIO2high snESF macrostate without transitioning to DSC (Figure 5f).
Velocity-informed gene ranking and cluster-based differential gene expression analysis were performed to tease apart genes within a cluster, which have unique transcriptional dynamics in that cluster from others. This analysis corroborated the previous differential gene expression analysis, for instance, identifying acESF cells as exhibiting dynamic changes to genes involved with muscle contraction (GO:0006936, 2d P = 4.1 × 10⁻², 6d P = 2.9 × 10⁻⁶) and wound healing (GO:0042060, 6d P = 1.4 × 10⁻²). For DSC, genes showing unique dynamics included the cAMP-degrading phosphodiesterases, such as PDE3A, PDE3B, and PDE4D (a possible source of feedback on cAMP activation), as well as decidual transcription factors FOXO1 and ZBTB16, all of which showed increased velocity in DSC, suggesting a continuing increase in transcription levels.
PGE2-mediated decidualization depends upon PTGER2 and PKA
A series of experiments was conducted to determine the signal transduction pathway by which PGE2 signaling led to decidualization. Of the two PGE2 receptors known to be expressed in vitro in ESF and DSC, PTGER2 was found to increase with latent time progression (sensu [63]) toward DSC, whereas PTGER4 decreased in acESF, snESF, and DSC (Figure 6a). Cells becoming snESF, however, did not show elevated expression of PTGER2. These findings suggested that PTGER2 activation, and possibly PTGER4 deactivation, has roles in PGE2-mediated decidualization and that a failure of PTGER2 activation is associated with the senescent cell fate.
Figure 6.
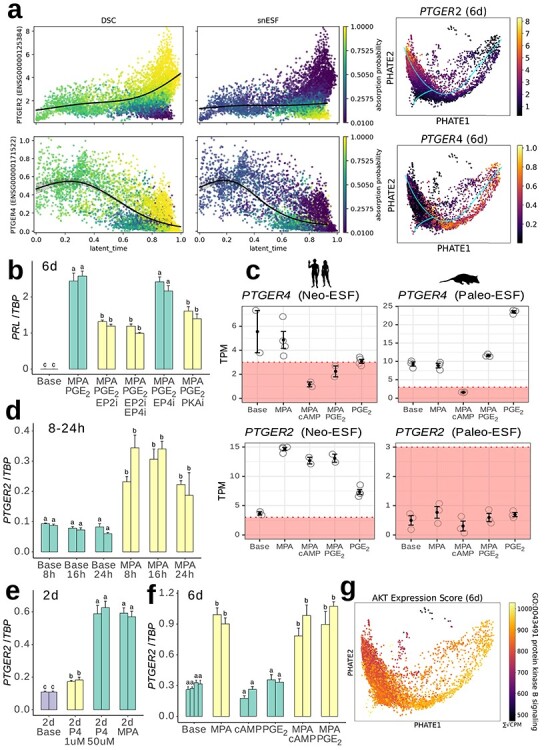
PTGER2 expression is upregulated by progestin and contributes to PGE2-induced decidualization. (a) Expression of PTGER2 (top) and PTGER4 (bottom) relative to latent time pseudotemporal progression toward DSC or snESF in 6-day single-cell data and colored by absorption probability to either DSC or snESF macrostates. Plots to the right show expression on PHATE ordinations. (b) qPCR of PRL in response to PGE2 + MPA decidualization plus inhibitors of PTGER2 (EP2i) or PTGER4 (EP4i), or PKA (PKAi). (c) Gene expression of PGE2 receptors 2 and 4 in human neo-ESF (top) and Monodelphis domestica paleo-ESF (bottom; data from [6]). (d–f) qPCR quantification of PTGER2 after 8–24 h (d), 48 h (e), or 6 days (f) indicated treatment. (g) Overall expression scores for AKT-related genes in 6-day DSC.
To investigate this further, in vitro PGE2 + MPA decidualization was conducted in the presence of the PTGER2 antagonist PF-04418948, the PTGER4 antagonist ER-819762 and H-89, an inhibitor of PKA. Treatment with PTGER2 inhibitor significantly reduced PRL expression by approximately 50% relative to PGE2 + MPA controls (Figure 6b). Treatment with PTGER4 inhibitor alone resulted in a non-significant 9% reduction in PRL expression. Treatment with PTGER4 inhibitor as well as PTGER2 inhibitor resulted in a 57% reduction in PRL expression, which was not significantly different from PTGER2 inhibitor alone. Administration of the PKA inhibitor H-89 significantly reduced PRL expression by 40%. From these results, we conclude that the deciduogenic effect of PGE2 is mediated through the PTGER2-PKA axis.
PTGER2 expression is under progestin control
Despite the demonstrated importance of PTGER2- to PGE2-mediated decidualization, bulk transcriptomic quantification revealed that PTGER2 is expressed below functional levels in cultured ESF, while PTGER4 is more consistently above threshold levels (Figure 6c). However, the PTGER2 gene clearly became turned on after progestin treatment, as evidenced in bulk RNA sequencing, which showed an approximate quadrupling of PTGER2 RNA from ~3 TPM after control treatment to ~12 TPM after treatment with MPA in combination with either PGE2 or cAMP, or ~14 TPM after treatment with MPA alone. The MPA-induced induction of PTGER2 has been found to be absent in the paleo-ESF cell type from the opossum: analysis of previously published transcriptomes from opossum paleo-ESF treated with MPA alone, MPA + PGE2, PGE2 alone, or MPA + cAMP [6] revealed that PTGER2 expression was unaffected by the presence of progestin, and in all cases, remained below the operational threshold for being considered actively expressed (Figure 6c).
In order to judge the speed at which PTGER2 induction can take effect, a short time course of 8, 16 and 24 h time points revealed that PTGER2 expression is significantly induced within 8 h of progestin treatment (Figure 6d). Progestin-induced PTGER2 was further interrogated by comparison between physiological progesterone (P4) and MPA. The human progesterone receptor is known to have an affinity for MPA of approximately 25–135 times its affinity for P4 [72]. Accordingly, treatment of human ESF with the same concentrations of P4 and MPA for 48 h resulted in a much lower induction of PTGER2 in the P4-treated cells (Figure 6e). However, a dose correction from 1 to 50 μM entirely compensated for this affinity difference (Figure 6e), suggesting that the difference between the two ligands is primarily in strength and not in kind of interaction to induce production of PTGER2. Finally, the specific effect of MPA in inducing PTGER2 was tested by comparison of PTGER2 expression of cells treated for 6 days with base media, MPA ± cAMP or PGE2, and the two ligands alone (Figure 6f). Neither cAMP nor PGE2 alone was sufficient to influence PTGER2 expression. Finally, the overall expression of genes belonging to the gene ontology category “protein kinase B signaling” (GO:0043491), a downstream pathway of PTGER4 signaling, was examined in the 6-day PGE2 + MPA decidualization single-cell data, which revealed decreasing expression toward the decidual end of the curve (Figure 6g).
Discussion
In this study, we have investigated the biology of PGE2 + MPA-induced in vitro decidualization. This investigation was motivated by the hypothesis that progesterone and PGE2 likely are the minimal ancestral deciduogenic signals (see “Background and evolutionary scenario” section). This hypothesis is based on a model where decidual cells evolved in a physiological context consisting of post-ovulatory ovarian hormones and an inflammatory paracrine environment induced by embryo attachment. Intersecting these signals with known deciduogenic stimuli led us to the hypothesis that progesterone and PGE2 were part of the signaling network during the evolutionary origin of the decidual cell type. We acknowledge that decidualization further evolved after its origin and that human decidualization is more complex than the hypothesized minimal ancestral network.
Progesterone and PGE2 are sufficient for human decidualization
We found that in vitro PGE2 + MPA treatment alone is sufficient to cause the hallmarks of decidualization. Mechanistically, our results suggest that PGE2-mediated decidualization depends on the induction of PTGER2 by progesterone and, consistent with previous findings [73], proceeds via the PTGER2-cAMP-PKA axis, while the dominant PGE2 receptor in ESF, PTGER4, is downregulated. This progestin-dependent upregulation of PTGER2 is not found in opossum paleo-ESF and thus is likely one of the gene regulatory innovations underlying the evolutionary origin of DSC, a cell type limited to placental (eutherian) mammals.
Whereas pre-genomic studies of PGE2-mediated decidualization only performed marker gene and morphological assessment [8, 73], the whole- and single-cell transcriptome approach used here paints a more complete picture. The transcriptomic response of ESF to PGE2 + MPA comprised of the widespread activation of genes in the core regulatory network of DSC (Supplementary Table S2). This is consistent with a model where PGE2 and progestin are part of the core regulatory network for DSC cell-type identity. This conclusion is also supported by the results of our single-cell transcriptomic analysis, which identified a hotspot of cells with high-complexity transcriptomes separating apparently mature DSC from more fibroblast-like cells (Figure 3a).
PGE2 signaling through PTGER2 versus PTGER4
Secreted PGE2 is bound by G protein-coupled receptors in the membrane of the receiving cell. Among the eight members of the prostanoid receptor subfamily, four paralogous receptors are specific for PGE2: PTGER1, PTGER2, PTGER3, and PTGER4 [74]. In a resting ESF in culture, only one of these, PTGER4, is expressed above the operational threshold for a gene to be considered actively transcribed in human ESF (e.g., in data from [75]) and is found in the majority of an 11-species eutherian ESF sample (Figure 1). We find that another PGE2 receptor, PTGER2, becomes expressed in human ESF after exposure to progestin.
PTGER2 is adapted to receive sustained PGE2 stimulus, whereas the PTGER4 response is transient and self-limiting [76]. PTGER4 undergoes more rapid desensitization to ligand binding [77], on the order of minutes, due to the action of an additional C-terminal protein domain that is absent in PTGER2 [78]. Therefore, it is likely that the sequence of events is as follows (Figure 7): at first, PTGER4 is expressed and PTGER2 is absent. Progesterone (produced in vivo by the corpus luteum after ovulation) induces PTGER2. The PGE2 (induced after embryo attachment) increases and PTGER4 becomes quickly desensitized, and signaling through PTGER2 becomes dominant. Indeed, in our bulk RNA-seq data, PTGER4 expression was reduced in response to PGE2 + MPA or cAMP + MPA treatment from an average of 5 TPM to 2 or 1 TPM, respectively, but not by MPA treatment alone. Single-cell data also supported this sequence of events, where PTGER2 was expressed at the mature decidual end of the curve and, by contrast, PTGER4 was unexpressed in PRL+ cells.
Figure 7.
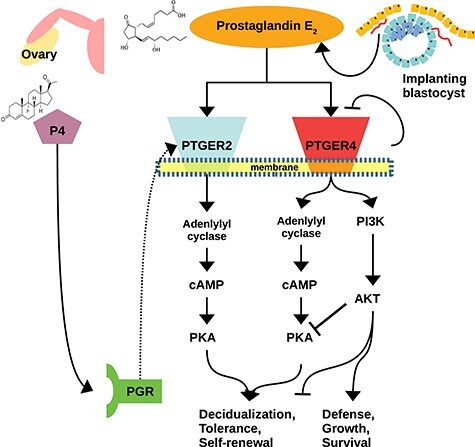
Schematic diagram of induction of decidual cell differentiation. Self-limitation of PTGER4, plus P4-induced transcriptional upregulation of PTGER2, result in a transition to a PKA-dominated, rather than AKT-dominated, signaling state.
Progestin-dependent expression of PTGER2 has previously been reported in human cells [73]. Dependence of PGE2 receptor activation (i.e., PTGER2) has also been found in the rabbit [79] (Stadtmauer and Wagner, unpublished) and dog [41]. Both PTGER2 and PTGER4 are G protein-coupled receptors that signal through the Gαs subunit, which activates adenylyl cyclase to produce cAMP. However, PTGER4 activates an additional signal transduction pathway, phosphoinositide 3-kinase/protein kinase B (PI3K/AKT), which opposes decidualization [1, 80]. Of the two kinases, PTGER4 favors AKT [81], whereas PTGER2 is specific for PKA [82]. Decidualization is therefore unlikely to be inducible by PTGER4 signaling alone, given the demonstrated necessity of PKA signaling. Instead, it is likely that upon induction of PTGER2 and desensitiziation of PTGER4, preferential signaling through PTGER2 favors a PKA-dominated intracellular state, and thus, promotes decidualization.
The PTGER2 has been described as the least abundantly expressed of the four paralogous PGE2 receptors [83], suggesting that its physiological role is more specialized. In pulmonary fibroblasts, PGE2 signaling inhibits PI3K/AKT signaling through PTGER2 [84]. The same antagonistic mechanism may channel decidualizing endometrial stromal cells away from a more myofibroblast-like or stressed ESF state toward DSC. In our single-cell expression data, PTGER2 was associated with the mature decidual end of the decidualization curve and had little to no intersection with markers of the acESF state (Figure 6a). Furthermore, the decreasing pattern of AKT-related gene expression (Figure 6g) is consistent with a transition away from a PI3K/AKT-dominated state. At a post-translational level, phosphorylated (activated) AKT has been shown to decrease in cells decidualizing under the influence of progesterone, but phospho-AKT is elevated in the absence of progesterone or in the presence of progesterone plus a PKA inhibitor [48]. This supports the notion of a progesterone-/PGE2-dependent mechanism for shifting the balance from AKT-dominated to PKA-dominated state such as the one proposed here.
Cellular heterogeneity and PGE2-driven decidualization
Decidual cell heterogeneity is the hypothesis that decidualization gives rise to multiple cell types, multiple states of the same cell type, or both. Different cell populations may coexist at the same time and fulfill distinct functions, compatible with the notion of temporal phases, including an early pro-inflammatory and later mature decidual state [1, 75, 85].
Single-cell RNA sequencing studies of the peri-implantation fetal–maternal interface [71, 86] support the model of decidual cell heterogeneity, with each partitioning DSC-like cells into three distinct transcriptional clusters. In the analysis by Vento-Tormo et al. [86], these included a cluster lacking PRL and IGFBP1 expression but expressing ACTA2 and TAGLN. These are markers of the ESF cells identified in our study termed acESF. In addition, Vento-Tormo et al. [86] describe two kinds of mature decidual cell populations characterized by expression of standard markers, PRL and IGFBP1, although to a higher degree in one cluster with the other expressing markers, such as LEFTY2 and IL15. Notably, LEFTY2 was one of the genes that we found to be more highly elevated in PGE2 + MPA treatment than cAMP + MPA, and the majority of the DSC cluster identified at 6 days were LEFTY2+ and IL15+, with an offshoot more highly expressing PRL and SST. The authors implied a possible identification of the LEFTY2+ cluster as senescent DSC, although this identification remains to be elaborated [86]. Our LEFTY2+ cells from in vitro PGE2 + MPA treatment lack expression of the putative senescence markers, so it is unlikely that all DSC we observed are senescent. In the analysis by Suryawanshi and colleagues, the three subtypes of DSC were analyzed explicitly as a developmental trajectory, with one being an intermediate, more ESF-like starting point, an ACTA2+ and TAGLN+ state, and a canonical decidual state expressing PRL and IGFBP1. Overall, comparison between the present study and the two in vivo analyses suggests that the most robust pattern is the identification of canonical PRL+ IGFBP1+ DSC and an ACTA2+ TAGLN+ cell, we deem acESF, as well as a residual population of proliferative ESF.
The leading form of decidual cell heterogeneity discovered in vitro is what has been labeled as the senescent decidual cell state, which is proposed to have a physiological role in decidual development [42] as well as a pathological role in recurrent pregnancy loss [43]. According to this theory, development of DSC along a senescence pathway promotes tissue turnover and makes room for the implantation of the blastocyst and is aided by the active phagocytic and cytolytic removal of senescent stromal cells by uterine natural killer cells. Single-cell transcriptomic studies of in vitro decidualized human ESF revealed a trajectory splitting event at 4 days of decidualization after which “mature” and “senescent” decidual cells diverge [43]. This result was obtained using the cAMP + MPA decidualization protocol.
Our single-cell experiments on PGE2-mediated decidualization focused on 2- and 6-day time points to bracket this splitting event [43], and indeed, after 6 days, a population of cells expressing the SOX4-associated gene set reported by Lucas et al. [43] appeared. Cell fate mapping analysis based upon RNA velocity identified this as a relatively weak attractor compared to DSC but nevertheless a potential alternative state to DSC. Importantly, the cells identified as most likely terminal cells (Supplementary Figure S7) did not highly express decidual marker genes, either regulatory such as FOXO1 or signaling such as PRL; the expression of these genes within cells belonging to the snESF cluster was mostly due to those which were closer to the identified transition point to DSC and therefore presumably not fated to remain snESF. For this reason, we feel justified for the time being in our assessment of these cells as senescent (activated) ESF rather than “senescent DSC,” i.e., a cell which has fully decidualized and also activated a senescence program. A fuller demonstration of the ties between senescence and decidualization is beyond the scope of the present study and will await further experimentation. As one possible direction, senescence in fibroblasts has been found to occur in the process of activation and myofibroblast transition [87–89]. It is therefore possible that the pattern we see with respect to the snESF/acESF state in PGE2 + MPA decidualization, with a pronounced acESF presence, may reflect a biological balance between the two programs of fibroblast activation and cellular senescence, which is tipped toward snESF under cAMP + MPA decidualization.
Our PGE2-mediated decidualization protocol showed a reduced signature of senescence compared to the cAMP + MPA protocol. A conceivable explanation for this pattern is that the physiological receptor:ligand signaling interaction of PGE2 and its receptors slightly delays the decidualization process and that a direct synchronic comparison to direct membrane-permeable cAMP addition is inappropriate: in other words, 6 days of PGE2 + MPA may be more comparable to only the very beginning of the senescent/mature split and is destined to become more pronounced. However, since decidualization by PGE2 + MPA treatment is acting through the PTGER2 → cAMP → PKA pathway, we are inclined to believe that treatment with extracellular cAMP may overload the cell with cAMP, leading to stress (and as a consequence to senescence) in addition to the activation of the decidual cell programs (Supplementary Figure S8). That said, in women during the secretory phase, senescent stromal cells have also been identified and there is evidence that links them to the implantation process [42]. If senescence is more intense in vivo, we imagine that it may be related to additional paracrine signals from other endometrial cell types.
Conclusion
In vitro decidualization is inevitably removed from in vivo biology. Our PGE2 + MPA in vitro decidualization appears to generate mature DSC as well as a subset of acESF, which is similar to the myofibroblast-like acESF identified in in vivo studies [71, 86]. We recognize that the decidualization process in humans is more complex than the PGE2-based in vitro protocol, and it is not our goal to mimic the full complexity of human decidualization in vitro. Instead, the present study has aimed at characterizing the degree to which PGE2 in conjunction with progestin can induce the decidual gene expression phenotype in vitro, given that comparative data suggest that progesterone/PGE2 could be the minimal ancestral deciduogenic signals, with PGE2 signaling being dependent on progesterone induction of PTGER2. With this model, we identified a gene regulatory innovation that might be key in the evolution of the decidual cell type, namely, the progestin-dependent induction of the PGE2 receptor PTGER2. This minimal ancestral deciduogenic network likely evolved in the stem lineage of placental mammals and informs our understanding of the origins of this cell type.
Supplementary Material
Acknowledgment
D.J.S. is thankful to Eric Erkenbrack for guidance in cell culture procedures and experimental design. The analytical component of this study benefited greatly due to computational guidance from, and software made available by, Daniel Burkhardt and Scott Gigante of the Krishnaswamy lab as well as Arun Chavan and Anasuya Dighe of the Wagner lab. The authors recognize the support of the National Cancer Institute (U54-CA209992) and John Templeton Foundation (#61329). D.J.S. is supported by the NIH Predoctoral Training Program in Genetics (T32 GM 007499). The opinions expressed in this paper are those of the authors and do not represent the stance of the funding institutions.
Conflict of interest: The authors have declared that no conflict of interest exists.
Footnotes
† Grant Support: National Cancer Institute U54-CA209992, John Templeton Foundation #61329, NIH Predoctoral Training Program in Genetics T32 GM 007499.
Contributor Information
Daniel J Stadtmauer, Department of Ecology and Evolutionary Biology, Yale University, New Haven, CT, USA; Systems Biology Institute, Yale University, West Haven, CT, USA.
Günter P Wagner, Department of Ecology and Evolutionary Biology, Yale University, New Haven, CT, USA; Systems Biology Institute, Yale University, West Haven, CT, USA; Department of Obstetrics, Gynecology and Reproductive Sciences, Yale School of Medicine, New Haven, CT, USA; Department of Obstetrics and Gynecology, Wayne State University, Detroit, MI, USA.
Data availability
Sequencing data were uploaded to NCBI Sequence Read Archive under Project ID PRJNA679324. Graphical abstract art licensed from BioRender by Biology of Reproduction; all other art original.
Authors’ contributions
G.P.W. conceived of the study. D.J.S. conducted the experiments and performed the computational analysis. D.J.S. and G.P.W. interpreted the results and wrote the manuscript.
References
- 1. Gellersen B, Brosens JJ. Cyclic decidualization of the human endometrium in reproductive health and failure. Endocr Rev 2014; 35:851–905. [DOI] [PubMed] [Google Scholar]
- 2. Mess A, Carter AM. Evolutionary transformations of fetal membrane characters in Eutheria with special reference to Afrotheria. J Exp Zool Part B 2006; 306:140–163. [DOI] [PubMed] [Google Scholar]
- 3. Chavan AR, Griffith OW, Wagner GP. The inflammation paradox in the evolution of mammalian pregnancy: turning a foe into a friend. Curr Opin Genet Dev 2017; 47:24–32. [DOI] [PubMed] [Google Scholar]
- 4. Chavan AR, Griffith OW, Stadtmauer DJ, Maziarz J, Pavličev M, Fishman R, Koren L, Romero R, Wagner GP. Evolution of embryo implantation was enabled by the origin of decidual cells in eutherian mammals. Mol Biol Evol 2021; 38:1060–1074. [DOI] [PMC free article] [PubMed] [Google Scholar]
- 5. Stadtmauer DJ, Wagner GP. The primacy of maternal innovations to the evolution of embryo implantation. Integr Comp Biol 2020; 60:742–752. [DOI] [PMC free article] [PubMed] [Google Scholar]
- 6. Erkenbrack EM, Maziarz JD, Griffith OW, Liang C, Chavan AR, Nnamani MC, Wagner GP. The mammalian decidual cell evolved from a cellular stress response. PLoS Biol 2018; 16:e2005594. [DOI] [PMC free article] [PubMed] [Google Scholar]
- 7. Ma X, Dighe A, Maziarz J, Neumann E, Erkenbrack E, Hei Y-Y, Liu Y, Suhail Y, Kshitiz PI, Levchenko A, Wagner GP. Human vulnerability to cancer malignancy is enhanced by evolution of higher mesenchymal CD44 expression compared to other mammals. BioRxiv 2020. 10.1101/2020.08.03.234617. [DOI] [PMC free article] [PubMed] [Google Scholar]
- 8. Frank GR, Brar AK, Cedars MI, Handwerger S. Prostaglandin E2 enhances human endometrial stromal cell differentiation. Endocrinologie 1994; 134:258–263. [DOI] [PubMed] [Google Scholar]
- 9. Park Y, Nnamani MC, Maziarz J, Wagner GP. Cis-regulatory evolution of forkhead box O1 (FOXO1), a terminal selector gene for decidual stromal cell identity. Mol Biol Evol 2016; 33:3161–3169. [DOI] [PubMed] [Google Scholar]
- 10. Kin K, Maziarz J, Chavan AR, Kamsat M, Vasudevan S, Birt A, Emera D, Lynch VJ, Ott TL, Pavličev M, Wagner GP. The transcriptomic evolution of mammalian pregnancy: gene expression innovations in endometrial stromal fibroblasts. Genome Biol Evol 2016; 8:2459–2473. [DOI] [PMC free article] [PubMed] [Google Scholar]
- 11. Kin K, Maziarz J, Wagner G. Immunohistological study of the endometrial stromal fibroblasts in the opossum, Monodelphis domestica: evidence for homology with eutherian stromal fibroblasts. Biol Reprod 2014; 90:111. [DOI] [PubMed] [Google Scholar]
- 12. Chavan AR, Bhullar B-AS, Wagner GP. What was the ancestral function of decidual stromal cells? A model for the evolution of eutherian pregnancy. Placenta 2016; 40:40–51. [DOI] [PubMed] [Google Scholar]
- 13. Zeller U, Freyer C. Early ontogeny and placentation of the grey short-tailed opossum, Monodelphis domestica (Didelphidae: Marsupialia): contribution to the reconstruction of the marsupial morphotype. J Zool Syst Evol Research 2001; 39:137–158. [Google Scholar]
- 14. Griffith OW, Chavan AR, Protopapas S, Maziarz J, Romero R, Wagner GP. Embryo implantation evolved from an ancestral inflammatory attachment reaction. Proc Natl Acad Sci USA 2017; 2017:E6566–E6575. [DOI] [PMC free article] [PubMed] [Google Scholar]
- 15. Harder JD, Stonerook MJ, Pondy J. Gestation and placentation in two new world opossums: Didelphis virginiana and Monodelphis domestica. J Exp Zool 1993; 266:463–479. [DOI] [PubMed] [Google Scholar]
- 16. Hansen VL, Faber LS, Salehpoor AA, Miller RD. A pronounced uterine pro-inflammatory response at parturition is an ancient feature in mammals. Proc R Soc B 2017; 284:20171694. [DOI] [PMC free article] [PubMed] [Google Scholar]
- 17. Griffith OW, Chavan AR, Pavličev M, Protopapas S, Callahan R, Maziarz J, Wagner GP. Endometrial recognition of pregnancy occurs in the grey short-tailed opossum (Monodelphis domestica). Proc R Soc B 2019; 286:20190691. [DOI] [PMC free article] [PubMed] [Google Scholar]
- 18. Christian M, Mak I, White JO, Brosens JJ. Mechanisms of decidualization. Reprod Biomed Online 2001; 4:24–30. [DOI] [PubMed] [Google Scholar]
- 19. Brosens JJ, Hayashi N, White JO. Progesterone receptor regulates decidual prolactin expression in differentiatng human endometrial stromal cells. Endocrinologie 1999; 140:4809–4820. [DOI] [PubMed] [Google Scholar]
- 20. Telgmann R, Maronde E, Taskén K, Gellersen B. Activated protein kinase A is required for differentiation-dependent transcription of the decidual prolactin gene in human endometrial stromal cells. Endocrinologie 1997; 138:929–937. [DOI] [PubMed] [Google Scholar]
- 21. Tang B, Gurpide E. Direct effect of gonadotropins on decidualization of human endometrial stromal cells. J Steroid Biochem Mol Biol 1993; 47:115–121. [DOI] [PubMed] [Google Scholar]
- 22. Chang HJ, Lee JH, Hwang KJ, Kim MR, Chang KH, Park DW, Min CK. Transforming growth factor (TGF)-β1-induced human endometrial stromal cell decidualization through extracellular signal-regulated kinase and Smad activation in vitro: peroxisome proliferator-activated receptor gamme acts as a negative regulator of TGF-β1. Fertil Steril 2008; 90:1357–1365. [DOI] [PubMed] [Google Scholar]
- 23. Klein C. The role of relaxin in mare reproductive physiology: a comparative review with other species. Theriogenology 2016; 86:451–456. [DOI] [PubMed] [Google Scholar]
- 24. Bathgate RAD, Siebel AL, Tovote P, Claasz A, Macris M, Tregear GW, Parry LJ. Purification and characterization of relaxin from the tammar wallaby (Macropus eugenii): bioactivity and expression in the corpus luteum. Biol Reprod 2002; 67:293–300. [DOI] [PubMed] [Google Scholar]
- 25. Parry LJ, Clark JM, Renfree MB. Ultrastructural localization of relaxin in the corpus luteum of the pregnant and early lactating tammar wallaby. Macropus eugenii Cell Tissue Res 1997; 290:615–622. [DOI] [PubMed] [Google Scholar]
- 26. Hansell DJ, Bryant-Greenwood GD, Greenwood FC. Expression of the human relaxin H1 gene in the decidua, trophoblast, and prostate. J Clin Endocrinol Metab 1991; 72:899–904. [DOI] [PubMed] [Google Scholar]
- 27. Huang JR, Tseng L, Bischof P, Janne OA. Regulation of prolactin production by progestin, estrogen, and relaxin in human endometrial stromal cells. Endocrinologie 1987; 121:2011–2017. [DOI] [PubMed] [Google Scholar]
- 28. Bartsch O, Bartlick B, Ivell R. Phosphodiesterase 4 inhibition synergizes with relaxin signaling to promote decidualization of human endometrial stromal cells. J Clin Endocrinol Metab 2004; 89:324–334. [DOI] [PubMed] [Google Scholar]
- 29. Mazella J, Tang M, Tseng L. Disparate effects of relaxin and TGFβ1: relaxin increases, but TGFβ1 inhibits, the relaxin receptor and the production of IGFBP-1 in human endometrial stromal/decidual cells. Hum Reprod 2004; 19:1513–1518. [DOI] [PubMed] [Google Scholar]
- 30. Kasahara K, Takakura K, Takebayashi K, Kimura F, Nakanishi K, Noda Y. The role of human chorionic gonadotropin on decidualization of endometrial stromal cells in vitro. J Clin Endocrinol Metab 2001; 86:1281–1286. [DOI] [PubMed] [Google Scholar]
- 31. Maston GA, Ruvolo M. Chorionic gonadotropin has a recent origin within within primates and an evolutionary history of selection. Mol Biol Evol 2002; 19:320–335. [DOI] [PubMed] [Google Scholar]
- 32. Wynn RM, Jollie WP. Biology of the Uterus. New York: Plenum Medical Book Company; 1989. [Google Scholar]
- 33. Kautz E, Gram A, Aslan S, Ay SS, Selçuk M, Kanca H, Koldaş E, Akal E, Karakaş K, Findik M, Boos A, Kowalewski MP. Expression of genes involved in the embryo-maternal interaction in the early-pregnant canine uterus. Reproduction 2014; 147:703–717. [DOI] [PubMed] [Google Scholar]
- 34. Charpignly C, Reinaud P, Tamby J-P, Creminon C, Martal J, Maclouf J, Guillomot M. Expression of cyclooxygenase-1 and -2 in ovine endometrium during the estrous cycle and early pregnancy. Endocrinol 1997; 138:2163–2171. [DOI] [PubMed] [Google Scholar]
- 35. Emond V, Mac Laren LA, Kimmins S, Arosh JA, Fortier MA, Lambert RD. Expression of cyclooxygenase-2 and granulocyte-macrophage colony-stimulating factor in endometrial epithelium of the cow is up-regulated during early pregnancy and in response to intrauterine infusions of interferon-τ. Biol Reprod 2004; 70:54–64. [DOI] [PubMed] [Google Scholar]
- 36. Ulbrich SE, Schulke K, Groebner AE, Reichenbach HD, Angioni C, Geisslinger G, Meyer HHD. Quantitative characterization of prostaglandins in the uterus of early pregnant cattle. Reproduction 2009; 138:371–382. [DOI] [PubMed] [Google Scholar]
- 37. Blitek A, Waclawik A, Kaczmarek MM, Stadejek T, Pejsak Z, Ziecik AJ. Expression of cyclooxygenase-1 and -2 in the porcine endometrium during the oestrous cycle and early pregnancy. Reprod Domest Anim 2006; 41:251–257. [DOI] [PubMed] [Google Scholar]
- 38. Boerboom D, Brown KA, Vaillancourt D, Poitras P, Goiff AK, Watanabe K, Doré M, Sirois J. Expression of key prostaglandin synthases in equine endometrium during late diestrus and early pregnancy. Biol Reprod 2004; 70:391–399. [DOI] [PubMed] [Google Scholar]
- 39. Kennedy TG, Gillio-Meina C, Phang SH. Prostaglandins and the initiation of blastocyst implantation and decidualization. Reproduction 2007; 134:635–643. [DOI] [PubMed] [Google Scholar]
- 40. Stadtmauer DJ, Wagner GP. Cooperative inflammation: the recruitment of inflammatory signaling in marsupial and eutherian pregnancy. J Reprod Immunol 2020a; 137:102626. [DOI] [PMC free article] [PubMed] [Google Scholar]
- 41. Graubner FR, Pereira MT, Boos A, Kowalewski MP. Canine decidualization in vitro: extracellular matrix modification, progesterone mediated effects and selective blocking of prostaglandin E2 receptors. J Reprod Dev 2020; 66:319–329. [DOI] [PMC free article] [PubMed] [Google Scholar]
- 42. Brighton PJ, Maruyama Y, Fishwick K, Vrljicak P, Tewary S, Fujihara R, Muter J, Lucas ES, Yamada T, Woods L, Lucciola R, Lee YH et al. Clearance of senescent decidual cells by uterine natural killer cells in cycling human endometrium. Elife 2017; 6:e31274. [DOI] [PMC free article] [PubMed] [Google Scholar]
- 43. Lucas ES, Vrljicak P, Muter J, Diniz-da-Costa MM, Brighton PJ, Kong C-S, Lipecki J, Fishwick K, Odendaal J, Ewington LJ, Quenby S, Ott S et al. Recurrent pregnancy loss is associated with a pro-senescent decidual response during the peri-implantation window. Commun Biol 2020; 3:37. [DOI] [PMC free article] [PubMed] [Google Scholar]
- 44. Pavličev M, Wagner GP, Chavan AR, Owens K, Maziarz J, Dunn-Fletcher C, Kallapur SG, Muglia L, Jones H. Single-cell transcriptomics of the human placenta: Inferring the cell communication network of the maternal-fetal interface. Genome Res 2017; 27:1–13. [DOI] [PMC free article] [PubMed] [Google Scholar]
- 45. Birrel MA, Maher SA, Buckley J, Dale N, Bonvini S, Raemdonck K, Pullen N, Giembycz MA, Belvisi MG. Selectivity profiling of the novel EP2 receptor antagonist, PF-04418948, in functional bioassay systems: atypical affinity at the guinea pig EP2 receptor. Brit J Pharmacol 2012; 168:129–138. [DOI] [PMC free article] [PubMed] [Google Scholar]
- 46. Chen Q, Muramoto K, Masaaki N, Ding Y, Yang H, Mackey M, Li W, Inoue Y, Ackermann K, Shirota H, Matsumoto I, Spyvee M et al. A novel antagonist of the prostaglandin E2 EP4 receptor inhibits Th1 differentiation and Th17 expansion and is orally active in arthritis models. Brit J Pharmacol 2010; 160:292–310. [DOI] [PMC free article] [PubMed] [Google Scholar]
- 47. Matsuoka A, Kizuka F, Lee L, Tamura I, Taniguchi K, Asada H, Taketani T, Tamura H, Sugino N. Progesterone increases manganese superoxide dismutase expression via a cAMP-dependent signaling mediated by noncanonical Wnt5a pathway in human endometrial stromal cells. J Clin Endocrinol Metab 2010; 95:E291–E299. [DOI] [PubMed] [Google Scholar]
- 48. Yoshino O, Osuga Y, Hirota Y, Koga K, Yano T, Tsutsumi O, Taketani Y. Akt as a possible intracellular mediator for decidualization in human endometrial stromal cells. Mol Hum Reprod 2003; 9:265–269. [DOI] [PubMed] [Google Scholar]
- 49. Bray NL, Pimentel H, Melsted P, Pachter L. Near-optimal probabilistic RNA-seq quantification. Nat Biotechnol 2016; 34:525–527. [DOI] [PubMed] [Google Scholar]
- 50. Wagner GP, Kin K, Lynch VJ. Measurement of mRNA abundance using RNA-seq data: RPKM measure is inconsistent among samples. Theory Biosci 2012; 131:281–285. [DOI] [PubMed] [Google Scholar]
- 51. Suzuki R, Shimodaira H. Pvclust: an R package for assessing the uncertainty in hierarchical clustering. Bioinformatics 2006; 22:1540–1542. [DOI] [PubMed] [Google Scholar]
- 52. Robinson MD, McCarthy DJ, Smyth GK. edgeR: a bioconductor package for differential expression analysis of digital gene expression data. Bioinformatics 2010; 26:139–140. [DOI] [PMC free article] [PubMed] [Google Scholar]
- 53. Wagner GP, Kin K, Lynch VJ. A model based criterion for gene expression calls using RNA-seq data. Theory Biosci 2013; 132:159–164. [DOI] [PubMed] [Google Scholar]
- 54. Kuleshov MV, Jones MR, Rouillard AD, Fernandez NF, Duan Q, Wang Z, Koplev S, Jenkins SL, Jagodnik KM, Lachmann A, McDermott MG, Monteiro CD et al. Enrichr: a comprehensive gene set enrichment web server 2016 update. Nucleic Acids Res 2016; 44:W90–W97. [DOI] [PMC free article] [PubMed] [Google Scholar]
- 55. Haghverdi L, Lun ATL, Morgan MD, Marioni JC. Batch effects in single-cell RNA-sequencing data are corrected by matching mutual nearest neighbors. Nat Biotechnol 2018; 36:421–427. [DOI] [PMC free article] [PubMed] [Google Scholar]
- 56. Moon KR, van Dijk D, Wang Z, Gigante S, Burkhardt DB, Chen WS, Yim K, van den Elzen A, Hirn MJ, Coifman RR, Ivanova NB, Wolf G et al. Visualizing structure and transitions in high-dimensional biological data. Nat Biotechnol 2019; 37:1482–1492. [DOI] [PMC free article] [PubMed] [Google Scholar]
- 57. van Dijk D, Sharma R, Nainys J, Yim K, Kathail P, Carr AJ, Burdziak C, Moon KR, Chaffer CL, Pattabiraman D, Bierie B, Mazutis L et al. Recovering gene interactions from single-cell data using data diffusion. Cell 2018; 174:716–729. [DOI] [PMC free article] [PubMed] [Google Scholar]
- 58. Krishnaswamy S, Spitzer MH, Mingueneau M, Bendall SC, Litvin O, Stone E, Pe’er D, Nolan GP. Conditional density-based analysis of T cell signaling in single-cell data. Science 2014; 346:1079. [DOI] [PMC free article] [PubMed] [Google Scholar]
- 59. Satija R, Farrell JA, Gennert D, Schier AF, Regev A. Spatial reconstruction of single-cell gene expression data. Nat Biotechnol 2015; 33:495–502. [DOI] [PMC free article] [PubMed] [Google Scholar]
- 60. Wolf FA, Angerer P, Theis FJ. Scanpy: large-scall single-cell gene expression data analysis. Genome Biol 2018; 19:15. [DOI] [PMC free article] [PubMed] [Google Scholar]
- 61. Aran D, Looney AP, Liu L, Wu E, Fong V, Hsu A, Chak S, Naikawadi RP, Wolters PJ, Abate AR, Butte AJ, Bhattacharya M. Reference-based analysis of lung single-cell sequencing reveals a transitional profibrotic macrophage. Nat Immunol 2019; 20:163–172. [DOI] [PMC free article] [PubMed] [Google Scholar]
- 62. La Manno G, Soldatov R, Zeisel A, Braun E, Hochgerner H, Petukhov V, Lidschreiber K, Kastriti ME, Lönnerberg P, Furlan A, Fan J, Borm LE et al. RNA velocity of single cells. Nature 2018; 560:494–498. [DOI] [PMC free article] [PubMed] [Google Scholar]
- 63. Bergen V, Lange M, Peidli S, Wolf FA, Theis FJ. Generalizing RNA velocity to transient cell states through dynamical modeling. Nat Biotechnol 2020; 38:1408–1414. [DOI] [PubMed] [Google Scholar]
- 64. Setty M, Kiseliovas V, Levine J, Gayoso A, Mazutis L, Pe’er D. Characterization of cell fate probabilities in single-cell data with Palantir. Nat Biotechnol 2019; 37:451–460. [DOI] [PMC free article] [PubMed] [Google Scholar]
- 65. Lange M, Bergen V, Klein M, Setty M, Reuter B, Mostafa B, Lickert H, Ansari M, Schniering J, Schiller HB, Pe’er D, Theis FJ. Cell rank for directed single-cell fate mapping. BioRxiv 2020. 10.1101/2020.10.19.345983. [DOI] [PMC free article] [PubMed] [Google Scholar]
- 66. Piepho HP. An algorithm for a letter-based representation of all-pairwise comparisons. J Comput Graph Stat 2004; 13:456–466. [Google Scholar]
- 67. Liang C. Mathemetical modeling of cell type evolution: gene expression and gene regulatory networks. New Haven, CT, USA: Yale University; 2018: Ph.D. Diss. [Google Scholar]
- 68. Moon KR, Stanley JS III, Burkhardt D, van Dijk D, Wolf G, Krishnaswamy S. Manifold learning-based methods for analyzing single-cell RNA-sequencing data. Curr Opin Syst Biol 2018; 7:36–46. [Google Scholar]
- 69. Lucas ES, Vrljicak P, Diniz-da-Costa MM, Brighton PJ, Kong C-S, Lipecki J, Fishwick K, Muter J, Ott S, Brosens JJ. Reconstruction of the decidual pathways in human endometrial cells using single-cell RNA-seq. BioRxiv 2018. 10.1101/368829. [DOI] [Google Scholar]
- 70. Luecken MD, Theis FJ. Current best practices in single-cell RNA-seq analysis: a tutorial. Mol Syst Biol 2019; 15:e8746. [DOI] [PMC free article] [PubMed] [Google Scholar]
- 71. Suryawanshi H, Morozov P, Straus A, Sahasrabudhe N, Max KEA, Garzia A, Kustagi M, Tuschl T, Williams Z. A single-cell survey of the human first-trimester placenta and decidua. Sci Adv 2018; 4:eaau4788. [DOI] [PMC free article] [PubMed] [Google Scholar]
- 72. Garoche C, Aït-Aïssa S, Boulahtouf A, Creusot N, Hinfray N, Bourguet W, Balaguer P, Brion F. Human and zebrafish nuclear progesterone receptors are differently activated by manifold progestins. Environ Sci Technol 2020; 54:9510–9518. [DOI] [PubMed] [Google Scholar]
- 73. Brar AK, Frank GR, Kessler CA, Cedars MI, Handwerger S. Progesterone-dependent decidualization of the endometrium is mediated by cAMP. Endocrine 1997; 6:301–307. [DOI] [PubMed] [Google Scholar]
- 74. Breyer RM, Bagdassarian CK, Myers SA, Breyer MD. Prostanoid receptors: subtypes and signaling. Annu Rev Pharmacol Toxicol 2001; 41:661–690. [DOI] [PubMed] [Google Scholar]
- 75. Rytkönen KT, Erkenbrack EM, Poutanen M, Elo LL, Pavličev M, Wagner GP. Decidualization of human endometrial stromal fibroblasts is a multiphasic process involving distinct transcriptional programs. Reprod Sci 2019; 26:323–336. [DOI] [PMC free article] [PubMed] [Google Scholar]
- 76. Desai S, April H, Nwaneshiudu C, Ashby B. Comparison of agonist-induced internalization of the human EP2 and EP4 prostaglandin receptors: role of the carboxyl terminus in EP4 receptor sequestration. Mol Pharm 2000; 58:1279–1286. [DOI] [PubMed] [Google Scholar]
- 77. Nishigaki N, Negishi M, Ichikawa A. Two Gs-coupled prostaglandin E receptor subtypes, EP2 and EP4, differ in desensitization and sensitivity to the metabolic inactivation of the agonist. Mol Pharm 1996; 50:1031–1037. [PubMed] [Google Scholar]
- 78. Bastepe M, Ashby B. The long cytoplasmic carboxyl terminus of the prostaglandin E2 receptor EP4 subtype is essential for agonist-induced desensitization. Mol Pharm 1997; 51:343–349. [DOI] [PubMed] [Google Scholar]
- 79. Fortier MA, Boulanger M, Boulet AP, Lambert RD. Cell-specific localization of prostaglandin E2-sensitive adenylate cyclase in rabbit endometrium. Biol Reprod 1987; 36:1025–1033. [DOI] [PubMed] [Google Scholar]
- 80. Rundhaug JE, Simper MS, Surh I, Fischer SM. The role of the EP receptors for prostaglandin E2 in skin and skin cancer. Cancer Metastasis Rev 2011; 30:465–480. [DOI] [PMC free article] [PubMed] [Google Scholar]
- 81. Fujino H, Salvi S, Regan JW. Differential regulation of phosphorylation of the cAMP response element-binding protein after activation of EP2 and EP4 prostanoid receptors by prostaglandin E2. Mol Pharmacol 2005; 68:251–259. [DOI] [PubMed] [Google Scholar]
- 82. Fujino H, West KA, Regan JW. Phosphorylation of glycogen synthase kinase-3 and stimulation of T-cell factor signaling following activation of EP2 and EP4 prostanoid receptors by prostaglandin E2. J Biol Chem 2002; 277:2614–2619. [DOI] [PubMed] [Google Scholar]
- 83. Ricciotti E, Fitz Gerald GA. Prostaglandins and inflammation. Arterioscler Thomb Vasc Biol 2011; 31:986–1000. [DOI] [PMC free article] [PubMed] [Google Scholar]
- 84. Mukherjee S, Sheng W, Michkov A, Sriarm K, Sun R, Dvorkin-Gheva A, Insel PA, Janssen LJ. Prostaglandin E2 inhibits profibrotic function of human pulmonary fibroblasts by disrupting Ca2+ signaling. Am J Physiol Lung Cell Mol Physiol 2019; 316:L810–L821. [DOI] [PMC free article] [PubMed] [Google Scholar]
- 85. Salker MS, Nautiyal J, Steel JH, Webster Z, Šućurovic S, Nicou M, Singh Y, Lucas ES, Murakami K, Chan Y-W, James S, Abdallah Y et al. Disordered IL-33/ST2 activation in decidualizing stromal cells prolongs uterine receptivity in women with recurrent pregnancy loss. PLoS One 2012; 7:e52252. [DOI] [PMC free article] [PubMed] [Google Scholar]
- 86. Vento-Tormo R, Efremova M, Botting RA, Turco MY, Vento-Tormo M, Meyer KB, Park J-E, Stephenson E, Polański K, Goncalves A, Gardner L, Holmqvist S et al. Single-cell reconstruction of the early maternal-fetal interface in humans. Nature 2018; 563:347–353. [DOI] [PMC free article] [PubMed] [Google Scholar]
- 87. Demaria M, Ohtani N, Youssef SA, Rodier F, Toussaint W, Mitchell JR, Laberge R-M, Vijg J, van Steeg H, Dollé MET, Hoeijmakers JHJ, de Bruin A et al. An essential role for senescent cells in optimal wound healing through secretion of PDGF-AA. Dev Cell 2014; 31:722–733. [DOI] [PMC free article] [PubMed] [Google Scholar]
- 87. Jun J-I, Lau LF. The matricellular protein CCN1 induces fibroblast senescence and restricts fibrosis in cutaneous wound healing. Nat Cell Biol 2010; 12:676–685. [DOI] [PMC free article] [PubMed] [Google Scholar]
- 89. Kuilman T, Michaloglou C, Vredeveld CW, Douma S, van Doorn R, Desmet CJ, Aarden LA, Mooi WJ, Peeper DS. Oncogene-induced senescence relayed by an interleukin-dependent inflammatory network. Cell 2008; 133:1091–1031. [DOI] [PubMed] [Google Scholar]
- 90. dos Reis M, Inoue J, Hasegawa M, Asher RJ, Donoghue PCJ, Yang Z. Phylogenomic datasets provide both precision and accuracy in estimating the timescale of placental mammals phylogeny. Proc R Soc B 2012; 279:3491–3500. [DOI] [PMC free article] [PubMed] [Google Scholar]
Associated Data
This section collects any data citations, data availability statements, or supplementary materials included in this article.
Supplementary Materials
Data Availability Statement
Sequencing data were uploaded to NCBI Sequence Read Archive under Project ID PRJNA679324. Graphical abstract art licensed from BioRender by Biology of Reproduction; all other art original.