

Abstract
Axon degeneration is a hallmark of many neurodegenerative disorders. The current assumption is that the decision of injured axons to degenerate is cell-autonomously regulated. Here we show that Schwann cells (SCs), the glia of the peripheral nervous system, protect injured axons by virtue of a dramatic glycolytic upregulation that arises in SCs as an inherent adaptation to axon injury. This glycolytic response, paired with enhanced axon-glia metabolic coupling, supports axon survival. The glycolytic shift in SCs is largely driven by the metabolic signaling hub, mammalian target of rapamycin complex 1 (mTORC1), and the downstream transcription factors, Hif1α and c-Myc, which together promote glycolytic gene expression. The manipulation of glial glycolytic activity through this pathway enabled us to accelerate or delay the degeneration of perturbed axons in acute and subacute rodent axon degeneration models. Thus, we demonstrate a non-cell-autonomous metabolic mechanism that controls the fate of injured axons.
Introduction
Axon degeneration (AxD) plays a key etiological role in many neurodegenerative diseases1–3. Therefore, the preservation of axons is an important therapeutic target. This requires a mechanistic understanding of factors that regulate the stability of injured axons.
Research using experimental axon transection models over the last years has shown that AxD is regulated by a conserved program of subcellular self-destruction1–3. The execution of this program in injured axons involves the activation of a complex signaling cascade and the local depletion of the bioenergetic cofactor NAD+; this culminates in a fatal energetic collapse of axons followed by structural axon disintegration4–8. Interventions that elevate NAD+ or ATP concentrations in injured axons confer axon protection4, 8–13. These discoveries point to intriguing links between a central pro-degenerative program and cellular energy metabolism.
Despite these advances in our understanding of injury-induced axon death, we know surprisingly little about potential extrinsic regulators of the AxD cascade. A reductionist approach in the field studying isolated neurons has likely contributed to this void of knowledge. However, especially SCs, the glia that form a symbiotic relationship with the axons they ensheath, are known to mount dynamic responses shortly after axon injury, long before axon disintegration occurs14–16. This raises the possibility that, upon axon injury, SCs regulate the resistance of axons to degeneration. Notably, SCs have well-documented, crucial roles in other nerve injury-related aspects of axonal biology such axon growth and guidance17, 18. Similarly, essential for efficient axon regeneration, more recent studies indicate an important function of SCs for the rapid clearance of axon and myelin debris after injury through glial actin dynamics and autophagy, respectively19–21. Importantly, emerging evidence suggests that axon-flanking glia including SCs are metabolically coupled to axons and may provide energy-rich substrates to regulate axonal bioenergetics and integrity in different situations22–25. How such glial functions relate to the potential of axons to cope with stress and injury is unknown.
Here we investigated a role of SC energy metabolism for regulating the survival of injured axons. We show that SCs intrinsically promote axon survival through a dynamic glycolytic shift, a protective glial adaptation to axon injury that is driven by mTORC1 and downstream Hif1α/c-Myc signaling in SCs. The suppression of this metabolic switch in SCs through inactivation of glycolytic components or by the inhibition of the upstream mTORC-Hif1α/c-Myc axis speeds the breakdown of injured axons. In contrast, preemptive amplification of the metabolic injury response through mTORC1 upregulation in SCs confers axon protection after nerve injury, and ameliorates the neurodegenerative phenotype in an axonopathy disease model. These discoveries unveil a central metabolic function of SCs for the support of injured axons, and open novel therapeutic avenues to combat AxD in disease.
Results
SCs protect injured axons
To explore a non-cell autonomous role of SCs for the regulation of axon death, we used an in vitro model of traumatic AxD, in which the degeneration of radially grown axons can be reliably quantified in the presence or absence of SCs26 (Fig. 1a). To minimize glial effects on axon growth that could cell-autonomously affect the rate of AxD, we first cultured embryonic dorsal root ganglion (DRG) neurons for 6 days to allow extension of long axons in the absence of glia. We then added purified SCs and used established pharmacological methods to induce axon-glia association prior to mechanical axon transection. Control neuron cultures were treated equivalently, but SCs were withheld. The presence of SCs robustly delayed the fragmentation of transected axons as judged by axonal cytoskeleton immunostaining (Fig. 1b, c). To test for axon protection when SCs are restricted to contact injured axons only, we performed similar experiments using compartmentalized microfluidic devices, which allowed us to seed SCs only on axons (Fig. 1d). We found that SCs afford robust axon protection also in this model (Fig. 1e, f and Supplementary Fig. 1). Together, these results support the notion that SCs stabilize injured axons through local trophic activities.
Fig. 1. SCs stabilize injured axons.
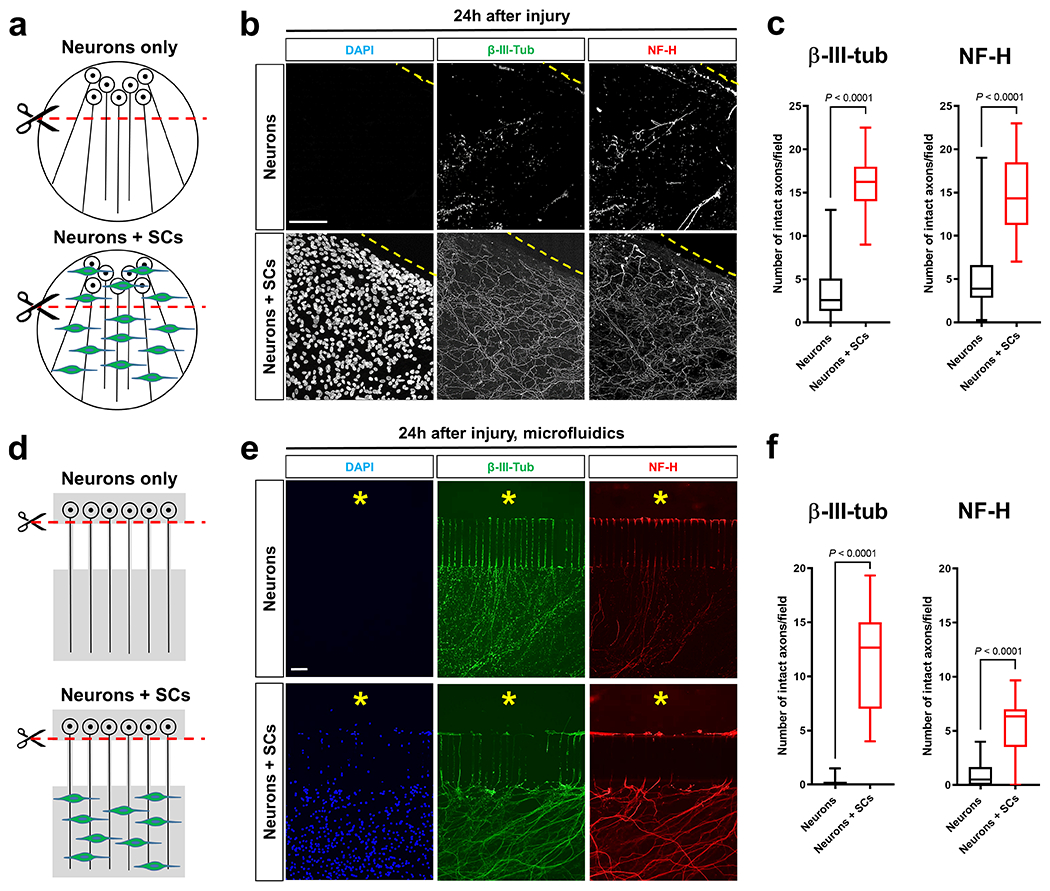
a, d, Schematics of the in vitro axon injury models. b, e, Representative micrographs show immunolabeled axons 24h after disconnection from the neuronal cell bodies under the indicated conditions. Dotted lines in conventional cultures indicate axotomy sites. Asterisks in microfluid cultures indicate aspirated neuronal cell body area. DAPI signal depicts SC nuclei. Scale bars: 100μm The experiment was reproduced four times independently with similar results in conventional cultures and three times with similar results in microfluidic cultures. c, Box and whiskers plots (maximum, 25th percentile, median, 75th percentile, minimum) of axon survival in conventional cultures 24h following injury (β-III-tub, Neurons: n=73 DRG neurite preparations; β-III-tub, Neurons+SCs: n=57 DRG neurite preparations; NF-H, Neurons: n=77 DRG neurite preparations; NF-H Neurons+SCs: n=57 DRG neurite preparations; all DRG neurite preparations from four experimental sets performed on different days). f, Box and whiskers plots (maximum, 25th percentile, median, 75th percentile, minimum) of axon survival in microfluidic device cultures 24h following injury (βIII-tub, Neurons: n=23 DRG neurite preparations; β-III-tub, Neurons+SCs: n=23 DRG neurite preparations; NF-H, Neurons: n=22 DRG neurite preparations; NF-H, Neurons+SCs: n=23 DRG neurite preparations; all DRG neurite preparations from three experimental sets performed on different days).
Statistical evaluation in c and f was performed using Student’s t-test, unpaired, two-tailed.
Glycolytic upregulation in SCs upon axon injury
Axon death occurs secondary to energetic failure4, 6, 8, 12. We previously implicated SC energy metabolism in axon maintenance22. This encouraged us to study changes in energy metabolism in SCs that may support injured axons through metabolic coupling mechanisms23, 25. For this purpose we assessed metabolic alterations in SCs accompanying traumatic AxD in vivo, referred to as Wallerian degeneration (WD). In a simple experimental model of WD, axons in the mouse sciatic nerve distal to a site of transection structurally disintegrate within few hours after a latency phase of ~40h27 (Fig. 2a). The axon death is clearly preceded by early changes in SCs including activation of the ErbB2 receptor which regulates key aspects of SC biology14. To facilitate co-localization studies we took advantage of PLP-EGFP mice in which a large subset of SCs is fluorescently labeled. Profiling metabolic enzyme expression revealed a striking burst of immunoreactivites of virtually all enzymes catalyzing the 10-step glycolytic process in SCs, with a peak occurring at 36h following nerve lesion (Fig. 2b–e and Extended Data Fig. 1a–h). This was accompanied by transiently increased expression of the key glycolytic activator, PFKFB3 (6-phosphofructo-2-kinase/fructose-2.6-bisphosphatase 3), and the lactate dehydrogenase A (LDHA) subunit, which promotes aerobic glycolysis through rapid NAD+ regeneration (Fig. 2f, g). Unlike the LDHA enzymatic form, which preferentially reduces pyruvate to lactate, the expression of the lactate dehydrogenase B (LDHB) subunit catalyzing the reverse reaction28, was downregulated (Extended Data Fig. 1i). In line with the protein analysis, we observed focally elevated hexokinase, GAPDH (glyceraldehyde 3-phosphate dehydrogenase), and LDH activities in injured nerve stumps by using enzymatic in situ methods that allow metabolic characterization in single-cell resolution (Fig. 2h). Together, this suggests that SCs dynamically elicit a transient glycolytic response, coinciding with a period when axons undergo an energetic deficit that precedes structural axon breakdown. Accordingly, nerve glucose measurements suggested that SCs in vivo take up increased amounts of glucose upon nerve injury (Fig. 2i), and this was corroborated by using near infrared (NIR) microscopy of the glucose analog tracer IRDye800CW-2DG (Fig. 2j). The glucose uptake correlated with strongly increased expression of the predominant glucose importer GLUT1 in injury-activated SCs (Fig. 2k). In sharp contrast, enzymes driving mitochondrial glucose catabolism along with their activities were not upregulated in SCs after nerve lesion (Extended Data Fig. 2). Indeed, a shift of glucose utilization away from oxidative metabolism was also indicated by the profound induction of pyruvate dehydrogenase kinase 1 (PDHK1) expression in SCs (Fig. 2l). PDHK1 curbs pyruvate flux to Acetyl-CoA and entry into the TCA cycle by antagonizing the pyruvate dehydrogenase (PDH) complex29. In sum, our data indicate multiple mechanisms supporting dramatically increased glycolytic activity in SCs upon nerve injury.
Fig. 2. Glycolytic upregulation in SCs upon axon injury.
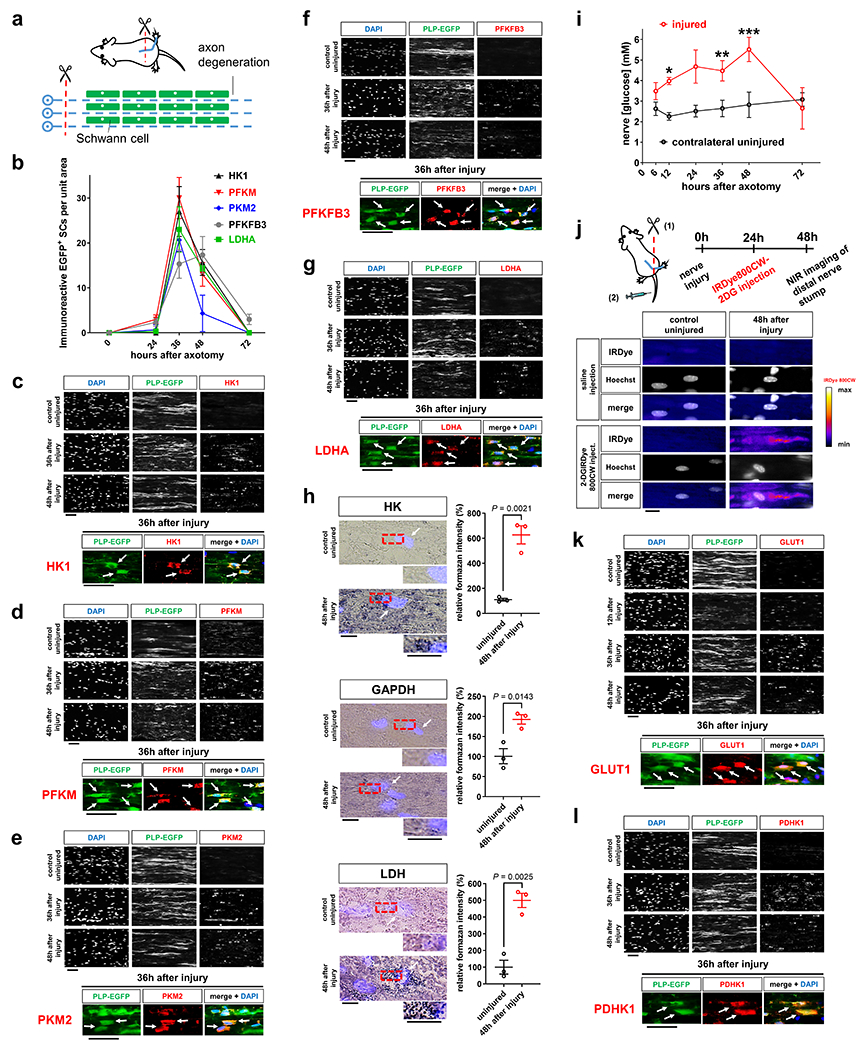
a, Schematic representation of Wallerian degeneration after unilateral sciatic nerve transection in mice. b, Quantification of EGFP+ SCs immunoreactive for the indicated markers after axotomy in distal nerve stumps at indicated post-injury times (Error bars represent s.e.m. n=3 mice per time point for each marker). c-g, k, l, Representative immunofluorescence for the indicated components on longitudinal frozen sections from uninjured control nerve segments and distal sciatic nerve stumps at the shown post-injury times. Arrows depict co-localization. HK1: hexokinase. PFKM: phosphofructokinase M. PKM2: Pyruvate kinase M2. Scale bars: 50μm. The experiments were reproduced three times independently with similar results. h, Left: Representative images of longitudinal sciatic nerve sections stained for the activity of HK, GAPDH, and LDH (formazan formation) under the indicated conditions with superimposition of DAPI signals (arrows) indicating position of cell nuclei. Scale bars: 10μm. Right: Densitometric quantification of formazan intensity representing respective enzyme activities on nerve sections (Error bars represent s.e.m. n=3 mice for each graph). i, Glucose concentrations in lysates of sciatic nerve segments (Error bars represent s.e.m. n=3 mice per condition for 6, 12, 24, 36, and 72 hours after axotomy, n=4 mice per condition for 48 hours after axotomy, *P=0.0025, **P=0.0448, ***P=0.0199). j, Top: Schematic showing experimental time course to image glucose tracer uptake in axotomized nerves. Bottom: Representative intensity micrographs for IRDye800CW-2DG uptake under the indicated conditions. Note markedly elevated cellular glucose tracer uptake following nerve injury. Scale bar: 10μm. The experiment was reproduced three times independently with similar results.
Statistical evaluation in h was performed using Student’s t-test, unpaired, two-tailed, and in i using multiple Student’s t-test, unpaired, two-tailed.
We next studied steady state levels of key energy metabolism intermediates in axotomized nerve stumps by mass-spectrometry-based metabolomics. Despite the elevated glucose uptake in such samples, the concentrations of glucose-derived intermediates were unchanged or even decreased, consistent with their rapid utilization (Fig. 3a and Supplementary Fig. 2). To ascertain enhanced glycolytic flux on a cellular level, we subjected purified SCs to extracellular flux analysis to monitor glycolytic activity after ErbB2 receptor activation, a stimulus that simulates features of the SC injury response in vitro14. This showed that SCs robustly upregulate their glycolytic activity parameters upon receptor activation (Fig. 3b), which was accompanied by increased expression of positive glycolytic regulators (Fig. 3c), and greatly elevated lactate extrusion (Fig. 3d).
Fig. 3. Enhanced glycolytic flux and lactate extrusion in injury-activated SCs.
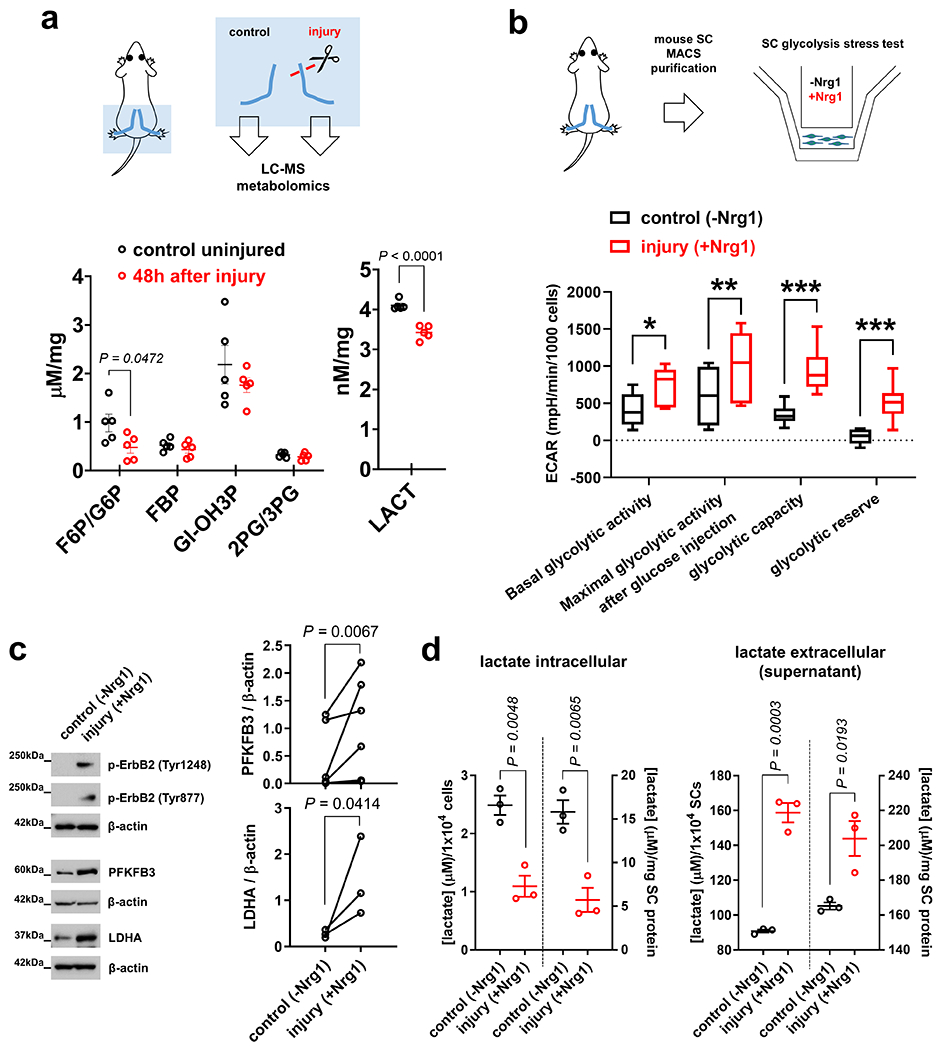
a, Top: Scheme of metabolomic analysis using extracts from nerve segments. Bottom: Concentrations of key energy metabolism intermediates in control and axotomized nerve segments from C57Bl/6J mice (F6P/G6P: fructose-6-phosphate/glucose-6-phosphate. FBP: fructose-1,6-bisphosphate. GI-OH3P: Glyceraldehyde-3-phosphate. 2PG/3PG: 2-phosphoglycerate/3-phosphoglycerate. LACT: lactate) (Error bars represent s.e.m. n=5 mice per condition and metabolite). b, Top: Scheme of extracellular flux analysis of SCs purified from C57Bl/6J mouse nerves. Bottom: Box and whiskers plot (maximum, 25th percentile, median, 75th percentile, minimum) shows glycolytic activity parameters as assessed by extracellular acidification rate (ECAR) measurements in control mouse SCs and cells with Nrg1-induced ErbB2 activation (n=9 well preparations per condition, *P=0.0080, **P=0.0464, ***P<0.0001). c, Western blot analysis (cropped blot images) of control- and Nrg1-treated C57Bl/6J mouse SCs probed with the indicated antibodies. (n=6 independent pair preparations (2 separate dishes) for PFKFB3, and n=3 independent pair preparations (2 separate dishes) for LDHA quantification). d, Intracellular and extracellular (supernatant) lactate concentrations from control and Nrg1-treated mouse SC preparations normalized to cell number and cellular protein. Note decreased intracellular and increased extracellular lactate levels in SCs treated with Nrg1 for 24h, indicating greatly increased lactate extrusion (Error bars represent s.e.m. n=3 well preparations from 3 independent experiments per condition).
Statistical evaluation in a, b, d was performed using Student’s t-test, unpaired, two-tailed, and in c using Ratio Paired t-test, one-tailed.
Collectively, our data indicate that axon injury redirects SC metabolism in favor of glycolysis with elevated release of glycolytic end-products. This raises the possibility that the SC glycolytic shift is an adaptive mechanism that supports the bioenergetics of perturbed axons through metabolic crosstalk. Such response together with augmented axon-glia metabolic coupling may counteract the deterioration of injured axons.
Glycolytic SCs are metabolically coupled to injured axons and antagonize AxD
Recent studies implicate the family of monocarboxylate transporters (MCTs) in the metabolic coupling of glia and axons23–25. The members MCT1 and 4 are expressed in SCs30, and facilitate the intercellular shuttling of pyruvate and lactate31. Strikingly, like the upregulation of glycolytic components in SCs, the expression of these MCT members showed dramatic increases in SCs upon axon injury (Fig. 4a). This supports the model that the glycolytic shift in SCs is aimed at upholding axonal integrity through monocarboxylate shuttling. In line, we found that treatment of injured DRG axons with a cell-permeable form of pyruvate confers robust axon protection (Fig. 4b), in agreement with recent studies4, 8. Moreover, given the elevated LDH activity and lactate release of injury-activated SCs, we hypothesized that glial lactate is rapidly taken up and consumed by perturbed axons. Such consumption should conclude upon axon death, eventually resulting in progressively increasing lactate concentrations in degenerating nerves. In agreement with this model (Extended Data Fig. 3a), we found that lactate levels in axotomized nerves in vivo initially declined greatly, suggesting enhanced consumption by distressed axons, but then gradually increased as axons degenerated (Extended Data Fig. 3b). Similar temporal data in line with initial rapid axonal monocarboxylate consumption followed by extracellular monocarboxylate accumulation after axon death were obtained by ex vivo extracellular flux analysis of degenerating nerve segments32 (Extended Data Fig. 3c, d).
Fig. 4. Glycolytic SCs are metabolically coupled to injured axons and antagonize AxD.
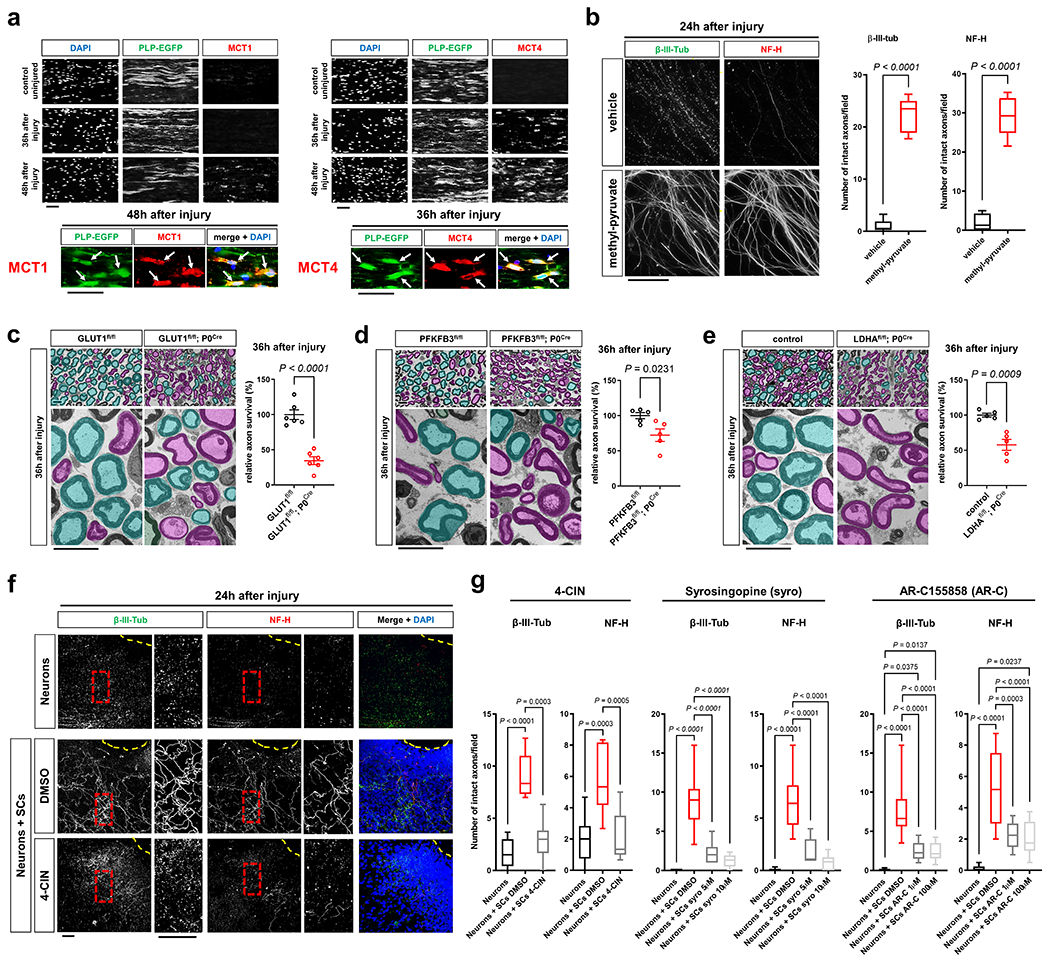
a, Representative immunofluorescence for the indicated MCTs on longitudinal frozen sections from control uninjured nerves and axotomized distal sciatic nerve stumps at the shown post-injury time points. Arrows depict colocalization. Scale bars: 50μm. The experiment was reproduced three times independently with similar results. b, Left: Representative micrographs show immunolabeled axons 24h after disconnection from the neuronal cell bodies under the indicated conditions. Scale bar: 100μm. Right: Box and whiskers plots (maximum, 25th percentile, median, 75th percentile, minimum) of axon survival 24h following injury (n=36 DRG neurite preparations for both β-III-tub and NF-H per condition from 4 experimental sets performed on different days). c-e, Representative semithin (top) and electron micrographs (bottom) of transverse sciatic nerve sections of distal nerve stumps from mice with the indicated genotypes 36h after sciatic nerve transection with pseudocoloring of intact (turquoise) and degenerated (magenta) myelinated fibers, and corresponding quantifications of relative axon survival (Error bars represent s.e.m. n=6 mice per genotype for c. n=5 mice per genotype for d and e). Scale bars: 10μm. f, Representative immunofluorescence of axons 24h after disconnection from the neuronal cell bodies under the indicated conditions. Yellow dotted lines indicate axotomy sites. Insets show red dashed areas (red). Note many continuous transected axons in the preparation associated with SCs (middle panel), and abrogation of such axon protection in presence of 4-CIN (bottom panel). Scale bars: 50μm. The experiment was reproduced three times independently with similar results. g, Box and whiskers plots (maximum, 25th percentile, median, 75th percentile, minimum) of axon survival 24h following axotomy under the indicated conditions (4-CIN: β-III-tub and NF-H, Neurons: n=24 DRG neurite preparations, Neurons+SCs DMSO: n=25 DRG neurite preparations for β-III-tub and n=24 for NF-H, Neurons+SCs 4-CIN: n=21 DRG neurite preparations; all DRG neurite preparations from three experimental sets performed on different days. Syrosingopine: β-III-tub, Neurons: n=34 DRG neurite preparations, Neurons+SCs DMSO: n=37 DRG neurite preparations, Neurons+SCs syro 5μM: n=11 DRG neurite preparations, Neurons+SCs syro 10μM: n=30 DRG neurite preparations; all DRG neurite preparations from three experimental sets performed on different days except Neurons+SCs syro 5μM (one experimental set), NF-H, Neurons: n=34 DRG neurite preparations, Neurons+SCs DMSO: n=29 DRG neurite preparations, Neurons+SCs syro 5μM: n=11 DRG neurite preparations, Neurons+SCs syro 10μM: n=30 DRG neurite preparations; all DRG neurite preparations from three experimental sets performed on different days except Neurons+SCs syro 5μM (one experimental set). AR-C155858: β-III-tub, Neurons: n=41 DRG neurite preparations, Neurons+SCs DMSO: n=49 DRG neurite preparations, Neurons+SCs AR-C 1μM: n=24 DRG neurite preparations, Neurons+SCs AR-C 100μM: n=44 DRG neurite preparations; all DRG neurite preparations from three experimental sets performed on different days except Neurons+SCs AR-C 1μM (two experimental sets), NF-H: Neurons: n=41 DRG neurite preparations, Neurons+SCs DMSO: n=41 DRG neurite preparations, Neurons+SCs AR-C 1μM: n=24 DRG neurite preparations, Neurons+SCs AR-C 100μM: n=44 DRG neurite preparations; all DRG neurite preparations from three experimental sets performed on different days except Neurons+SCs AR-C 1μM (two experimental sets).
Statistical evaluation in b-e was performed using Student’s t-test, unpaired, two-tailed, and in g using One-way-ANOVA and Sidak’s multiple comparisons tests.
We then studied if the suppression of raised SC glycolytic activity and thus monocarboxylate supply for axons accelerates injury-induced AxD. For these experiments, we generated mutant mice lacking GLUT1, PFKFB3, or LDHA in SCs (GLUT1fl/fl P0Cre/ PFKFB3fl/fl; P0Cre/ LDHAfl/fl; P0Cre). These mice showed no abnormalities and normal nerve structure with regular axon numbers and myelination with the exception of slightly elevated g ratios (axon diameter/myelinated fiber diameter) in sciatic nerves from adult GLUT1fl/fl; P0Cre mice (Extended Data Fig. 4a–1). As expected, the induction of GLUT1, PFKFB3, or LDHA expression in injury-activated SCs was abolished in the respective mutants (Extended Data Fig. 4m). In agreement with the metabolic coupling model, axon quantification in axotomized nerve segments demonstrated that these mutants displayed accelerated axon breakdown (Fig. 4c–e). Hence, the suppression of the hyper-glycolytic phenotype in SCs decreases the resistance of injured axons to degeneration.
To test if suppression of monocarboxylate coupling between SCs and injured axons through MCTs also evokes accelerated axon death, we resorted to the SC/DRG co-culture axotomy assay used earlier. We focused on chemical MCT inhibitors because siRNA silencing approaches in primary SCs did not result in significant reductions of MCT protein levels (30 and data not shown). The co-cultures were treated with control media or media containing pan-MCT inhibitors (4-CIN, UK-5099), or subtype-selective inhibitors (syrosingopine (MCT1/4), AR-C155858 (MCT1/2), BAY-8002 (MCT1/2)). 24h later, the inhibitor administration was followed by disconnection of the axons from the neurons to induce axon death. Importantly, no detrimental effects on axon morphology were observed after treatment with the inhibitors before injury (Extended Data Fig. 5a, b). All inhibitors significantly reduced axon survival 24h after axotomy, and for 4-CIN and syrosingopine to a level indistinguishable from neuron-only cultures (Fig. 4f, g and Extended Data Fig. 5c). Together, these findings indicate an important role of axon-glia metabolic coupling via monocarboxylate shuttling for the survival of injured axons.
In summary, these data support a central function of the SC glycolytic shift and axon-glia monocarboxylate coupling to antagonize AxD. This represents a novel glia-centric therapeutic potential for axon protection through manipulation of this endogenous response.
The mTOR pathway in SCs promotes the glycolytic shift and protects axons
We next sought to identify intracellular signaling pathways regulating the dynamic glycolytic switch in SCs, with the goal to augment the glial response therapeutically for possible axon protection. A screen for early phosphorylation events using antibody arrays revealed rapid activation of the mammalian target of rapamycin complex 1/2 (mTORC1/2) and AMP-activated kinase (AMPK) pathways in SCs minutes after nerve injury, key checkpoints that regulate cellular metabolism (Fig. 5a–e and Extended Data Fig. 6a, b). The mTOR metabolic signaling hub (acting through its complexes mTORC1 and mTORC2) is thought to stimulate glycolysis via downstream regulation of the transcription factor targets, Hif1α and c-Myc, in various contexts33–38, while AMPK can promote glycolytic activity through regulation of GLUT1 and PFKFB339. Accordingly, the mTORC1/2 induction was accompanied by a prominent rise of Hif1α and c-Myc expression in injury-activated SCs, concurrent with the glycolytic upregulation (Fig. 5f, g).
Fig. 5. mTOR inactivation in SCs results in accelerated AxD.
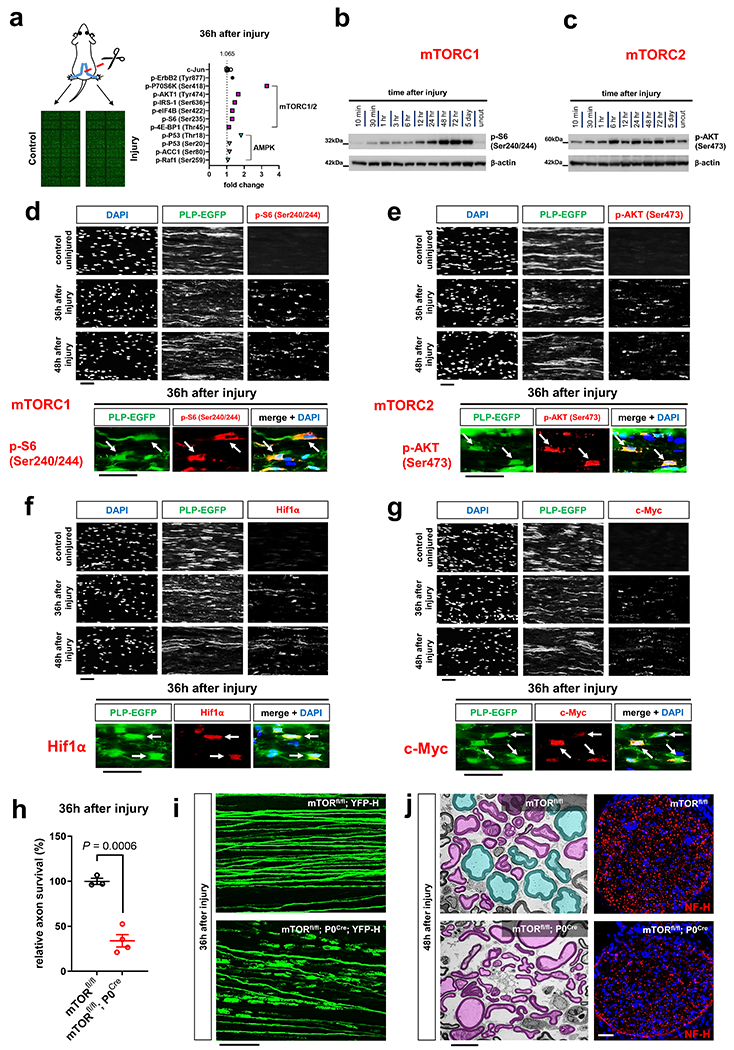
a, Left: Scheme of Phospho Explorer antibody array analysis with array images from the experiment using pooled groups of control and axotomized nerve segments. Right: Upregulation of phosphorylation targets representing mTORC1/2 (magenta squares) and AMPK (turquoise triangles) induction in axotomized nerve segments in comparison to upregulation of c-Jun and p-ErbB2 (Tyr877) (n=6 uninjured nerve segments and n=6 injured nerve segments from n=6 mice, each symbol represents the fold change value in comparison to the pooled uninjured control nerve group), b, c, Western blot analysis (cropped blot images) of lysates from uninjured nerve segments and axotomized distal sciatic nerve stumps from C57Bl/6J mice reflecting mTORC1 (b) and mTORC2 activity (c) at different times following nerve transection. Individual lanes represent pooled data from at least three mice. d-g, Representative immunofluorescence for the indicated markers on longitudinal frozen sections from control uninjured nerves and axotomized distal sciatic nerve stumps at the shown post-injury time points. Arrows depict colocalization. Scale bars: 50μm. The experiments were reproduced three times independently with similar results. h, Quantitative analysis of relative axon survival in distal sciatic nerve stumps 36h after axotomy in mice with the indicated genotypes (Error bars represent s.e.m. n=3 mice with the genotype mTORfl/fl and n=4 mice with the genotype mTORfl/fl; P0Cre). Statistical evaluation was performed using Student’s t-test, unpaired, two-tailed, i, Representative confocal projections of whole-mounted distal sciatic nerve stumps from mice with the indicated genotypes show increased fragmentation of transected YFP+ axons in the mTOR-deficient preparation. Scale bar: 100μm. The experiment was reproduced three times independently with similar results. j, Left: Representative electron micrographs of transverse sections from distal nerve stumps of mice with the indicated genotypes 48h after sciatic nerve transection with pseudocoloring of intact (turquoise) and degenerated (magenta) myelinated fibers show increased axon death in mTOR-deficient sample. Scale bar: 10μm. The experiment was reproduced three times independently with similar results. Right: Representative immunofluorescence of transverse frozen sections from 48h axotomized sciatic nerve stumps of mice with the indicated genotypes show decreased NF-H immunoreactivity in the mTOR-deficient preparation (blue: DAPI). Scale bar: 50μm. The experiment was reproduced three times independently with similar results.
To explore a role of the mTORC1/2 and AMPK pathways in SCs for the regulation of axon death, we severed axons of mTORfl/fl; P0Cre and AMPKα1fl/fl; α2fl/fl; P0Cre mice, which lack mTORC1/2 or AMPK activity in SCs, respectively. Only mTORfl/fl; P0Cre mutants displayed dramatically accelerated axon breakdown after nerve lesion (Fig. 5h–j and Extended Data Fig. 6c–j). Hence, the mTOR pathway is likely a crucial regulator of the SC glycolytic shift, impinging on many glycolytic components simultaneously to support axon integrity. To verify this, we next analyzed the injury-induced alterations of GLUT1, PFKFB3, LDHA, Hif1α and c-Myc expression. We found abolished upregulation of all these targets in mTORC1/2-deficient SCs after nerve lesion (Fig. 6a–c and Supplementary Fig. 3). Correspondingly, the enzymatic activity of LDH in axotomized mTORfl/fl; P0Cre nerve segments was reduced, in sharp contrast to the increase in control nerves (Fig. 6d). Moreover, the treatment of purified mouse SCs with the mTORC1 inhibitor everolimus (RAD001) resulted in markedly suppressed glycolytic activity (Fig. 6e).
Fig. 6. mTOR in SCs promotes the SC glycolytic shift upon injury.
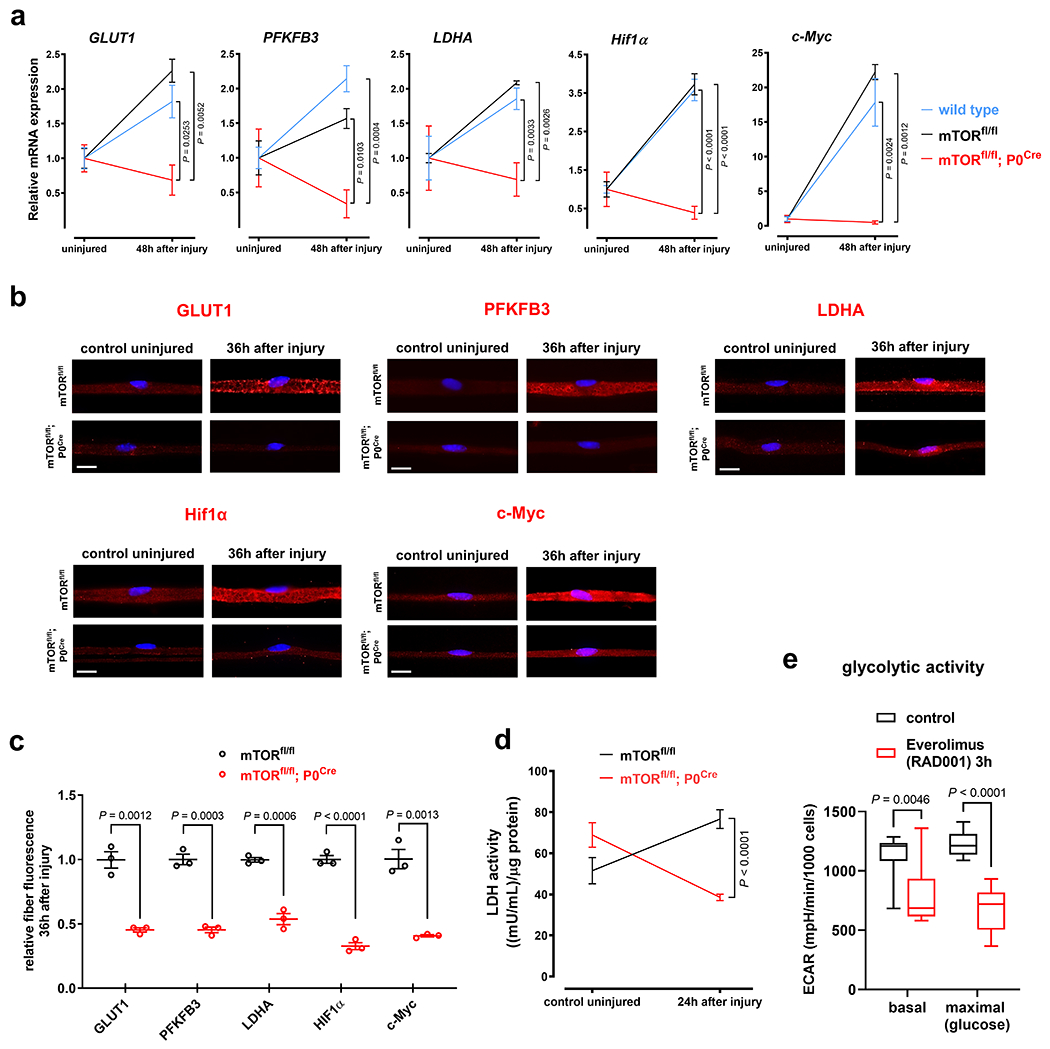
a, Relative injury-induced mRNA expression changes of indicated targets assessed by ddPCR in sciatic nerve lysates from mice with the shown genotypes (Error bars represent s.e.m. GLUT1: n=3 mice per genotype, PFKFB3: n=5 mice for wild type and n=3 mice for the genotypes mTORfl/fl and mTORfl/fl;P0Cre, LDHA: n=5 mice for wild type and mTORfl/fl;P0Cre, n=3 mice for mTORfl/fl, Hif1α: n=5 mice for wild type, n=3 mice for mTORfl/fl, n=4 mice for mTORfl/fl;P0Cre, c-Myc: n=5 mice for wild type, n=3 mice for mTORfl/fl, n=4 mice for mTORfl/fl;P0Cre). b, Representative immunofluorescence micrographs for the indicated markers on teased fiber preparations (b) from uninjured control and axotomized distal tibial nerve stumps (blue: DAPI). Scale bars: 10μm. c, Corresponding quantitative analysis of relative teased fiber fluorescence intensities for the shown markers (Error bars represent s.e.m. n=3 mice per marker and genotype) d, Injury-induced alterations of LDH enzymatic activity in nerve lysates from mice with the indicated genotypes and shown conditions (Error bars represent s.e.m. n=4 mice for mTORfl/fl, n=5 mice for mTORfl/fl;P0Cre) e, Box and whiskers plots (maximum, 25th percentile, median, 75th percentile, minimum) show basal glycolytic activity and maximal glycolytic activity after glucose injection as assessed by ECAR measurements in control- and everolimus-treated mouse SCs (n=9 well preparations per group).
Statistical evaluation in a was performed using One-way-ANOVA and Sidak’s multiple comparisons tests, and in c-e using multiple Student’s t-test, unpaired, two-tailed.
Together, these results strongly support the conclusion that the mTOR pathway promotes the glycolytic shift in SCs arising as a protective adaptation to axon injury.
The mTORC1-Hif1α/c-Myc axis in SCs protects injured axons
In line with earlier studies40, mTORfl/fl; P0Cre mice displayed hypomyelination and increased SC numbers in peripheral nerves (Extended Data Fig. 6g,h). These developmental abnormalities could lead to differential axonal configuration, thus potentially confounding our AxD assay. To prevent such effects, we designed experiments in which the injury-induced rise of mTOR activity can be suppressed by pharmacological (rapamycin treatment) or genetic means (tamoxifen treatment of mTORfl/fl; iSox10Cre mice) in mature SCs (Fig. 7a, b). The first approach lacks cell-type specificity, while the genetic approach allows targeted mTOR suppression in SCs. We found that these mouse models with normal nerve structure also showed accelerated axon breakdown (Fig. 7c, d and Extended Data Fig. 7a–d). This indicates that the AxD phenotype is due to mTOR-deficiency in SCs and not developmental nerve defects.
Fig. 7. The mTORC1-Hif1 α/c-Myc axis in SCs protects injured axons.
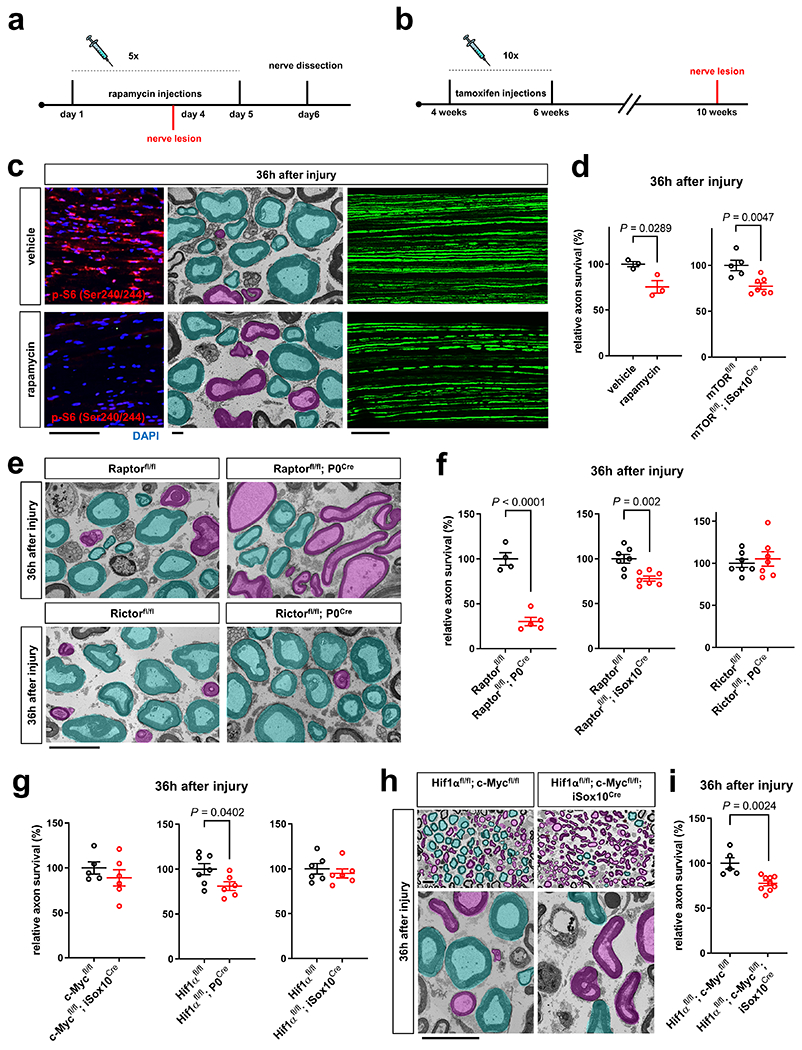
a, b, Experimental paradigm for rapamycin injections in Thy1.2-YFP-H (a) and tamoxifen injections in mTORfl/fl; iSox10Cre mice (b). c, Left: Representative p-S6 (Ser240/244) immunofluorescence reflecting mTORC1 activity on longitudinal distal sciatic nerve stump frozen sections from vehicle and rapamycin treated mice 36h after axotomy. Scale bar: 100μm. Middle: Representative electron micrographs of transverse sciatic nerve sections distal to injury with pseudocoloring of intact (turquoise) and degenerated (magenta) myelinated fibers show more advanced AxD after rapamycin treatment. Scale bar: 2μm. Right: Representative confocal micrographs of whole-mounted distal sciatic nerve stumps from vehicle or rapamycin-treated Thy1.2-YFP-H mice show more advanced axon fragmentation after rapamycin treatment. Scale bar: 100μm. d, f, g, i, Quantitative analysis of relative axon survival in distal sciatic nerve stumps 36h after axotomy in vehicle and rapamycin-treated mice, and mice with the indicated genotypes (Error bars represent s.e.m. d (left), n=3 mice per condition, d (right), n=5 mice for mTORfl/fl and n=7 mice for mTORfl/fl; iSox10Cre, f (left), n=4 mice for Raptorfl/fl and n=5 mice for Raptorfl/fl; P0Cre, f (middle and right), n=7 mice for each genotype, g (left), n=5 mice for c-Mycfl/fl and n=6 mice for c-Mycfl/fl; iSox10Cre, g (middle), n=7 mice for Hif1αfl/fl and n=6 mice for Hif1αfl/fl; P0Cre, g (right), n=6 mice for each genotype, i, n=5 mice for Hif1αfl/fl; c-Mycfl/fl and n=9 mice for Hif1αfl/fl; c-Mycfl/fl; iSox10Cre). e, h, Representative semithin (h only, top) and electron micrographs of transverse sciatic nerve sections from distal nerve stumps of mice with the indicated genotypes 36h after sciatic nerve transection with pseudocoloring of intact (turquoise) and degenerated (magenta) myelinated fibers. Scale bars: 10μm.
Statistical evaluation in d, f, g, and i was performed using Student’s t-test, unpaired, two-tailed.
We next delineated individual components of the metabolic pathway in SCs regulating the stability of injured axons. We found that mutants with elimination of mTORC1 activity in SCs (Raptorfl/fl; P0Cre/ Raptorfl/fl; iSox10Cre), but not inactivation of mTORC2 activity (Rictorfl/fl; P0Cre), displayed accelerated axon death (note that Rictorfl/fl; P0Cre mice showed normal mTORC1 induction in SCs) (Fig. 7e, f and Extended Data Fig. 7e–h). Mice lacking c-Myc in the SC lineage (c-Mycfl/fl; P0Cre) showed severe developmental nerve defects leading to early lethality. This led us to study exclusively c-Mycfl/fl; iSox10Cre mice, which showed no nerve abnormalities after efficient recombination in post-developmental SCs (Extended Data Fig. 8a–c). Likewise, adult mice with deletion of Hif1α in SCs (Hif1αfl/fl; P0Cre) showed no abnormalities (Extended Data Fig. 8d–h). Consistent with the model that Hif1α and c-Myc regulate the glycolytic induction in cooperative manner34–38, there were only weak or no alterations in the rates of axon death in mutants lacking either c-Myc or Hif1α in SCs (c-Mycfl/fl; iSox10Cre/ Hif1αfl/fl; P0Cre/ Hif1αfl/fl; iSox10Cre) (Fig. 7g and Extended Data Fig. 8i). Intriguingly however, Hif1αfl/fl; c-Mycfl/fl; iSox10Cre double mutants phenocopied the accelerated axon death observed in mice with depletion of mTORC1 in mature SCs (Fig. 7h, i and Extended Data Fig. 8j–l).
We conclude that specifically mTORC1 signaling, together with the downstream components Hif1α and c-Myc in concert, promote the SC glycolytic shift to protect injured axons. The manipulation of glycolytic activity in SCs through this pathway may constitute a promising therapeutic target to promote axon stability.
Delaying AxD through mTORC1 hyperactivity in SCs
In contrast to the acceleration of AxD in the models used so far, we next set out to test if augmenting mTORC1 activity in SCs delays axon death. We took advantage of the fact that the disruption of the TSC1-TSC2 complex results in sustained mTORC1 hyperactivity in SCs41, 42. To avoid developmental nerve defects, we generated TSC2fl/fl; iSox10Cre mice to induce TSC2 ablation in SCs from adult mice. Western blotting demonstrated pronounced mTORC1 hyperactivity in nerves from these mutants 30 days after tamoxifen administration (Fig. 8a). Nevertheless, myelinated axons appeared normal in mutant sciatic nerves (Extended Data Fig. 9). In agreement with our model, quantification of axon survival 36h and 48h after nerve injury revealed that axon breakdown was substantially delayed (Fig. 8b).
Fig. 8. Axon protection through mTORC1 hyperactivity in SCs.
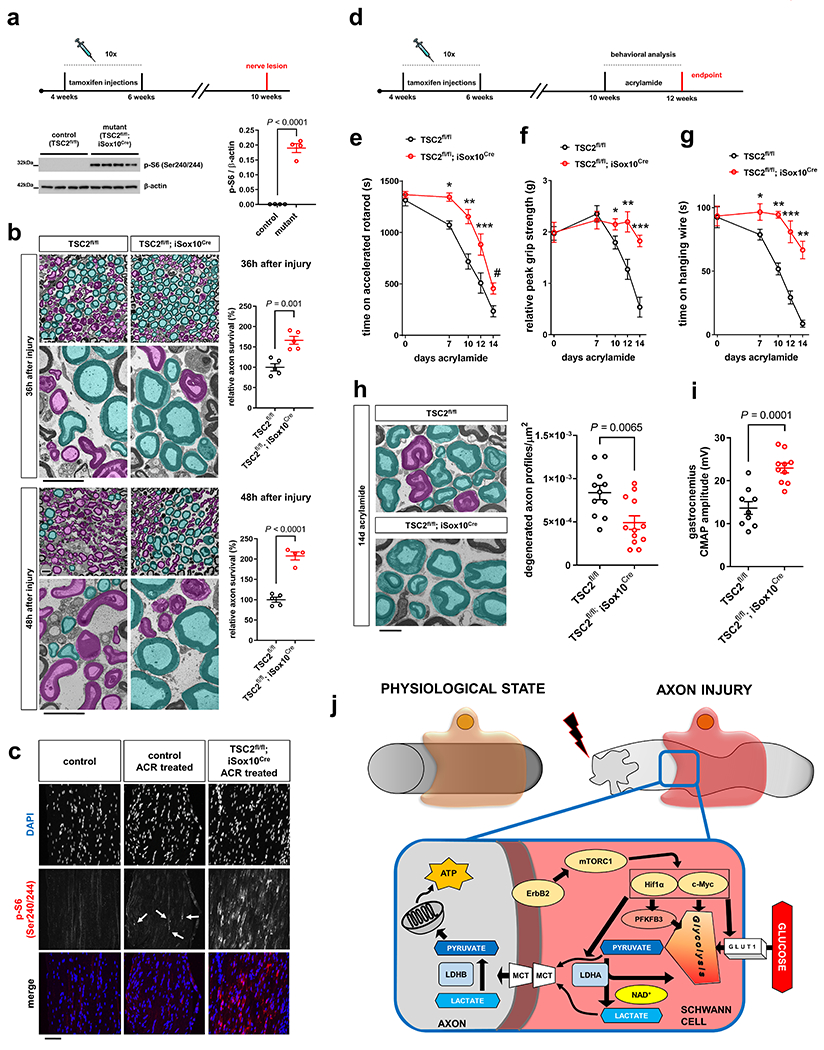
a, Top: Experimental paradigm for tamoxifen injections and nerve lesion in TSC2fl/fl; iSox10Cre mice. Bottom: mTORC1 activity western blot analysis (cropped blot images) of sciatic nerve lysates from control and TSC2fl/fl; iSox10Cre mice (30 days after last tamoxifen administration) (Error bars represent s.e.m. n=4 mice per genotype. Each dot represents measurement from sciatic nerve lysate from one mouse). b, Representative semithin (top) and electron micrographs (bottom) of transverse sciatic nerve sections from distal nerve stumps of control and TSC2fl/fl; iSox10Cre mice (30 days after last tamoxifen administration) at the indicated post-injury times with pseudocoloring of intact (turquoise) and degenerated (magenta) myelinated fibers, and corresponding quantitative analysis of relative axon survival. Note preservation of many myelinated axons in TSC2fl/fl; iSox10Cre mice with intact axoplasm and non-collapsed myelin sheaths. In contrast, most axons are degenerated in control mice 48h after injury (Error bars represent s.e.m. 36h after injury, n=5 mice per genotype. 48h after injury, n=5 mice for TSC2fl/fl and n=4 mice for TSC2fl/fl; iSox10Cre). Scale bars: 10μm. c, Representative mTORC1 immunofluorescence of longitudinal tibial nerve frozen sections from untreated, and ACR-treated control and TSC2fl/fl; iSox10Cre mice (14d ACR treatment started 30d after last tamoxifen administration). Note occasional mTORC1 increases (arrows) in ACR-treated control nerves in injury-activated SCs, and marked mTORC1 hyperactivity in cells from ACR-treated TSC2fl/fl; iSox10Cre mice. Scale bar: 100μm. The experiment was reproduced three times independently with similar results. d, Experimental paradigm for tamoxifen injections, acrylamide administration, and behavioral analysis in TSC2fl/fl; iSox10Cre mice. The endpoint indicates time of electrophysiological and morphological analysis. e-g, Accelerated rotarod (e), relative grip strength (f), and hanging wire (g) analysis of ACR-treated control and TSC2fl/fl; iSox10Cre mice (Error bars represent s.e.m. e, n=11 TSC2fl/fl mice for 0, 7, 10, and 14 days acrylamide, n=8 TSC2fl/fl mice for 12 days acrylamide, n=14 TSC2fl/fl ; iSox10Cre mice for 0, 7, and 10 days acrylamide, n=10 TSC2fl/fl ; iSox10Cre mice for 12 days acrylamide, n=13 TSC2fl/fl ; iSox10Cre mice for 14 days acrylamide, f, g, n=9 TSC2fl/fl mice and n=10 TSC2fl/fl ; iSox10Cre mice for each time point, *P=0.0001, **P=0.0003, ***P=0.0212, #P=0.0090 in e,*P=0.0475, **P=0.0042, ***P<0.0001 in f, *P=0.0394, **P<0.0001, ***P=0.0001 in g). h, Left: Representative electron micrographs of transverse tibial nerve sections from control and TSC2fl/fl; iSox10Cre mice (6 weeks after last tamoxifen administration) following 14d of ACR admininistration, with pseudocoloring of intact (turquoise) and degenerated (magenta) myelinated fiber profiles. Scale bar: 5μm. Right: corresponding quantitative analysis shows densities of degenerated axon profiles (Error bars represent s.e.m. n=11 TSC2fl/fl mice and n=12 TSC2fl/fl ; iSox10Cre mice). i, Analysis of CMAP amplitudes recorded in gastrocnemius muscles evoked after sciatic nerve stimulation of control and TSC2fl/fl; iSox10Cre mice following 14d of ACR treatment (Error bars represent s.e.m. n=9 TSC2fl/fl mice and n=10 TSC2fl/fl ; iSox10Cre mice). j, Model for the regulation of monocarboxylate production and release, driven by the mTORC1-Hif1α/c-Myc axis in injury-activated SCs, to support the integrity of injured axons. mTORC1 induction occurs upon ErbB2 activation in SCs. This promotes the expression of Hif1α and c-Myc which together drive the expression of glycolytic components including GLUT1, PFKFB3 and LDHA to increase the production of pyruvate and lactate from imported glucose. These monocarboxylates are shuttled into axons via MCTs (MCT1 and 4 in SCs and MCT2 in axons). While pyruvate can be directly utilized in axonal mitochondria for ATP production, lactate requires conversion into pyruvate by LDHB.
Statistical evaluation in a, b, h, and i was performed using Student’s t-test, unpaired, two-tailed, and in e-g using multiple Student’s t-test, unpaired, two-tailed.
These results show for the first time that AxD in vivo can be delayed by non-cell autonomous effects through amplification of mTORC1 activity in SCs.
SC mTORC1 hyperactivity protects against subacute AxD
Unlike the rapid disintegration of mechanically transected axons, the continuity of axons undergoing subacute perturbation in neuropathies is largely preserved1. To study the effects of SC mTORC1 amplification in such a setting, we used an established rodent model of axonopathy that occurs after oral administration of acrylamide (ACR)43, 44. In agreement with previous work43, we found that mice treated with ACR supplied in drinking water for 14 days develop prominent muscle weakness, ataxia and locomotor deficits, while sensory deficits are rather minor relative to motor dysfunction (Extended Data Fig. 10a, b). This was accompanied by a decline of compound muscle action potential (CMAP) amplitudes in gastrocnemius muscles, and the degeneration of myelinated fibers in tibial nerves, whereas unmyelinated axons appeared unaffected (Extended Data Fig. 10c–f). In contrast to the strong induction of mTORC1 activity in SCs responding to the transection of all axons, we observed only slight and occasional mTORC1 increases in SCs following ACR treatment (Fig. 8c). These findings are in line with a mild and asynchronous nature of axon injury and subsequent glial metabolic response in this paradigm. We thus postulated this model would afford us the opportunity to enhance the stability of distressed axons by augmented glial mTORC1 activity in ACR-treated nerves of TSC2fl/fl; iSox10Cre mice (Fig. 8c, d). Indeed, the neurological disease progression as assessed by accelerated rotarod, grip strength analysis, and the hanging wire test was markedly ameliorated in TSC2fl/fl; iSox10Cre mice treated with ACR for 14 days (Fig. 8e–g). Important for the interpretation of these data, no weight differences between control and TSC2fl/fl; iSox10Cre mutants were observed (Extended Data Fig. 10g). Consistent with the behavioral results, the number of degenerative axon profiles and the decline in CMAP amplitudes after ACR administration was significantly reduced in TSC2fl/fl; iSox10Cre mice compared to control animals (Fig. 8h, i).
These data show that the preemptive amplification of mTORC1 activity in SCs confers axon protection and ameliorates the neurological deficits resulting from subacute AxD in a neurotoxicity model for neuropathy.
Discussion
This study demonstrates a physiological metabolic adaptation of SCs that protects injured axons. The centerpiece of this dynamic adaptation in response to axon injury is a hyper-glycolytic SC phenotype that is driven by activation of the mTORC1-Hif1α/c-Myc axis. The disruption of individual components of this pathway renders injured axons more susceptible to degeneration, while its preemptive amplification affords enhanced tolerance against AxD. Together, our study expands the mechanistic framework for the regulation of axon stability by addition of a non-cell autonomous mechanism, and invites a new and more comprehensive perspective on approaches to antagonize AxD in disease.
Experimental injury-induced AxD is a widely used model to study the mechanisms of axon demise, a common thread among many acute and chronic neurodegenerative conditions. Previous work identified core neuronal components and molecular mechanisms modulating the commitment to axon death1–3. However, whether the resistance of injured axons to degeneration is also regulated by non-cell autonomous mechanisms remained elusive. We previously hypothesized that SCs support axon integrity through the supply of monocarboxylates22. We reasoned that the need for these substrates should be accentuated when axons are distressed by injury or disease. This, together with our finding that the association of SCs with axons antagonizes axon death, prompted us to search for metabolic alterations in SCs that could counteract the energetic failure of injured axons and extend axon survival. We found that SCs rapidly undergo a vigorous metabolic transformation that favors glycolysis over oxidative metabolism, and arises when injured axons sustain energetic depletion before death. Importantly, the metabolic rewiring is accompanied by dramatic upregulation of monocarboxylate transporters in SCs upon injury, suggesting elevated delivery of pyruvate and lactate to perturbed axons to help meet their heightened energetic demands. In fact, addition of a cell-permeable form of pyruvate to injured axons confers profound axon protection. The notion that such monocarboxylates are consumed increasingly by energy-hungry axons in response to injury is supported by our finding of the initially decreased, but then elevated lactate concentrations in nerve segments following axon death. The analysis of extracellular media acidification rates (ECAR) caused by glycolytic end products of such axotomized nerve segments demonstrates that monocarboxylates are indeed released, and eventually accumulate extracellularly as consumption by dying axons ceases. In further support of our model, the suppression of pyruvate and lactate production in SCs through the inactivation of GLUT1, PFKFB3 or LDHA accelerates the death of injured axons in vivo. Moreover, inhibiting transfer of monocarboxylates between SCs and axons by administration of a variety of MCT inhibitors to co-cultures accelerates axon death in vitro. Together, these data provide multiple lines of evidence for a model in which the glycolytic boost in SCs is aimed at sustaining the integrity of distressed axons. Our data lead us to propose that glial monocarboxylates, delivered into axons to an increasing extent after injury, promote the survival of perturbed axons through the support of axonal bioenergetics (Fig. 8j). The oxidative utilization of these fuels would support critical functions such as preservation of axonal ion gradients and axonal transport, features essential for axon survival.
To make the manipulation of the glycolytic pathway in SCs more amenable to novel glia-centered axon protection strategies, we sought to identify upstream regulators directing the metabolic adaptation of SCs. We discovered activation of the mTOR pathway in SCs within minutes after axon injury. The mTOR pathway, particularly the mTORC1 branch, is intimately involved in the regulation of cellular metabolism and promotes glycolysis via its downstream targets Hif1α and c-Myc33–38. Accordingly, we show that attenuating mTOR activity in SCs ceases the glycolytic response of injury-activated SCs. This is expected to result in a lack of metabolic support for perturbed axons, and indeed leads to faster AxD in several mouse models. The concomitant depletion of Hif1α and c-Myc in SCs of mice phenocopies this effect, in line with the cooperative role of these transcription factors in promoting the expression of a broad range of downstream glycolytic targets35–37. Additionally, our data is supported by a previously reported axon-protective role of Hif1α in SCs in context of ACR-induced AxD44.
In the later stages of WD following axon death, SCs are traditionally best known to ‘dedifferentiate’ and undergo a transformation to a long-lasting repair cell phenotype that promotes axon regeneration17–21. In contrast to this established function, we propose an earlier and novel anti-degenerative role of SCs that is aimed at the stabilization of injured axons. This preempts the need for axon regeneration if perturbed axons, re-energized by SCs, can recover from injury. In fact, axon injury in disease scenarios is thought to be much milder and temporary or periodic, not invariably leading to axon disintegration. This provides the opportunity for axon recovery through the glial metabolic mechanism identified here. Our data demonstrating that glial mTORC1 activation can alleviate ACR-induced axonopathy support this concept. Interestingly, a recent study demonstrated that mTORC1 signaling also supports axon regeneration by promoting the expression of the critical c-Jun transcription factor in repair SCs45. This suggests the intriguing idea that mTORC1 signaling in SCs may coordinate AxD and regeneration programs in injured nerves. An early anti-degenerative role of SC mTORC1 (our study) would be advantageous in instances where the integrity of the injured axon is compromised but not lost. In contrast, a pro-regenerative action of mTORC1 in dedifferentiated repair SCs45 would be beneficial if axon damage is too severe to enable recovery.
The actual axon injury signal that accounts for the activation of the mTORC1-Hif1α/c-Myc axis and thus the glycolytic switch in SCs remains elusive. Of note, the activation of this pathway in SCs as assessed by mTORC1 activity staining occurs rather uniformly throughout the separated nerve stump, with only slight gradients detectable between proximal and distal portions (Supplementary Fig. 4). This suggests that an injury signal arises relatively synchronously along the entire length of a disconnected axon and activates adjacent SCs including those millimeters away from the injury site, in line with the strikingly rapid propagation of axon disintegration27. The fact that ErbB2 receptor activation occurs minutes after axon injury in SCs14 suggests that changes of its ligand, neuregulin 1 (Nrg1), are involved. The splice isoform Nrg1 type III is bound to axonal membranes, and cleavage mechanisms on the injured axolemma could explain the early glial ErbB2 activation. Additionally, a recent study showed that the expression of the isoform Nrg1 type I is upregulated and released early from injury-activated SCs46. Several signaling pathways downstream of ErbB2 activation by such Nrg1 isoforms converge on the mTORC1 pathway. Among these, MAPK signaling has been reported to show early activation in SCs in response to nerve injury15, 47. Future studies will be needed to elucidate if the mTORC1-Hif1α/c-Myc axis is regulated by such signaling mechanisms in SCs.
Our findings demonstrating axon protection in acute and subacute injury paradigms raise questions about the therapeutic applicability for the large group of hereditary neuropathies and, for example, those associated with chemotherapy treatment. AxD is the major determinant of clinical disability in these conditions, but therapies to inhibit AxD do not exist. Hence, future studies will be of interest to investigate the therapeutic potential of glial mTORC1 increase, or enhancement of SC glycolysis and monocarboxylate transfer by other means, in models for these disorders. In parallel, because the metabolic SC response is a physiological adaptation to injury, it will be important to study its scale in SCs of diseased nerves. Since mTORC1 signaling in SCs has been recently implicated in the formation as well as the dismantling of myelin41, 42, 45, 48, it is possible that abnormal mTORC1 activity in diseased SCs of dys- and demyelinating neuropathy models is decoupled from axon injury signaling. Manipulation of glial mTORC1 in such context would likely impact both the myelination status and axon integrity.
Previous strategies specifically directed at the preservation of axons in neuropathy models have focused exclusively on neuronal components including expression of the aberrant WldS protein and inactivation of the axon death molecule Sarm11–3. These factors prevent the execution of the axonal auto-destruction pathway that is activated on axon transection. The rationale for their manipulation was based on the concept that this axonal auto-destruction pathway is also active in disease. As this may be true for many disorders, it may not be universally applicable49, 50. Thus, the possibility to increase the resilience of axons against distinct forms of degeneration through the trophic mechanism presented here is attractive. Intriguingly, given the involvement of mTOR signaling, it is conceivable that the nutritional status or other environmental factors may feed back on axon integrity through this pathway.
Methods
Mice
The mice used in this study were of mixed sexes. In previous studies we found no significant differences in the rates of injury-induced AxD between female and male mice. Mice within individual in vivo experiments were littermates or, if use of littermates was not possible because of small litter sizes, mice from different litters were age and sex matched. All in vivo nerve lesion experiments used animals between 7 and 24 weeks of age. Mice used include following mouse groups: CD1 (Charles River #022), C57Bl/6J (The Jackson Laboratory #000664), PLP-EGFP51, Thy1.2-YFP-H (The Jackson Laboratory #003782), GLUT1fl/fl; P0Cre, PFKFB3fl/fl; P0Cre; LDHAfl/fl; P0Cre, AMPKα1fl/fl; α2fl/fl; P0Cre, mTORfl/fl; P0Cre, mTORfl/fl; iSox10Cre, Raptorfl/fl; P0Cre, Raptorfl/fl; iSox10Cre, Rictorfl/fl; P0Cre, c-Mycfl/fl; P0Cre, c-Mycfl/fl; iSox10Cre, Hif1αfl/fl; P0Cre, Hif1αfl/fl; iSox10Cre, Hif1αfl/fl; c-Mycfl/fl; iSox10Cre, and TSC2fl/fl; iSox10Cre. C57Bl/6J, CD1, PLP-EGFP and Thy1.2-YFP-H mice were used for all metabolic profiling experiments requiring wild type animals. Thy1.2-YFP-H mice were used for rapamycin treatment experiments. C57Bl/6J and TSC2fl/fl; iSox10Cre mice were used for ACR treatment experiments. Mice were housed under specific pathogen free conditions at 70°F, 50% room humidity, 12-hours light/12-hours dark cycle, and received ad libitum access to water and food. Mice from different genotypes were group-housed in separate cages. Mice did not undergo any procedures prior to their stated use. All mouse husbandry and experimental procedures were reviewed and approved by the Roswell Park Comprehensive Cancer Center and the University at Buffalo Institutional Animal Care and Use Committee (protocol approvals UB1301M and UB1401M).
To generate GLUT1fl/fl; P0Cre, AMPKα1fl/fl; α2fl/fl; P0Cre, mTORfl/fl; P0Cre, mTORfl/fl; iSox10Cre, Raptorfl/fl; P0Cre, Raptorfl/fl; iSox10Cre, Rictorfl/fl; P0Cre, c-Mycfl/fl; P0Cre, c-Mycfl/fl; iSox10Cre, Hif1αfl/fl; P0Cre, Hif1αfl/fl; iSox10Cre, Hif1αfl/fl; c-Mycfl/fl; iSox10Cre, and TSC2fl/fl; iSox10Cre mutant mice, the respective floxed mice (GLUT152, AMPKα1 (The Jackson Laboratory #014141), AMPKα253, mTOR (The Jackson Laboratory #011009), Raptor (The Jackson Laboratory #013188), Rictor (The Jackson Laboratory #020649), Hif1α (The Jackson Laboratory #007561), c-Myc54, and TSC255) were crossed to P0-Cre 56 or iSox10-CreERT2 transgenic mice57. mTORfl/fl; P0Cre mice were additionally crossed to Thy1.2-YFP-H mice for fluorescent axon imaging. Littermates carrying floxed alleles, but lacking Cre expression, were used as controls.
To generate PFKFB3fl/fl; P0Cre and LDHAfl/fl; P0Cre mice, we obtained following mutant mouse strains from the European Mouse Mutant Archive (EMMA): C57BL/6N-Pfkfb3tm1a(EUCOMM)Wtsi/Ieg (#EM:09829) ; B6Dnk;B6Brd;B6N-Tyrc-Brd Ldhatm1a(EUCOMM)Wtsi/WtsiCnbc (#EM:05082). These mouse strains were first crossed to germ cell-expressing Flp recombinase transgenic mice (FlPo; B6 ROSA26 FLPo, The Jackson Laboratory #012930) to deactivate the ‘knockout-first-allele’ promoterless cassette (containing splice acceptor, lacZ, neo and polyadenylation signal for constitutive knockout). This allowed us to generate PFKFB3fl/fl and LDHAfl/fl mice which were then crossed to P0-Cre mice. Because of silencing effects of the gene-trap allele on the endogenous LDHA gene, we used sex and age-matched C57Bl/6J mice as controls for LDHAfl/fl; P0Cre mice in axotomy experiments.
Genotyping for all mutants was performed by PCR strategies using standard procedures and appropriate primers (sequences available upon request).
Culture of primary neurons and SCs
Mouse dorsal root ganglion (DRG) neurons were cultured as previously described9. DRGs were dissected from several E14.5 CD1 mouse embryos (Charles River, 022), pooled together, dissociated in 0.05% Trypsin/EDTA (Gibco, 25030-081), and plated as a single spot as previously described58 in each well of a 24-well plate coated with poly-D-lysine (Sigma, P0899) and laminin (Invitrogen, 23017-015). Each spot contained cells from ~1.5 ganglia. Neuronal cultures were maintained in Neurobasal medium (Gibco, 21103-049) with B27 serum-free supplement (Life Technologies, 17504-001), 2mM Glutamine (Gibco, 25030-081), 100U/ml Penicillin/Streptomycin (Thermo Fisher Scientific, 15-140-122), and 50ng/ml 2.5S nerve growth factor (NGF) (Envigo, B.5025). 1μM of uridine (Sigma, U3003) and 1μM of 5-fluoro-2’-deoxyuridine (Sigma, F0503) (U/FDU) were added to the medium to inhibit cell division and deplete non-neuronal cells. Half of the medium was changed every four days.
Rat SCs were obtained using immunopanning procedures as described previously59, or magnetic cell sorting (see below). Mouse SCs were obtained using magnetic cell sorting (see below). Rat SCs were grown in DMEM with high glucose (Thermo Fisher Scientific, 11-965-092), 10% fetal bovine serum (FBS) (Sigma, F0926), 2mM Glutamine (Gibco, 25030-081), 100 U/ml Penicillin/Streptomycin (Thermo Fisher Scientific, 15-140-122), 2μM forskolin (Calbiochem, 344270), and 2ng/ml of Recombinant human neuregulin (R&D Biosystems, 396-HB). Cells were used up to the 6th passage and discarded afterwards. Mouse SC preparations were grown in DMEM with high glucose (Thermo Fisher Scientific, 11-965-092), 10% normal horse serum (Gibco, #26050-088), 2 μM forskolin (Sigma, F3917), 20μg/ml bovine pituitary extract (Sigma, P1476), and 100U/ml Penicillin/Streptomycin (Thermo Fisher Scientific, 15-140-122). Mouse SCs preparations were used immediately for experiments and were not passaged.
For axon-glia co-culture experiments, rat SCs were trypsinized (Gibco, 25030-081), centrifuged at 300g for 10 minutes, and plated (200,000 cells/well) on DRGs neurons at day in vitro (DIV) six in C-medium, containing DMEM with high glucose (Thermo Fisher Scientific, 11-965-092) supplemented with 10% heat-inactivated FBS (Life Technologies, 16000044), 2mM Glutamine (Gibco, 25030-081), and 50ng/ml 2.5S NGF (Envigo, B.5025). After 24h, 50μg/ml of Ascorbic acid (Sigma, A4544) and 50μg/ml of Heparin (Sigma, H3149) were added to the medium to initiate axon-glia association. The co-culture medium was changed every two days. Axotomy was performed prior to myelin formation as verified by immunofluorescence for myelin markers.
Purification of mouse and rat SCs
Mouse SCs were purified from C57Bl/6J postnatal (P) P6-P7 pups by magnetic cell sorting (MACS, Miltenyi Biotec) via p75 NGF receptor antibody selection, as previously described60 with minor modifications. Dissected sciatic nerves were collected in ice-cold L15 medium (Gibco, 11415-064) supplemented with Gentamycin (50mg/ml, Gibco, 15750), mechanically chopped with a scalpel, and enzymatically dissociated by sequential treatment with 0.05% Type 1 Collagenase (Worthington Biochemical Corp, LS004196) and 0.125% Trypsin (Worthington Biochemical Corp, LS003708) for 30 min at 37°C in a 9% CO2 incubator. Enzymatic treatment was stopped by addition of 40% fetal bovine serum (FBS) in HBSS (Gibco, #14170-112). The samples were then centrifuged (300 rcf for 10min), re-suspended in 10% FBS (Sigma, F0926) in DMEM, and passed through a 70μM nylon cell restrainer (Corning) for debris removal. Cells were pelleted (300 rcf for 10min) and re-suspended in SC medium (10% normal horse serum (Gibco, #26050-088), 2μM Forskolin (Sigma, F3917), 20μg/ml bovine pituitary extract (Sigma, P1476), and penicillin-streptomycin in DMEM), and plated on PLL/laminin (Sigma, P5899 and Invitrogen, 23017-015) coated 35mm dishes. These mixed cultures, containing both SCs and fibroblasts, were allowed to expand for 3-4 days (37°C, 9% CO2), or until the ratio of fibroblast/SCs reached 50/50, as evaluated by cell morphology using phase contrast microscopy. Cells were then magnetically sorted based on the expression of the SC marker p75NGFR. The SC purification procedure was carried out according to the manufacturer’s protocol (Miltenyi Biotec). Briefly, cells were collected and treated at 4°C with FcR blocking reagent (Miltenyi Biotec, #130-092-233), and subsequently incubated with p75NGFR antibody (1:20, Millipore AB1554). After washing off excess antibody solution, the cells were exposed to magnetic microbead-conjugated IgG anti-rabbit antibody (Miltenyi Biotec, 130-048-602). The magnetically labeled cell fraction was separated from unlabeled cells using pre-equilibrated LS columns (Miltenyi Biotec) placed in the magnetic field of a MACS separator (Miltenyi Biotec). The p75NGFR+ cell fraction was eluted from the column, and plated on PLL/Laminin coated dishes or cell culture multi-well plates for individual experiments.
Sprague Dawley P3 rat pups (Taconic Biosciences #SD) were used for magnetic cell sorting of rat SCs in an analogous way using a rat-specific p75NGFR antibody (1:20, Millipore MAB365) and rat anti-mouse IgG1-conjugated microbeads (Miltenyi Biotec, 130-047-102). The rat animal experiments were reviewed and approved by the Roswell Park Comprehensive Cancer Center and the University at Buffalo Institutional Animal Care and Use Committee (protocol approval UB1359R).
Analysis of axon survival after in vitro axotomy
For both neuron-only and axon-glia co-cultures, axotomy was performed by transecting neurites with a micro-scalpel at DIV12 as previously described9. 20 mM methyl-pyruvate (Sigma, 371173), 5 mM 4-CIN (Tocris, 5029), 5 or 10 μM Syrosingopine (Biovision, B1323), 1 or 100 μM AR-C155858 (Tocris, 4960/1), 30 nM BAY-8002 (Tocris, 6817/10), 10 μM UK-5099 (Tocris, 4186/10), and the respective vehicle solutions (EtOH, DMSO) were applied 24h prior, and again at the time of axotomy. The concentrations of the drugs were chosen based on previous reports61–65. All cultures were fixed 24h after axotomy with 4% paraformaldehyde in 0.1M PBS, and immunostained for β-III-tubulin (1:500, Biolegend 801203) and neurofilament heavy chain (1:500, Sigma N4142) to assess axon morphology by wide-field epifluorescence or confocal microscopy. Axon survival on fluorescence micrographs was quantified by counting the number of intact (continuous, not fragmented) neurites intersecting a line drawn across the image, according to a previously described method11. For each experiment the conditions were assayed in triplicate wells, and for each well three fields were imaged and analyzed, with particular attention to select representative fields with similar number of neurites and in similar regions of the well in respect to the location of neurite transection (each field represents a group of distinct DRG neurites). Each experiment was repeated three to five times on different days (two exceptions with one to two repetitions for individual MCT inhibitor concentrations as noted in figure legends), and the data from all experiments were included in the final quantification of axon survival.
For the assessment of axon survival in microfluidic devices, DRG neurons prepared from CD1 mice as described above were plated in 22 x 22mm poly-dimethysiloxane (PDMS) microfluidic devices with 5 μm wide and 350 μm long microgrooves. The PDMS devices were prepared from silicon wafer molds kindly provided by Dr. Christopher Deppmann, Department of Biology, University of Virginia, Charlottesville, as described previously66. The PDMS devices were mounted on square glass coverslips within 35 mm plastic dishes that were coated with poly-D-lysine and laminin (Sigma, P0899 and Invitrogen, 23017-015). Three μl of dissociated neuron solution (containing cells from ~1.5 ganglia) were injected into one of the 4 ports of the device, the device was gently tapped to facilitate cell flow within the chamber, and the cells were allowed to adhere to the plate for 15 minutes. Neuronal culture medium as described above was then added to all the ports, and cultures were maintained in this medium. This procedure allowed neurite extension to the opposite chamber through the microgrooves at DIV1. The devices were routinely examined for leakage, detachment, or inadequate axon growth, and preparations that presented aberrant axon growth were discarded. At DIV6, ~700,000 rat SCs were re-suspended in C-medium, plated in the opposite port, and allowed to enter the chamber to associate with the distal neurites. The distal ports and chambers were then filled with C-medium. The 5 μm wide groove largely prevented the migration of SCs into the opposite chamber towards the neuronal cell bodies. 24h later, 50 μg/ml of ascorbic acid (Sigma, A4544) and 50 μg/ml Heparin (Sigma, H3149) were added to the medium to initiate axon-glia association. Axon injury was induced at DIV 11 by mechanical aspiration of the neuronal cell bodies. Cultures were fixed 24h after axotomy, immunostained, and fluorescence micrographs were analyzed as described above to determine axon survival. Each experiment was repeated three to four times on different days, and the data from all experiments were included in the final quantification of axon survival.
The quantification of axon survival was performed blind to the experimental condition except for the experiments involving comparison of neuron-only and co-cultures (due to the fact that morphology of co-cultures differed from that of neuron-only cultures).
Unilateral sciatic nerve transection
Mice were deeply anaesthetized by isoflurane inhalation. Right sciatic nerves were exposed and transected with micro-scissors close to the sciatic notch with the contralateral sciatic nerves serving as control. The wound was closed with surgical thread, and buprenorphine was administered as post-surgery analgesic. Upon nerve removal from humanely killed mice, the lesion site was inspected to verify complete nerve transection. Distal sciatic nerve stumps (~5 mm) and control nerve segments (uninjured contralateral, equivalent nerve segment) were processed for semithin/electron microscopy, or for confocal microscopy of wholemount nerve preparations (if mice additionally carried the Thy1.2-YFP-H transgene). For immunofluorescence, in situ histochemical, and biochemical analyses, distal sciatic and tibial nerve stumps (~7 mm) and equivalent control nerve segments (uninjured contralateral) were rapidly dissected and processed as described below.
Nerve and teased fiber immunofluorescence and quantification
Sciatic nerve segments were immersion fixed in 4% PFA/0.1M PBS for 2h, cryoprotected in 30% sucrose, embedded in Tissue-Tek OCT compound (Sakura Finetek), and sectioned at 12μm on a Leica cryostat. Immunofluorescence on longitudinal and transverse frozen nerve sections including DAPI counterstaining was performed using standard procedures with primary antibody incubation overnight at 4°C, and secondary antibody incubation at room temperature for 1h in blocking buffer. For the S100 Biotin-conjugated immunofluorescence staining, sections were first incubated overnight in freshly prepared 10 mM citrate buffer (pH 6) at 50°C, and a Biotin blocking kit (Vector, SP-2001) was used according to the manufacturer’s instructions before the antibody incubations.
Teased fibers from mouse tibial nerves were produced after 30 min postfixation of freshly dissected nerve samples in 4% paraformaldehyde/0.1M PBS at 4°C. The samples were washed three times in cold PBS for 5 min and then desheated. Axon bundles were separated with fine insect needles in cold PBS on Fisherbrand Superfrost/Plus microscope slides (Fisher Scientific). Slides were air dried for 1 h and stored at −20°C. After postfixation in ice-cold acetone or methanol for 5-10 min at −20°C, the slides were washed in PBS, blocked with 10% fish skin gelatin containing 0.1% Triton for 1 h at 25°C, and incubated with primary antibodies overnight at 4°C. After washing, secondary antibodies were applied for 1 h, and the slides were mounted in Vectashield Mounting Medium with DAPI (Vector Laboratories, H-1200).
Following primary antibodies were used for nerve and teased fiber immunofluorescence: Neurofilament 200 (1:500, Sigma, N4142), Hexokinase I C35C4 (1:200, Cell Signaling, 2024), Hexokinase II C64G5 (1:200, Cell Signaling, 2867), GPI (1:200, Proteintech, 15171-1-AP), PFKM (1:200, Proteintech, 55028-1-AP), Aldolase A D73H4 (1:200, Cell Signaling, 8060), GAPDH (1:500, Sigma, G9545), PGK1 (1:150, Proteintech, 17811-1-AP), PGAM1 D3J9T (1:50, Cell Signaling, 12098), Enolase-1 D2S1A (1:200, Cell Signaling, 13410), PKM1 D30G6 (1:400, Cell Signaling, 7067), PKM2 D78A4 (1:200, Cell Signaling, 4053), PFKFB3 D7H4Q (1:200, Cell Signaling, 13123), LDHA/LDHC C28H7 (1:200, Cell Signaling, 3558), LDHB (1:200, Proteintech, 14824-1-AP), Glut1 D3J3A (1:200, Cell Signaling, 12939), PDHK1 C47H1 (1:100, Cell Signaling, 3820), Pyruvate Dehydrogenase C54G1 (1:100, Cell Signaling, 3205), CS (1:150, Proteintech, 16131-1-AP), IDH3A (1:100, Proteintech, 15909-1-AP), OGDH (1:50, Proteintech, 15212-1-AP), MCT1 M-45 (1:200, Santa Cruz Biotechnology, sc-50325), MCT4 H-90 (1:250, Santa Cruz Biotechnology, sc-50329), Phospho-S6 Ribosomal Protein (Ser240/244) D68F8 (1:800, Cell Signaling, 5364), Phospho-Akt (Ser473) D9E (1:100, Cell Signaling, 4060), HIF-1 alpha (1:200, Novus Biologicals, NB100-479), c-Myc D84C12 (1:800, Cell Signaling, 5605), c-Myc/N-Myc D3N8F (1:800, Cell Signaling, 13987), Phospho-AMPKα (Thr172) 40H9 (1:100, Cell Signaling, 2535), S100 4C4.9 (1:200, Thermo Fisher Scientific, MA5-12966), P0 (1:1000, Aves Labs, PZO), TUJ1/TUBB3 (1:500, BioLegend, 801202).
Micrographs of the preparations were captured with a Leica DMi8 digital imaging system or a Leica TCS SP5 confocal microscope. Adjustments of brightness and contrast were applied with ImageJ and Microsoft Powerpoint equally across the entire image and were applied equally to controls for all the data presented.
HK1+, PFKM+, PKM2+, PFKFB3+, LDHA+ SC bodies (EGFP+) on frozen nerve sections were quantified in randomly selected areas from longitudinal sciatic nerve sections (three mice per genotype). Data are presented as immunoreactive EGFP+ SCs per unit area for each marker. Total fluorescence quantification of teased fiber preparations was performed on wide-field fluorescence micrographs that were obtained by keeping exposure times between preparations constant. The outline of individual fibers was marked using the polygon drawing tool in ImageJ software. After measurement of the integrated fluorescence intensity in the outlined area, the following formula was used to calculate the corrected fluorescence: Integrated density – (Area of select axon x Mean fluorescence of background reading). Three micrographs per mouse were quantified in this way and each experimental group contained three animals. Relative fiber fluorescence is reported as percentage of control.
For quantification of fluorescence intensity along micrographs of longitudinal sections from sciatic and tibial nerve segments (36h after axotomy), high-resolution tilescans of nerve segments were recorded and montaged using Leica Application Suite X software. Phospho-S6 (Ser240/244) and DAPI fluorescence intensities were then measured on the tilescan micrographs using an ImageJ line scan macro as previously described67, 68. The fluorescence intensity data (average intensities per pixel) was exported into excel spreadsheets and further processed in Graph Pad Prism software. The Phospho-S6 (Ser240/244) fluorescence intensities were normalized to DAPI fluorescence intensities, and are reported as intensity ratios along the nerve segment in the intensity plots.
All immunofluorescence quantifications were performed blind to the experimental condition except for experiments involving evident nerve morphology differences between groups (i.e., control uninjured vs. axotomized sciatic nerves).
Measurement of metabolic enzyme activities in nerves
LDH enzyme activity in sciatic nerve homogenates was determined using the LDH Activity Assay kit (BioVision, K726-500) according to the manufacturer’s instructions. In this assay, LDH reduces NAD+ to NADH, which was specifically detected by a kinetic colorimetric measurement algorithm using a Biotek Cytation 5MV microplate reader and Gen5 3.0 analysis software. In brief, axotomized sciatic nerve stumps and contralateral control nerve segments from mice were rapidly dissected, weighed, and homogenized in ice-cold LDH assay buffer using a bullet blender (BBX24B, Next Advance) at speed 10 for 3 minutes. Homogenates were centrifuged, and an aliquot of the supernatant was used for the subsequent colorimetric measurement to determine LDH activity in milliunits/ml. Four to five nerve segments from different mice per condition and genotype were used, and data was normalized to total protein concentration in the homogenate. The latter was determined with a Pierce BCA protein assay according to the manufacturer’s instructions (Thermo Fisher, #23225).
In situ histochemical analysis of GAPDH, LDH, IDH, and SDH enzyme activities at saturating substrate concentrations using the redox-sensitive tetrazolium salt nitroblue tetrazolium chloride (NBT) on nerve sections was performed according to previously described methods69 with minor modifications. For the analysis of HK, we combined this methodology with a previously described histochemistry assay for a two-step reaction that uses a pre-incubation with G6PD (Glucose-6-phosphate dehydrogenase) as auxiliary enzyme in excess70. Axotomized distal sciatic nerve stumps and contralateral control nerve segments from mice were rapidly dissected, embedded in Tissue-Tek OCT compound, snap-frozen, and sectioned at 6μm thickness on a cryostat. Immediately before the histochemical reaction, longitudinal nerve sections were mounted on glass slides, defrosted for two to three minutes at room temperature, and encircled with PAP-pen (DAKO). For the HK assay, glass slides were pre-coated with auxiliary G6PD enzyme solution (1U/ml in dH2O and 0.1% BSA) and briefly air-dried. Freshly-prepared assay medium containing enzyme-specific buffers, substrates, and co-enzymes (see below) was then applied to cover the whole nerve section. Enzyme reactions were carried out protected from light at room temperature with gentle shaking on a rocker for 15 min. Negative control reactions were performed in the presence of 100 mM N-acetylglucosamine (for HK inhibition), 40 mM sodium iodoacetate (for GAPDH inhibition), 200 mM sodium oxamate (for LDH inhibition), 250 mM malonic acid (for SDH inhibition), and 100 mM oxaloacetic acid (for IDH inhibition). The slides were then washed twice with 0.1M PBS at 60°C for one minute to remove the assay medium and finally washed once at 4°C for 3 min to stop the reaction. The sections were subsequently counterstained with DAPI for 3 min, washed three times with 0.1M PBS, dried, and coverslipped using Mowiol 4-88. Following enzyme specific assay buffers and media preparations were used for the individual assays:
For GAPDH enzyme assay: To prepare the assay buffer, 10% polyvinyl alcohol was dissolved in 0.1M Tris-Maleate buffer (pH 8) on a hot plate at 60°C until the mixture was clear. This solution was stored in an air-tight vial in a 60°C water bath. To generate assay medium, this solution was supplemented with 0.9 mM methoxyphenanzine methosulfate, 10 mM sodium azide, 10 mM nitroblue tetrazolium chloride (pre-dissolved in 50% ethanol and 50% dimethylformamide and heated to 60°C), 5 mM glyceraldehyde-3-phosphate, and 6 mM NAD+ (all Sigma).
For LDH enzyme assay: To prepare the assay buffer, 10% polyvinyl alcohol was dissolved in 0.1M Tris-Maleate buffer (pH 7.5) on a hot plate at 60°C until the mixture was clear. This solution was stored in an air-tight vial in a 60°C water bath. To generate assay medium, this solution was supplemented with 0.45 mM methoxyphenanzine methosulfate, 5 mM sodium azide, 5 mM nitroblue tetrazolium chloride (pre-dissolved in 50% ethanol and 50% dimethylformamide and heated to 60°C), 150 mM sodium lactate, and 3 mM NAD+ (all Sigma).
For SDH enzyme assay: To generate assay medium, the assay buffer as described for the LDH assay above was prepared, and supplemented with 0.2mM phenazine methosulfate, 5 mM sodium azide, 5 mM nitroblue tetrazolium chloride (pre-dissolved in 50% ethanol and 50% dimethylformamide and heated to 60°C), and 60 mM sodium succinate (all Sigma).
For IDH enzyme assay: To prepare the assay buffer, 10% polyvinyl alcohol was dissolved in 0.1M Tris-HCl buffer (pH 8.0) on a hot plate at 60°C until the mixture was clear. This solution was stored in an air-tight vial in a 60°C water bath. To generate assay medium, this solution was supplemented with 0.2 mM phenazine methosulfate, 5 mM sodium azide, 5 mM nitroblue tetrazolium chloride (pre-dissolved in 50% ethanol and 50% dimethylformamide and heated to 60°C), 100 mM isocitric acid, 7 mM NAD+, and 10 mM magnesium chloride (all Sigma)
For HK enzyme assay: To prepare the assay medium, the assay buffer as described for the LDH assay above was prepared, and supplemented with 0.45 mM methoxyphenanzine methosulfate, 5 mM sodium azide, 5 mM nitroblue tetrazolium chloride (pre-dissolved in 50% ethanol and 50% dimethylformamide and heated to 60°C), 5 mM glucose, 7.5 mM ATP, 10 mM MgCl, and 1.5 mM NAD+ (all Sigma).
The histochemically developed and mounted specimens were imaged with a Leica DMi8 microscope system equipped with a 63x high numerical aperture objective and a DFC7000T color digital camera. The signals for color bright-field and fluorescence DAPI signals (cell nuclei) were merged as presented using ImageJ software. The densitometric analysis of monoformazan and diformazan precipitate formation (‘formazan intensity’) in randomly selected areas of longitudinal nerve sections (from three C57Bl/6J mice, injured nerve and contralateral uninjured) was performed with ImageJ software after adjustments of contrast/brightness/color balance and conversion of the color bright-field images into 8 bit greyscale images. The images were thresholded to define the formazan formation for each assay. The threshold setting was adjusted individually for each enzymatic assay, and the same threshold was applied to all individual images from each enzymatic assay. Relative formazan intensity was calculated for each enzymatic assay and is reported as percentage of mean formazan intensity in the respective control group (uninjured). The densitometric analysis could not be performed blind to the experimental condition due to the fact that the structure of control uninjured and axotomized sciatic nerve segments differed significantly.
Metabolite analysis in axotomized nerve stumps
For the measurement of nerve glucose and lactate concentrations, unlesioned control nerve segments and distal sciatic nerve stumps after axotomy were rapidly dissected, weighed and placed in 10 volumes of ice-cold YSI 2357 buffer (YSI Life Science). Following zirconium oxide bead homogenization, nerve segment lysates were subjected to analyte measurements using a YSI Life Science 2900 Select Biochemistry Analyzer instrument equipped with D-glucose and L-lactate detection sensors.
For the measurement of key energy metabolism intermediates (glycolysis, pentose-phosphate shunt, TCA cycle, and nucleotide pools) in nerves by mass-spectrometry based metabolomics, control and axotomized sciatic nerve segments were rapidly dissected, snap-frozen in liquid nitrogen, weighed and submitted to the Michigan Regional Comprehensive Metabolomics Resource Core for the targeted assays ‘Glycolysis / TCA / Nucleotide analysis’ and ‘TCA – Plus’ (http://mrc2.umich.edu/targeted-assays). Metabolite detection by liquid chromatography mass spectrometry included a one-step liquid-liquid organic solvent extraction and separation on a 1mm x 150mm HILIC specific column in a 35 min cycle. All analytes were measured by ESI-ionization on a LC-QTOF mass spectrometer and normalized to tissue weight.
In vivo nerve glucose tracer uptake
IRDye 800CW 2-DG optical probe (LI-COR, #926-08946) is a glucose analog that is not metabolized further in the glycolytic pathway, and is thus intracellularly trapped upon entry through GLUT transporters. The optical probe was freshly reconstituted in physiological saline according to the manufacturer’s instructions before injection. C57Bl/6J mice were injected with 20 nmoles of IRDye 800CW 2-DG or physiological saline (control) intravenously through the tail vein 24h after unilateral sciatic nerve transection (as described above). The mice were intracardially perfused with a solution containing 4% paraformaldehyde in 0.1M PBS 48h after nerve transection, and axotomized distal nerve stumps and contralateral uninjured nerve segments (control) were rapidly dissected. The nerve segments were cryoprotected in 30% sucrose in 0.1M PBS, embedded in Tissue-Tek OCT compound, sectioned at 12μm thickness, and counterstained with Hoechst Dye 33342. Longitudinal nerve sections on glass slides were imaged by near infrared (NIR) fluorescence microscopy using a Leica DMi8 imaging system equipped with an NIR filter set (AVR Optics IRDYE800-33LP-A-LDMP-ZERO), Leica DFC9000 GT high sensitivity sCMOS camera, and 740nm LED light source (CoolLED pE-100@740nm). Signals imaged separately for IRDye 800CW 2-DG and cell nuclei (Hoechst Dye 33342) were merged as presented using ImageJ software. Adjustments of brightness and contrast were applied with ImageJ and Microsoft Powerpoint equally across the entire image and were applied equally to controls for all the data presented.
Extracellular flux analysis
A Seahorse XFp Analyzer instrument with the glycolytic stress test kit was used according to the manufacturer’s instruction to dynamically measure ECARs as a surrogate of glycolytic activity parameters in mouse SCs. MACS-purified mouse SCs were seeded into each well of a PLL/laminin-coated Seahorse XFp cell culture miniplate (50,000 cell per well). Cells were control-treated or treated with 200 ng/ml recombinant neuregulin-1 (R&D system, 396-HB-050) for 24h, or 10 nM Everolimus (LC laboratories, E-4040) for 3h. The cells were washed after treatment, XF base medium (Agilent, 102353) supplemented with 1mM of glutamine was added, and cells were incubated for 1h at 37°C in a CO2-free incubator for outgassing, required for accurate ECAR measurements. Glycolytic parameters with the Seahorse instrument were determined by quantitative analysis of data obtained after sequential injection of 50nM glucose, 5μM oligomycin, and 100mM 2-deoxyglucose. The measurements were repeated at least three times on different days using SC preparations from different mice. Data from each well were normalized to cell number (Hoechst Dye) as determined with a Biotek Cytation 5MV microplate imager. Data in graphs are expressed as ECAR in milli pH per minute for 1000 cells.
A Seahorse XF24e Analyzer instrument with islet capture microplates was used according to the manufacturer’s instructions to measure ECARs (reflecting glycolytic end-product extracellular release) from sciatic nerve segment preparations of axotomized mice according to a recently described method32. Briefly, ~3mm segments from unlesioned control sciatic nerves or contralateral distal sciatic nerve stumps after different injury times (24, 48, 72h) were collected from mice, stripped from the epineurium, and carefully attached to the centers of nylon islet capture screens. The screens with nerve segments were inverted and placed into the wells of the islet capture microplate using fine forceps and the Agilent Seahorse XF Islet Capture Screen Insert tool. After addition of assay medium, the maximal ECARs after injection of 50mM glucose were determined for control and axotomized nerve segments from individual mice, and normalized to total protein concentration of the respective nerve preparations (Pierce BCA protein assay). Data in graphs are expressed as ECAR in milli pH per minute for 1μg/μl protein concentration, or as percentage of maximal ECAR measured for unlesioned control nerve segments.
Western blotting of primary SCs
MACS-purified mouse SCs from approximately 20 dissociated sciatic nerve preparations were seeded in PLL/laminin-coated 35 mm dishes and cultured for ~20h in defined medium (10% Normal horse Serum (Gibco, #26050-088) in DMEM/F12, 350μg/mL BSA (Sigma, A4161), 1μM insulin (Sigma, I6634)) in preparation for ErbB2 receptor activation with recombinant Nrg1 according to a previously published method71. SCs were subsequently control-treated or treated with 200 ng/ml recombinant Nrg1 (R&D Systems, 396-HB-050) for 24h, collected in RIPA buffer containing phosphatase and protease inhibitors, and then processed for protein analysis and western blotting using standard procedures. The SC preparations were randomly assigned to the control-treated and Nrg1-treated groups. Following primary antibodies were used: Phospho-ErbB2 Y1248 (1:500, Abcam, ab47755), Phospho-HER2/ErbB2 (Tyr877) (1:1000, Cell Signaling, 2241), PFKFB3 D7H4Q (1:1000, Cell Signaling, 13123), LDHA/LDHC C28H7 (1:1000, Cell Signaling, 3558), beta-actin Clone AC-74 (1:5000, Sigma, A2228).
Measurement of lactate concentrations in SC cultures
Lactate concentrations in mouse SCs (intracellular) and conditioned SC culture media (extracellular) after control or recombinant Nrg1 treatment (200 ng/ml for 24h, analogous to above) were determined using a colorimetric lactate assay kit (Eton Bioscience Inc., SKU 1200051002) and a Biotek Cytation 5MV microplate reader according to the manufacturer’s instructions. Cellular preparations and media aliquots from three different SC culture preparations per condition were assayed in triplicate. To account for possible proliferation and cell growth effects through Nrg1 addition to the cultures, the lactate concentrations were normalized to total cell number and mg SC protein.
Nerve protein analysis and western blotting
Uninjured sciatic nerve segments or axotomized nerve stumps were rapidly dissected, stripped from the epineurium in ice-cold PBS, and lysed in RIPA buffer supplemented with protease and phosphatase inhibitors (Roche, Sigma). Western blotting of nerve protein lysates was performed using Invitrogen Life Technologies Bolt Mini gels and Mini Bolt wet transfer modules according to the manufacturer’s instructions. Proteins were visualized with Lab Safe GEL Blue and Swift Membrane stain (G-Biosciences). Blot documentation was performed with a Biorad ChemiDocMP digital Imaging System Integrated band intensities of protein bands were measured using Biorad Image Lab software and normalized by comparison with the loading control. Primary antibodies used were: Glut1 D3J3A (1:1000, Cell Signaling, 12939), PFKFB3 D7H4Q (1:1000, Cell Signaling, 13123), LDHA/LDHC C28H7 (1:1000, Cell Signaling, 3558), Phospho-S6 Ribosomal Protein (Ser240/244) D68F8 (1:1000, Cell Signaling, 5364), Phospho-Akt (Ser473) D9E (1:2000, Cell Signaling, 4060), Phospho-AMPKα (Thr172) 40H9 (1:1000, Cell Signaling, 2535), AMPKα D63G4 (1:1000, Cell Signaling, 5832), Raptor (1:1000, Proteintech, 20984-1-AP), Rictor (1:1000, Proteintech, 27248-1-AP), HIF-1 alpha (1:500, Novus Biologicals, NB100-479), beta-actin Clone AC-74 (1:5000, Sigma, A2228).
HRP-coupled secondary antibodies from Cell Signaling Technologies and Jackson Immuno Research were used for signal detection.
Nerve histology and g ratio calculations of intact nerves
Harvested mouse nerves were placed in 0.1M phosphate buffer containing 3% glutaraldehyde (Polysciences) for several days, and were then postfixed in 1% osmium tetroxide in phosphate buffer o/n at 4°C. Following en-bloc staining with 1% uranlyacetate in 70% ethanol o/n at 4°C, the samples were dehydrated and embedded in Araldite 502 epoxy resin (Polysciences). 500-nm-thick or 90-nm-thick sections were prepared on an ultramicrotome for semithin light or electron microscopic (EM) analysis and were stained with a toluidine blue solution (semithin) or an uranyl-acetate/lead-citrate solution (EM), respectively. For quantification of the total number of myelinated axons and SC nuclei per sciatic nerve cross section, high resolution tilescans of the entire nerve area were acquired, and automatically stitched together for nerve reconstruction using Leica Application Suite X software. Tilescan composite nerve micrographs were then used to determine the total number of myelinated axons and SC nuclei by manual enumeration with ImageJ software (Cell counter plugin). G ratios of individual myelinated axons in sciatic nerves as a measure of myelin thickness were determined using a plugin for the ImageJ software which allows semi-automated analysis of randomly selected axons on nerve transverse sections (http://gratio.efil.de). One hundred randomly chosen fibers were measured per mouse nerve. Cumulative g ratios were calculated for each mouse by averaging all individual g ratios. The quantifications were performed blind to the genotypes of the animals.
Morphological analysis of axon survival in axotomized nerve stumps
Axon survival following the unilateral sciatic nerve transection was determined using highly established methods for the evaluation of axon integrity72–74. The number of all intact and degenerated myelinated axons after axotomy on entire nerve semithin cross sections was quantified on montaged tilescan nerve images, generated as described above (method illustrated in Supplementary Fig. 5). Because WD is asynchronous resulting in substantial heterogeneity of axon disintegration within a nerve27, this method prevents sampling bias that is associated with quantification of axons from individual micrographs taken from select areas of the nerve. Criteria for intact axons after axotomy were uniform axoplasm with presence of non-swollen mitochondria and normal myelin sheaths. Criteria for degenerated axons were degraded axoplasm, absence of mitochondria, and collapsed myelin sheaths. Scoring was documented with ImageJ software (Cell counter plugin). The experimenter was blind to the genotypes of the mice during data acquisition. Relative axon survival was calculated and is reported as percentage of surviving axons per sciatic nerve cross section in the respective control group.
Since the quantification of axon survival in distal axotomized nerve stumps requires excellent preservation of nerve structure, insufficiently fixed nerve segments due to delay of glutaraldehyde fixation, segments with artifacts from handling damage, and nerve segments having undergone incorrect epoxy resin embedding were excluded from the analysis using pre-established morphological exclusion criteria. These included shrinkage and/or distortion of entire nerve segment, occurrence of myelin swelling and vacuolation artefacts, and disruption of the nerve fascicles.
For the analysis of axon integrity in YFP-labeled nerves, nerve segments were processed as described previously22, 72 and mounted on conventional glass slides in Vectashield mounting medium for subsequent confocal imaging. Axon disintegration in this assay is reflected by fragmentation of YFP-positive nerve fibers.
Phospho Explorer Antibody Arrays
For high-throughput, ELISA based qualitative protein phosphorylation profiling in axotomized nerves (36h after axotomy) using Phospho Explorer Antibody Arrays (Full Moon Biosystems, Array Cat# PEX100), distal sciatic nerve stumps and contralateral, uninjured sciatic nerve segments (control) were dissected (n=6 C57Bl/6J mice), pooled (control and axotomized groups), and homogenized according to the manufacturer’s protocol (Full Moon Biosystems Assay kit Cat# KAS02) with minor modifications. Nerves were triturated in lysis buffer containing phosphatase (Pierce A32957) and protease inhibitors (Roche, Complete Mini EDTA-free 04693159001) by lysis beads (provided in the kit) in a Bullet Blender homogenizer (Next Advance) at 4°C for 10 minutes. After a freezing cycle (−70°C for 10 min), and multiple high speed centrifugations (18,000g for 10 min at 4°C) to remove debris and lipids, the supernatant was collected and passed through a buffer exchange column, and then resuspended in labeling buffer. Protein content was measured spectrophotometrically ((A280) and 120 OD (protein equivalent)), and proteins were biotinylated and stored at −80°C overnight. Two antibody arrays (one array for pooled control nerves, one for pooled axotomized nerves) were blocked and the biotinylated lysates were conjugated to the arrays via a coupling procedure according to the manufacturer’s instructions. The conjugated proteins were detected by Alexa555 Streptavidin (Invitrogen, 532355, 0.0083333 mg/ml final concentration) binding. Slide scanning and array quantification were performed by Full Moon BioSystems. After normalization to median signals, the antibody spot signals representing the individual targets were compared between the axotomized and the control arrays (1318 site-specific antibodies from over 30 signaling pathways) by calculating the Fold Change value (array signals for pooled axotomized nerves/array signals for pooled control nerves). Targets were considered upregulated following injury if their Fold Change value equaled or exceeded that of the transcription factor c-Jun (arithmetic mean of six different c-Jun antibody signals on array), a canonical SC injury marker, as reference. The PhosphoSitePlus database v6.5.9.2 (Cell Signaling) was used to determine which signaling pathways the upregulated targets represent.
Nerve mRNA analysis and Digital Droplet PCR (ddPCR)
RNA from axotomized distal nerve stumps and contralateral nerve segments (controls) was extracted using Invitrogen Phasemeaker tubes and TRIzol reagent according to the manufacturer’s instructions. RNA concentration and purity were measured using a NanoDrop spectrophotometer (2000c, Thermo Fisher). cDNA was synthesized using the iScript cDNA Synthesis kit (Bio-Rad, 1708890) according to the manufacturer’s instructions. 1μg of total RNA in a final reaction volume of 20μl reaction was converted to cDNA for each condition. Absolute quantification of target transcripts was determined by individual PrimePCR ddPCR Gene Expression probe assays and the QX100 Droplet Digital PCR system (Bio-Rad) according to manufacturer’s instructions. Following assays were used: ddPCR Slc2a1 probe FAM (Bio-Rad, dMmuCPE5090050), ddPCR Hif1a probe FAM (Bio-Rad, dMmuCPE5114348), ddPCR MyC probe FAM (Bio-Rad, dMmuCPE5109108), ddPCR LDHA probe FAM (Bio-Rad, dMmuCPE5106586), ddPCR PFKFB3 probe FAM (Bio-Rad, dMmuCPE5112626), ddPCR PPIA probe FHEX (Bio-Rad, dMmuCPE5195915). For each assay a 25 μl final volume PCR mix was prepared containing 2μl of diluted cDNA, 12.5μl 2X ddPCR Supermix for probes (Bio-Rad), and 1.25μl 20X target probes. The total mix was pipetted into the eight-channel cartridge, 70 μl of droplet generating oil was added, and droplets were formed in the QX100 droplet generator (Bio-Rad). Droplets in oil suspensions were transferred to a 96 well plate and placed into a C1000 Thermal Cycler (Bio-Rad). Cycling conditions were as follows: one cycle at 95 °C for 10 min, followed by 40 cycles of 94 °C for 30 sec, one cycle at 58 °C for 60 s, and one cycle at 98°C for 10 min, all at ramp rate of 2°C/sec. The droplets were subsequently read by the QX100 droplet reader and the data were analyzed with Quantasoft v1.3.2.0 software (Bio-Rad). No template control was included in every assay. For each genotype and condition (uninjured vs. injured), ddPCR was carried out on at least three biological replicates (nerve segments from different mice) and two technical replicates. Data were normalized to readings for Peptidylpropyl isomerase A (PPIA) as reference gene previously used for nerve samples75. The mRNA expression in injured nerve segments is reported relative to the uninjured condition.
Tamoxifen, rapamycin, and acrylamide (ACR) treatment in mice
For depletion of mTOR, Raptor, c-Myc, Hif1α, and TSC2 in SCs of adult mice, the respective conditional mutants carrying the iSox10-CreERT2 transgene were treated daily with tamoxifen (Sigma, T5648) dissolved in corn oil (Sigma, C8267) for 10 days (intraperitoneal injection, 1mg tamoxifen per mouse per day). Treatment was started at P30-35. Depletion of the respective targets for all models in SCs was confirmed 30 days after the last tamoxifen injection by nerve western blotting or immunofluorescence following nerve transection.
Rapamycin (LC Laboratories, R-5000) was dissolved in a carrier solution consisting of 5% (vol/vol) polyethyeleneglycol 400, 5% (vol/vol) Tween 80, and 4% (vol/vol) ethanol in sterile H2O. Thy1.2-YFP-H mice received daily intraperitoneal injections at 10μg rapamycin/g mouse weight for five consecutive days (or only the carrier solution as control).
Control (C57Bl/6J, TSC2fl/fl) and TSC2fl/fl; iSox10Cre mice (30 days after last tamoxifen treatment) were treated with ACR (Sigma, A4058) added to the acidified drinking water at 400ppm (light-protected supply bottles) for 14 consecutive days to induce neuropathy according to published methods76. Freshly prepared ACR/water mixture was provided twice per week.
Behavioral and electrophysiological analysis of ACR-induced neuropathy
During the 14 day control and ACR treatment period, mice from the individual groups underwent accelerated rotarod analysis with an Ugo Basile Rotarod Apparatus (#47600), grip strength analysis of anterior limbs with an Ugo Basile grip strength meter (#47105), and hanging wire analysis as described previously22. Grip strength data are displayed as relative peak grip strength in g (taking into account the body weight of the experimental animal). Behavioral assessment was carried out in a quiet environment during the day, and the experimenter was blind to the genotypes of the mice during data acquisition.
Following 14d of ACR treatment at the experimental end point, mice were deeply anaesthetized and sciatic nerves exposed bilaterally. A steel bipolar stimulating electrode was placed under the sciatic nerve at the proximal level of the sciatic notch. The recording electrode was placed in the gastrocnemius muscle, a reference electrode was placed distal to the recording electrode, and a ground electrode was placed in the lower thigh. The amplitudes of compound muscle action potentials (CMAPs) evoked by supramaximal stimulus pulses were recorded using a Teca Synergy electromyography instrument (Oxford instruments). CMAP amplitudes from each gastrocnemius muscle were averaged, and are displayed as average CMAP amplitude for an experimental animal. The measurements were performed blind to the experimental condition and genotype of the mice.
Morphological analysis of nerves from ACR-treated mice
Harvested tibial nerves from control and ACR-treated mice were processed for light and electron microscopy, and tilescan composite micrographs of transverse nerve semithin sections were obtained as described above (Leica Application Suite X software). The total number of degenerated axon profiles were enumerated on entire tibial nerve cross sections, and are presented as densities (degenerated axon profiles/μm2). Deranged axon profiles with severely corrugated or collapsed myelin sheaths, segregation and compression of the axoplasm by involuted myelin, or with accumulation of multivesicular and dense bodies (examples in Extended Data Fig. 10d1–3), were scored as degenerated axons according to previously described morphology following ACR administration in rodents43, 77–79. Scoring was documented with ImageJ software (Cell counter plugin). The experimenter was blind to the genotypes of the samples and the experimental condition (control or ACR-treated) during data acquisition.
Antibodies
Additional antibody details including antibody validation can be found in the Supplementary Table (Supplementary_Table_AB.xls) and in the Life Science Reporting Summary.
Statistics and Reproducibility
All demonstrated micrographs (immunofluorescence, enzyme histochemistry, NIR imaging of glucose tracer, light- and electron microscopy) in this study are representative of at least three biological replicates (mice or cell culture preparations). All statistical analyses were performed using Graph Pad Prism software, and the unpaired, two-tailed Student’s T test was used for comparison of two groups (except for data analysis in Fig. 3c, one-tailed Ratio Paired T test). A one-way analysis of variance (ANOVA) with Sidak’s multiple comparisons tests were used for comparison of more than two groups as indicated in the figure legends. Statistical differences were considered to be significant when P < 0.05, and significant differences are indicated in the figures or figure legends. Simple linear regression analysis was used to display regression lines in p-S6(Ser240/244)/DAPI intensity ratio plots to test for presence of mTORC1 activity gradients along axotomized nerve stumps. No statistical methods were used to pre-determine sample sizes but the sample sizes are similar to those reported in previous publications9, 10, 22, 27, 41, 72–74. Neuron, SC and co-culture preparations from mouse embryos or mouse/rat pups were randomly assigned to the experimental groups. For nerve lesion, rapamycin, and ACR treatment experiments, mice with the required genotypes were randomly assigned to the experimental groups. Data distribution was assumed to be normal, but this was not formally tested. The statistical details for specific experiments, including exact n values and what n represents, statistical tests used, P values, F values, t values and degrees of freedom, and all data points can be found in the figure legends and in the Source Data files linked to this article.
Extended Data
Extended Data Fig. 1. Glycolytic and fermentative enzyme expression in SCs after nerve injury.
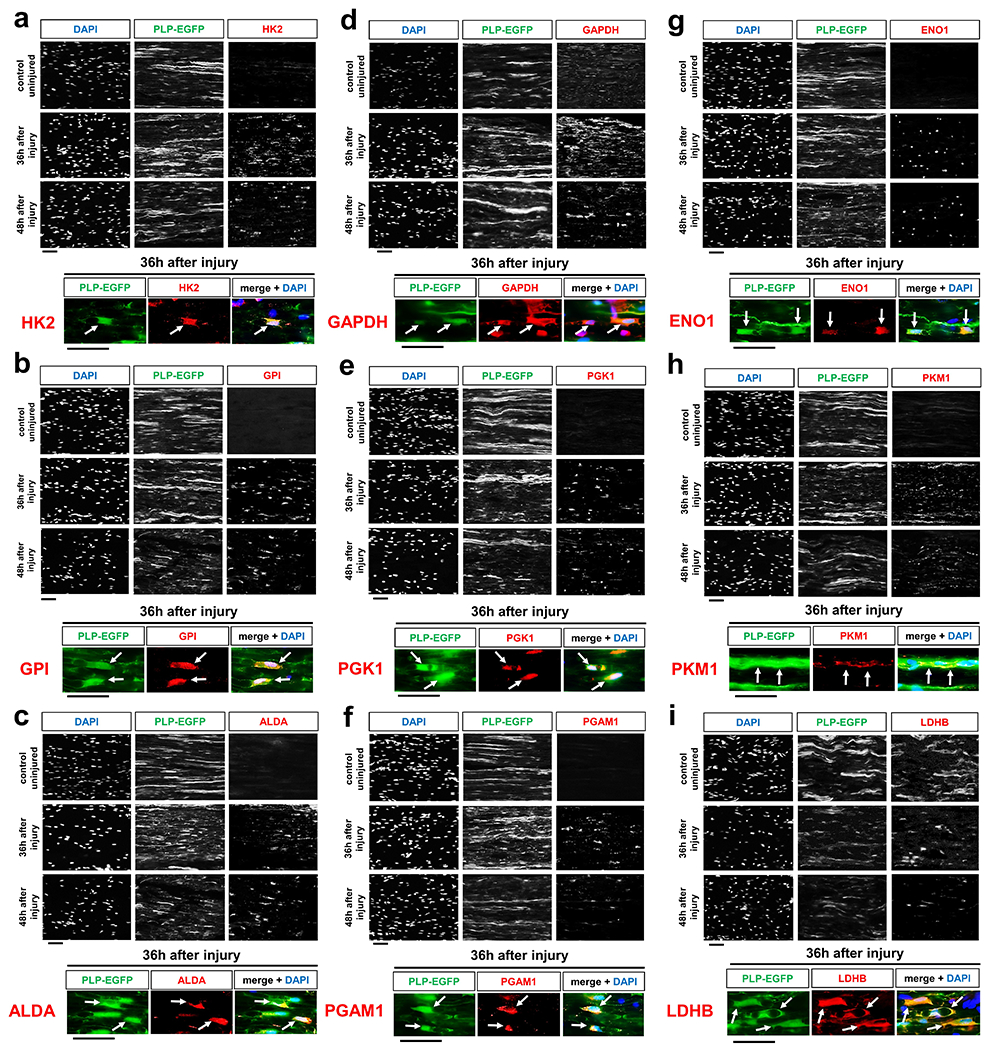
a-i, Representative immunofluorescence for the indicated metabolic components on longitudinal frozen sections from uninjured control nerve segments and axotomized distal sciatic nerve stumps at the shown post-injury times. HK2: Hexokinase 2 (a). GPI: Glucose-6-phosphate isomerase (b). ALDA: Aldolase A (c). GAPDH: Glyceraldehyde-3-phosphate dehydrogenase (d). PGK1: Phosphoglycerate kinase 1 (e). PGAM1: Phosphoglycerate mutase 1 (f). ENO1: Enolase 1 (g). PKM1: Pyruvate kinase M1 (h). LDHB: Lactate dehydrogenase B (i). Arrows depict colocalization in SCs. Scale bars: 50μm. The experiments for each component were reproduced three times independently with similar results.
Extended Data Fig. 2. Enzymes driving mitochondrial glucose catabolism in SCs are not upregulated upon nerve lesion.
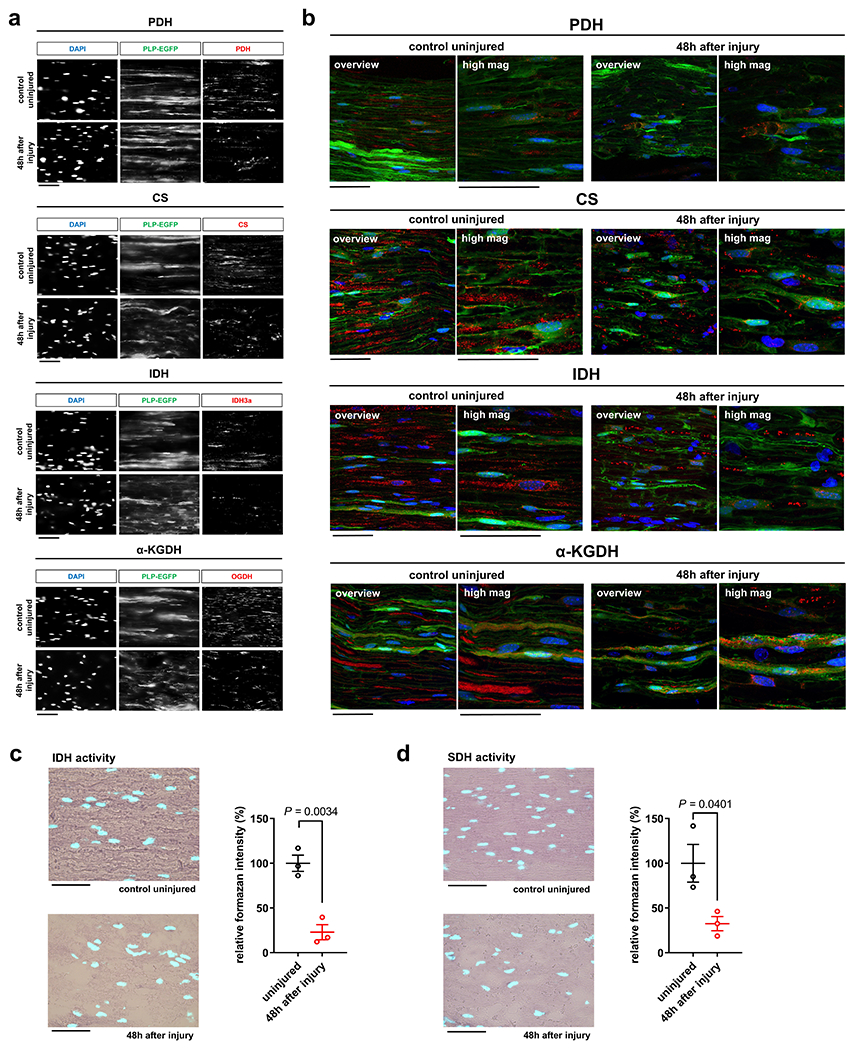
a, b, Representative immunofluorescence using wide-field fluorescence microscopy (a) and confocal microscopy (b, merged z-projections) for the indicated mitochondrial enzymes on longitudinal frozen sections from uninjured control nerve segments and axotomized distal sciatic nerve stumps at the shown post-injury times. PDH: Pyruvate dehydrogenase complex. CS: Citrate synthase. IDH/IDH3a: Isocitrate dehydrogenase catalytic subunit α. α-KGDH/OGDH: Alpha-ketoglutarate dehydrogenase also known as 2-oxoglutarate dehydrogenase E1 component, mitochondrial. Note prominent CS, IDH, and α-KGDH axonal staining in uninjured control nerves, in addition to the SC-derived signals. The axonal staining weakens in injured preparations due to AxD. Red: respective mitochondrial enzyme. Green: PLP-EGFP. Blue: DAPI. Scale bars: 50μm (a), 100μm (b). The experiments for each mitochondrial enzyme were reproduced three times independently with similar results. c, d, Left: Representative images of longitudinal sections from uninjured control nerve segments and axotomized distal sciatic nerve stumps stained for the activity of isocitrate dehydrogenase (IDH, c) and succinate dehydrogenase (SDH, d) (formazan formation) with superimposition of DAPI signals (cyan). Scale bars: 50μm. Right: Densitometric quantification of formazan intensity representing IDH or SDH enzyme activity, respectively, on nerve sections. Note markedly reduced IDH and SDH enzyme activities following nerve injury, in contrast to increased glycolytic enzyme activities (Error bars represent s.e.m. n=3 mice for each graph).
Statistical evaluation in c and d was performed using Student’s t-test, unpaired, two-tailed.
Extended Data Fig. 3. Nerve lactate metabolism following nerve injury.
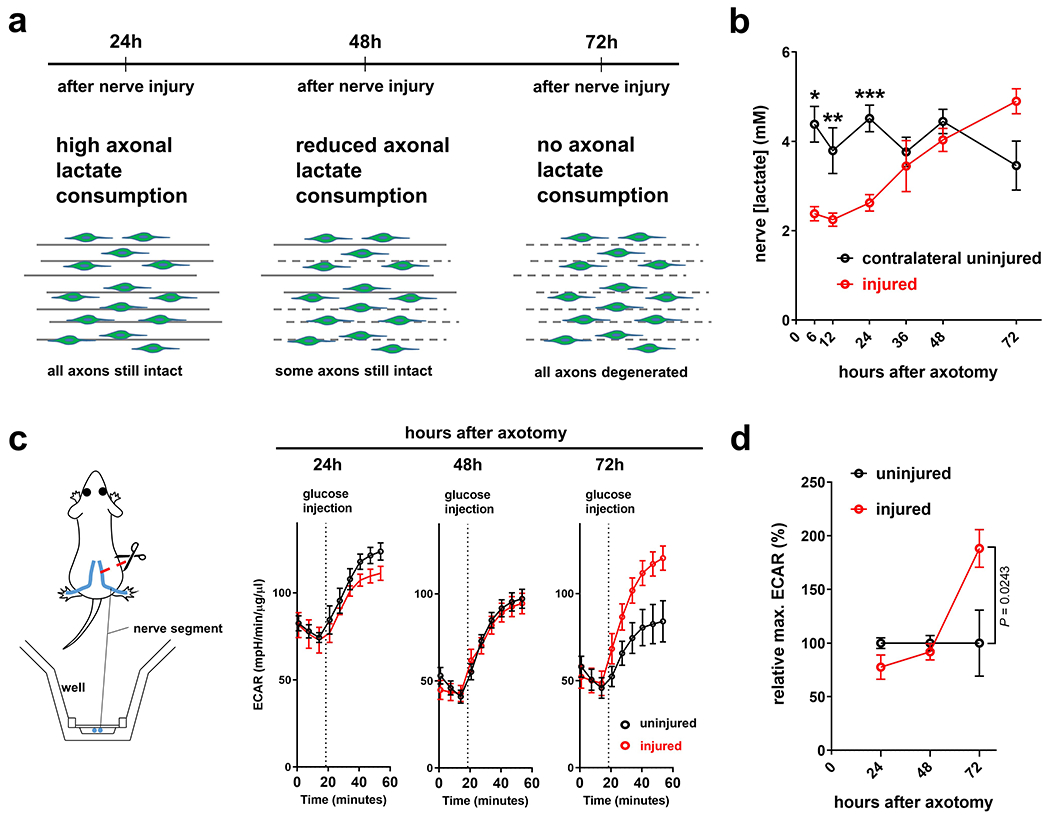
a, Model for axonal consumption of lactate released by SCs in the nerve stump distal to site of axotomy. b, Lactate concentrations in lysates of uninjured control nerve segments and distal sciatic nerve stumps following axotomy (Error bars represent s.e.m. n=3 mice per condition for 6, 12, 24, 36, and 72 hours after axotomy, n=4 mice per condition for 48 hours after axotomy, *P=0.0097, **P=0.0446, ***P=0.0057). c, Left: Scheme for measuring extracellular monocarboxylate release of uninjured and injured peripheral nerve segments by extracellular flux analysis in Seahorse islet capture microplates. Right: ECAR traces of control uninjured and axotomized nerve segments at the indicated post-injury times (Error bars represent s.e.m. n=3 mice for uninjured nerve segments and n=4 mice for injured for 24 hours after axotomy, n=7 mice for uninjured nerve segments and n=8 mice for injured for 48 hours after axotomy, n=9 mice for uninjured and injured nerve segments for 72 hours after axotomy). d, Relative glucose injection–induced maximum ECARs in uninjured control and axotomized nerve segments reflecting extracellular concentrations of glucose-derived monocarboxylates. Note extracellular accumulation of glucose-derived monocarboxylates as AxD proceeds. (Error bars represent s.e.m. n=3 mice for uninjured nerve segments and n=4 mice for injured for 24 hours after axotomy, n=7 mice for uninjured nerve segments and n=8 mice for injured for 48 hours after axotomy, n=9 mice for uninjured and injured nerve segments for 72 hours after axotomy).
Statistical evaluation in b and d was performed using multiple Student’s t-test, unpaired, two-tailed.
Extended Data Fig. 4. Conditional mutant mice lacking key glucose metabolism regulators in SCs show overtly normal nerve structure.
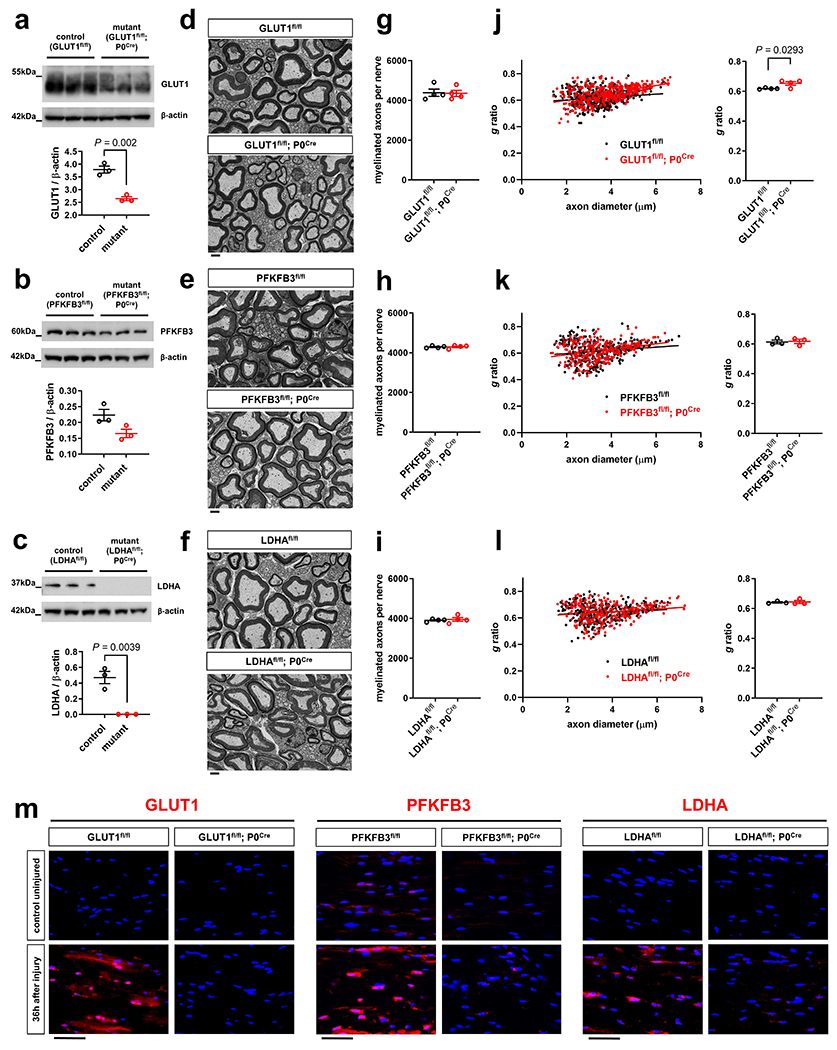
a-c, Western blot analysis (cropped blot images) of sciatic nerve lysates from indicated 8-weeks-old control and mutant mice with the indicated genotypes probed with the shown antibodies (Error bars represent s.e.m. n=3 mice per genotype for each graph. Each dot represents measurement from sciatic nerve lysate from one mouse). d-f, Representative electron micrographs of transverse sciatic nerve sections from 8-weeks-old control and mutant mice with the indicated genotypes. Scale bars: 2μm. g-i, Quantification of myelinated axons in sciatic nerves from indicated 8-weeks-old control and mutant mice (Error bars represent s.e.m. n=4 mice per genotype for each graph). j-l, Quantification of g ratios (left: scatter plots show g ratios of individual myelinated axons as function of axon diameter, right: corresponding cumulative g ratios per animal) in sciatic nerves from indicated 8-weeks-old control and mutant mice (Error bars represent s.e.m. n=4 mice per genotype for j and n=3 mice per genotype for k, l). m, Representative immunofluorescence for the indicated glycolytic regulators on longitudinal frozen sections from control uninjured nerves and axotomized distal sciatic nerve stumps of mice with the indicated genotypes 36h after nerve transection injury (blue: DAPI). Scale bars: 50μm. The experiments for each glycolytic regulator were reproduced three times independently with similar results.
Statistical evaluation in a-c and g-l was performed using Student’s t-test, unpaired, two-tailed.
Extended Data Fig. 5. Additional analysis of MCT inhibitors in co-cultures.
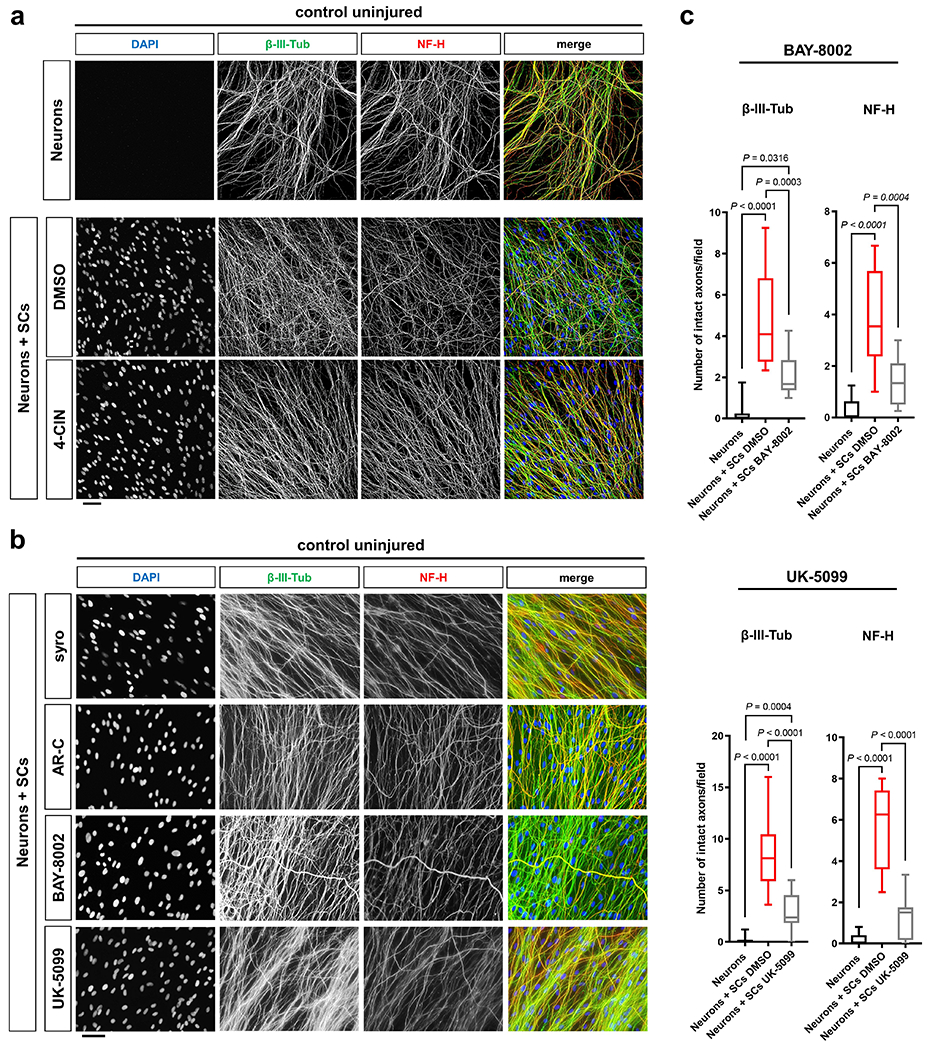
a, b, Representative immunofluorescence (confocal (a) and wide-field fluorescence (b)) microscopy of control uninjured axons under the indicated conditions. Note normal appearance of axon structure after 24h of treatment with the indicated MCT inhibitors. Scale bars: 50μm. The experiments for each condition were reproduced three times independently with similar results. c, Box and whiskers plots (maximum, 25th percentile, median, 75th percentile, minimum) of axon survival 24h following axotomy under the indicated conditions (BAY-8002: β-III-tub and NF-H, Neurons: n=37 DRG neurite preparations, Neurons+SCs DMSO: n=44 DRG neurite preparations, Neurons+SCs BAY-8002: n=38 DRG neurite preparations, all DRG neurite preparations from four experimental sets performed on different days. UK-5099: β-III-tub, Neurons: n=53 DRG neurite preparations, Neurons+SCs DMSO: n=57 DRG neurite preparations, Neurons+SCs UK-5099: n=38 DRG neurite preparations, all DRG neurite preparations from five experimental sets performed on different days (four experimental sets performed on different days for Neurons+SCs UK-5099). NF-H, Neurons: n=53 DRG neurite preparations, Neurons+SCs DMSO: n=49 DRG neurite preparations, Neurons+SCs UK-5099: n=36 DRG neurite preparations, all DRG neurite preparations from five experimental sets performed on different days (four experimental sets performed on different days for Neurons+SCs UK-5099)).
Statistical evaluation was performed using One-way-ANOVA and Sidak’s multiple comparisons tests.
Extended Data Fig. 6. Upregulation of AMPK activity in injury-activated SCs, and analysis of nerves from conditional mutant mice lacking AMPK or mTOR activity in SCs.
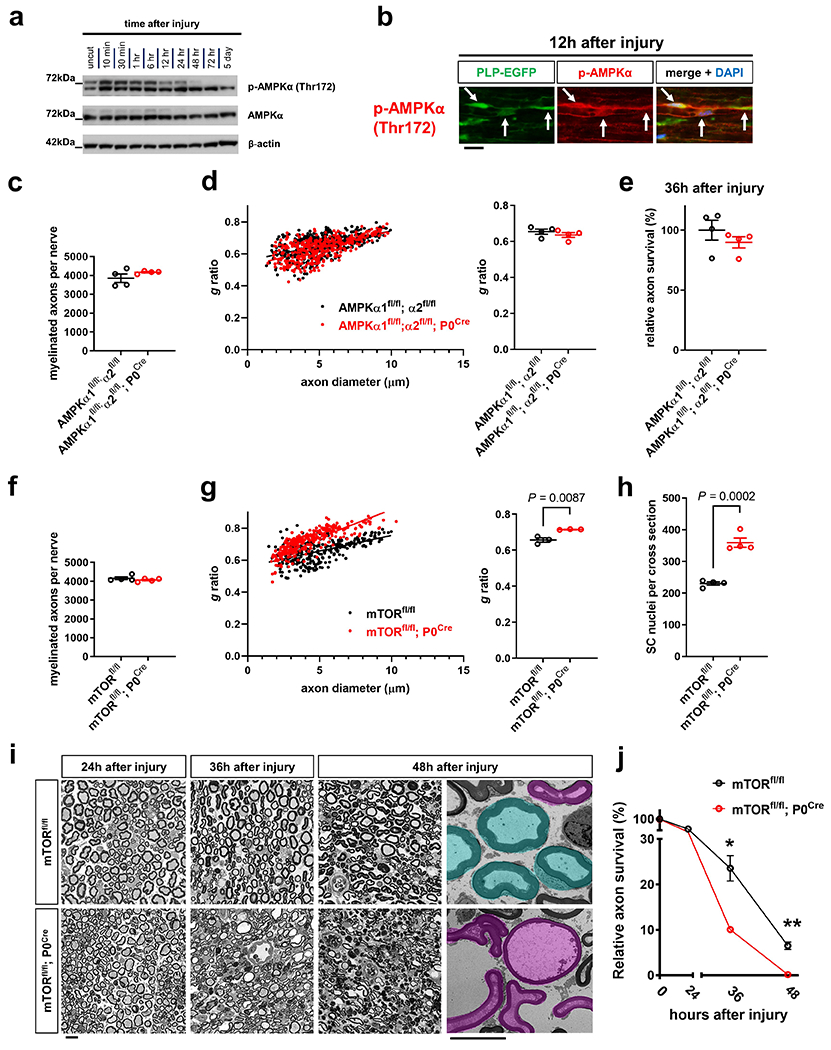
a, Western blot analysis (cropped blot images) of lysates from uninjured control nerve segments and axotomized distal sciatic nerve stumps from C57Bl/6J mice showing AMPK activity at different times following nerve transection. Note marked AMPK activation as reflected by increased p-AMPKα phosphorylation at Thr172 already 10 min after nerve injury. Individual lanes represent pooled data from at least three mice. b, Representative immunofluorescence for p-AMPKα (Thr172) on longitudinal frozen section from axotomized distal sciatic nerve stump 12h after nerve injury. Arrows depict colocalization in SCs. Scale bar: 20μm. The experiment was reproduced three times independently with similar results. c, f, Quantification of myelinated axons in sciatic nerves from indicated 8-weeks-old control and mutant mice (Error bars represent s.e.m. n=4 mice per genotype for each graph). d, g, Quantification of g ratios (left: scatter plots show g ratios of individual myelinated axons as function of axon diameter, right: corresponding cumulative g ratios per animal) in sciatic nerves from indicated 8-weeks-old control and mutant mice (Error bars represent s.e.m. n=4 mice per genotype for d and n=3 mice per genotype for g). e, Quantitative analysis of relative axon survival in distal sciatic nerve stumps 36h after axotomy in mice with the indicated genotypes (Error bars represent s.e.m. n=4 mice per genotype). h, Quantification of SC nuclei in sciatic nerve cross sections in 8-weeks-old mice with the indicated genotypes (Error bars represent s.e.m. n=4 mice per genotype). i-j, Representative semithin and electron micrographs (last panel with pseudocoloring) of transverse sciatic nerve sections of distal nerve stumps from mice with the indicated genotypes at different time points after sciatic nerve transection (i) with corresponding quantifications of relative axon survival (j). Electron micrographs show pseudocoloring of intact (turquoise) and degenerated (magenta) myelinated fibers. Note accelerated AxD in the mTORfl/fl; P0Cre mutants (Error bars represent s.e.m. n=3 mice for mTORfl/fl for 0 and 36 hours after axotomy, n=4 mice for mTORfl/fl for 24 and 48 hours after axotomy, n=3 mice for mTORfl/fl; P0Cre for 0 hours after axotomy, n=4 mice for mTORfl/fl; P0Cre for 24 and 36 hours after axotomy, n=6 mice for mTORfl/fl; P0Cre for 48 hours after axotomy, *P=0.003, ** P<0.0001). Scale bars: 10μm.
Statistical evaluation in c-h was performed using Student’s t-test, unpaired, two-tailed, and in j using multiple Student’s t-test, unpaired, two-tailed.
Extended Data Fig. 7. Analysis of nerves from mutant mice lacking key mTOR components in SCs.
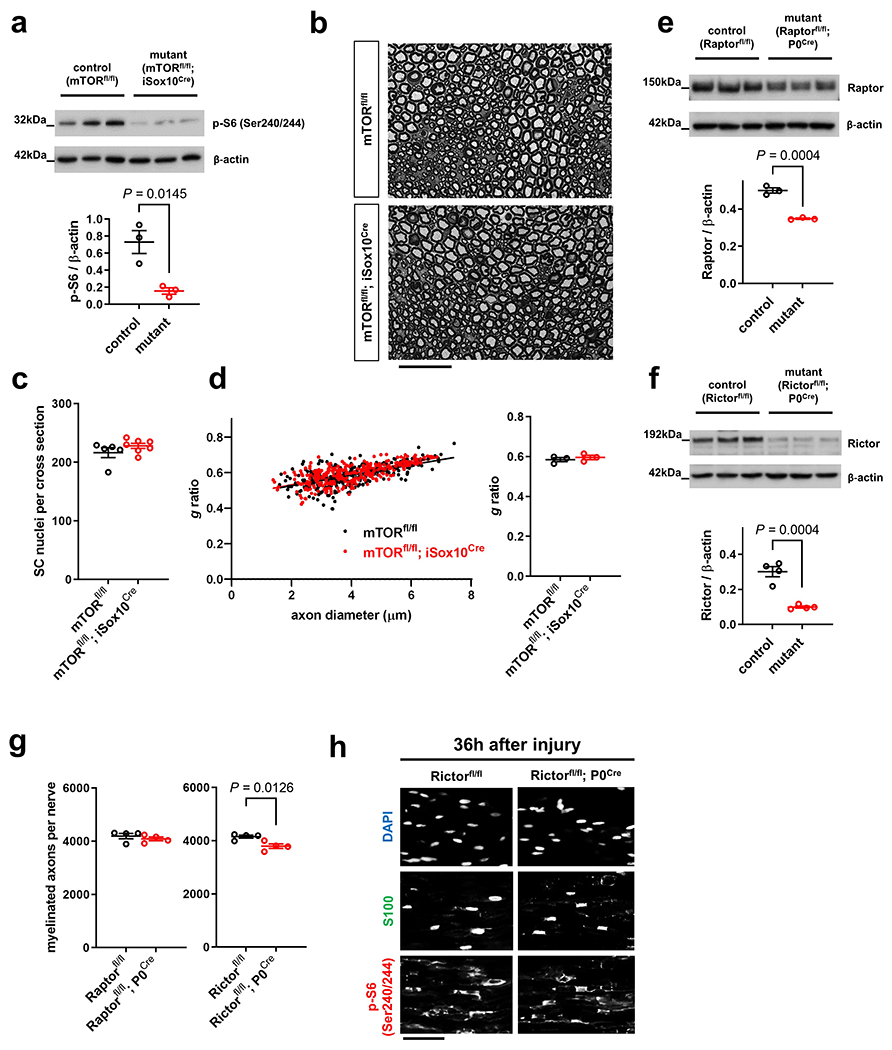
a, Western blot mTORC1 activity (reflected by S6 phosphorylation at Ser240/244) analysis of sciatic nerve lysates (cropped blot images) from control and mTORfl/fl; iSox10Cre mice (30 days after last tamoxifen administration) probed with the indicated antibodies (Error bars represent s.e.m. n=3 mice per genotype. Each dot represents measurement from sciatic nerve lysate from one mouse). b, Representative semithin micrographs of transverse sciatic nerve sections from 12-weeks-old control and mTORfl/fl; iSox10Cre mice 30 days following last tamoxifen administration. Note indistinguishable nerve structure between control and mutant mice. Scale bar: 50μm. c, Quantification of SC nuclei in sciatic nerve cross sections from mice with the indicated genotypes 30 days following tamoxifen administration (Error bars represent s.e.m. n=5 mice for mTORfl/fl and n=7 mice for mTORfl/fl; iSox10Cre). d, Quantification of g ratios (left: scatter plots show g ratios of individual myelinated axons as function of axon diameter, right: corresponding cumulative g ratios per animal) in sciatic nerves from mice with the indicated genotypes 30 days following tamoxifen administration (Error bars represent s.e.m. n=3 mice per genotype). e, f, Western blot analysis (cropped blot images) of sciatic nerve lysates from indicated control and mutant mice (age 5 days in e and 8 weeks in f) probed with the shown antibodies (Error bars represent s.e.m. n=3 mice per genotype in e and n=4 mice per genotype in f. Each dot represents measurement from sciatic nerve lysate from one mouse). g, Quantification of myelinated axons in sciatic nerves from indicated 8-weeks-old control and mutant mice (Error bars represent s.e.m. n=4 mice per genotype for each graph). h, Representative immunofluorescence using the indicated markers on longitudinal frozen sections of distal sciatic nerve stumps from control and Rictorfl/fl; P0Cre mutant mice 36h after nerve transection injury. Note normal induction of mTORC1 activity in SCs of Rictor-deficient mice as reflected by indistinguishable p-S6 (Ser240/244) immunoreactivity. Scale bar: 50μm. The experiment was reproduced three times independently with similar results.
Statistical evaluation in a, c-g was performed using Student’s t-test, unpaired, two-tailed.
Extended Data Fig. 8. Nerves from mutant mice with depletion of c-Myc and/or Hif1α in SCs show no abnormalities of myelinated axons.
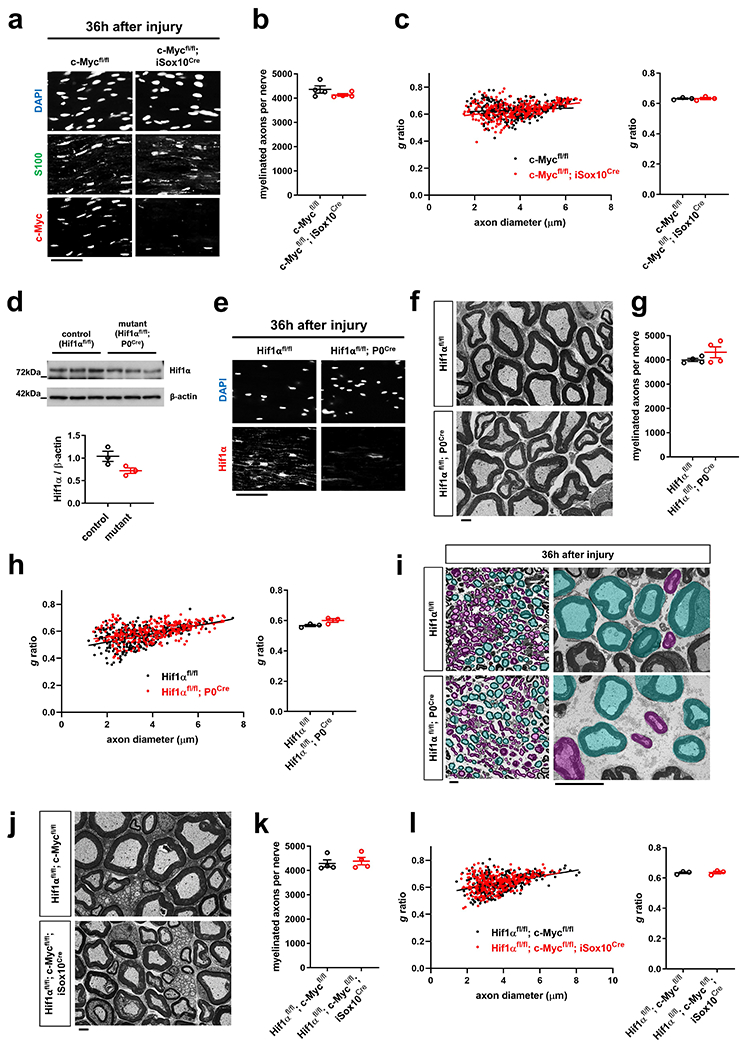
a, Representative immunofluorescence using the indicated antibodies on longitudinal sections of axotomized sciatic nerve stumps from control and c-Mycfl/fl; iSox10Cre mutant mice (30 days after last tamoxifen administration) 36h after nerve transection injury. Note largely abolished induction of c-Myc expression in SCs (S100+) of c-Mycfl/fl; iSox10Cre mice. Scale bar: 50μm. The experiment was reproduced three times independently with similar results. b, Quantification of myelinated axons in sciatic nerves from 12-weeks-old mice with the indicated genotypes 30 days following tamoxifen administration (Error bars represent s.e.m. n=4 mice per genotype). c, Quantification of g ratios (left: scatter plots show g ratios of individual myelinated axons as function of axon diameter, right: corresponding cumulative g ratios per animal) in sciatic nerves from 12-weeks-old mice with the indicated genotypes 30 days following tamoxifen administration (Error bars represent s.e.m. n=3 mice per genotype). d, Western blot analysis (cropped blot images) of sciatic nerve lysates from 8-weeks-old mice with the indicated genotypes probed with the shown antibodies (Error bars represent s.e.m. n=3 mice per genotype for each graph. Each dot represents measurement from sciatic nerve lysate from one mouse). e, Representative immunofluorescence using the indicated markers on longitudinal frozen sections of axotomized sciatic nerve stumps from control and Hif1αfl/fl; P0Cre mutant mice 36h after nerve transection injury. Note largely abolished induction of Hif1α expression in Hif1αfl/fl; P0Cre mice. Scale bar: 50μm. The experiment was reproduced three times independently with similar results. f, Representative electron micrographs of transverse sciatic nerve sections from 8-weeks-old control and Hif1αfl/fl; P0Cre mice. Note indistinguishable nerve ultrastructure between control and mutant mice. Scale bar: 2μm. g, Quantification of myelinated axons in sciatic nerves from 8-weeks-old mice with the indicated genotypes (Error bars represent s.e.m. n=4 mice per genotype for each graph). h, Quantification of g ratios (left: scatter plots show g ratios of individual myelinated axons as function of axon diameter, right: corresponding cumulative g ratios per animal) in sciatic nerves from 8-weeks-old mice with the indicated genotypes (Error bars represent s.e.m. n=3 mice per genotype). i, Representative semithin (left) and electron micrographs (right) of transverse sciatic nerve sections from distal nerve stumps of mice with the indicated genotypes 36h after sciatic nerve transection with pseudocoloring of intact (turquoise) and degenerated (magenta) myelinated fibers. Scale bars: 10μm. The experiment was reproduced three times independently with similar results. j, Representative electron micrographs of transverse sciatic nerve sections from 12-weeks-old control and Hif1αfl/fl; c-Myc fl/fl; iSox10Cre mice 30 days following the last tamoxifen administration. Note indistinguishable nerve ultrastructure between control and mutant mice. Scale bar: 2μm. k, Quantification of myelinated axons in sciatic nerves from 12-weeks-old mice with the indicated genotypes 30 days following tamoxifen administration (Error bars represent s.e.m. n=4 mice per genotype). l, Quantification of g ratios (left: scatter plots show g ratios of individual myelinated axons as function of axon diameter, right: corresponding cumulative g ratios per animal) in sciatic nerves from 12-weeks-old mice with the indicated genotypes 30 days following tamoxifen administration (Error bars represent s.e.m. n=3 mice per genotype).
Statistical evaluation in b-d, g, h, k, l was performed using Student’s t-test, unpaired, two-tailed.
Extended Data Fig. 9. Nerves from mutant mice with depletion of TSC2 in SCs show no abnormalities of myelinated axons.
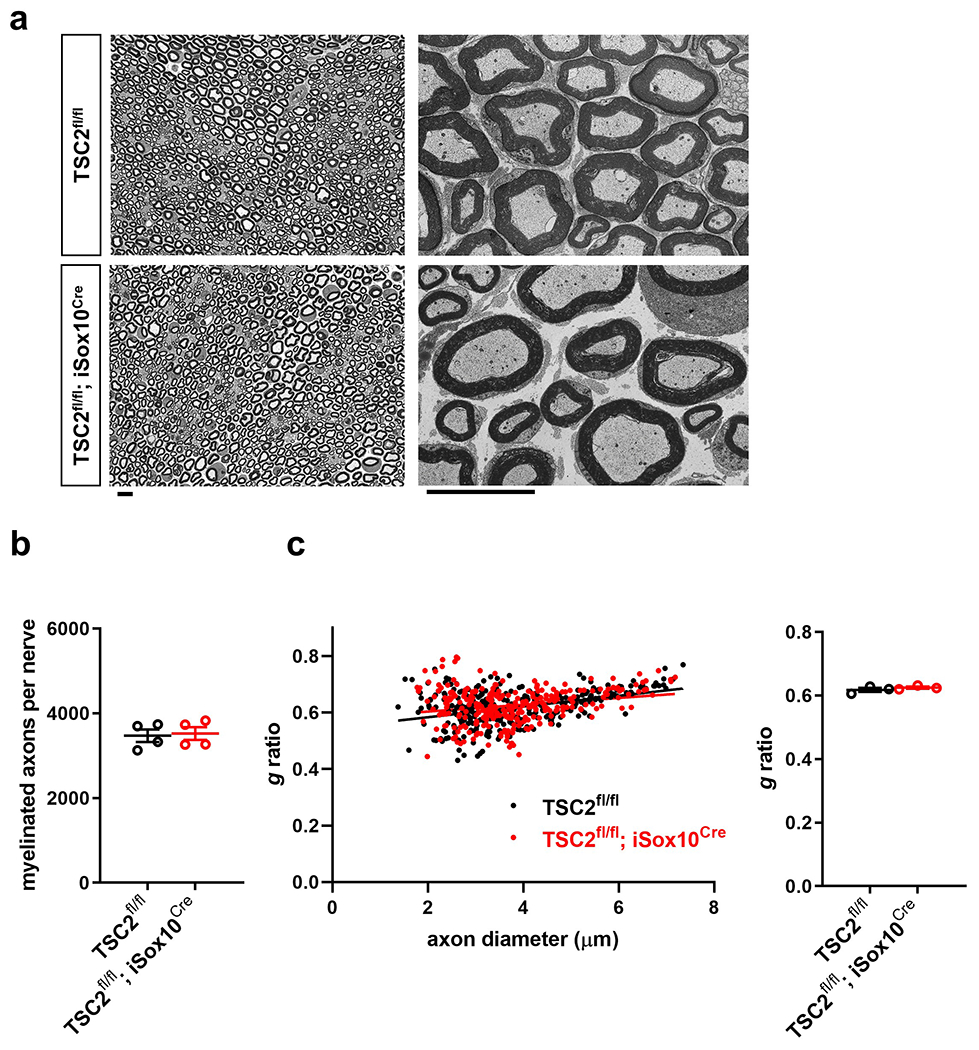
a, Representative semithin (left) and electron micrographs (right) of transverse sciatic nerve sections from 12-weeks-old control and TSC2fl/fl; iSox10Cre mice 30 days following tamoxifen administration. Scale bars: 10μm. b, Quantification of myelinated axons in sciatic nerves from mice with the indicated genotypes 30 days following tamoxifen administration (Error bars represent s.e.m. n=4 mice per genotype). c, Quantification of g ratios (left: scatter plots show g ratios of individual myelinated axons as function of axon diameter, right: corresponding cumulative g ratios per animal) in sciatic nerves from mice with the indicated genotypes 30 days following tamoxifen administration (Error bars represent s.e.m. n=3 mice per genotype).
Statistical evaluation in b and c was performed using Student’s t-test, unpaired, two-tailed.
Extended Data Fig. 10. Additional behavioral, electrophysiological, and structural analysis of ACR-treated mice.
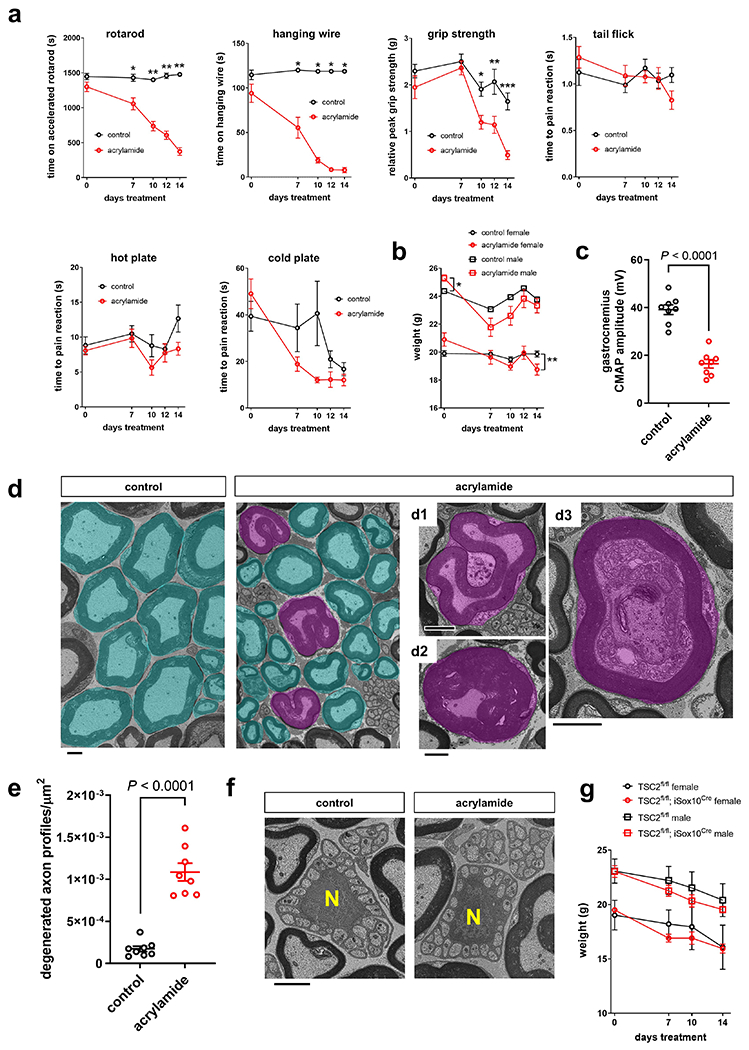
a, Behavioral analysis of C57Bl/6J mice over the course of ACR intoxication (or control treatment) for 14 days. Note accentuated deterioration of motor performance (rotarod, hanging wire, grip strength) relative to sensory performance (tail flick, hot and cold plate) (Error bars represent s.e.m. n=8 mice per group and time point, except n=7 mice for control treatment 0 days tail flick, *P=0.0024, **P<0.0001 for rotarod, *P<0.0001 for hanging wire, *P=0.0049, **P=0.0130, ***P<0.0001 for grip strength). b, Weight analysis of C57Bl/6J mice over the course of ACR intoxication (or control treatment) for 14 days (Error bars represent s.e.m. n=5 female and n=3 male control mice, n=4 female and male ACR-treated mice, *P=0.0299, **P=0.0346). c, Analysis of CMAP amplitudes recorded in gastrocnemius muscles evoked after sciatic nerve stimulation of C57Bl/6J mice following 14d of ACR treatment, or control treatment (Error bars represent s.e.m. n=8 mice per group). d, Representative electron micrographs of transverse tibial nerve sections from C57Bl/6J mice following 14d of ACR admininistration (or control treatment), with pseudocoloring of intact (turquoise) and degenerated (magenta) myelinated fiber profiles. Degenerated profiles appeared as collapsed myelinated axons with little axoplasm or axons with segregation of the axoplasm by segments of the myelin sheath (d1), deranged fibers with axoplasm constriction due to myelin infoldings and convolution (d2), and myelinated fibers with accumulation of membrane like material, multivesicular structures, and dense bodies in the axoplasm (d3). Scale bars: 2μm. e, Densities of degenerated axon profiles in tibial nerves from C57Bl/6J mice following control treatment or 14d of ACR admininistration (Error bars represent s.e.m. n=8 mice per group). f, Representative electron micrographs of transverse tibial nerve sections from C57Bl/6J mice following control treatment or 14d of ACR admininistration show normal ultrastructure of unmyelinated axons in Remak bundles (‘N’ depicts nuclei of SCs forming Remak bundles). Scale bar: 2μm. The experiment was reproduced three times independently with similar results. g, Weight analysis of ACR-treated control TSC2fl/fl and mutant TSC2fl/fl; iSox10Cre mice (Error bars represent s.e.m. n=4 female and n=7 male mice (except n=6 male mice for 14 days treatment time point) with genotype TSC2fl/fl, n=8 female and n=6 male mice with genotype TSC2fl/fl; iSox10Cre).
Statistical evaluation in a, b, and g was performed using multiple Student’s t-test, unpaired, two-tailed, and in c and e using Student’s t-test, unpaired, two-tailed.
Supplementary Material
Supplementary Table 1 - List of antibodies with validation details
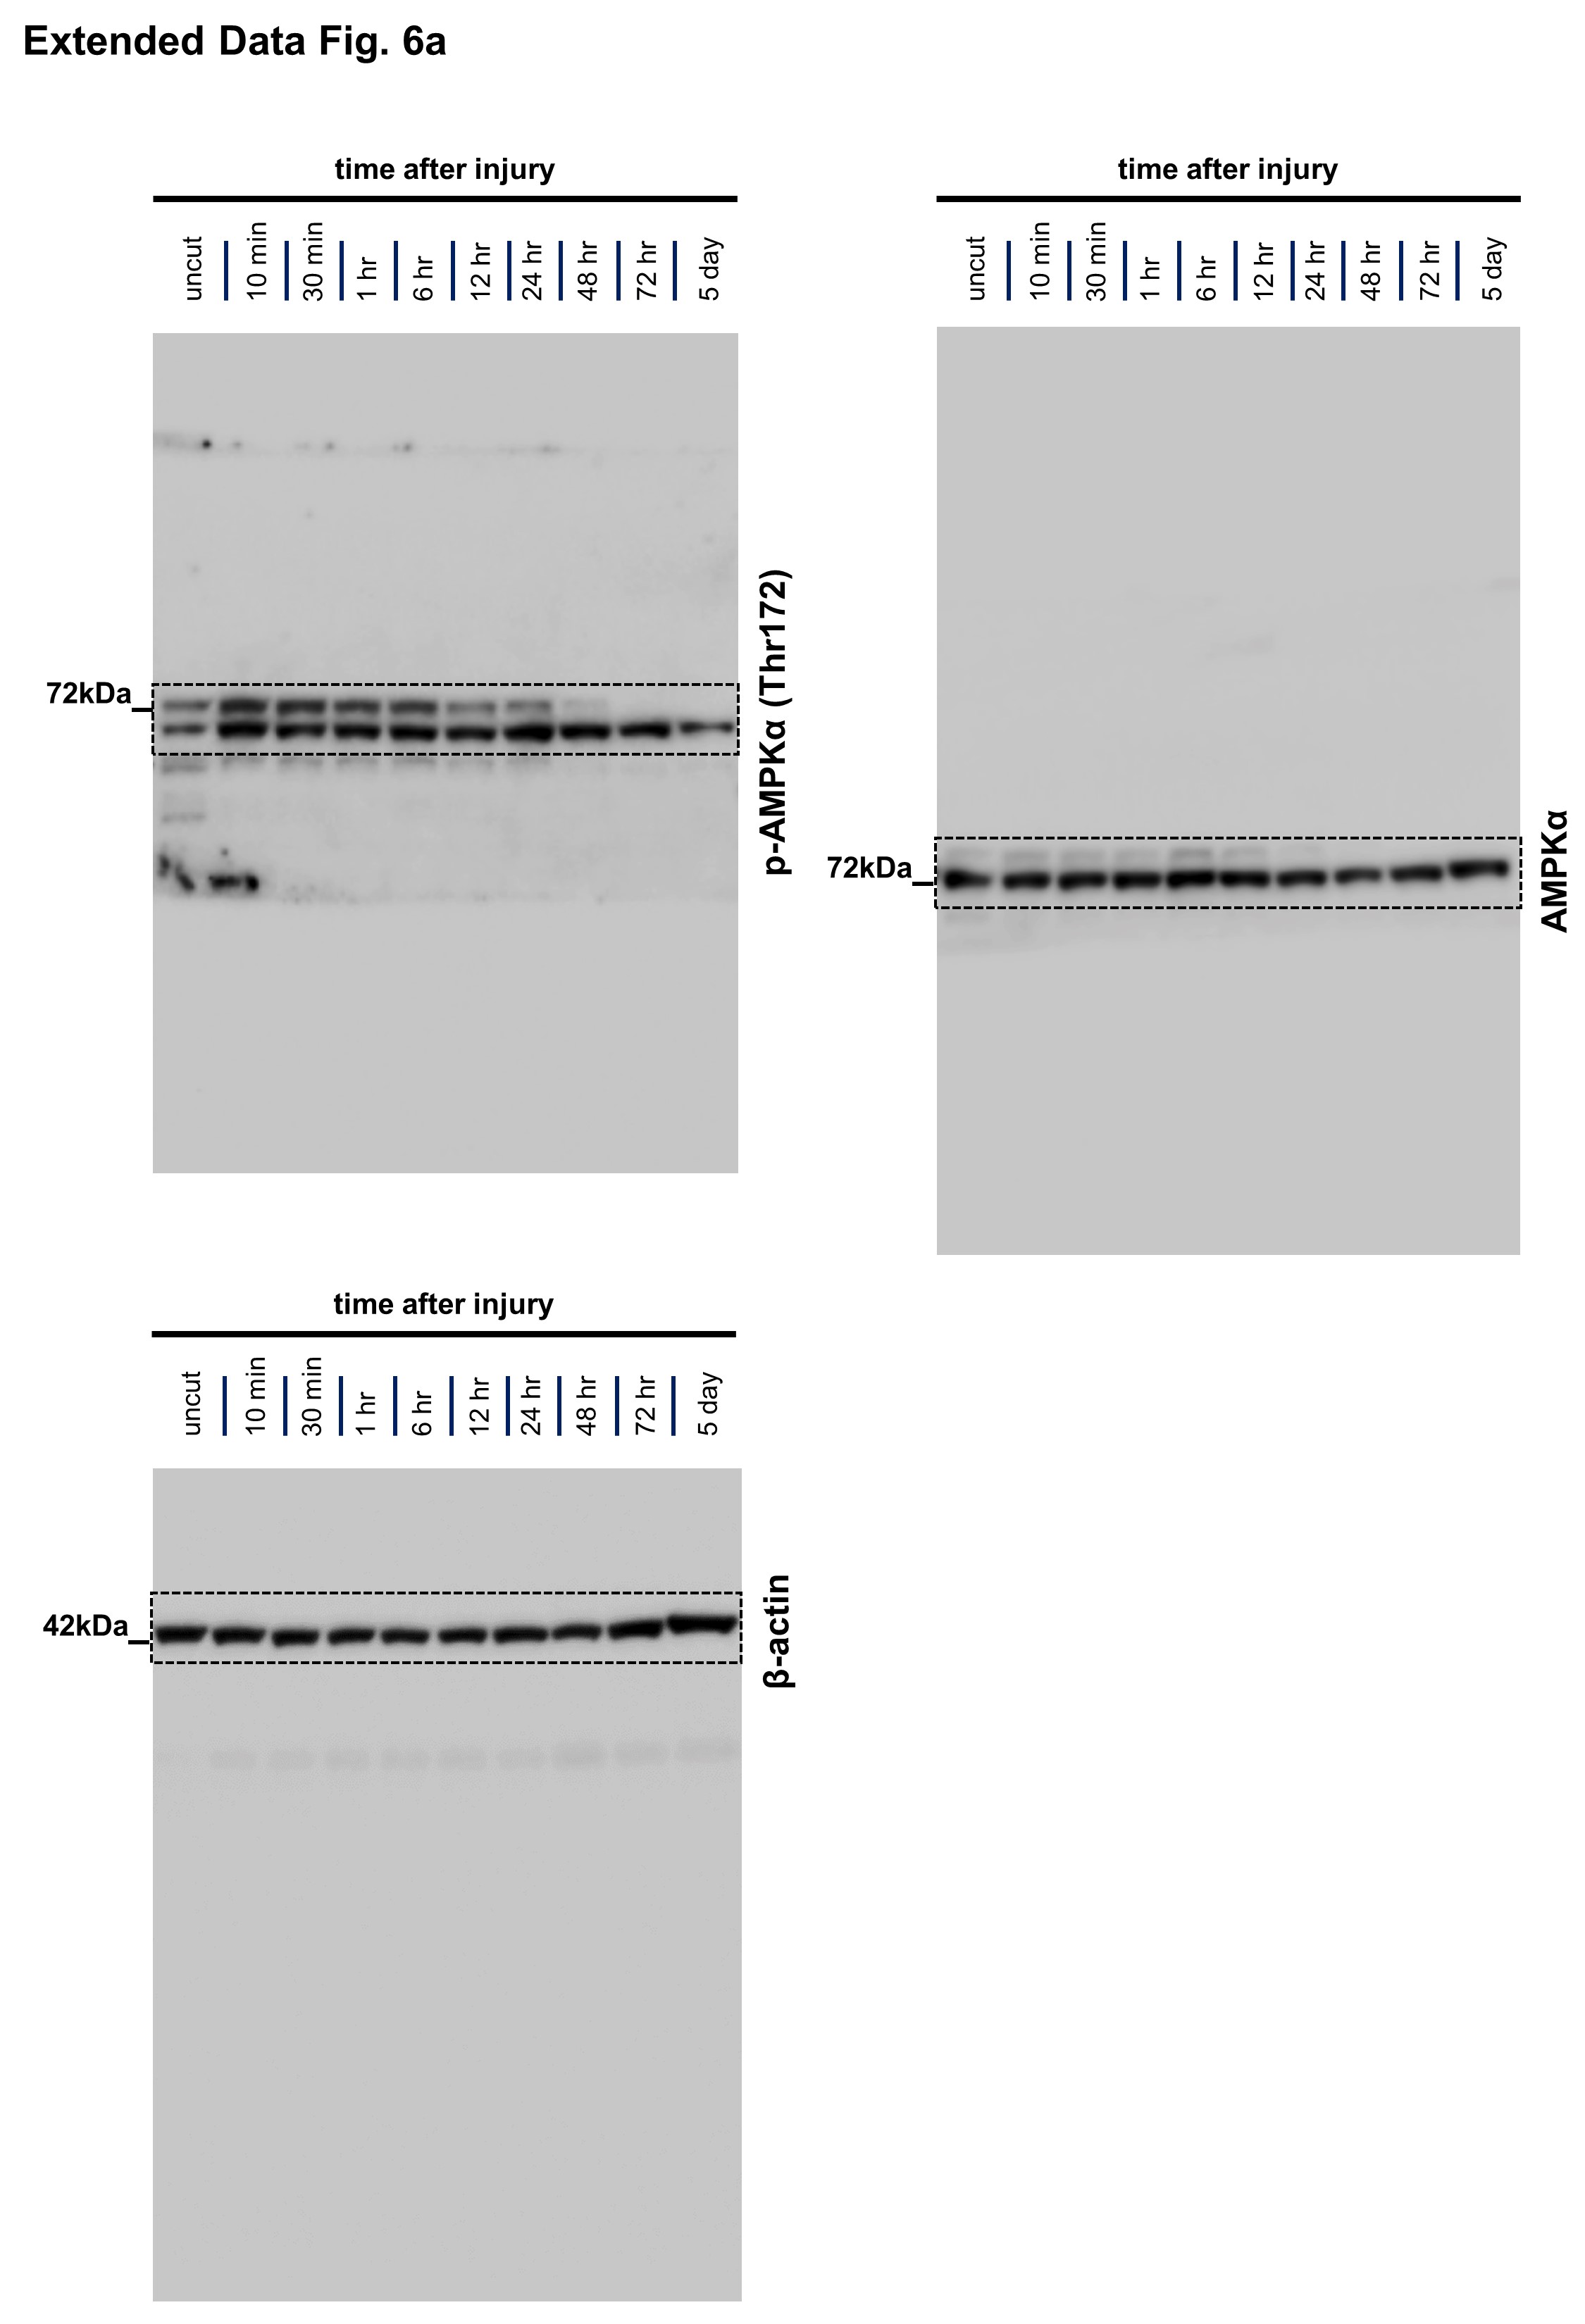
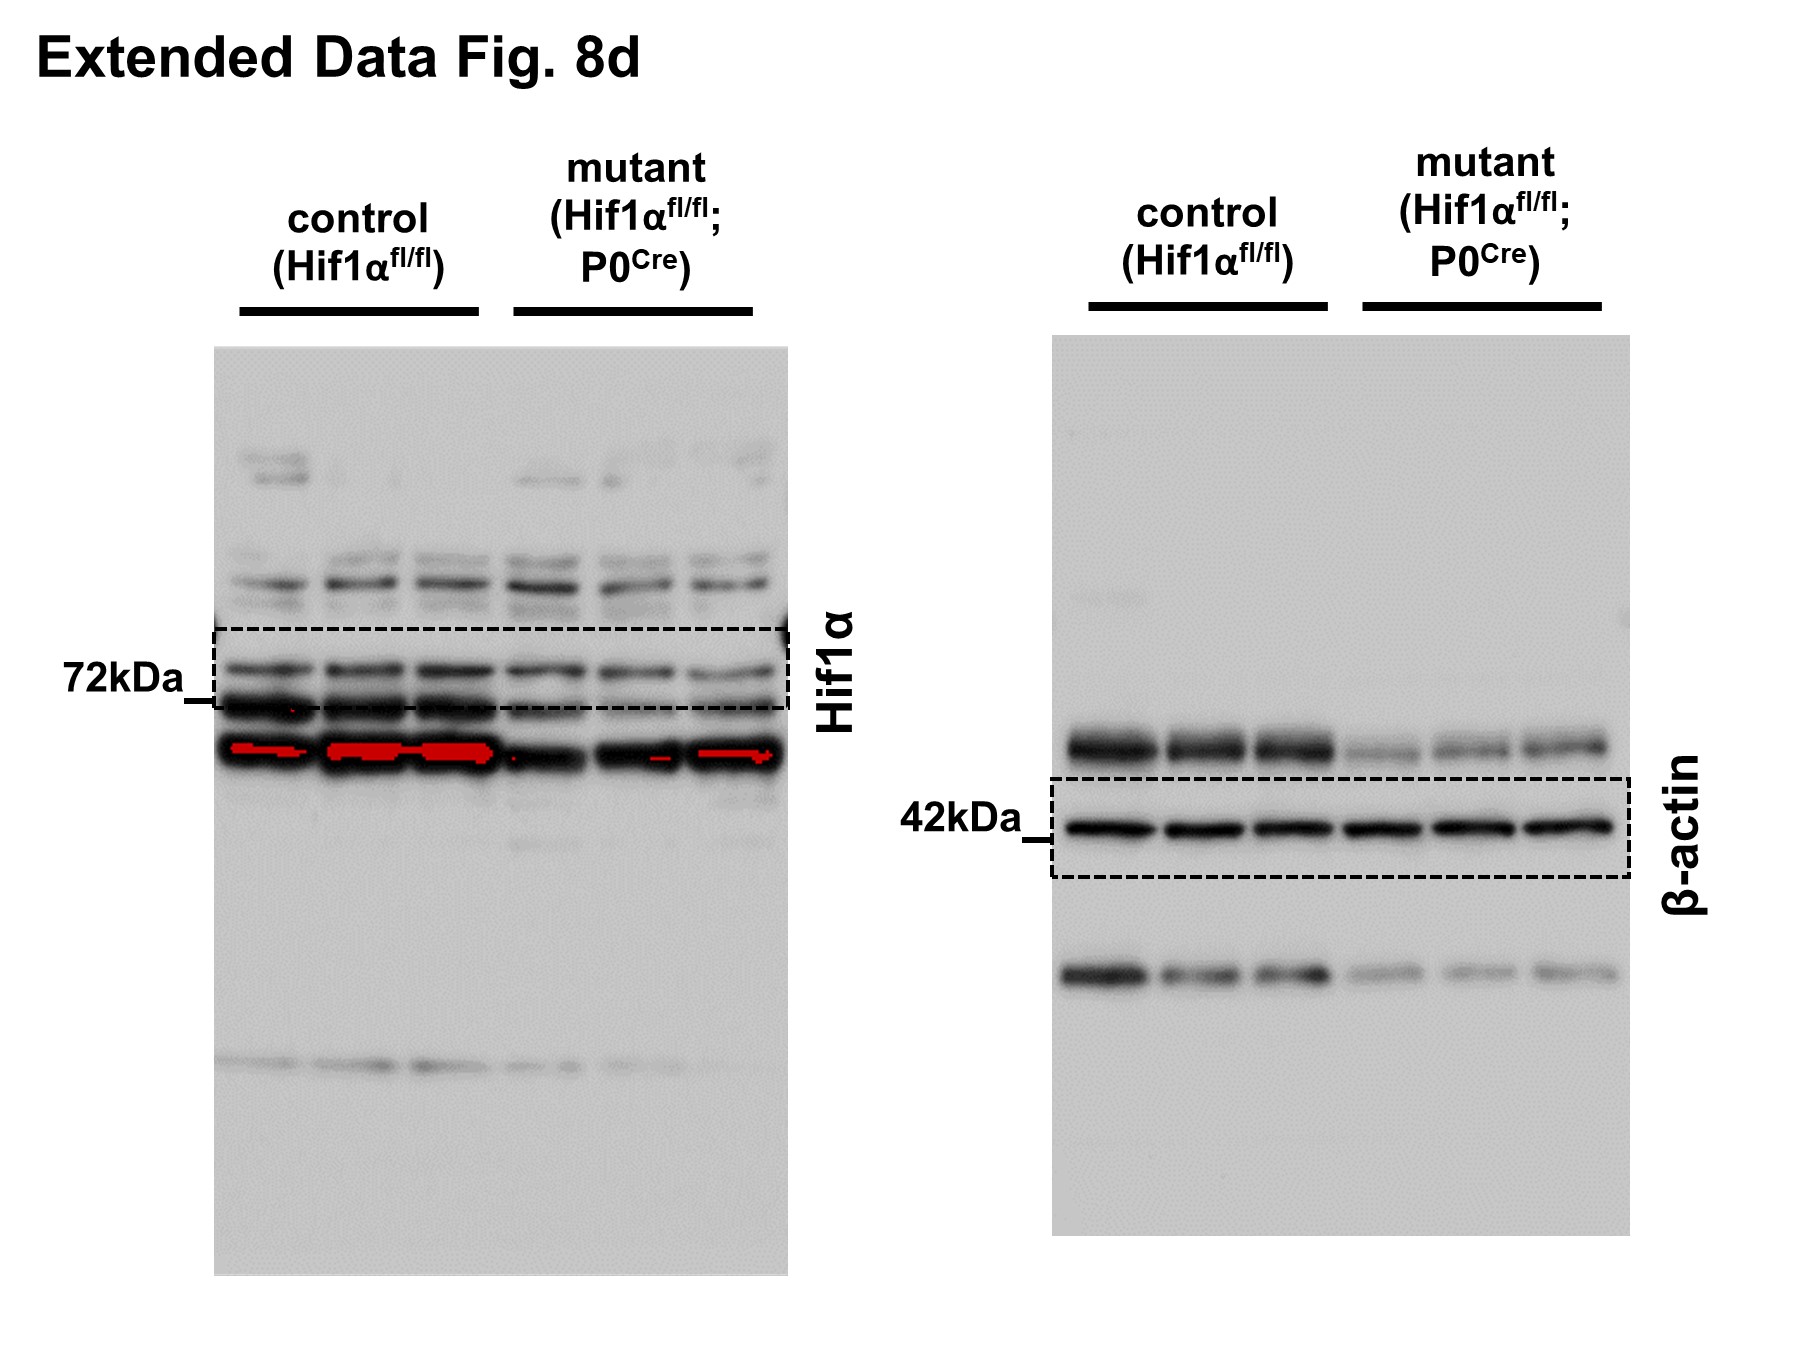
Acknowledgements
We thank R. Loren, T. Bierschenk, and the animal husbandry staff of the Laboratory Animal Shared Resources (LASR) at the Roswell Park Comprehensive Cancer Center for technical assistance with mouse colony maintenance, C. Deppmann (University of Virginia) for help with microfluidic devices, and L. Feltri (University at Buffalo) for help with rat SC cultures, S. James for assistance with digital-droplet PCR analysis, E.D. Abel (University of Iowa) for conditional GLUT1 mice, F. Alt (Harvard Medical School) for conditional c-Myc mice, M. Gambello (Emory School of Medicine) for the conditional TSC2 mice, V. Pachnis (Francis Crick Institute) for iSox10Cre mice, and the Michigan Regional Comprehensive Metabolomics Resource Core for help with the metabolomics analysis. This study was supported by Muscular Dystrophy Association Grants 577844 (B.B.) and 292306 (E.B.), and start-up funding for B.B. provided through Empire State Development Corporation for Hunter James Kelly Research Institute Grants W753 and U446 and the Hunter’s Hope Foundation. This work was also supported by the NIH National Cancer Institute (NCI) grant P30CA016056.
Footnotes
Publisher's Disclaimer: This Author Accepted Manuscript is a PDF file of an unedited peer-reviewed manuscript that has been accepted for publication but has not been copyedited or corrected. The official version of record that is published in the journal is kept up to date and so may therefore differ from this version.
Reporting Summary
Further information on research design and used resources is available in the Nature Research Reporting Summary linked to this article.
Competing Interests Statement
The authors declare no competing interests as defined by Nature Research, or other interests that might be perceived to influence the results and/or discussion reported in this paper.
Data Availability
The source data underlying all quantifications and statistical analyses as well as original Western blot images are included in this published article (Source Data in Supplementary Information). Additional source data underlying Figs. 1–8 and the results presented in the Extended Data Figs. and Supplementary Figs. are available from the corresponding author upon reasonable request. The Cell Signaling Technology PhosphoSitePlus database v6.5.9.2 is available on: https://www.phosphosite.org
References
- 1.Coleman MP & Hoke A Programmed axon degeneration: from mouse to mechanism to medicine. Nat Rev Neurosci 21, 183–196 (2020). [DOI] [PMC free article] [PubMed] [Google Scholar]
- 2.Figley MD & DiAntonio A The SARM1 axon degeneration pathway: control of the NAD(+) metabolome regulates axon survival in health and disease. Curr Opin Neurobiol 63, 59–66 (2020). [DOI] [PMC free article] [PubMed] [Google Scholar]
- 3.Krauss R, Bosanac T, Devraj R, Engber T & Hughes RO Axons Matter: The Promise of Treating Neurodegenerative Disorders by Targeting SARM1-Mediated Axonal Degeneration. Trends Pharmacol Sci 41, 281–293 (2020). [DOI] [PubMed] [Google Scholar]
- 4.Yang J, et al. Pathological axonal death through a MAPK cascade that triggers a local energy deficit. Cell 160, 161–176 (2015). [DOI] [PMC free article] [PubMed] [Google Scholar]
- 5.Walker LJ, et al. MAPK signaling promotes axonal degeneration by speeding the turnover of the axonal maintenance factor NMNAT2. eLife 6 (2017). [DOI] [PMC free article] [PubMed] [Google Scholar]
- 6.Gerdts J, Brace EJ, Sasaki Y, DiAntonio A & Milbrandt J SARM1 activation triggers axon degeneration locally via NAD(+) destruction. Science 348, 453–457 (2015). [DOI] [PMC free article] [PubMed] [Google Scholar]
- 7.Essuman K, et al. The SARM1 Toll/Interleukin-1 Receptor Domain Possesses Intrinsic NAD+ Cleavage Activity that Promotes Pathological Axonal Degeneration. Neuron 93, 1334–1343 e1335 (2017). [DOI] [PMC free article] [PubMed] [Google Scholar]
- 8.Yamagishi Y & Tessier-Lavigne M An Atypical SCF-like Ubiquitin Ligase Complex Promotes Wallerian Degeneration through Regulation of Axonal Nmnat2. Cell Rep 17, 774–782 (2016). [DOI] [PMC free article] [PubMed] [Google Scholar]
- 9.Babetto E, Beirowski B, Russler EV, Milbrandt J & DiAntonio A The Phr1 ubiquitin ligase promotes injury-induced axon self-destruction. Cell Rep 3, 1422–1429 (2013). [DOI] [PMC free article] [PubMed] [Google Scholar]
- 10.Babetto E, et al. Targeting NMNAT1 to Axons and Synapses Transforms Its Neuroprotective Potency In Vivo. J Neurosci 30, 13291–13304 (2010). [DOI] [PMC free article] [PubMed] [Google Scholar]
- 11.Gilley J & Coleman MP Endogenous Nmnat2 is an essential survival factor for maintenance of healthy axons. PLoS Biol 8, e1000300 (2010). [DOI] [PMC free article] [PubMed] [Google Scholar]
- 12.Wang J, et al. A local mechanism mediates NAD-dependent protection of axon degeneration. J Cell Biol 170, 349–355 (2005). [DOI] [PMC free article] [PubMed] [Google Scholar]
- 13.Yahata N, Yuasa S & Araki T Nicotinamide mononucleotide adenylyltransferase expression in mitochondrial matrix delays Wallerian degeneration. J Neurosci 29, 6276–6284 (2009). [DOI] [PMC free article] [PubMed] [Google Scholar]
- 14.Guertin AD, Zhang DP, Mak KS, Alberta JA & Kim HA Microanatomy of axon/glial signaling during Wallerian degeneration. J Neurosci 25, 3478–3487 (2005). [DOI] [PMC free article] [PubMed] [Google Scholar]
- 15.Yang DP, et al. p38 MAPK activation promotes denervated Schwann cell phenotype and functions as a negative regulator of Schwann cell differentiation and myelination. J Neurosci 32, 7158–7168 (2012). [DOI] [PMC free article] [PubMed] [Google Scholar]
- 16.Wong KM, Babetto E & Beirowski B Axon degeneration: make the Schwann cell great again. Neural regeneration research 12, 518–524 (2017). [DOI] [PMC free article] [PubMed] [Google Scholar]
- 17.Arthur-Farraj PJ, et al. c-Jun reprograms Schwann cells of injured nerves to generate a repair cell essential for regeneration. Neuron 75, 633–647 (2012). [DOI] [PMC free article] [PubMed] [Google Scholar]
- 18.Parrinello S, et al. EphB signaling directs peripheral nerve regeneration through Sox2-dependent Schwann cell sorting. Cell 143, 145–155 (2010). [DOI] [PMC free article] [PubMed] [Google Scholar]
- 19.Vaquie A, et al. Injured Axons Instruct Schwann Cells to Build Constricting Actin Spheres to Accelerate Axonal Disintegration. Cell Rep 27, 3152–3166 e3157 (2019). [DOI] [PubMed] [Google Scholar]
- 20.Catenaccio A, et al. Molecular analysis of axonal-intrinsic and glial-associated co-regulation of axon degeneration. Cell Death Dis 8, e3166 (2017). [DOI] [PMC free article] [PubMed] [Google Scholar]
- 21.Gomez-Sanchez JA, et al. Schwann cell autophagy, myelinophagy, initiates myelin clearance from injured nerves. J Cell Biol 210, 153–168 (2015). [DOI] [PMC free article] [PubMed] [Google Scholar]
- 22.Beirowski B, et al. Metabolic regulator LKB1 is crucial for Schwann cell-mediated axon maintenance. Nat Neurosci 17, 1351–1361 (2014). [DOI] [PMC free article] [PubMed] [Google Scholar]
- 23.Saab AS, et al. Oligodendroglial NMDA Receptors Regulate Glucose Import and Axonal Energy Metabolism. Neuron 91, 119–132 (2016). [DOI] [PMC free article] [PubMed] [Google Scholar]
- 24.Lee Y, et al. Oligodendroglia metabolically support axons and contribute to neurodegeneration. Nature 487, 443–448 (2012). [DOI] [PMC free article] [PubMed] [Google Scholar]
- 25.Jha MK, et al. Monocarboxylate transporter 1 in Schwann cells contributes to maintenance of sensory nerve myelination during aging. Glia 68. 161–177 (2020). [DOI] [PMC free article] [PubMed] [Google Scholar]
- 26.Babetto E A Schwann Cell–Neuron Coculture System to Study Neuron–Glia Interaction During Axon Degeneration. Methods Mol. Biol 2143, 97–110 (2020). [DOI] [PubMed] [Google Scholar]
- 27.Beirowski B, et al. The progressive nature of Wallerian degeneration in wild-type and slow Wallerian degeneration (WldS) nerves. BMC Neurosci 6, 6 (2005). [DOI] [PMC free article] [PubMed] [Google Scholar]
- 28.Doherty JR & Cleveland JL Targeting lactate metabolism for cancer therapeutics. J Clin Invest 123, 3685–3692 (2013). [DOI] [PMC free article] [PubMed] [Google Scholar]
- 29.Kim JW, Tchemyshyov I, Semenza GL & Dang CV HIF-1-mediated expression of pyruvate dehydrogenase kinase: a metabolic switch required for cellular adaptation to hypoxia. Cell Metab 3, 177–185 (2006). [DOI] [PubMed] [Google Scholar]
- 30.Domenech-Estevez E, et al. Distribution of monocarboxylate transporters in the peripheral nervous system suggests putative roles in lactate shuttling and myelination. J Neurosci 35, 4151–4156 (2015). [DOI] [PMC free article] [PubMed] [Google Scholar]
- 31.Perez-Escuredo J, et al. Monocarboxylate transporters in the brain and in cancer. Biochim Biophys Acta 1863, 2481–2497 (2016). [DOI] [PMC free article] [PubMed] [Google Scholar]
- 32.Beirowski B Measuring Bioenergetic Signatures of Peripheral Nerve Segments by Extracellular Flux Analysis. Methods Mol. Biol 2143, 191–203 (2020). [DOI] [PubMed] [Google Scholar]
- 33.Duvel K, et al. Activation of a metabolic gene regulatory network downstream of mTOR complex 1. Mol Cell 39, 171–183 (2010). [DOI] [PMC free article] [PubMed] [Google Scholar]
- 34.Sun Q, et al. Mammalian target of rapamycin up-regulation of pyruvate kinase isoenzyme type M2 is critical for aerobic glycolysis and tumor growth. Proc Natl Acad Sci U S A 108, 4129–4134 (2011). [DOI] [PMC free article] [PubMed] [Google Scholar]
- 35.Cairns RA, Harris IS & Mak TW Regulation of cancer cell metabolism. Nat Rev Cancer 11, 85–95 (2011). [DOI] [PubMed] [Google Scholar]
- 36.DeBerardinis RJ, Lum JJ, Hatzivassiliou G & Thompson CB The biology of cancer: metabolic reprogramming fuels cell growth and proliferation. Cell Metab 7, 11–20 (2008). [DOI] [PubMed] [Google Scholar]
- 37.Dang CV, Kim JW, Gao P & Yustein J The interplay between MYC and HIF in cancer. Nat Rev Cancer 8, 51–56 (2008). [DOI] [PubMed] [Google Scholar]
- 38.Donnelly RP & Finlay DK Glucose, glycolysis and lymphocyte responses. Mol. Immunol 68, 513–519 (2015). [DOI] [PubMed] [Google Scholar]
- 39.Hardie DG, Ross FA & Hawley SA AMPK: a nutrient and energy sensor that maintains energy homeostasis. Nat Rev Mol Cell Biol 13, 251–262 (2012). [DOI] [PMC free article] [PubMed] [Google Scholar]
- 40.Sherman DL, et al. Arrest of Myelination and Reduced Axon Growth When Schwann Cells Lack mTOR. J Neurosci 32, 1817–1825 (2012). [DOI] [PMC free article] [PubMed] [Google Scholar]
- 41.Beirowski B, Wong KM, Babetto E & Milbrandt J mTORC1 promotes proliferation of immature Schwann cells and myelin growth of differentiated Schwann cells. Proc Natl Acad Sci U S A 114, E4261–E4270 (2017). [DOI] [PMC free article] [PubMed] [Google Scholar]
- 42.Figlia G, Norrmen C, Pereira JA, Gerber D & Suter U Dual function of the PI3K-Akt-mTORC1 axis in myelination of the peripheral nervous system. eLife 6 (2017). [DOI] [PMC free article] [PubMed] [Google Scholar]
- 43.Ko MH, Chen WP, Lin-Shiau SY & Hsieh ST Age-dependent acrylamide neurotoxicity in mice: morphology, physiology, and function. Exp Neurol 158, 37–46 (1999). [DOI] [PubMed] [Google Scholar]
- 44.Keswani SC, et al. Nitric oxide prevents axonal degeneration by inducing HIF-1-dependent expression of erythropoietin. Proc Natl Acad Sci U S A 108, 4986–4990 (2011). [DOI] [PMC free article] [PubMed] [Google Scholar]
- 45.Norrmen C, et al. mTORC1 is transiently reactivated in injured nerves to promote c-Jun elevation and Schwann cell dedifferentiation. J Neurosci 38, 4811–4828 (2018). [DOI] [PMC free article] [PubMed] [Google Scholar]
- 46.Stassart RM, et al. A role for Schwann cell-derived neuregulin-1 in remyelination. Nat Neurosci 16, 48–54 (2013). [DOI] [PubMed] [Google Scholar]
- 47.Napoli I, et al. A central role for the ERK-signaling pathway in controlling Schwann cell plasticity and peripheral nerve regeneration in vivo. Neuron 73, 729–742 (2012). [DOI] [PubMed] [Google Scholar]
- 48.Norrmen C, et al. mTORC1 controls PNS myelination along the mTORC1-RXRgamma-SREBP-lipid biosynthesis axis in Schwann cells. Cell Rep 9, 646–660 (2014). [DOI] [PubMed] [Google Scholar]
- 49.Peters OM, et al. Loss of Sarm1 does not suppress motor neuron degeneration in the SOD1G93A mouse model of amyotrophic lateral sclerosis. Hum Mol Genet 27, 3761–3771 (2018). [DOI] [PMC free article] [PubMed] [Google Scholar]
- 50.Velde CV, Garcia ML, Yin X, Trapp BD & Cleveland DW The Neuroprotective Factor Wlds Does Not Attenuate Mutant SOD1-Mediated Motor Neuron Disease. Neuromolecular Med 5, 193–204 (2004). [DOI] [PubMed] [Google Scholar]
Methods-only References
- 51.Mallon BS, Shick HE, Kidd GJ & Macklin WB Proteolipid promoter activity distinguishes two populations of NG2-positive cells throughout neonatal cortical development. J Neurosci 22, 876–885 (2002). [DOI] [PMC free article] [PubMed] [Google Scholar]
- 52.Young CD, et al. Modulation of glucose transporter 1 (GLUT1) expression levels alters mouse mammary tumor cell growth in vitro and in vivo. PLoS One 6, e23205 (2011). [DOI] [PMC free article] [PubMed] [Google Scholar]
- 53.Viollet B, et al. The AMP-activated protein kinase alpha2 catalytic subunit controls whole-body insulin sensitivity. J Clin Invest 111, 91–98 (2003). [DOI] [PMC free article] [PubMed] [Google Scholar]
- 54.de Alboran IM, et al. Analysis of C-MYC function in normal cells via conditional gene-targeted mutation. Immunity 14, 45–55 (2001). [DOI] [PubMed] [Google Scholar]
- 55.Hernandez O, Way S, McKenna J 3rd & Gambello MJ Generation of a conditional disruption of the Tsc2 gene. Genesis 45, 101–106 (2007). [DOI] [PubMed] [Google Scholar]
- 56.Feltri ML, et al. P0-Cre transgenic mice for inactivation of adhesion molecules in Schwann cells. Ann N Y Acad Sci 883, 116–123 (1999). [PubMed] [Google Scholar]
- 57.Laranjeira C, et al. Glial cells in the mouse enteric nervous system can undergo neurogenesis in response to injury. J Clin Invest 121, 3412–3424 (2011). [DOI] [PMC free article] [PubMed] [Google Scholar]
- 58.Sasaki Y, Vohra BP, Lund FE & Milbrandt J Nicotinamide mononucleotide adenylyl transferase-mediated axonal protection requires enzymatic activity but not increased levels of neuronal nicotinamide adenine dinucleotide. J Neurosci 29, 5525–5535 (2009). [DOI] [PMC free article] [PubMed] [Google Scholar]
- 59.Poitelon Y, et al. Spatial mapping of juxtacrine axo-glial interactions identifies novel molecules in peripheral myelination. Nat Commun 6, 8303 (2015). [DOI] [PMC free article] [PubMed] [Google Scholar]
- 60.Vroemen M & Weidner N Purification of Schwann cells by selection of p75 low affinity nerve growth factor receptor expressing cells from adult peripheral nerve. J Neurosci Methods 124, 135–143 (2003). [DOI] [PubMed] [Google Scholar]
- 61.Meyer N, et al. Oligodendrocytes in the Mouse Corpus Callosum Maintain Axonal Function by Delivery of Glucose. Cell Rep 22, 2383–2394 (2018). [DOI] [PubMed] [Google Scholar]
- 62.Yin Y, et al. Glucose Oxidation Is Critical for CD4+ T Cell Activation in a Mouse Model of Systemic Lupus Erythematosus. J Immunol 196, 80–90 (2016). [DOI] [PMC free article] [PubMed] [Google Scholar]
- 63.Du J, et al. Inhibition of mitochondrial pyruvate transport by zaprinast causes massive accumulation of aspartate at the expense of glutamate in the retina. J Biol Chem 288, 36129–36140 (2013). [DOI] [PMC free article] [PubMed] [Google Scholar]
- 64.Quanz M, et al. Preclinical Efficacy of the Novel Monocarboxylate Transporter 1 Inhibitor BAY-8002 and Associated Markers of Resistance. Mol Cancer Ther 17, 2285–2296 (2018). [DOI] [PubMed] [Google Scholar]
- 65.Benjamin D, et al. Dual Inhibition of the Lactate Transporters MCT1 and MCT4 Is Synthetic Lethal with Metformin due to NAD+ Depletion in Cancer Cells. Cell Rep 25, 3047–3058 e3044 (2018). [DOI] [PMC free article] [PubMed] [Google Scholar]
- 66.Gamage KK, et al. Death Receptor 6 Promotes Wallerian Degeneration in Peripheral Axons. Curr Biol 27, 890–896 (2017). [DOI] [PMC free article] [PubMed] [Google Scholar]
- 67.Shin JE, et al. Dual leucine zipper kinase is required for retrograde injury signaling and axonal regeneration. Neuron 74, 1015–1022 (2012). [DOI] [PMC free article] [PubMed] [Google Scholar]
- 68.Cho Y, et al. Activating Injury-Responsive Genes with Hypoxia Enhances Axon Regeneration through Neuronal HIF-1alpha. Neuron 88, 720–734 (2015). [DOI] [PMC free article] [PubMed] [Google Scholar]
- 69.Miller A, et al. Exploring Metabolic Configurations of Single Cells within Complex Tissue Microenvironments. Cell Metab 26, 788–800 (2017). [DOI] [PubMed] [Google Scholar]
- 70.Van Noorden CJ & Frederiks WM Enzyme Histochemistry (Oxford University Press, Royal Microscopy Society, 1992). [Google Scholar]
- 71.Fazal SV, et al. Graded elevation of c-Jun in Schwann cells in vivo: gene dosage determines effects on development, re-myelination, tumorigenesis and hypomyelination. J Neurosci 37, 12297–12313 (2017). [DOI] [PMC free article] [PubMed] [Google Scholar]
- 72.Beirowski B, et al. Non-nuclear Wld(S) determines its neuroprotective efficacy for axons and synapses in vivo. J Neurosci 29, 653–668 (2009). [DOI] [PMC free article] [PubMed] [Google Scholar]
- 73.Mack TG, et al. Wallerian degeneration of injured axons and synapses is delayed by a Ube4b/Nmnat chimeric gene. Nat Neurosci 4, 1199–1206 (2001). [DOI] [PubMed] [Google Scholar]
- 74.Conforti L, et al. NAD(+) and axon degeneration revisited: Nmnat1 cannot substitute for Wld(S) to delay Wallerian degeneration. Cell Death Differ. 14, 116–127 (2007). [DOI] [PubMed] [Google Scholar]
- 75.Morrison BM, et al. Deficiency in monocarboxylate transporter 1 (MCT1) in mice delays regeneration of peripheral nerves following sciatic nerve crush. Exp Neurol 263, 325–338 (2015). [DOI] [PMC free article] [PubMed] [Google Scholar]
- 76.Bogdanik LP, et al. Loss of the E3 ubiquitin ligase LRSAM1 sensitizes peripheral axons to degeneration in a mouse model of Charcot-Marie-Tooth disease. Dis Model Mech 6, 780–792 (2013). [DOI] [PMC free article] [PubMed] [Google Scholar]
- 77.Gold BG, Griffin JW & Price DL Somatofugal axonal atrophy precedes development of axonal degeneration in acrylamide neuropathy. Arch. Toxicol 66, 57–66 (1992). [DOI] [PubMed] [Google Scholar]
- 78.Von Burg R, Penney DP & Conroy PJ Acrylamide neurotoxicity in the mouse: a behavioral, electrophysiological and morphological study. J. Appl. Toxicol 1, 227–233 (1981). [DOI] [PubMed] [Google Scholar]
- 79.Lehning EJ, Persaud A, Dyer KR, Jortner BS & LoPachin RM Biochemical and morphologic characterization of acrylamide peripheral neuropathy. Toxicol Appl Pharmacol 151, 211–221 (1998). [DOI] [PubMed] [Google Scholar]
Associated Data
This section collects any data citations, data availability statements, or supplementary materials included in this article.
Supplementary Materials
Supplementary Table 1 - List of antibodies with validation details
Data Availability Statement
The source data underlying all quantifications and statistical analyses as well as original Western blot images are included in this published article (Source Data in Supplementary Information). Additional source data underlying Figs. 1–8 and the results presented in the Extended Data Figs. and Supplementary Figs. are available from the corresponding author upon reasonable request. The Cell Signaling Technology PhosphoSitePlus database v6.5.9.2 is available on: https://www.phosphosite.org