Abstract
Background:
The Covid-19 pandemic in Italy has been characterized by three waves of infection during 2020. Vaccination of healthcare workers started in January 2021, earlier than that of other population groups. The main aim of this study is to compare the spread of the pandemic between HCW and the general population focusing on potential effects of the vaccination.
Methods:
The study consisted of a retrospective analysis of results of RT-PCR tests performed between 6 March 2020 and 4 April 2021 among HCWs from Bologna, Italy, and those of the general population of Emilia Romagna region. We calculated the crude proportion of positive RT-PCR tests over total tests and the crude prevalence of positive test in population; then, we conducted joinpoint analyses using the Joinpoint Regression Program of the National Cancer Institute.
Results:
The results of the joinpoint analysis show that both φ and ψ ratio indicators have a similar pattern, with a sharp increase during the early phase of the pandemic, and a strong decrease at the end of the first wave around week 15. In both indicators there are no significant changes in the trend after week 25. Pandemic spread among HCWs appeared earlier than in the general population, but it otherwise appeared to have comparable features. A decline in infection was apparent among HCWs after vaccination.
Conclusions:
Surveillance of HCWs would inform on the epidemic in the general population. The apparent effectiveness of the anti-SarsCoV2 vaccine will likely occur in the general population.
Keywords: SARS-CoV-2, COVID-19, RT-PCR, healthcare workers, epidemiology, vaccination
Rate of making swabs (r)
Introduction
Coronavirus are RNA viruses of the family Coronaviridae (1, 2), which consist of alpha CoV, beta CoV, gamma CoV and delta CoV genera based on genomic structure(3).
Seven different coronaviruses from alpha and beta genera are known to infect and cause disease in humans. These include viruses that cause severe acute respiratory syndrome (SARS-CoV), the Middle East respiratory syndrome (MERS-CoV) (4), and SARS-CoV-2. All of them are relatively highly infective and lethal.
In December 2019, for the first time a large number of viral pneumonia was reported in Wuhan city, Hubei province, China (5). The virus was initially named the 2019 novel coronavirus (2019-nCoV), but then the International Committee of Taxonomy of Viruses named it SARS-CoV-2 (6).
Due to globalization, intercultural exchanges and intercontinental travels, the SARS-CoV-2 spread rapidly around the world, and since the onset, the number of infected individuals and deaths has risen constantly; in fact, as of the end of April 2021, COVID-19 has already been responsible for 148 million infections and more than 3 million deaths globally (7).
Considering this, countries all around the world planned prevention strategies to reduce the transmission rate and consequently, the burden of COVID-19. Therefore, scientific research in the world has focused on development of vaccine against SARS-CoV-2 (8).
In Italy, Coronavirus spread started in February 2020, and the government reacted by adopting containment measurements, including a national lockdown between March and May 2020. Furthermore, pandemic spread has led to strong consequences on healthcare system (9).
Vaccination of Italian healthcare workers (HCWs) started at the end of December 2020, while that of other population groups started in March 2021.
We aimed at studying the patterns of the infection in HCWs compared to the general population, with focus on potential effects of the vaccination campaign.
Methods
The study consisted of a retrospective analysis of results of RT-PCR tests performed among HCWs employed in a large university hospital, in a specialized orthopedic hospital or in other public hospitals in Bologna, Northern Italy, that were included in a surveillance program managed by the Occupational Health Unit of the university hospital.
These data were compared to those of the population of Emilia Romagna, the region in which Bologna is located; these data were obtained from the national Civil Protection Authority (10).
HCWs who either experienced a close contact with a confirmed case of Covid-19 (whether a coworker or a patient) or exhibited symptoms compatible with COVID-19 (either two major symptoms, including cough, sore throat, fever, myalgia, asthenia, anosmia, ageusia, and dyspnea, or one major and two minor symptoms, including rhinorrhea, chills, arthralgia, diarrhea, conjunctivitis, and vesicular erythema) were tested for SARS-CoV-2 infection and were included in a surveillance program, that included telephone contacts for symptoms monitoring and, where required, the prescription of medications. A further group of asymptomatic HCWs were screened on a voluntary basis.
Nasopharyngeal/oropharyngeal swab samples were analyzed by RT-PCR according to the guidelines proposed by the World Health Organization (11). Samples were collected between 6 March 2020 and 4 April 2021.
We abstracted results for the same period on swabs provided by the Civil Protection Authority, based on aggregate data provided by the Regions coordinated by the Ministry of Health, with the support of the Civil Protection and the National Institute of Public Health, to collect timely information on the number of positive tests, deaths, hospital admissions and intensive care admissions in each Province of Italy. Because of lack COVID-19 tests during pandemic spreads, swabs were mainly performed on symptomatic persons and asymptomatic close contacts; furthermore, we have no data about age, sex and job title in the general population.
Since the data on RT-PCR tests in the regional population are available only in aggregate form, and it is not possible to link the results of multiple tests performed by the same individual, we performed the analysis on the data aggregated by week, under the assumption that it was unlikely that the same individual tested positive more than once within the same week. In other words, the number of positive tests during a week represents a good approximation of the number of subjects who tested positive during that week. We tested this assumption using the data on HCWs. We abstracted, for both HCWs and the general population; the number of positive tests, the number of tests performed, and the number of people at risk, the latter was considered constant over time for each week between March 9, 2020 and April 4, 2021.
We then calculated, for each week and for both HCWs and the general population, the crude proportion of positive RT-PCR tests over total tests (p), and the crude prevalence of positive test in the population (q). We then used 2 letters of the Greek alphabet to calculate the ratios of these indicators among HCWs and in the general population: φ = p(HCW) / p(pop); ψ = q(HCW) / q(pop), and analyzed how they changed over time. To this aim we conducted joinpoint analyses using the Joinpoint Regression Program of the National Cancer Institute (Joinpoint Regression Program, Version 4.9.0.0. Statistical Research and Applications Branch, National Cancer Institute, March 2021) (12) to identify changes in trends over time, setting the maximum number of changes to 5.
Vaccination of HCWs started at the end of December 2020. Almost all vaccinated HCWs received a double dose of the Comirnaty vaccine (BioNTech/Pfizer), while only a very small percentage in the final phase of the vaccination campaign received the Moderna COVID-19 (mRNA-1273) vaccine or the Oxford / AstraZeneca COVID-19 vaccine.
Results
From March 9, 2020 to April 4, 2021, a total of 20,109 HCWs were included in the study, of whom 7,451 from the university hospital, 1,703 from a specialized orthopedic hospital and 10,955 from other public hospitals. Among them, a total of 96,122 RT-PCR tests were performed (average 4.8 tests/HCW), of which 5,187 were positive (5.4%), 90,627 were negative and 308 were not interpretable. A total of 2,968 HCW (14.8%) had at least one positive test (average 1.75 positive tests/positive HCW); among multiple positive tests in the same HCW, 165 (3.18% of all positive tests) were performed in the same week. Descriptive results of HCWs RT-PCR tests are shown in Table 1.
Table 1.
Descriptive analysis of HCWs RT-PCR tests by gender, age and job title
| Negatives, No. | Not Interpretable, No. | Positives, N. | Total, n. | |
|---|---|---|---|---|
| Total | 90,627 | 308 | 5,187 | 96,122 |
| Sex | ||||
| Men | 26,018 | 75 | 1,549 | 27,642 |
| Women | 64,048 | 233 | 3,587 | 67,868 |
| Not available | / | / | / | 612 |
| Age group | ||||
| <35 | 23,728 | 59 | 1,291 | 25,078 |
| 35-44 | 19,922 | 70 | 1,112 | 21,104 |
| 45-54 | 25,434 | 81 | 1,491 | 27,006 |
| 55+ | 20,990 | 98 | 1,243 | 22,331 |
| Not available | / | / | / | 603 |
| Job title | ||||
| Administration | 662 | 3 | 47 | 712 |
| Physician | 21,860 | 58 | 1,054 | 22,972 |
| Nurse | 40,903 | 118 | 2,367 | 43,388 |
| Other HCW | 27,202 | 129 | 1,719 | 29,050 |
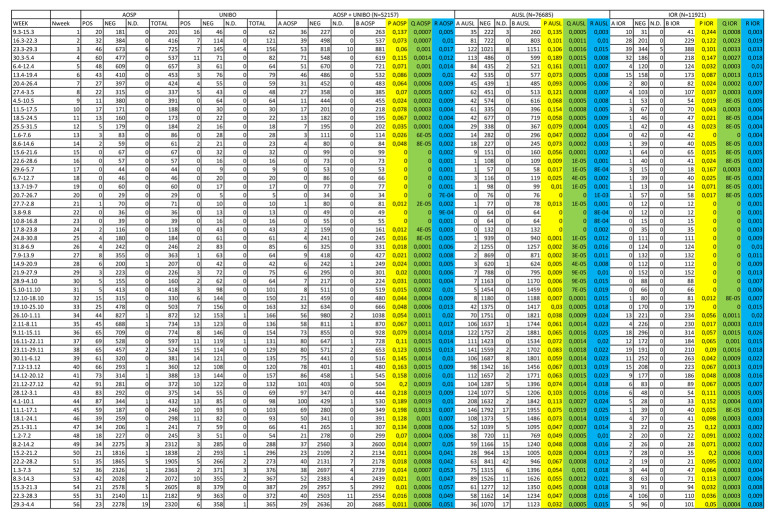
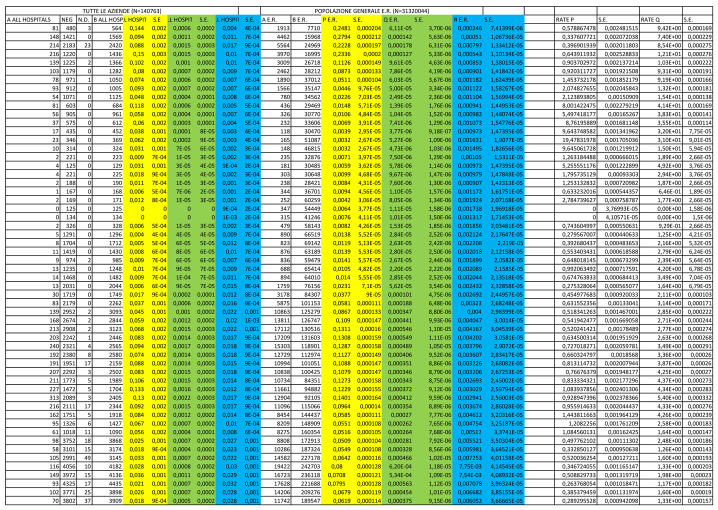
In the same period among the general population of Emilia Romagna (N= 4,474,292), a total of 4,958,917 RT-PCR tests were performed (average 1.1 test/subject), of which 341,735 were positive (6.9%), and 4,617,182 were negative. Detailed results by week are reported in Supplementary Table 1.
Supplementary Table 1.
Slopes in Joinpoint Regression (week 1-56)
| 1 | 2 | 3 | 4 | 5 | 6 | |
| P (Hospitals)* | -4.12 (1-10) |
-17.12 (10-26) |
33.11 (26-36) |
+6.02 (36-44) |
-15.61 (44-56) |
/ |
| P (E.R.)* | -6.71 (1-4) |
-35.51 (4-13) |
+8.12 (13-29) |
+38.32 (29-36) |
-4.37 (36-56) |
/ |
| Q (Hospitals)* | +69.76 (1-3) |
-20.31 (3-24) |
+50.16 (24-35) |
+4.35 (35-44) |
-24.43 (44-48) |
+3.23 (48-56) |
| Q (E.R.)* | +20.37 (1-16) |
+12.55 (16-30) |
+72.75 (30-35) |
-5.07 (35-49) |
+34.11 (49-52) |
-10.38 (52-56) |
| Ratio P (φ) | +1.00 (1-14) |
-2.83 (14-18) |
+1.95 (18-21) |
-1.96 (21-24) |
+0.66 (24-27) |
-0.01 (27-56) |
| Ratio Q (ψ) | +2.93 (1-13) |
-11.28 (13-16) |
-0.12 (16-22) |
-0.81 (22-25) |
+1.33 (25-28) |
-0.06 (28-56) |
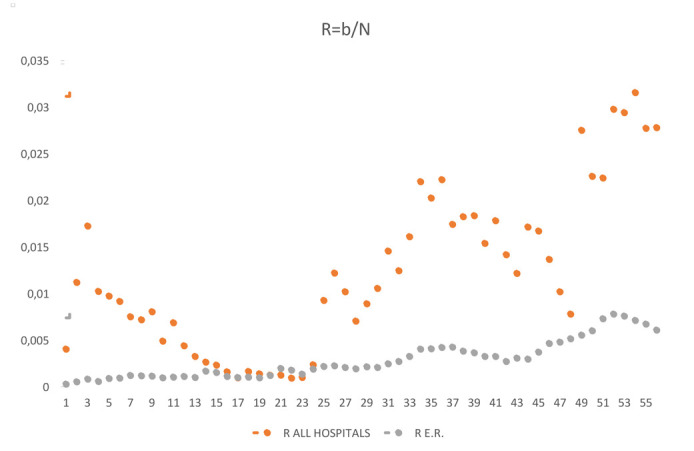
The trends of the proportion of positive RT-PCR tests over total tests (p) and of the prevalence of positive tests in the population (q) in both HCW and regional population are shown in Figures 1 and 2, respectively. The ratios between HCW and the regional populations (φ and ψ) are shown in Figures 3 and 4.
Figure 1.
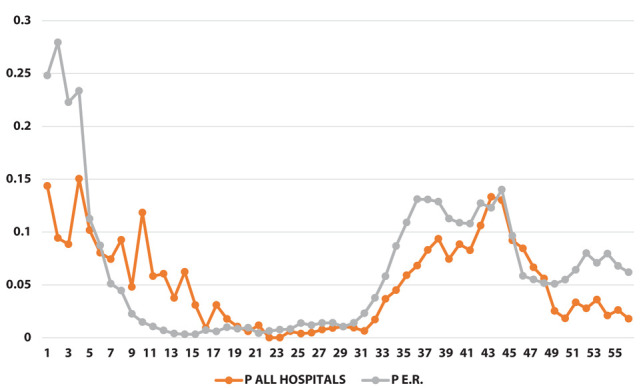
Proportion of positive swabs [p] (on the y-axis) as a function of weeks (on the x-axis)
Figure 2.
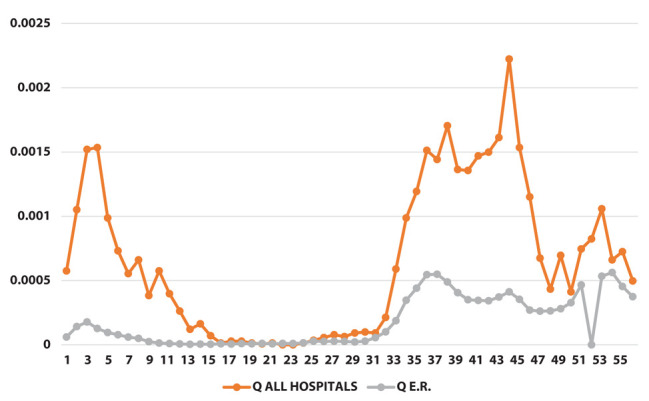
Positivity rate [q] (on the y-axis) as a function of weeks (on the x-axis)
Figure 3.
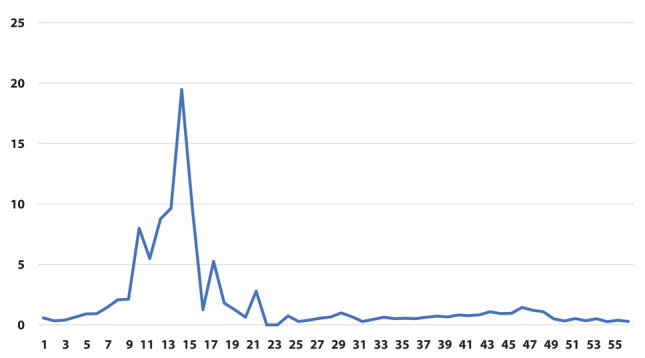
Ratio between proportion of positive swabs [φ] (on the y-axis) as a function of weeks (on the x-axis)
Figure 4.
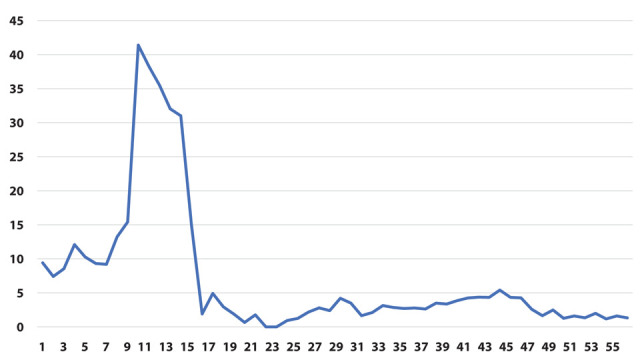
Ratio between positivity rate [ψ] (on the y-axis) as a function of weeks (on the x-axis)
The results of the joinpoint analysis are shown in Supplementary Table 1. Both φ and ψ ratio indicators show a similar pattern, with a sharp increase during the early phase of the pandemic, and a strong decrease at the end of the first wave around week 15. In both indicators there are no significant changes in the trend after week 25.
However, when we restricted the joinpoint analysis starting from week 26 (beginning of September 2020, i.e., excluding the first wave of the epidemic) we could observe a significant decrease for the ratio of prevalence of positive tests over total tests (indicator φ) starting from week 47 (end of January, slope=-0.29) and for the ratio of the prevalence of positive tests in the population (indicator ψ) starting from week 41 (end of December, slope=-0.23). (Table 2)
Table 2.
Slopes in Joinpoint Regression (week 26-56)
| 1 | 2 | 3 | 4 | 5 | 6 | |
|---|---|---|---|---|---|---|
| p (Hospitals)* | +33.05 (26-36) | +6.03 (36-44) | -15.62 (44-56) | / | / | / |
| p (E.R.)* | -5.53 (26-29) | +48.15 (29-35) | +0.48 (35-44) | -27.28 (44-47) | +7.45 (47-54) | -12.75 (54-56) |
| q (Hospitals)* | +54.10 (26-35) | +2.97 (35-45) | -36.42 (45-48) | +16.36 (48-53) | -19.17 (53-56) | / |
| q (E.R.)* | -10.05 (26-29) | +71.52 (29-35) | -5.05 (35-49) | +34.05 (49-52) | -10.37 (52-56) | / |
| Ratio p (φ) | +0.16 (26-29) | -0.19 (29-32) | +0.06 (32-47) | -0.29 (47-50) | -0.01 (50-56) | / |
| Ratio q (ψ) | +0.53 (26-29) | -0.63 (29-32) | +0.28 (32-41) | -0.23 (41-56) | / | / |
*values transformed into logarithms; p - Proportion of positive swabs; q - Positivity rate
Discussion
Between March 2020 and April 2021, each HCW from public hospitals in Bologna performed an average of 4.8 RT-PCR tests, with 5.4% overall positive results. As expected, the number of tests performed in the population of the region was lower (1.1 test/person), and the proportion of positive tests was higher (6.9%). While we were able to calculate that 14.8% of HCWs was tested positive at least once, we cannot provide a comparable number for the regional population.
Data on RT-PCR tests in the regional population are only available in aggregate form and it is not possible to link the results of multiple tests performed by the same individual; we therefore performed the analysis on aggregate data per week, under the assumption that it was unlikely that the same individual had tested positive more than once in the same week. Among multiple positive tests in the same HCW, 165 (3.18% of all positive tests) were performed in the same week; it is likely that in the regional population this percentage is even lower, due to the lower proportion of people being tested compared to HCWs. (Supplementary Figure 1)
While the trends in the general population have been previously reported, both for Emilia-Romagna region and for Italy at large, few reports have been published on prevalence of infection in HCWs. [13]
In an Italian HCWs seroprevalence study during the first wave of last spring, no differences in seropositivity were observed by sex, while older HCWs had higher positivity than other groups, and nurses had higher positivity compared to physicians, but not other HCWs (14).
In an American study, results indicate that vaccination can have a substantial impact on mitigating COVID-19 outbreaks, even with limited protection against infection (15).
In another American study SARS-CoV-2 cases occurred in 1.4% of HCWs given at least a first dose and 0.3% of HCWs given both vaccine doses; the results indicate a positive impact of COVID-19 vaccines on SARS-CoV-2 case rates (16).
The main result of our analysis is that pandemic spread among HCWs appears earlier than in the general population, but it otherwise appears to have comparable features (curve slope). Furthermore, the decline in infection among HCWs after vaccination is shown, that can be considered an indirect measure of the effectiveness of the anti-SarsCoV2 vaccine, and will likely occur also in the general population. Joinpoint regression demonstrated a clear effect of vaccination with decrease of the variable φ starting from week 47 (end of January, slope=-0.29) and of the variable ψ starting from week 41 (end of December, slope=-0.23) (Table 2). This analysis allows to demonstrate that the difference of the slopes before and after the change is significant.
There are several limitations to this study. First of all, for the data in the general population we relied on published data from government websites, and could not assess the validity of the datasets.
Secondly, we compared the data of HCW from the city of Bologna with those of the population of the whole region. The comparison might be inappropriate during the first wave of the epidemic, in which the distribution of infections was particularly high in areas of the regions outside Bologna. In addition, p and q indicators are influenced by rate of testing among HCWs and general population (accessibility of swab test was higher for HCWs). (Supplementary Figure 1)
The last issue is the lack of information on determinants of infection in the general population. Previous studies conducted among HCWs try to prove the effectiveness of the use of PPE, before the vaccination campaign; a multicentric study performed during spring 2020, showed no differences of infection risk in job titles, but a decline in risk with the use of surgical mask, with not additional protection by use filtering facepiece 2 or 3 (FFP2/FFP3) (13).
The main strength of our study lies in being able to have a large number of data: (i) population of HCWs is composed by 20,109 persons, while Emilia-Romagna residents are 4,474,292; (ii) the period of observation was long (56 weeks).
Conclusion
The main result of our analysis is that pandemic spread among HCWs appears earlier than in the general population, but it otherwise appears to have comparable features.
Furthermore, the decline in infection among HCWs after vaccination is demonstrated and it can be considered an indirect measure of the effectiveness of the anti-SarsCoV2 vaccine. Other studies are needed to define how long that effect will last.
Declarations:
Ethics approval and consent to participate. All methods were carried out in accordance with relevant guidelines and regulations. The study was reviewed and considered exempt by the Ethics Committee of the University of Bologna. Informed consent was not deemed necessary by the Ethics Committee of the University of Bologna.
Competing interest:
None to declare.
References
- 1.Cui J, Li F, Shi ZL. Origin and evolution of pathogenic coronaviruses. Nat Rev Microbiol. 2019;17:181–92. doi: 10.1038/s41579-018-0118-9. [DOI] [PMC free article] [PubMed] [Google Scholar]
- 2.Peckham R. COVID-19 and the anti-lessons of history. Lancet. 2020;395:850–2. doi: 10.1016/S0140-6736(20)30468-2. [DOI] [PMC free article] [PubMed] [Google Scholar]
- 3.Cong Y, Verlhac P, Reggiori F. The interaction between nidovirales and autophagy components. Viruses. 2017;9:182. doi: 10.3390/v9070182. [DOI] [PMC free article] [PubMed] [Google Scholar]
- 4.Abd El-Aziz TM, Stockand JD. Recent progress and challenges in drug development against COVID-19 coronavirus (SARS-CoV-2) - an update on the status. Infect Genet Evol. 2020;83:104327. doi: 10.1016/j.meegid.2020.104327. doi:10.1016/j.meegid.2020.104327. [DOI] [PMC free article] [PubMed] [Google Scholar]
- 5.Zhu N, Zhang D, Wang W, et al. China Novel Coronavirus Investigating and Research Team. A Novel Coronavirus from Patients with Pneumonia in China, 2019. N Engl J Med. 2020 Feb 20;382(8):727–733. doi: 10.1056/NEJMoa2001017. doi: 10.1056/NEJMoa2001017. Epub 2020 Jan 24. PMID: 31978945; PMCID: PMC7092803. [DOI] [PMC free article] [PubMed] [Google Scholar]
- 6.Ciotti M, Angeletti S, Minieri M, et al. COVID-19 Outbreak: An Overview. Chemotherapy. 2019;64(5-6):215–223. doi: 10.1159/000507423. doi: 10.1159/000507423. Epub 2020 Apr 7. PMID: 32259829; PMCID: PMC7179549. [DOI] [PMC free article] [PubMed] [Google Scholar]
- 7.World Health Organization. WHO Coronavirus (COVID-19) Dashboard. https://covid19.who.int. (last access on 4.27.2021)
- 8.Covian C, Retamal-Diaz A, Bueno SM, Kalergis AM. Could BCG vaccination induce protective trained immunity for SARS-CoV-2? Front. Immunol. 2020;11:970. doi: 10.3389/fimmu.2020.00970. [DOI] [PMC free article] [PubMed] [Google Scholar]
- 9.Trumello C, Bramanti SM, Ballarotto G, et al. Psychological Adjustment of Healthcare Workers in Italy during the COVID-19 Pandemic: Differences in Stress, Anxiety, Depression, Burnout, Secondary Trauma, and Compassion Satisfaction between Frontline and Non-Frontline Professionals. Int J Environ Res Public Health. 2020 Nov 12;17(22):8358. doi: 10.3390/ijerph17228358. doi: 10.3390/ijerph17228358. PMID: 33198084; PMCID: PMC7696387. [DOI] [PMC free article] [PubMed] [Google Scholar]
- 10. Ministero della Salute del Governo Italiano: Monitoraggio Covid-19 numero 50: https://www.salute.gov.it/portale/nuovocoronavirus/dettaglioNotizieNuovoCoronavirus.jsp?lingua=italiano&menu=notizie&p=dalministero&id=5465 , last access on 4.27.2021.
- 11.World Health Organization. Geneva, Switzerland: World Health Organization; 2020. Risk assessment and management of exposure of health care workers in the context of COVID-19: interim guidance, 19 March 2020. https://apps.who.int/iris/handle/10665/331496. [Google Scholar]
- 12.Kim HJ, Fay MP, Feuer EJ, Midthune DN. Permutation tests for joinpoint regression with applications to cancer rates. Stat Med. 2000;19:335–51. doi: 10.1002/(sici)1097-0258(20000215)19:3<335::aid-sim336>3.0.co;2-z. correction: Stat Med 2001;20:655. [DOI] [PubMed] [Google Scholar]
- 13.Boffetta P, Violante F, Durando P, et al. Working Group on SARS-CoV-2 Infection in Italian Healthcare Workers. Determinants of SARS-CoV-2 infection in Italian healthcare workers: a multicenter study. Sci Rep. 2021 Mar 11;11(1):5788. doi: 10.1038/s41598-021-85215-4. doi: 10.1038/s41598-021-85215-4. PMID: 33707646; PMCID: PMC7970984. [DOI] [PMC free article] [PubMed] [Google Scholar]
- 14.Visci G, Lodi V, Bonfiglioli R, et al. Serologic SARS-CoV-2 testing in healthcare workers with positive RT-PCR test or Covid-19 related symptoms. medRxiv. 2020.10.25.20219113; doi: https://doi.org/10.1101/2020.10.25.20219113 .
- 15.Moghadas SM, Vilches TN, Zhang K, et al. The impact of vaccination on COVID-19 outbreaks in the United States. Clin Infect Dis. 2021 Jan 30:ciab079. doi: 10.1093/cid/ciab079. doi: 10.1093/cid/ciab079. Epub ahead of print. PMID: 33515252; PMCID: PMC7929033. [DOI] [PMC free article] [PubMed] [Google Scholar]
- 16.Bouton TC, Lodi S, Turcinovic J, et al. COVID-19 vaccine impact on rates of SARS-CoV-2 cases and post vaccination strain sequences among healthcare workers at an urban academic medical center: a prospective cohort study. medRxiv [Preprint] 2021 Mar 31:2021.03.30.21254655. doi: 10.1101/2021.03.30.21254655. PMID: 33821283; PMCID: PMC8020984. [Google Scholar]
Associated Data
This section collects any data citations, data availability statements, or supplementary materials included in this article.
Supplementary Materials
Rate of making swabs (r)


