

Key Points
Question
Were there differences in returns to expected rates of US ambulatory care use between more vs less socioeconomically disadvantaged patients in the first year of the COVID-19 pandemic?
Findings
In this retrospective cohort study that included more than 14.5 million patients, there was an overall increase in the return to expected rates of use of 6 ambulatory care services between March 2020 and February 2021. This increase was significantly lower for patients with Medicaid or those with Medicaid-Medicare dual eligibility than for those with commercial, Medicare Advantage, or Medicare fee-for-service.
Meaning
As the pandemic progressed through early 2021, there remained significant differences by insurance type in the return to expected rates in the use of 6 ambulatory services.
Abstract
Importance
Following reductions in US ambulatory care early in the pandemic, it remains unclear whether care consistently returned to expected rates across insurance types and services.
Objective
To assess whether patients with Medicaid or Medicare-Medicaid dual eligibility had significantly lower than expected return to use of ambulatory care rates than patients with commercial, Medicare Advantage, or Medicare fee-for-service insurance.
Design, Setting, and Participants
In this retrospective cohort study examining ambulatory care service patterns from January 1, 2019, through February 28, 2021, claims data from multiple US payers were combined using the Milliman MedInsight research database. Using a difference-in-differences design, the extent to which utilization during the pandemic differed from expected rates had the pandemic not occurred was estimated. Changes in utilization rates between January and February 2020 and each subsequent 2-month time frame during the pandemic were compared with the changes in the corresponding months from the year prior. Age- and sex-adjusted Poisson regression models of monthly utilization counts were used, offsetting for total patient-months and stratifying by service and insurance type.
Exposures
Patients with Medicaid or Medicare-Medicaid dual eligibility compared with patients with commercial, Medicare Advantage, or Medicare fee-for-service insurance, respectively.
Main Outcomes and Measures
Utilization rates per 100 people for 6 services: emergency department, office and urgent care, behavioral health, screening colonoscopies, screening mammograms, and contraception counseling or HIV screening.
Results
More than 14.5 million US adults were included (mean age, 52.7 years; 54.9% women). In the March-April 2020 time frame, the combined use of 6 ambulatory services declined to 67.0% (95% CI, 66.9%-67.1%) of expected rates, but returned to 96.7% (95% CI, 96.6%-96.8%) of expected rates by the November-December 2020 time frame. During the second COVID-19 wave in the January-February 2021 time frame, overall utilization again declined to 86.2% (95% CI, 86.1%-86.3%) of expected rates, with colonoscopy remaining at 65.0% (95% CI, 64.1%-65.9%) and mammography at 79.2% (95% CI, 78.5%-79.8%) of expected rates. By the January-February 2021 time frame, overall utilization returned to expected rates as follows: patients with Medicaid at 78.4% (95% CI, 78.2%-78.7%), Medicare-Medicaid dual eligibility at 73.3% (95% CI, 72.8%-73.8%), commercial at 90.7% (95% CI, 90.5%-90.9%), Medicare Advantage at 83.2% (95% CI, 81.7%-82.2%), and Medicare fee-for-service at 82.0% (95% CI, 81.7%-82.2%; P < .001; comparing return to expected utilization rates among patients with Medicaid and Medicare-Medicaid dual eligibility, respectively, with each of the other insurance types).
Conclusions and Relevance
Between March 2020 and February 2021, aggregate use of 6 ambulatory care services increased after the preceding decrease in utilization that followed the onset of the COVID-19 pandemic. However, the rate of increase in use of these ambulatory care services was significantly lower for participants with Medicaid or Medicare-Medicaid dual eligibility than for those insured by commercial, Medicare Advantage, or Medicare fee-for-service.
This retrospective study compares ambulatory care patterns before and in the first year of the COVID-19 pandemic among patients insured by public and private insurance programs.
Introduction
US ambulatory care was disrupted soon after the onset of the COVID-19 pandemic. Early in the pandemic, clinics closed for fear of transmission of SARS-CoV-2 and because the US government recommended deferral of unnecessary and nonemergency care.1 Declines in ambulatory visits soon followed.2 These reductions in visits allowed health systems and practices to concentrate on infection control and surge capacity. However, early pandemic delays or discontinuities in receipt of evidence-based preventive and behavioral health services may result in the development of more advanced or terminal disease states.3,4,5,6
Multiple studies7,8,9,10,11,12 reported that ambulatory care visits sharply declined early in the pandemic, including emergency department (ED), office and urgent care visits, behavioral health services, and preventive screening, and were followed by increases in telemedicine. By late 2020, ambulatory care utilization had nearly reached prepandemic levels.2,13,14 During the pandemic, widespread inequities in access to care were documented among racial and ethic minority groups.7,10 It remains unclear to what degree emergency and nonemergency ambulatory care utilization, including evidence-based preventive services, declined and returned to expected rates across diverse groups.
In this study, ambulatory care patterns during the COVID-19 pandemic were assessed using a national database, which includes patients with Medicaid and Medicare-Medicaid dual eligibility and commercial, Medicare Advantage, and Medicare fee-for-service insurance. Considering the multiple long-standing socioeconomic and systemic barriers to accessing care among patients with Medicaid or Medicaid-Medicare dual eligibility,15 ambulatory care use was hypothesized to recover the least among patients with Medicaid or Medicare-Medicaid dual eligibility compared with those with Medicare advantage or Medicare fee-for-service insurance.
Methods
This retrospective cohort study used the Milliman Near-time MedInsight Emerging Experience Research Database (MedInsight) to assess ambulatory care patterns among patients 18 years or older across all 50 US states from January 1, 2019, through February 28, 2021. The institutional review board of the University of California, Los Angeles, determined that this analysis of deidentified aggregated data was exempt from review, and participant consent was waived.
Data Source and Study Population
The database provided data warehousing, analytics, and benchmarks to health care organizations for 132 million patients, approximately 40% of the US population or 44% of those with health insurance in 2019.16 Health care organizations purchase services to clean, organize, or facilitate analysis of their health care claims data. Some organizations’ data use agreements with the research database allow for claims data contributions to research, while others prohibit it. Those whose data use agreements allowed for claims data contributions to research included a subset of participating health insurance companies and health systems, the latter comprising networks of hospitals, physician practice groups, or both. To avoid risks associated with breaches of confidentiality, Milliman MedInsight was prohibited from providing detailed or potentially identifying information regarding these health care organizations. To provide context for the representativeness of the health care organizations that contribute data to the research database, the total number of unique licensed individual clinicians and unique health care facilities as identified by national provider identification codes are presented in eFigure 1 in the Supplement.17
The research database reflects a convenience sample of health care organizations that consented to provide their deidentified enrollment and claims data from 2017 through 2021 for research purposes. Using this database, care patterns were tracked during the COVID-19 pandemic.18 The primary analysis cohort used professional outpatient claims data from 61 health care organizations, which contributed data from health care services for adult patients from January 1, 2019, through February 28, 2021. To allow time to process claims data for care that occurred as late as February 28, 2021, data were included from claims paid through July 31, 2021. The primary analysis cohort included 26 cross-sectional cohorts with one cross-section per month, and each cross-section requiring 12 or more prior months of continuous enrollment (eFigure 2 in the Supplement). For example, the January 2019 primary analysis cohort included patients continuously enrolled for at least 12 months prior to January 2019. Data from these 26 one-month blocks were analyzed in 13 two-month time frames.
Outcomes
Ambulatory use rates per 100 patient-months were categorized from January 2019 through February 2021 for 6 major service types: (1) ED (regardless of associated hospitalization), (2) office and urgent care visits, (3) behavioral health services such as individual psychotherapy or behavioral health counseling, (4) screening colonoscopies, (5) screening mammograms, and (6) contraception counseling or HIV screening. The US Preventive Services Task Force Grade A and B 202019 recommendations and US Health and Resources Services and Administration (HRSA) Women’s Preventive Services20 recommendations were adapted to study evidence-based preventive care. Overall ambulatory utilization was assessed by combining data from all 6 services, with each service receiving an equal weight (of 1) for each 2-month time frame.
Results were stratified by use of telemedicine (including telephone, video, and eVisits) by assessing ambulatory visits containing telemedicine visit codes and Healthcare Common Procedure Coding System codes for outpatient visits, based on guidelines published by Centers for Medicare & Medicaid Services (CMS), Medicaid, and multiple private insurers (see eMethods in the Supplement).21,22,23,24
Statistical Analyses
Using a difference-in-differences design, the extent to which utilization rates during the pandemic differed from expected rates had the pandemic not occurred was estimated. To estimate the effects of the pandemic while accounting for typical seasonal variations in utilization patterns, pandemic time frames were compared with prepandemic control time frames in terms of changes in utilization rates between the 2-month January-February 2020 time frame, and each of 6 subsequent 2-month time frames: March-April, May-June, July-August, September-October, November-December, and January-February 2021. These were then compared with the changes in the corresponding months from the year prior.
Age- and sex-adjusted Poisson regression models of the monthly aggregated utilization counts were used to offset the total number of patients per month; utilization was stratified by insurance type and by service type: telemedicine or in-person. Pandemic-associated utilization rates were summarized in terms of the ratio of rate ratios, derived from difference-in-differences estimated on the log-utilization rate. This metric is interpretable as the proportion of expected pandemic-associated utilization rates that were observed, assuming pandemic-associated utilization trends would have paralleled prepandemic trends in the absence of the pandemic. When stratifying by insurance groups, comparisons of observed vs expected trends were restricted to each corresponding insurance group’s data (eg, observed rates during the pandemic among patients with Medicaid were only compared with prepandemic expected rates among patients with Medicaid, etc).
Pairwise comparisons of the ratio of rate ratios for the aggregate use of 6 ambulatory services among patients with Medicaid and Medicare-Medicaid dual-eligibility were made between patients with each other insurance type (commercial, Medicare Advantage, and Medicare fee-for-service insurance) using a 2-sided .05 significance level to assess whether care returned to expected rates by the final January-February 2021 study time frame. These stratified analyses were then further stratified by all 6 ambulatory services. To address multiple testing, the Benjamini-Hochberg step-up procedure was applied to control the false-discovery rate in each set of stratified analyses at the 5% level.25
There were 4 types of missing data to consider: missing variable information, health care organizations that did not contribute to the research database, lags in claims adjudication and processing, and patients dropping out of the cohort over time. Missing variable information included demographic data such as age, sex, and region, with missing values in less than 1% of patients. Patients with missing demographic information were included in the analysis. Among health care organizations that did not contribute data, 2019 demographic and regional distributions among patients included in the research database were similar to patients not included. Both the included and not-included groups were similar to nationally representative demographic and regional distributions from the 2019 American Community Survey16 (see eFigures 3, 4, and 5 in the Supplement). Regarding lags in claims processing, sensitivity analyses revealed that 97.9% of claims were adjudicated and processed at the time of this analysis. These issues are described further in the Supplement and cohort tree (eMethods, eTables 1 and 2, and eFigure 1, which presents a cohort tree).16 Participant dropout in the primary analysis cohort was addressed in the sensitivity analyses.
Sensitivity Analyses
Several assumptions were made in this analysis. First, we assumed a relatively stable cohort of individuals over time. To address the problem of job losses leading to an unstable cohort of individuals over time related to coverage disruptions,26,27 2 additional prespecified cohorts were created (eFigure 2 in the Supplement). A noncontinuously enrolled cohort included consecutive cross-sectional cohorts corresponding to the January 2019-February 2021 time frame, the 26-month-long observation period. This cohort included individuals with disruptions in insurance coverage and was restricted to individuals who did not meet criteria for continuous enrollment in the previous 12-month period (which was required for the primary analysis cohort). A fully enrolled cohort addressed the additional and separate problem of additions of newly insured patients over time and included all patients continuously enrolled from January 2019 through February 2021 and did not allow any new patients to enter the cohort after January 2019. Utilization trends were evaluated in both the noncontinuously enrolled and fully enrolled cohorts to assess whether utilization trends differed from the continuously enrolled primary analysis cohort.
Second, 2019 utilization rates were assumed to be reasonable counterfactual control rates for 2020 had the pandemic not occurred. We concluded that this assumption was plausible after visually comparing trends between 2018 and 2019 (Figure 1 and eFigure 7 in the Supplement) and tested this assumption using a placebo test for parallel trends (eTable 3 in the Supplement). This involved estimating the ratio of rate ratios for all 2-month periods from the March-April 2019 through the January-February 2020 time frames, following the same methods used for the March-April 2020 through the January-February 2021 time frames, using data from 2018 rather than 2019 as a baseline. Placebo test ratio of rate ratios that differed significantly from 1 would indicate that prepandemic trends were not strictly parallel.
Figure 1. Unadjusted Overall Utilization per 100 Patients.

The primary analysis cohort consisted of 26 cross-sectional cohorts with 1 cross-section per month, each cross-section requiring at least 12 prior months of continuous enrollment. For example, the January 2019 primary analysis cohort included patients continuously enrolled for at least 12 months prior to January 2019. The noncontinuously enrolled cohort included individuals with disruptions in insurance coverage and was restricted to individuals who did not meet criteria for inclusion in the primary analysis cohort. A fully enrolled cohort included patients continuously enrolled from January 2019 through February 2021 but did not allow new patients after January 2019.
Individuals not in the fully or continuously enrolled cohorts but included in 1 of the groups contributing data to the research database are included in the noncontinuously enrolled cohort, many of whom experienced periods with no health insurance. This is consistent with the graph demonstrating their utilization rates are at a level lower than for the fully and continuously enrolled cohorts.
WHO indicates World Health Organization.
Third, given prior literature and Medicaid’s low income and/or disability requirements, Medicaid and Medicare-Medicaid dual eligibility were assumed to be reasonable proxies for socioeconomic disadvantage, consistent with methods used by CMS.15,28,29,30
Fourth, these analyses also assumed uniform trends nationally. To mitigate concerns about geographic variation in COVID-19 surges and clinicians’ responses, we stratified by and adjusted for Northeast, Midwest, South, and West US census regions in the regression model for the primary analysis cohort to assess whether this sensitivity analysis differed from our main findings.
All statistical analyses were performed at UCLA using R version 3.6.2 (http://www.r-project.org/) between November 8 and December 9, 2021.
Results
More than 14.5 million adults were identified in the primary analysis cohort, with mean age of 52.7 years and including 54.9% women in the years 2019 through 2021 (Table). The distribution of 162 533 375 ambulatory services between January 1, 2019, and February 28, 2021, included 3 visit-based services: ED (7.1%), office and urgent care visits (67.2%), and behavioral health services (12.0%), and 3 types of preventive services: screening colonoscopies (0.96%), screening mammograms (3.2%), and contraception counseling or HIV screening (9.5%). Figure 1 shows unadjusted utilization patterns stratified by cohort type. Although absolute values vary, utilization trends appeared similar across cohorts. They all demonstrated an initial rapid decline followed by a return to expected rates, then followed by a secondary decline associated with the second COVID-19 wave in late 2020 through early 2021.
Table. Unadjusted Demographic and Insurance Characteristic Trends in the Primary Analysis of 14 505 945 Patients.
| Characteristic | 2019 | 2020 | 2021 | ||||||||||
|---|---|---|---|---|---|---|---|---|---|---|---|---|---|
| Jan-Feb | Mar-Apr | May-Jun | Jul-Aug | Sept-Oct | Nov-Dec | Jan-Feb | Mar-Apr | May-Jun | Jul-Aug | Sept-Oct | Nov-Dec | Jan-Feb | |
| Average age (SD) | 53.3 (19.4) | 53.2 (19.4) | 53.2 (19.4) | 53.2 (19.4) | 53.0 (19.3) | 52.9 (19.3) | 52.9 (19.3) | 52.9 (19.3) | 52.7 (19.4) | 52.5 (19.4) | 52.3 (19.4) | 52.1 (19.4) | 51.6 (19.4) |
| Age bands, y (%) | |||||||||||||
| 18-39 | 27.9 | 28.0 | 28.1 | 28.1 | 28.5 | 28.6 | 28.6 | 28.7 | 29.0 | 29.4 | 29.9 | 30.4 | 31.2 |
| 40-64 | 39.8 | 39.9 | 39.8 | 39.7 | 39.9 | 40.0 | 39.9 | 39.8 | 39.7 | 39.4 | 39.3 | 39.3 | 39.6 |
| 65-79 | 23.5 | 23.4 | 23.4 | 23.5 | 23.2 | 23.0 | 23.1 | 23.2 | 23.1 | 22.9 | 22.7 | 22.4 | 21.8 |
| ≥80 | 8.8 | 8.7 | 8.7 | 8.7 | 8.5 | 8.4 | 8.4 | 8.4 | 8.3 | 8.2 | 8.1 | 7.9 | 7.5 |
| Sex (%) | |||||||||||||
| Women | 54.9 | 54.9 | 55.0 | 55.0 | 55.0 | 54.9 | 54.9 | 54.9 | 54.9 | 54.9 | 55.0 | 54.9 | 54.9 |
| Men | 45.1 | 45.1 | 45.0 | 45.0 | 45.0 | 45.1 | 45.1 | 45.1 | 45.1 | 45.1 | 45.0 | 45.1 | 45.1 |
| Insurance type (%) | |||||||||||||
| Commercial | 54.7 | 54.7 | 54.8 | 54.6 | 55.2 | 56.0 | 55.6 | 55.2 | 54.5 | 54.5 | 54.2 | 54.3 | 54.2 |
| Medicare fee-for-service | 15.2 | 14.9 | 14.8 | 14.9 | 14.1 | 13.6 | 13.0 | 12.8 | 12.4 | 12.3 | 12.1 | 11.6 | 10.9 |
| Medicare Advantage | 13.8 | 13.9 | 13.8 | 13.9 | 13.9 | 13.7 | 14.2 | 14.3 | 14.2 | 14.1 | 14.0 | 13.8 | 13.5 |
| Medicaid | 13.2 | 13.5 | 13.4 | 13.4 | 13.6 | 13.4 | 14.0 | 14.2 | 14.8 | 15.5 | 16.2 | 16.6 | 17.8 |
| Dual eligibility | 2.6 | 2.6 | 2.5 | 2.5 | 2.5 | 2.5 | 2.5 | 2.5 | 2.5 | 2.5 | 2.5 | 2.4 | 2.4 |
| Total monthly patientsa | 9 676 155 | 9 666 503 | 9 687 790 | 9 670 617 | 9 555 191 | 9 803 434 | 9 483 684 | 9 407 727 | 9 464 188 | 9 567 324 | 9 697 328 | 10 056 183 | 9 927 930 |
Total monthly patients represent the average number of patients in the primary analysis cohort for each 2-month time frame. Note patients with Medicaid increase over time, associated with a small decrease in average age and small increase in total patients included in the primary analysis cohort during 2020. This observed rise in patients with Medicaid during the pandemic is consistent with other studies.27
At the onset of the pandemic in March and April 2020, the aggregate of 6 ambulatory services declined to 67.0% (95% CI, 66.9%-67.1%) of expected rates. By the November-December 2020 time frame, care returned to 96.7% (95% CI, 96.6%-96.8%) of expected rates. By the January-February 2021 time frame, however, utilization of services associated with the second wave of the COVID-19 pandemic again declined to 86.2% (95% CI, 86.1%-86.3%) of expected rates. Returns to expected rates of screening services, which require in-person contact, were 65% (95% CI, 64.1%-65.9%) for screening colonoscopies and 79.2% (95% CI, 78.5%-79.8%) for screening mammograms in the January-February 2021 time frame (Figure 2).
Figure 2. Ratio of Rate Ratios of Service Types Among 14 505 945 Patients in the Primary Analysis Cohort.
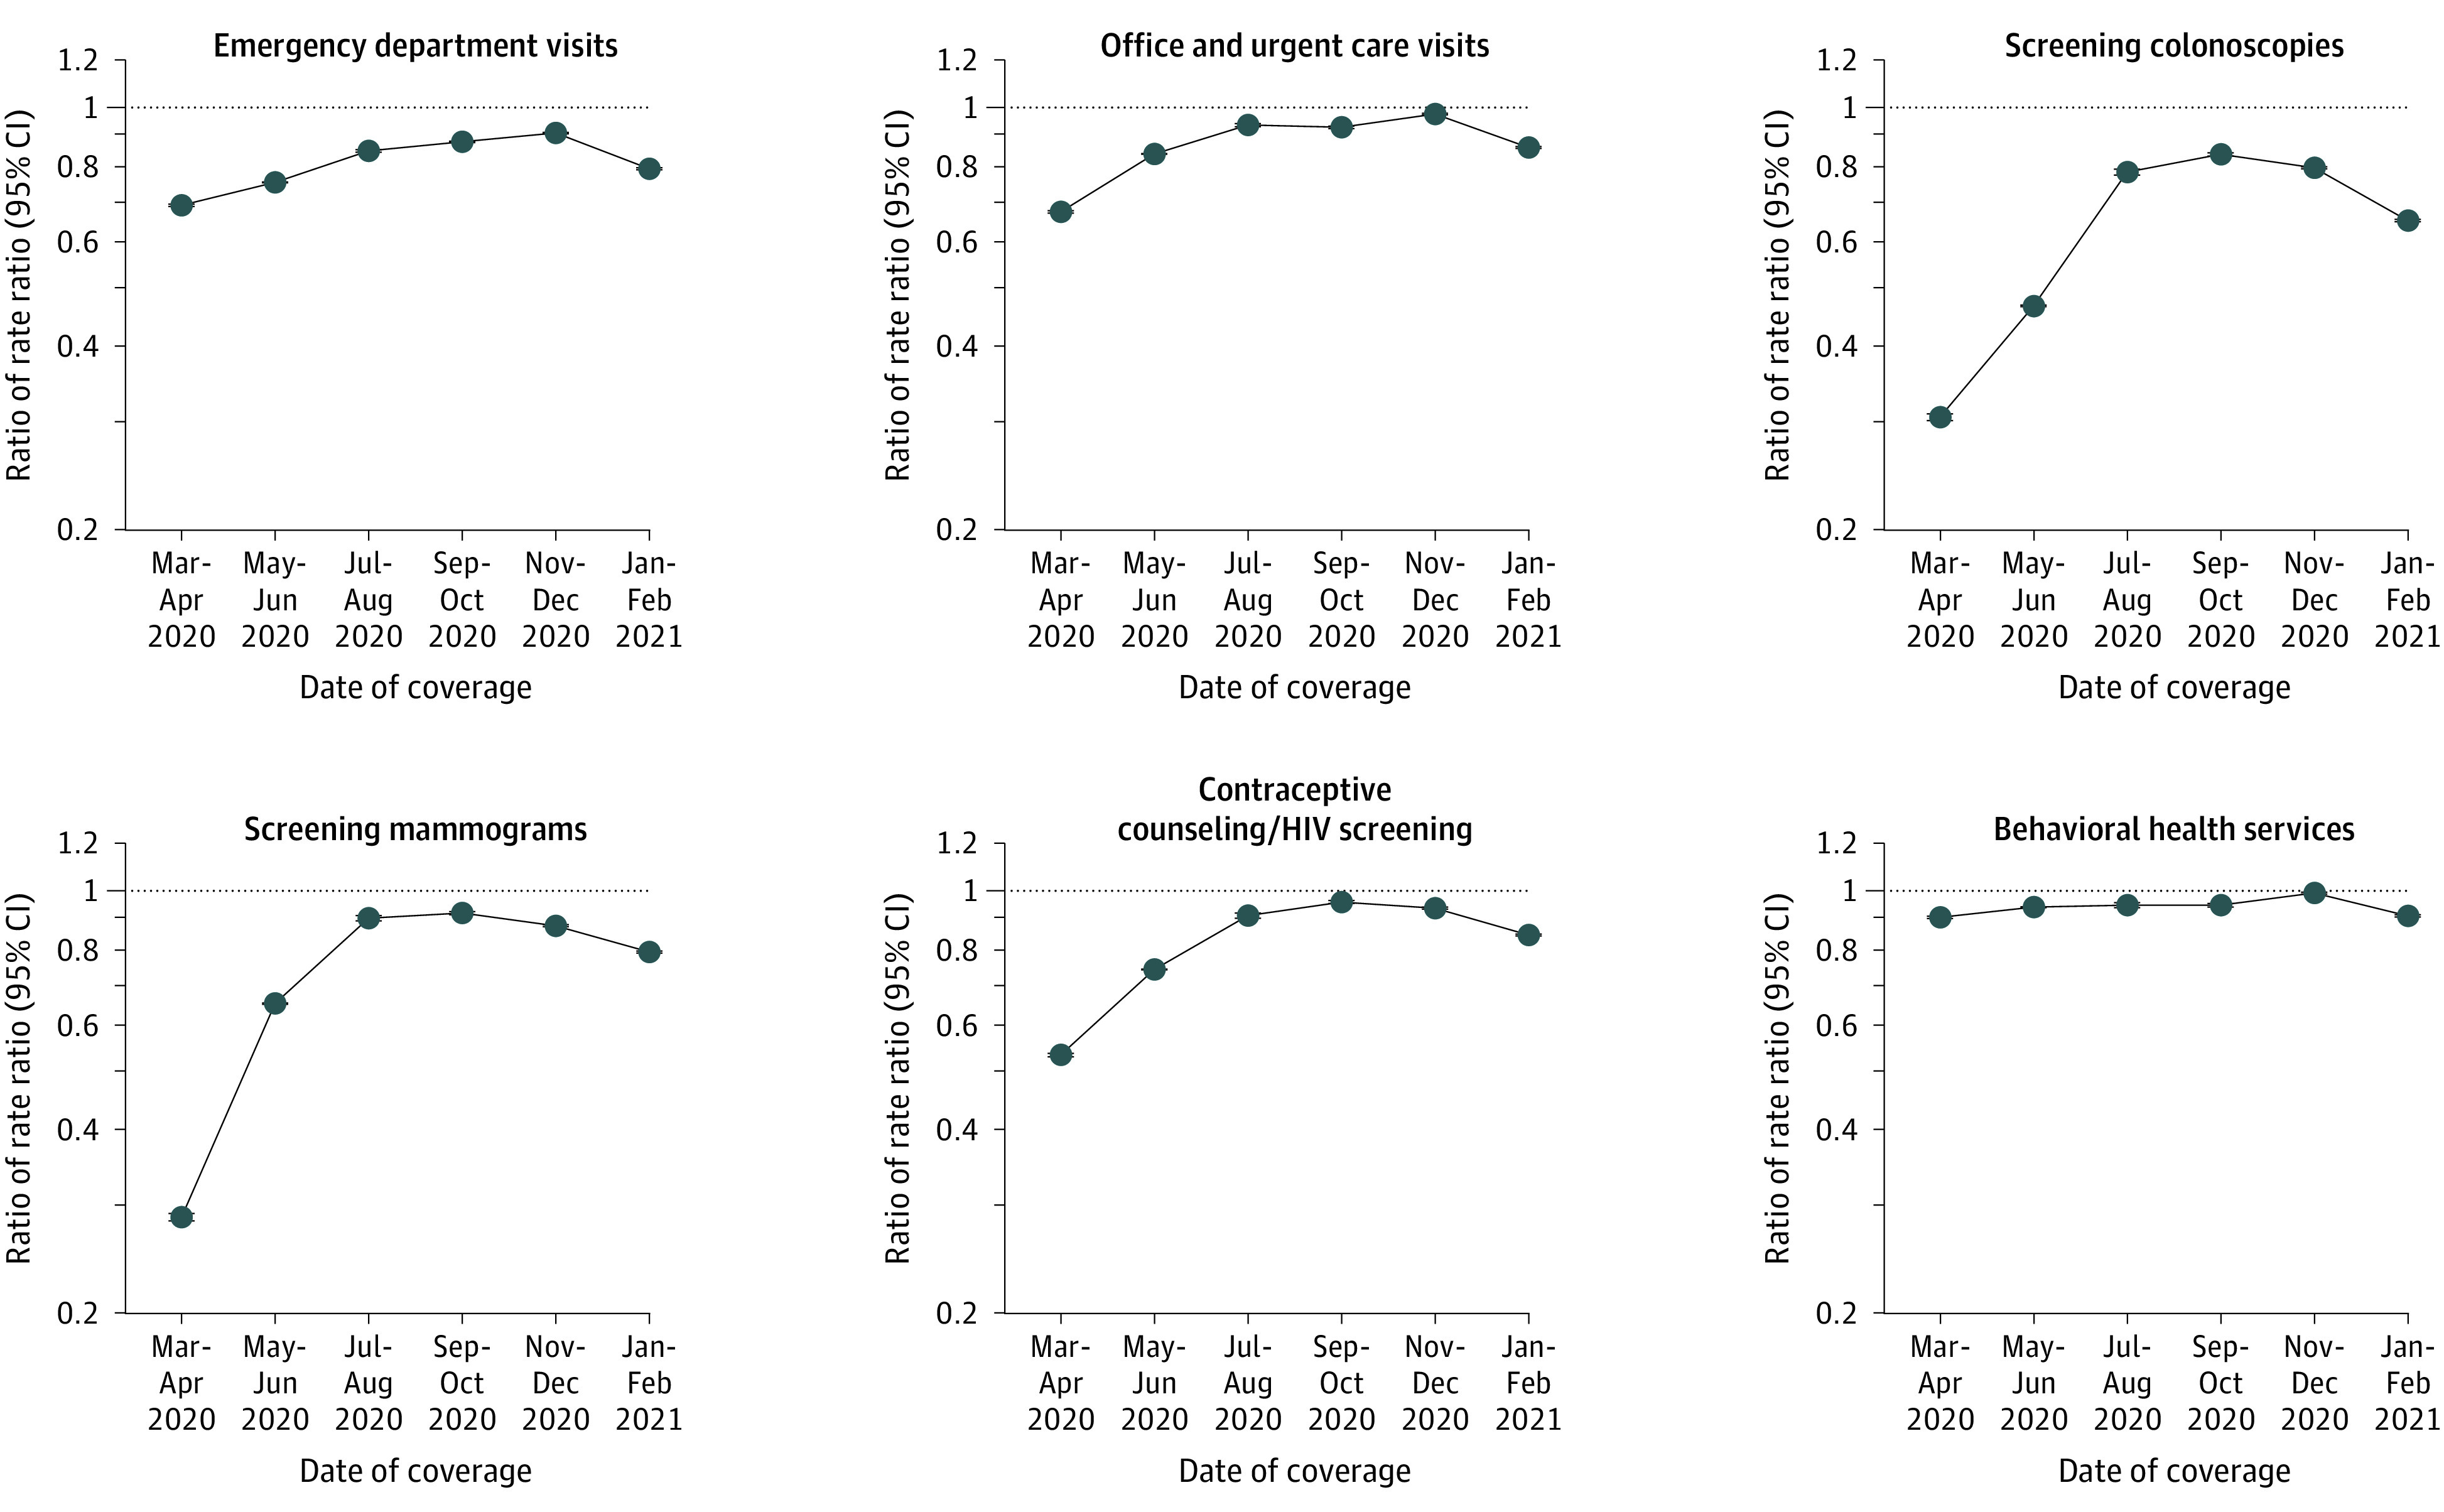
See the Methods section for an explanation of the difference-in-differences design for determining utilization rate differences from before the pandemic to during the pandemic, using age- and sex-adjusted Poisson regression models. Utilization effects of the pandemic were summarized in terms of the ratio of rate ratios, derived from difference-in-differences estimated on the log-utilization rate. This metric was interpretable as the proportion of expected pandemic-associated utilization rates that were actually observed, assuming that pandemic-associated utilization trends would have paralleled prepandemic trends in the absence of the pandemic.
Although the y-axes numerical labels are the actual ratio of rate ratios, they are plotted on a log scale. The dotted line indicates a reference point for the ratio of rate ratios, consistent with situations in which observed utilization, matches the expected levels had the pandemic not occurred; error bars, 95% CIs.
Telemedicine vs In-Person Services
Compared with expected rates, overall observed telemedicine-use rates peaked in the May-June 2020 time frame, with substantial variations by patient insurance group, ranging from ratio of rate ratios of 45.2 (95% CI, 44.0-46.5) among commercially insured patients to 265.7 (95% CI, 244.6-288.6) among patients with Medicare fee-for-service (Figure 2). All measured services (telemedicine plus in-person care) peaked at 96.7% (95% CI, 96.6%-96.8%) of expected rates in the November-December 2020 time frame. By the January-February 2021 time frame, utilization of all measured services had recovered least among patients with Medicaid and Medicare-Medicaid dual-eligibility compared with those with each of the other insurance types (Figure 3): Medicaid, 78.4% (95% CI, 78.2%-78.7%); Medicare-Medicaid dual-eligibility, 73.3% (95% CI, 72.8%-73.8%); commercial, 90.7% (95% CI, 90.5%-90.9%); Medicare Advantage, 83.2% (95% CI, 83.0%-83.5%); and Medicare fee-for-service, 82.0% (95% CI, 81.7%-82.2%; P < .001 comparing Medicaid or Medicare-Medicaid dual-eligibility with commercial, Medicare Advantage, or Medicare fee-for-service insurance).
Figure 3. Ratio of Rate Ratios of Overall Utilization of Telemedicine and Overall Services (Telemedicine Plus In-Person Services) Among 14 505 945 Patients in the Primary Analysis .
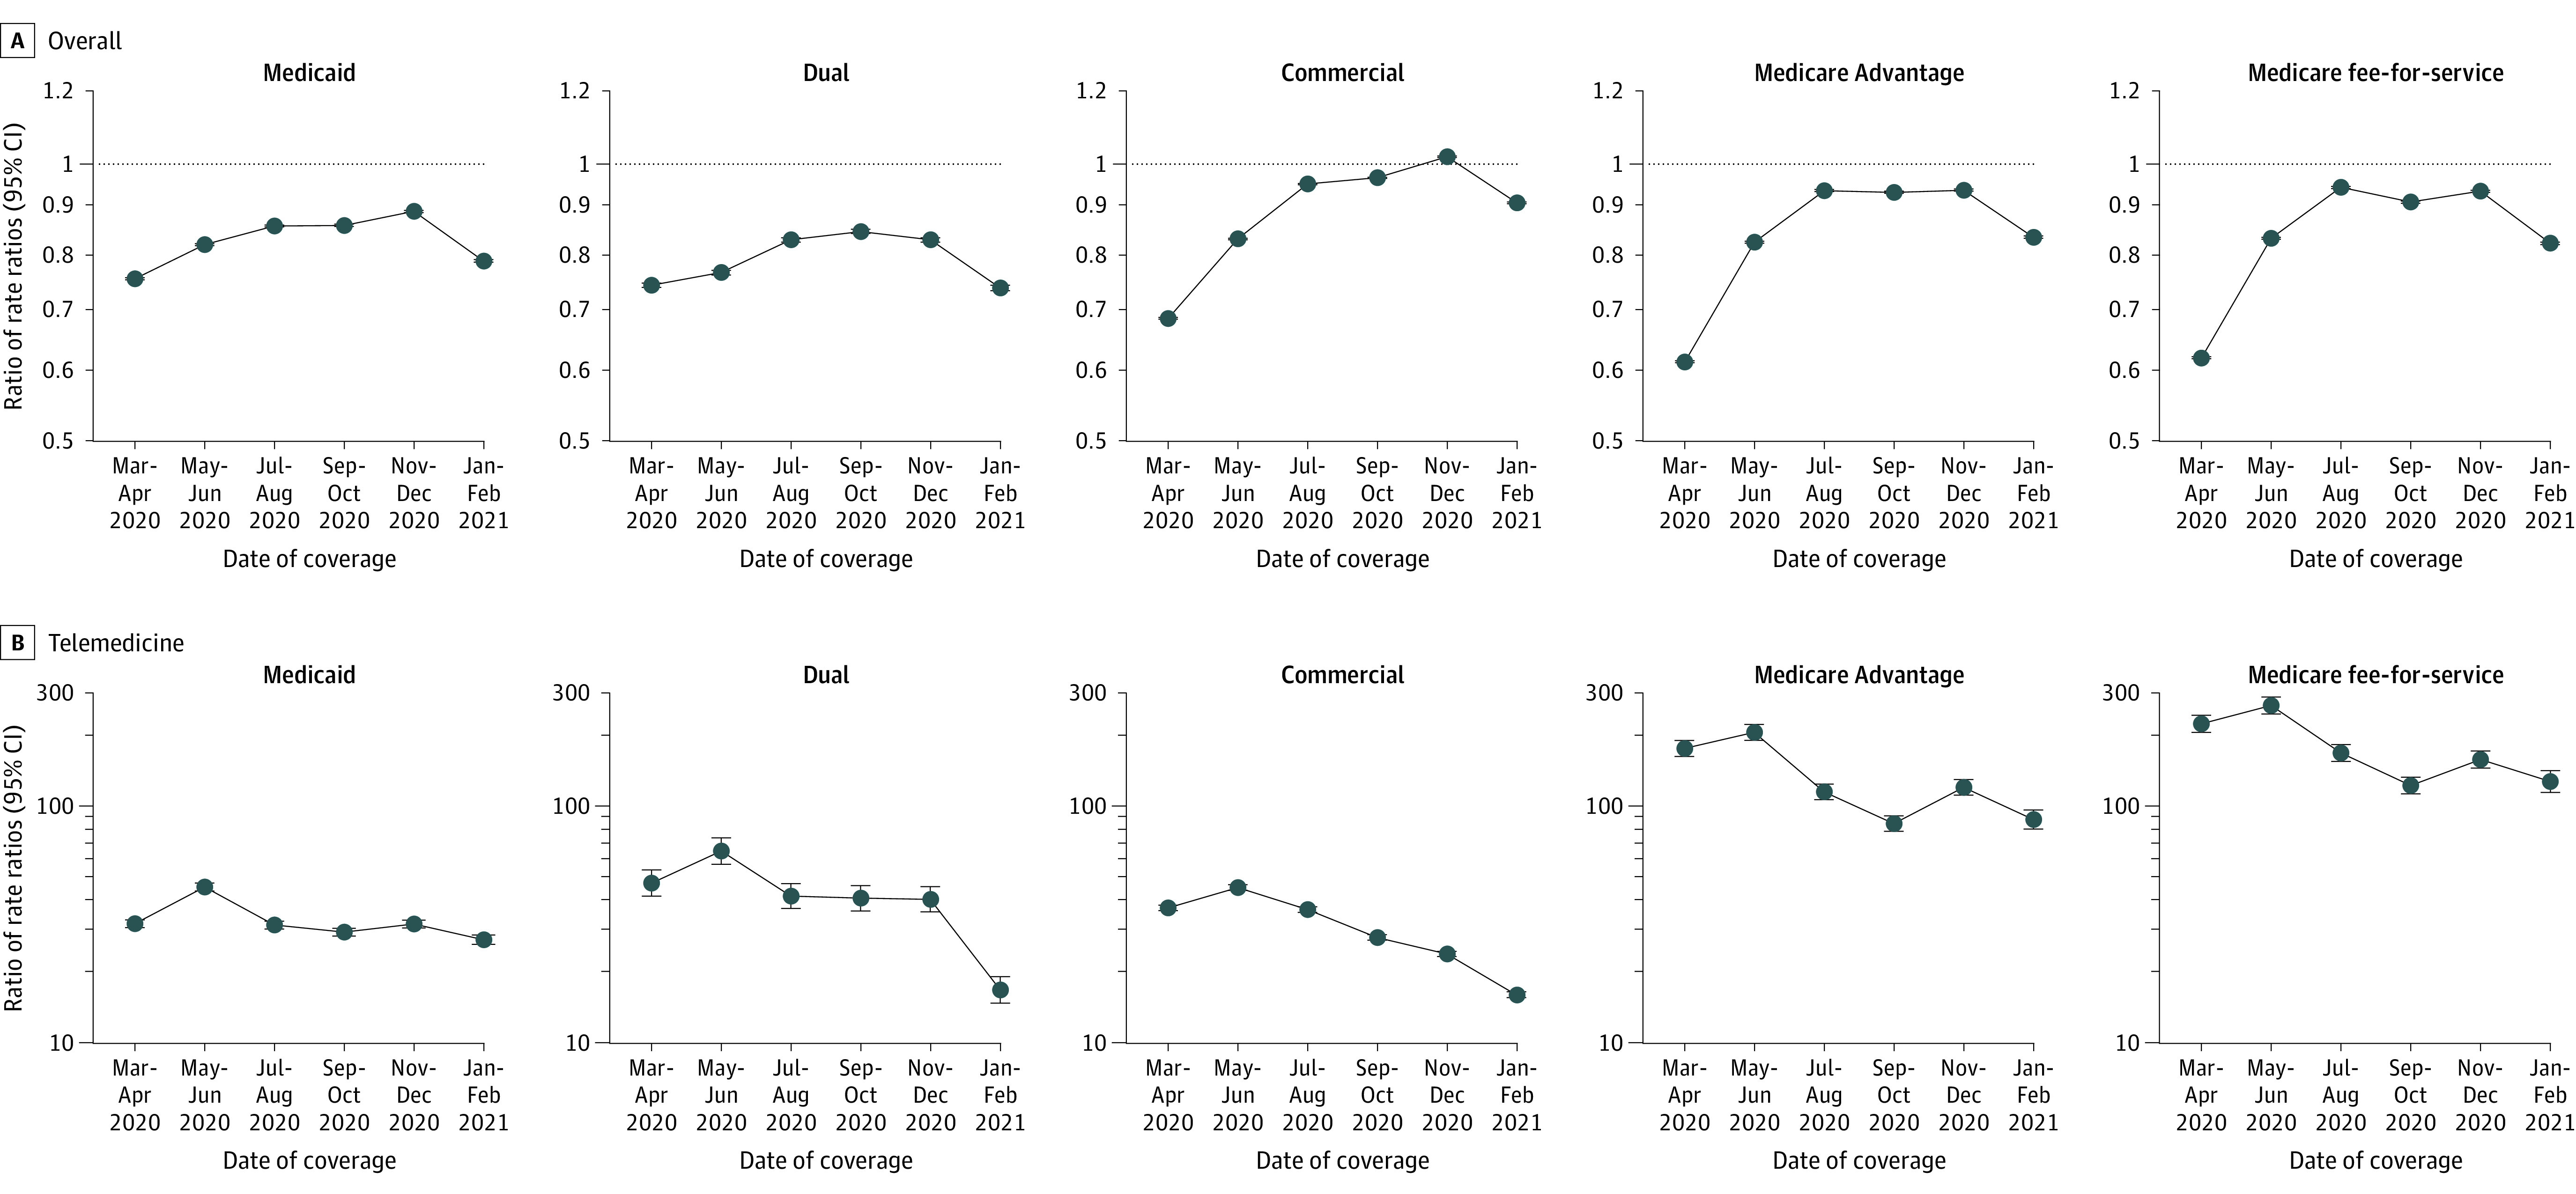
See the Figure 2 legend for a general explanation. Dual indicates Medicare-Medicaid dual eligibility.
Variation Across Service and Insurance Type
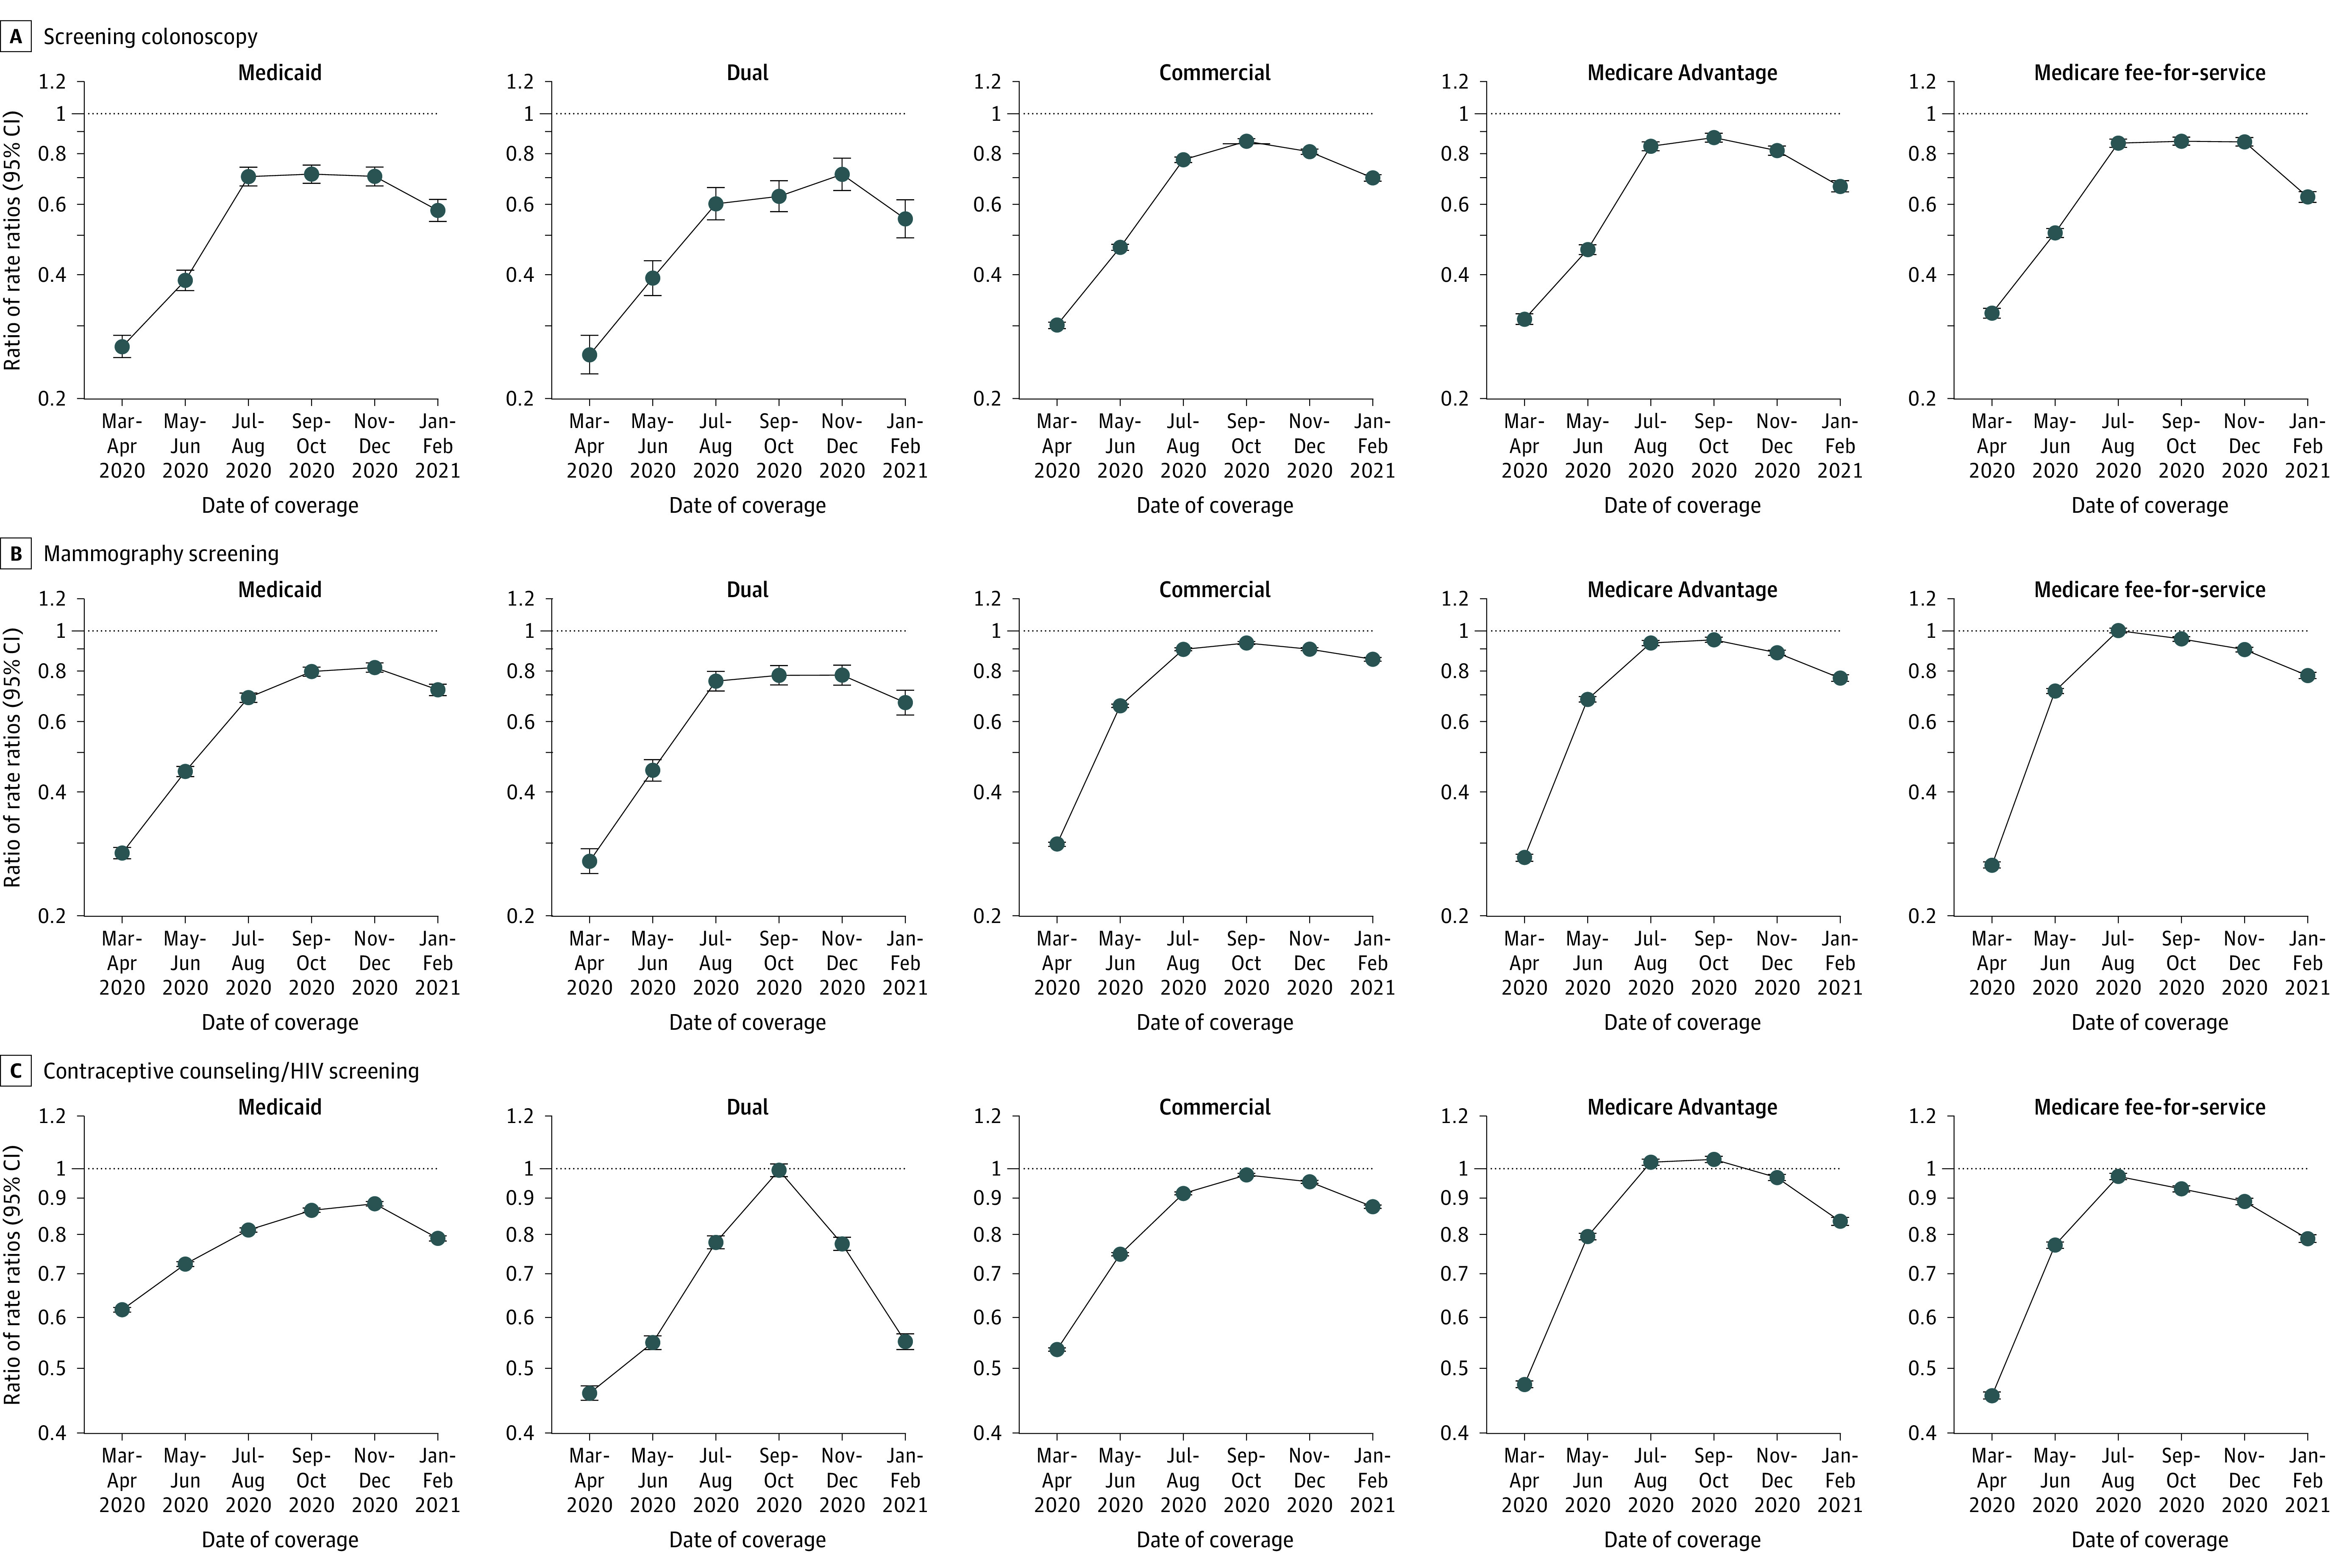
Comparisons of Medicaid and Medicare-Medicaid dual-eligibility to each of the other insurance types were statistically significant for 29 of 36 comparisons of individual ambulatory services. Comparisons of Medicaid vs Medicare Advantage for screening (colonoscopy and mammography) and of Medicaid vs Medicare fee-for-service for all 3 screening services (colonoscopy, mammography, and contraceptive counseling or HIV screening) were not statistically significant (Figure 3, Figure 4, and Figure 5 and in the Supplement).
Figure 4. Ratio of Rate Ratios of Utilization of Office and Urgent Care, Emergency Department, and Behavioral Health Services Among 14 505 945 Patients in the Primary Analysis Cohort.
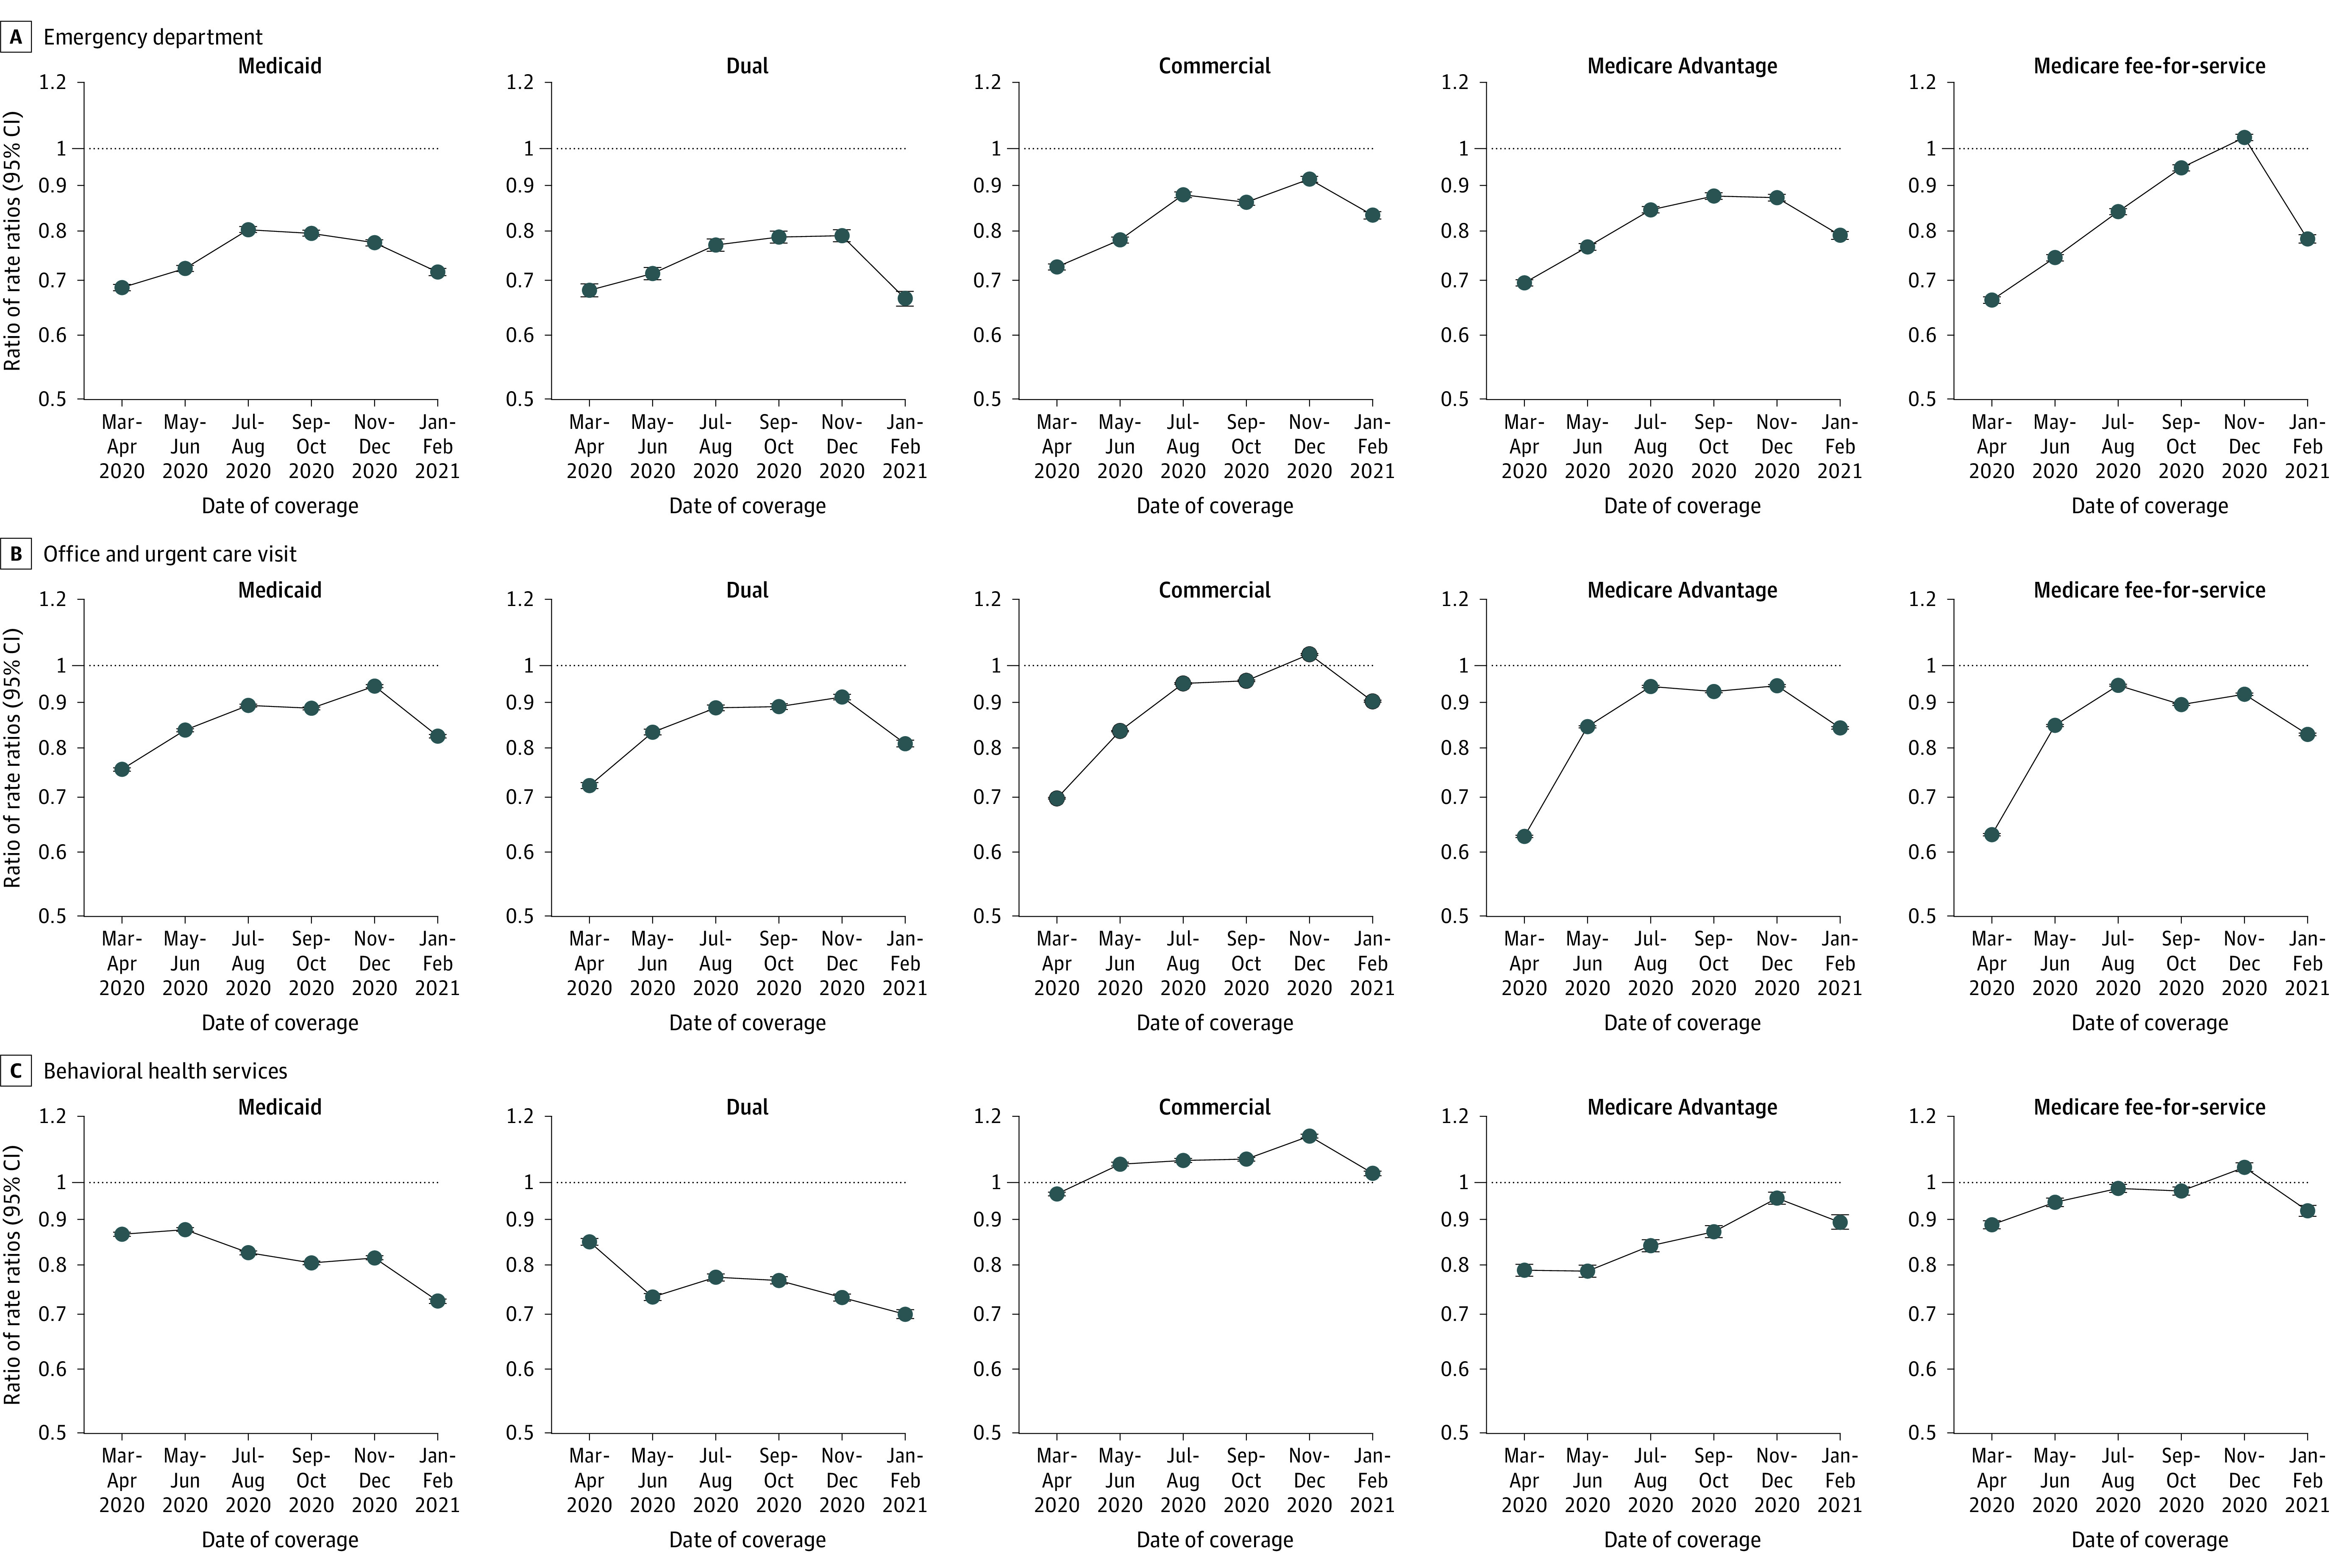
Figure 5. Screening-Based Services Among 14 505 945 Patients in the Primary Analysis Cohort.
Differences by insurance type were particularly pronounced for behavioral health services in the January-February 2021 time frame: Medicaid, 72.0% (95% CI, 71.5%-72.4%); Medicare-Medicaid dual-eligibility, 69.4% (95% CI, 68.6%-70.3%); commercial, 102.5% (95% CI, 101.8%-103.1%); Medicare Advantage, 89.5% (95% CI, 87.8%-91.4%); and Medicare fee-for-service, 92.4% (95% CI, 91.0%-93.8%; Figure 3 and eTable 4 in the Supplement).
Sensitivity Analyses
The prepandemic seasonal increase and decline and pandemic-associated utilization patterns appeared similar across all 3 cohorts (Figure 1). With a placebo test for parallel trends, we found ratio of rate ratios very close to 1 (eTable 3 in the Supplement). In these sensitivity analyses, results in the 2 other cohorts were similar to the primary analysis cohort except that return to prepandemic ambulatory care utilization rates among Medicaid patients remained greater (85.8% [95% CI, 85.5%-86.1%]) in the fully enrolled cohort and lower (76.1% [95% CI 75.7%-76.5%]) in the noncontinuously enrolled cohort when compared with the primary analysis cohort (78.4% [95% CI 78.2%-78.7%]) by January-February 2021 (eTable 5 in the Supplement).
In addition, utilization patterns across US regions appeared similar (eFigure 7 in the Supplement), and adjusting for US regions in the primary analysis cohort (eTable 6 in the Supplement) did not alter overall return to utilization patterns when compared with the primary results.
Discussion
Between the May-June 2020 and November-December 2020 time frames, combined use of 6 ambulatory care services significantly increased (returning to near expected rates) after the preceding decrease in utilization following the onset of the COVID-19 pandemic. These returns to near expected rates of utilization observed by summer and autumn 2020 were diminished following dissemination of a second wave of the COVID-19 virus.31 Throughout most of the period during which utilization returned to expected levels (May-December 2020) and the subsequent decline associated with the second wave of the pandemic (January-February 2021), the rate of recovery was significantly less for patients with Medicaid or Medicare-Medicaid dual-eligibility compared with those with commercial, Medicare Advantage, or Medicare fee-for-service insurance, respectively. These findings suggested potentially worsening access to care during the pandemic among patients with Medicaid and patients with Medicare-Medicaid dual eligibility. These individuals are typically socioeconomically disadvantaged.
The precise reasons for consistently lower rates of return to expected rates in ambulatory care among the 2 insurance groups that are frequently associated with socioeconomically disadvantaged populations are unclear. This study’s sensitivity analyses suggested that delays in recovery of ambulatory care service use among patients with Medicaid were more pronounced among those with greater disruptions in coverage, consistent with prepandemic research.32 Further work should investigate and confirm these findings. Further research should examine whether these differences reflect characteristics of the patients, their individual clinicians, the health system or physician practice group where they receive care, the community in which they live, a feature of their insurance benefits, or other factors. Although results of a cross-sectional household survey of 3055 US adults with health insurance between July 1 and August 3, 2020, describing pandemic-related delays in medical care did not differ by insurance type,4 our larger analysis of medical claims data extends beyond the survey’s 1-month study period. Nevertheless, these household survey data showed the most frequently cited patient-level factors for delays in care included fear of contracting COVID-19 at medical facilities, followed by inability to obtain an appointment or to find a physician who would see them.4 Although vaccine dissemination mitigated infections and deaths in many parts of the country, long-standing deferrals in care described in this manuscript may continue substantially into the future. Without attention to the specific reasons for the lower rates of return to ambulatory care use among patients with Medicaid and Medicare-Medicaid dual eligibility compared with patients with each other insurance type, these variations in use of services may contribute to future inequities in cancer and heart disease rates and deaths.
In the context of recently documented higher pandemic-associated death rates among racial and ethnic minority groups,33 understanding the multilevel contributions of various factors to delays in care and associated outcomes should be examined. In the state of Maryland, differences in rates of pandemic-associated suicide between patients who were Black and patients who were White increased between March and July 2020.34 Further studies should determine whether the widening differences in access to behavioral health services between commercially insured and Medicaid-insured patients, who are disproportionately Black,28 partly explain these disparate suicide rates. In contrast to the less well-established relationship between population-level behavioral health service use and suicide rates, the well-established association between cancer screening and cancer-related deaths means that delays in cancer screening are more likely to cause additional preventable cancer-related deaths.35 There may be benefit in policy makers, health system leaders, clinicians, and patients proactively developing effective “catch-up” strategies that support timely access to recently missed health services designed to avoid preventable adverse consequences.
Limitations
This study has several limitations. First, the data reflected a convenience sample. Results are not necessarily generalizable to all US health care organizations and their patients; nevertheless, demographic and regional characteristics were similar to US Census Bureau data.16 Moreover, these overall ambulatory care utilization patterns are consistent with other reports, including US cancer screening in commercially insured populations and differences in behavioral health services in Massachusetts.2,7,8,11,36,37 Second, the study population may have changed over time, thereby influencing these results. The sensitivity analyses, however, showed consistent results across 3 cohorts, including 1 restricted to patients with the same insurance throughout the study period. These sensitivity analyses suggest that this factor was unlikely to affect the study’s findings. Third, due to data use agreement restrictions, these analyses occurred at the population level rather than at the patient level, limiting the ability to adjust for patient-level characteristics or to follow-up individuals over time. Fourth, individual-level geographic variation was not accounted for. However, sensitivity analyses adjusting for US regions did not alter results. Fifth, this study did not include adults who remained uninsured throughout the entire study period, although they represent an important and understudied group of US adults. Sixth, analyses included only professional-level claims submitted by individual clinicians and did not include facility claims billed to insurers; however, prior studies of commercial insurance claims estimated that professional claims reflect the majority of office-based care.38 Seventh, while the preventive care measures reflect evidence-based guideline recommendations, the other ambulatory care utilization measures could not delineate between high- and low-quality care. Eighth, these analyses could not distinguish between video and audio-only telemedicine services.
Conclusions
Between March 2020 and February 2021, aggregate use of 6 ambulatory care services increased after the preceding decrease in utilization that followed the onset of the COVID-19 pandemic. However, the rate of increase in use of these ambulatory care services was significantly lower for participants with Medicaid or Medicare-Medicaid dual eligibility than for those insured by commercial, Medicare Advantage, or Medicare fee-for-service.
eMethods. Supplemental Results
eFigure 1. Cohort Tree of Primary Analysis Cohort
eFigure 2. Primary Analysis Cohort, Non-Continuously Enrolled Cohort, and Fully Enrolled Cohort Design
eFigure 3. Patient Age Distribution in 2019: Comparison of the Primary Analysis Cohort of The Near-Time MedInsight Emerging Experience Research Database
eFigure 4. Patient Gender Distribution in 2019: Comparison of the Primary Analysis Cohort of The Near-Time MedInsight Emerging Experience Research Database
eFigure 5. Patient Regional Distribution in 2019: Comparison of the Primary Analysis Cohort of The Near-Time MedInsight Emerging Experience Research Database
eFigure 6. Unadjusted Overall Utilization per 100 Patients, Stratified by Insurance Type, 2018-2021
eFigure 7. Overall Utilization Rates per 100 Patients in the Primary Analysis Cohort Stratified by U.S. Census Region (n=14.5 million patients)
eTable 1. Percentage of Claims Completely Adjudicated After 5-Months’ Time Across Patient Insurance Types in 2019
eTable 2. Percentage of Claims Completely Adjudicated After 5-Months’ Time Across Health Service Types in 2019
eTable 3. Placebo Test of RoRRs by Insurance Type in the Primary Analysis Cohort
eTable 4. RoRRs of Ambulatory Care Stratified by Service Type and Patient Insurance Subgroups
eTable 5. Age-Sex Adjusted Ratio of Rate Ratios of Overall Ambulatory Care Utilization Across the Three Cohorts
eTable 6. Age-Sex Adjusted Ratio of Rate Ratios of Overall Utilization Among Patients in the Analytic with and without Adjusting for U.S. Census Region
eReferences
References
- 1.CMS releases recommendations on adult elective surgeries, non-essential medical, surgical, and dental procedures during COVID-19 response. centers for Medicare and Medicaid services. News release. March 18, 2020. Accessed June 21, 2021. https://www.cms.gov/newsroom/press-releases/cms-releases-recommendations-adult-elective-surgeries-non-essential-medical-surgical-and-dental
- 2.Mehrotra A, Chernew M, Linetsky D, Hatch H, Cutler D. What impact has COVID-19 had on outpatient visits? Commonwealth Fund. Posted February 22, 2021. Accessed April 18, 2021. https://www.commonwealthfund.org/publications/2021/feb/impact-covid-19-outpatient-visits-2020-visits-stable-despite-late-surge
- 3.Czeisler MÉ, Marynak K, Clarke KEN, et al. Delay or avoidance of medical care because of COVID-19–related concerns—United States, June 2020. MMWR Morb Mortal Wkly Rep. 2020;69(36):1250-1257. doi: 10.15585/mmwr.mm6936a4 [DOI] [PMC free article] [PubMed] [Google Scholar]
- 4.Findling MG, Blendon RJ, Benson JM. Delayed care with harmful health consequences—reported experiences from national surveys during coronavirus disease 2019. JAMA Health Forum. 2020;1(12):e201463-e201463. doi: 10.1001/jamahealthforum.2020.1463 [DOI] [PubMed] [Google Scholar]
- 5.Woolf SH, Chapman DA, Sabo RT, Weinberger DM, Hill L. Excess deaths from COVID-19 and other causes, March-April 2020. JAMA. 2020;324(5):510-513. doi: 10.1001/jama.2020.11787 [DOI] [PMC free article] [PubMed] [Google Scholar]
- 6.Schmidt AL, Bakouny Z, Bhalla S, et al. Cancer care disparities during the COVID-19 pandemic. Cancer Cell. 2020;38(6):769-770. doi: 10.1016/j.ccell.2020.10.023 [DOI] [PMC free article] [PubMed] [Google Scholar]
- 7.Whaley CM, Pera MF, Cantor J, et al. Changes in health services use among commercially insured US populations during the COVID-19 pandemic. JAMA Netw Open. 2020;3(11):e2024984. doi: 10.1001/jamanetworkopen.2020.24984 [DOI] [PMC free article] [PubMed] [Google Scholar]
- 8.Patel SY, Mehrotra A, Huskamp HA, Uscher-Pines L, Ganguli I, Barnett ML. Trends in outpatient care delivery and telemedicine during the COVID-19 pandemic in the US. JAMA Intern Med. 2020. [DOI] [PMC free article] [PubMed] [Google Scholar]
- 9.Uscher-Pines L, Sousa J, Jones M, et al. Telehealth use among safety-net organizations in California during the COVID-19 pandemic. JAMA. 2021;325(11):1106-1107. doi: 10.1001/jama.2021.0282 [DOI] [PMC free article] [PubMed] [Google Scholar]
- 10.Rodriguez JA, Betancourt JR, Sequist TD, Ganguli I. Differences in the use of telephone and video telemedicine visits during the COVID-19 pandemic. Am J Manag Care. 2021;27(1):21-26. doi: 10.37765/ajmc.2021.88573 [DOI] [PMC free article] [PubMed] [Google Scholar]
- 11.Martin K, Kurowski D, Given P, Kennedy K, Clayton E. The impact of COVID-19 on the use of preventive health care. Health Care Costs Institute. Published April 16, 2021. Accessed November 17, 2021. https://healthcostinstitute.org/hcci-research/the-impact-of-covid-19-on-the-use-of-preventive-health-care
- 12.Hartnett KP, Kite-Powell A, DeVies J, et al. ; National Syndromic Surveillance Program Community of Practice . Impact of the COVID-19 pandemic on emergency department visits—United States, January 1, 2019-May 30, 2020. MMWR Morb Mortal Wkly Rep. 2020;69(23):699-704. doi: 10.15585/mmwr.mm6923e1 [DOI] [PMC free article] [PubMed] [Google Scholar]
- 13.Cox C, Amin K, Kamal R. How have health spending and utilization changed during the coronavirus pandemic? Kaiser Family Foundation. Posted March 21, 2021. Accessed January 19, 2021. https://www.healthsystemtracker.org/chart-collection/how-have-healthcare-utilization-and-spending-changed-so-far-during-the-coronavirus-pandemic/#item-start
- 14.Mehrotra A, Wang B, Snyder G, Telemedicine: what should the post-pandemic regulatory and payment landscape look like? Commonwealth Fund. Posted August 5, 2020. Accessed April 19, 2021. https://www.commonwealthfund.org/publications/issue-briefs/2020/aug/telemedicine-post-pandemic-regulation
- 15.Joynt Maddox KE, Reidhead M, Qi AC, Nerenz DR. Association of stratification by dual enrollment status with financial penalties in the hospital readmissions reduction program. JAMA Intern Med. 2019;179(6):769-776. doi: 10.1001/jamainternmed.2019.0117 [DOI] [PMC free article] [PubMed] [Google Scholar]
- 16.American Community Survey. United States Census Bureau. Accessed May 27, 2019. https://www.census.gov/programs-surveys/acs
- 17.The who, what, when, why & how of NPI. Centers for Medicare & Medicaid Services. Published August 2006. Accessed November 13, 2021. https://www.cms.gov/Medicare/Provider-Enrollment-and-Certification/MedicareProviderSupEnroll/downloads/enrollmentsheet_wwwwh.pdf
- 18.Milliman MedInsight White Paper . Frameworks and considerations for COVID-19 related analyses. Accessed July 20, 2021. https://us.milliman.com/-/media/milliman/pdfs/articles/frameworks-considerations-covid-19-related-analyses.ashx
- 19.US Preventive Services Task Force . Grade A and B recommended services. Accessed 04/16/2021.https://www.uspreventiveservicestaskforce.org/uspstf/recommendation-topics/uspstf-and-b-recommendations
- 20.Health Resources and Services Administration . Women’s preventive services guidelines. Published 2021. Accessed July 26, 2021. https://www.hrsa.gov/womens-guidelines/index.html#guidelines%20concerning
- 21.Medicare telemedicine health care provider fact sheet. Centers for Medicare & Medicaid Services. Posted May 17, 2020. Accessed April 16, 2021. https://www.cms.gov/newsroom/fact-sheets/medicare-telemedicine-health-care-provider-fact-sheet
- 22.Coding scenario: coding for telehealth visits. American Academy of Family Physicians. Accessed April 16, 2021. https://www.aafp.org/family-physician/patient-care/current-hot-topics/recent-outbreaks/covid-19/covid-19-telehealth/coding-scenarios-during-covid-19/telehealth.html
- 23.Telemedicine. Medicaid. Accessed April 16, 2021. https://www.medicaid.gov/medicaid/benefits/telemedicine/index.html
- 24.Overview of Medicare and Medicaid state telehealth policies. Center for Connected Health Policy. Accessed December 30, 2021. https://www.cchpca.org/topic/overview
- 25.Benjamini Y, Hochberg Y. Controlling the false discovery rate. J R Stat Soc B. 1995;57(1):289-300. doi: 10.1111/j.2517-6161.1995.tb02031.x [DOI] [Google Scholar]
- 26.Fronstin P, Woodbury SA. How many Americans have lost jobs with employer health coverage during the pandemic? The Commonwealth Fund. Posted October 7, 2020. Accessed April 18, 2021. https://www.commonwealthfund.org/publications/issue-briefs/2020/oct/how-many-lost-jobs-employer-coverage-pandemic
- 27.Khorrami P, Sommers BD. Changes in US Medicaid enrollment during the COVID-19 pandemic. JAMA Netw Open. 2021;4(5):e219463. doi: 10.1001/jamanetworkopen.2021.9463 [DOI] [PMC free article] [PubMed] [Google Scholar]
- 28.Nolen LST, Beckman AL, Sandoe E. How foundational moments in Medicaid’s history reinforced rather than eliminated racial health disparities. Health Affairs. Posted September 1, 2020. Accessed April 18, 2021. https://www.healthaffairs.org/do/10.1377/forefront.20200828.661111/full
- 29.Parikh-Patel A, Morris CR, Kizer KW. Disparities in quality of cancer care: the role of health insurance and population demographics. Medicine (Baltimore). 2017;96(50):e9125-e9125. doi: 10.1097/MD.0000000000009125 [DOI] [PMC free article] [PubMed] [Google Scholar]
- 30.Saloner B, Sabik L, Sommers BD. Pinching the poor? N Engl J Med. 2014;370(13):1177-1180. doi: 10.1056/NEJMp1316370 [DOI] [PubMed] [Google Scholar]
- 31.Coronavirus in the US: latest map and case count. New York Times. Updated December 28, 2021. Accessed December 30, 2021. https://www.nytimes.com/interactive/2021/us/covid-cases.html
- 32.Yabroff KR, Reeder-Hayes K, Zhao J, et al. Health insurance coverage disruptions and cancer care and outcomes. J Natl Cancer Inst. 2020;112(7):671-687. doi: 10.1093/jnci/djaa048 [DOI] [PMC free article] [PubMed] [Google Scholar]
- 33.Woolf SH, Chapman DA, Sabo RT, Zimmerman EB. Excess deaths from COVID-19 and other causes in the US, March 1, 2020, to January 2, 2021. JAMA. 2021;325(17):1786-1789. doi: 10.1001/jama.2021.5199 [DOI] [PMC free article] [PubMed] [Google Scholar]
- 34.Bray MJC, Daneshvari NO, Radhakrishnan I, et al. Racial differences in statewide suicide mortality trends in Maryland during the coronavirus disease 2019 (COVID-19) pandemic. JAMA Psychiatry. 2021;78(4):444-447. doi: 10.1001/jamapsychiatry.2020.3938 [DOI] [PMC free article] [PubMed] [Google Scholar]
- 35.Maringe C, Spicer J, Morris M, et al. The impact of the COVID-19 pandemic on cancer deaths due to delays in diagnosis in England, UK. Lancet Oncol. 2020;21(8):1023-1034. doi: 10.1016/S1470-2045(20)30388-0 [DOI] [PMC free article] [PubMed] [Google Scholar]
- 36.Yang J, Landrum MB, Zhou L, Busch AB. Disparities in outpatient visits for mental health and/or substance use disorders during the COVID surge and partial reopening in Massachusetts. Gen Hosp Psychiatry. 2020;67:100-106. doi: 10.1016/j.genhosppsych.2020.09.004 [DOI] [PMC free article] [PubMed] [Google Scholar]
- 37.Becker NV, Moniz MH, Tipirneni R, Dalton VK, Ayanian JZ. Utilization of Women’s Preventive Health Services During the COVID-19 Pandemic. JAMA Health Forum. 2021;2(7):e211408-e211408. doi: 10.1001/jamahealthforum.2021.1408 [DOI] [PMC free article] [PubMed] [Google Scholar]
- 38.Godwin J, Arnold DR, Fulton BD, Scheffler RM. The Association between hospital-physician vertical integration and outpatient physician prices paid by commercial insurers. Inquiry. 2021;58:46958021991276-46958021991276. [DOI] [PMC free article] [PubMed] [Google Scholar]
Associated Data
This section collects any data citations, data availability statements, or supplementary materials included in this article.
Supplementary Materials
eMethods. Supplemental Results
eFigure 1. Cohort Tree of Primary Analysis Cohort
eFigure 2. Primary Analysis Cohort, Non-Continuously Enrolled Cohort, and Fully Enrolled Cohort Design
eFigure 3. Patient Age Distribution in 2019: Comparison of the Primary Analysis Cohort of The Near-Time MedInsight Emerging Experience Research Database
eFigure 4. Patient Gender Distribution in 2019: Comparison of the Primary Analysis Cohort of The Near-Time MedInsight Emerging Experience Research Database
eFigure 5. Patient Regional Distribution in 2019: Comparison of the Primary Analysis Cohort of The Near-Time MedInsight Emerging Experience Research Database
eFigure 6. Unadjusted Overall Utilization per 100 Patients, Stratified by Insurance Type, 2018-2021
eFigure 7. Overall Utilization Rates per 100 Patients in the Primary Analysis Cohort Stratified by U.S. Census Region (n=14.5 million patients)
eTable 1. Percentage of Claims Completely Adjudicated After 5-Months’ Time Across Patient Insurance Types in 2019
eTable 2. Percentage of Claims Completely Adjudicated After 5-Months’ Time Across Health Service Types in 2019
eTable 3. Placebo Test of RoRRs by Insurance Type in the Primary Analysis Cohort
eTable 4. RoRRs of Ambulatory Care Stratified by Service Type and Patient Insurance Subgroups
eTable 5. Age-Sex Adjusted Ratio of Rate Ratios of Overall Ambulatory Care Utilization Across the Three Cohorts
eTable 6. Age-Sex Adjusted Ratio of Rate Ratios of Overall Utilization Among Patients in the Analytic with and without Adjusting for U.S. Census Region
eReferences