

Abstract
Higher BMI, lower rates of physical activity (PA), and hormone receptor-negative breast cancer (BC) subtype are associated with poorer BC treatment outcomes. We evaluated the prevalence of high BMI, low PA level, and BC subtype among survivors with white/European American (EA) and African American (AA) ancestry, as well as a distinct subset of AAs with Sea Island/Gullah ancestry (SI). We used the South Carolina Central Cancer Registry to identify 137 (42 EAs, 66 AAs, and 29 SIs) women diagnosed with BC and who were within 6–21 months of diagnosis. We employed linear and logistic regression to investigate associations between BMI, PA, and age at diagnosis by racial/ethnic group. Most participants (82%) were overweight/obese (P = 0.46). BMI was highest in younger AAs (P = 0.02). CDC PA guidelines (≥150 min/week) were met by only 28% of participants. The frequency of estrogen receptor (ER)-negative BC subtype was lower in EAs and SIs than in AAs (P < 0.05). This is the first study to identify differences in obesity and PA rates, and BC subtype in EAs, AAs, and SIs. BMI was higher, PA rates were lower, and frequency of ER-negative BC was higher in AAs as compared to EAs and SIs. This study highlights the need to promote lifestyle interventions among BC survivors, with the goal of reducing the likelihood of a BC recurrence. Integrating dietary and PA interventions into ongoing survivorship care is essential. Future research could evaluate potential differential immune responses linked to the frequency of triple negative BC in AAs.
1. Introduction
Breast cancer (BC) is the second leading cause of cancer death among women in the United States (US Cancer Statistics Working Group, 2017). Compared with European American (EA)/white women, African American/Black (AA) women have disproportionately poorer survival after a BC diagnosis, resulting in 38% higher BC mortality rates for 2009–2013 (American Cancer Society, 2013; Campbell et al., 2012).
Obesity has also been linked to poorer BC outcomes, with overweight or obese women (body mass index [BMI] ≥25) having a significantly higher risk of BC recurrence than women with normal BMI levels (Demark-Wahnefried, Campbell, & Hayes, 2012; Fabian, 2012; Kamineni et al., 2013). United States’ obesity (BMI ≥30) has reached epidemic proportions, with an age-adjusted prevalence of 36% among EA women and 57% among AA women in 2011–2014 (Ogden, Carroll, Fryar, & Flegal, 2015). In the United States, AAs experience the highest rates of obesity, providing one possible reason for their poorer survival (American Cancer Society, 2014).
Another potential contributor to the racial/ethnic disparity in BC survival is physical activity (Thompson, Owusu, Nock, Li, & Berger, 2014). Women with BC who are physically active have improved survival rates compared to those who are not (Thompson et al., 2014). However, treatment of early stage BC often results in fatigue, functional decline and weight gain which makes increasing the amount of physical activity more difficult. Compounding the challenges faced by women with a BC diagnosis, many obese, sedentary survivors have co-morbid illnesses such as diabetes, hyperlipidemia and hypertension, all of which are likely to improve with increased physical activity.
The purpose of the present study was to compare the prevalence of high BMI and level of physical activity by racial/ethnic group among BC survivors in South Carolina. A unique feature of this study is the ability to examine the frequency of the triple negative BC (TNBC) subtype, as it is well known that TNBC occurs with greater frequency in AA than in EA women.
Also novel is the inclusion not only of EA and AA but also Sea Islanders/Gullah (SI) women, a distinct subset of AAs that is culturally and genetically distinct (Tishkoff et al., 2009; Zakharia et al., 2009). The SIs are direct descendants of Africans from the west coast of Africa. Geographic isolation has allowed the SIs, more than any other AA group, to preserve elements of their African cultural heritage and to retain one of the lowest rates of genetic admixture of any AA group in the United States (less than 4%, compared to an average 15% in the United States AA population) (McLean et al., 2005).
The presence of the SI population in South Carolina provides a unique opportunity to explore potential biologic differences that contribute to disparities in cancer morbidity and mortality in AAs in South Carolina and beyond (Tishkoff et al., 2009; Zakharia et al., 2009), and to investigate whether, among survivors of BC, overweight/obesity and physical activity differ among AA subgroups. The present study provides the first known such comparisons across these three racial/ethnic groups: EAs, AAs without SI ancestry (non-SI AAs), and SIs.
2. Methods
2.1. Institutional Review Board (IRB) protection
We obtained approval to conduct the study from the IRB at the Medical University of South Carolina (MUSC) and from the South Carolina Central Cancer Registry (SCCCR) of the South Carolina Department of Health and Environmental Control (South Carolina DHEC) (South Carolina Department of Health and Environmental Control, 2017). Consent was obtained from each study participant.
2.2. Breast cancer (BC) case ascertainment
Case ascertainment and data collection steps are illustrated in the CONSORT diagram (Fig. 1). Potential participants consisted of adult women with a diagnosis of invasive BC of known grade at age ≥21 years, and whose race was recorded in the SCCCR as either EA or AA. Cases were ascertained between May 2012 and October 2013 by SCCCR staff within 6–21 months (mean 12 months) of diagnosis, and then interviewed by study personnel within 6 months of SCCCR staff referral. All interviews were completed by December 2013.
Fig. 1. CONSORT diagram.
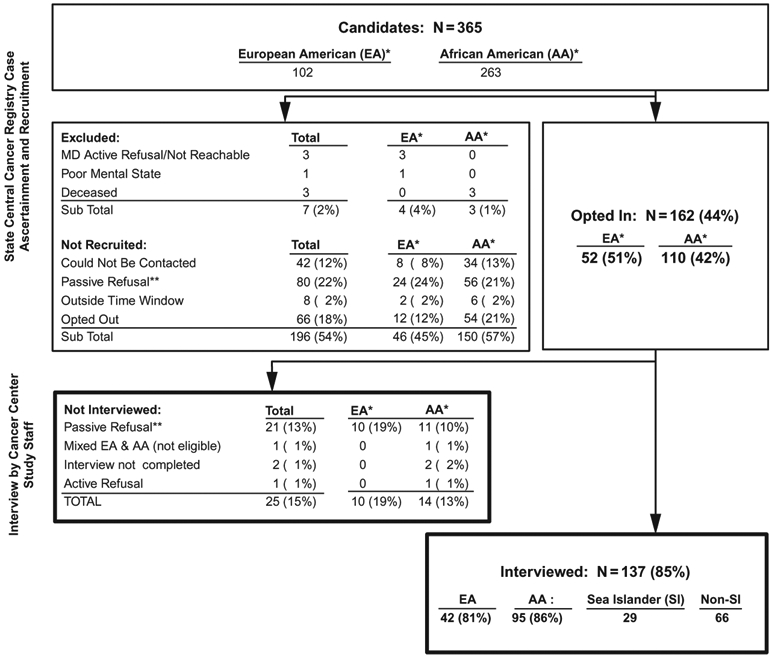
*Race as recorded in the state central cancer registry. (Self-reported race was used at Interview.)
**Passive Refusal: Not responding to repeated calls.
%’s: Denominators are obtained form next higher step, e.g., the number Interviewed (137) is 85% of those who Opted In (162).
After receiving passive physician approval for each potentially eligible case identified, SCCCR staff contacted the participants by telephone and referred those who declared an interest in participating (“opted in”) to study personnel. The target sample size was 30 participants in each of the three racial/ethnic groups.
2.3. Data collection and ethnicity definition
The SCCCR staff provided data on BC characteristics (date of diagnosis, stage, tumor markers) for each participating case. Trained study interviewers contacted each woman referred by the SCCCR staff and administered a telephone interview. Ethnicity of each participant was categorized on the basis of the ethnicity of parents as self-reported during the interview and according to a previously developed algorithm to confirm SI ancestry: EA if the participant considered both parents to be of European origin, or AA if both parents were AA. Among AAs, participants were sub-classified as SIs if both parents were born in regions of South Carolina classified as SI geographic regions (i.e., ≥ 30 miles from the Atlantic coast) or AAs without SI ancestry (non-SI AAs).
AA participants whose parental racial/ethnic ancestry was unknown were not included in the present analysis. Participants who reported Asian or Hispanic ancestry or who were of mixed race were also excluded from this analysis.
Other self-reported data collected during the telephone interview included age, education, height, weight, primary leisure time physical activity during the past month, and frequency and usual time spent in this activity. Questionnaire items were selected from the National Health Interview Survey and from the CDC Behavioral Risk Factor Surveillance Survey (BRFSS) (Centers for Disease Control and Prevention (CDC), 2011, 2018). BMI (kg/m2) was calculated from self-reported height and weight as [weight (lbs)/height (in.)2] (Centers for Disease Control and Prevention (CDC), 2015). Published CDC BMI categories and CDC 2008 physical activity guidelines (Centers for Disease Control and Prevention (CDC), 2015, 2017) were used to characterize BMI and physical activity guideline adherence in the study sample. BMI <18.5 is considered underweight, 18.5–24.9 normal weight, 25.0–29.9 overweight, 30.0–34.9 obese, and ≥35.0 as extremely obese.
Duration of moderate aerobic activity per week was calculated from the reported duration of primary type of activity or exercise per episode, multiplied by the number of episodes per week during the past month. This was adjusted for intensity according to metabolic equivalents of that activity, where 1 min of vigorous activity counted as 2 min of moderate activity; light or non-aerobic activity or activity for less than 10 min per session was not included. Activity level was then categorized according to the CDC-recommended guidelines of 150 min moderate aerobic activity per week (National Center for Chronic Disease Prevention and Health Promotion. Division of Nutrition Physical Activity and Obesity. CDC, 2013).
To assess how representative our study population was of statewide incident invasive BC cases, we compared age at diagnosis, prevalence of late stage (regional or distant) and prevalence of triple negative disease to data for all invasive cases of known stage diagnosed during 2011–2012, among adult EA and AA women (provided by the SCCCR). We also compared educational attainment, BMI and physical activity among participants with 2012–2013 South Carolina BRFSS data to EA and AA adult women of the same age range as participants; these data represent the general female population and are not restricted to those with invasive BC.
2.4. Evaluation of triple negative breast cancer (TNBC) in a sub-sample of the three population groups
While it is well known that TNBC occurs with greater frequency in AA than in EA women, what is unknown is the frequency of TNBC in the SI population. Therefore, we recruited and collected saliva samples from a sub-sample of 86 participants from the three population groups (approximately 30 participants per group) who had been diagnosed with BC in the past 6–21 months.
2.5. Statistical analysis
Participant demographic and tumor characteristics, BMI, and physical activity were summarized using standard descriptive statistics. In accordance with the primary purpose of this study, statistical analyses examined differences among and between the three racial/ethnic groups: EAs, non-SI AAs, and SIs. Differences were evaluated statistically using Student’s t-test, chi-square, Fisher exact test, Wilcoxon rank-sum, and Kruskal-Wallis H non-parametric analysis, as appropriate. Simple linear and logistic regression modeling techniques were used to investigate associations between BMI, physical activity, and age at diagnosis. Statistical analyses were conducted using STATA 10.0 (StataCorp, 2007). Tests were two-tailed, except where testing associations between physical activity and BMI, which were one-tailed (based upon the hypothesis that greater physical activity would be associated with reduced BMI); P-values <0.05 were considered statistically significant.
3. Results
3.1. Study population
A total of 365 potentially eligible participants were ascertained by SCCCR staff, of whom 162 (44%) opted into the study and were referred to the study’s data collection staff. Among these, 137 (85%) met all eligibility criteria and were interviewed: 42 EAs, 66 non-SI AAs, and 29 SIs (CONSORT diagram: Fig. 1). All BC cases had been diagnosed during 2012 and 2013.
3.2. Sociodemographic characteristics and BC stage
Age at diagnosis ranged from 37.9 to 89.4 years, with differences in mean age significant only between non-SI AAs and EAs (P = 0.044) (Table 1). Educational attainment did not differ statistically between AAs and EAs or between AAs and SIs. However, EAs were more likely than SIs to report having a high school diploma or more education (P = 0.029).
Table 1.
Participant and breast cancer characteristics in the three racial/ethnic groups.
| EA |
AA |
P-valuea |
||||||||
|---|---|---|---|---|---|---|---|---|---|---|
| (N = 42) | Non-SI (N = 66) | SI (N = 29) | EA vs non- SI AA |
Non-SI AA vs SI |
||||||
| N | (%) | N | (%) | N | (%) | Three group | SI vs EA | |||
| Age at diagnosis (years) | ||||||||||
| Mean (std dev) | 61.6 | (12.9) | 56.7 | (12.0) | 60.2 | (10.4) | 0.094 | 0.044 | 0.152 | 0.609 |
| Median (range) | 62.1 | (37.9–86.6) | 54.9 | (37.1–89.4) | 57.4 | (45.2–81.4) | ||||
| Education | ||||||||||
| < HS diploma | 3 | (7) | 12 | (18) | 8 | (28) | 0.190 | 0.562 | 0.292 | 0.029 |
| HS diploma/12 years | 12 | (29) | 18 | (27) | 8 | (28) | ||||
| Trade/some college | 16 | (38) | 19 | (29) | 3 | (10) | ||||
| College degree | 6 | (14) | 10 | (15) | 7 | (24) | ||||
| Post graduate degree | 5 | (12) | 7 | (11) | 3 | (10) | ||||
| < HS or HS diploma | 15 | (36) | 30 | (45) | 16 | (55) | 0.118 | 0.522 | 0.145 | 0.029 |
| Trade/some college | 16 | (38) | 19 | (29) | 3 | (10) | ||||
| College degree (+) | 11 | (26) | 17 | (26) | 10 | (34) | ||||
| Breast cancer | ||||||||||
| Localized | 33 | (79) | 31 | (47) | 21 | (72) | 0.011 | 0.004 | 0.074 | 0.886 |
| Regional | 8 | (19) | 28 | (42) | 7 | (24) | ||||
| Distant | 1 | (2) | 7 | (11) | 1 | (3) | ||||
| Regional/distant | 9 | (21) | 35 | (53) | 8 | (28) | 0.002 | 0.001 | 0.026 | 0.582 |
| Triple negative | 3/39 | (7.7) | 14/61 | (23.0) | 2/21 | (9.5) | 0.102 | 0.058 | 0.220 | 1.000 |
Values in bold font type indicate P-value <0.05.
EA, European American; AA, African American; non-SI AA, non-SI African American; SI, Sea Islander; std dev, standard deviation; HS, high school; triple negative: negative for expression of estrogen receptor, progesterone receptor and HER2.
Racial/ethnic differences were observed in stage at diagnosis (among groups: P = 0.002), with late stage disease most common among non-SI AAs (21% of EAs, 53% of non-SI AAs and 28% of SIs). Interestingly, late stage was only half as common among SIs as non-SI AAs (P = 0.026).
Among those with complete tumor marker data (N = 121), TNBC (negative for each of estrogen receptor [ER], progesterone receptor [PR], and human epidermal growth factor receptor 2 [HER-2] expression) was found in 8% of EAs, 23% of non-SI AAs, and 10% of SIs, with no significant differences among or between groups. As with stage, prevalence of TNBC in SIs was similar to EAs, and about half that seen in non-SI AAs. In interpreting this it should be noted that HER-2 data were not available for 28% of SI cases, compared with only 7%–8% of EA and non-SI AA cases.
3.3. Overweight/obesity
Most participants were overweight/obese (BMI ≥25; Table 2), a finding that did not vary significantly among racial/ethnic groups (79% of EAs, 80% of non-SI AAs, and 90% of SIs) or between AA groups. Non-SI AAs and SIs were each more likely than EAs to have extreme obesity (BMI ≥35.0: 33% and 28% respectively, vs 19% of EAs), not statistically significant but nevertheless of concern.
Table 2.
BMI and physical activity in the three racial/ethnic groups.
| EA |
AA |
P-valuea |
||||||||
|---|---|---|---|---|---|---|---|---|---|---|
| (N = 42) | Non-SI (N = 66) | SI (N = 29) | EA vs Non- SI AA |
Non-SI AA vs SI |
||||||
| N | (%) | N | (%) | N | (%) | Three groups | SI vs EA | |||
| Body mass index (BMI), kg/m2 | ||||||||||
| Mean (std dev) | 29.4 | (5.1) | 31.9 | (7.5) | 32.0 | (6.1) | 0.140 | 0.051 | 0.943 | 0.061 |
| Median (range) | 29.5 | (20.8–40.2) | 31.0 | (16.6–48.4) | 30.7 | (22.0–51.6) | ||||
| Underweight/normal(≤24.9)b | 9 | (21) | 13 | (20) | 3 | (10) | 0.555 | 0.436 | 0.490 | 0.561 |
| Overweight (25.0–29.9) | 15 | (36) | 18 | (27) | 9 | (31) | ||||
| Obese (30.0–34.9) | 10 | (24) | 13 | (20) | 9 | (31) | ||||
| Extreme obesity (≥35.0) | 8 | (19) | 22 | (33) | 8 | (28) | ||||
| Overweight/obese (≥25.0) | 33 | (79) | 53 | (80) | 26 | (90) | 0.460 | 0.812 | 0.375 | 0.336 |
| Physical activity | ||||||||||
| None | 8 | (19) | 25 | (38) | 6 | (21) | 0.071 | 0.053 | 0.153 | 1.000 |
| Some | 34 | (81) | 41 | (62) | 23 | (79) | ||||
| Main activity (N = 98) | ||||||||||
| Walking, hiking, treadmill | 25 | (74) | 30 | (73) | 17 | (74) | 1.000 | 1.000 | 1.000 | 1.000 |
| Gym, swim, group exercise | 5 | (15) | 6 | (15) | 3 | (13) | ||||
| Gardening, housework, other | 4 | (12) | 5 | (12) | 3 | (13) | ||||
| Minutes per weekc,d | ||||||||||
| Mean (std dev) | 318 | (498) | 119 | (207) | 212 | (375) | – | – | – | – |
| Median (range) | 120 | (0–2160) | 52 | (0–1260) | 60 | (0–1800) | 0.053 | 0.021 | 0.160 | 0.424 |
| None | 9 | (22) | 26 | (39) | 6 | (21) | 0.009 | 0.002 | 0.246 | 0.249 |
| 0–149 | 15 | (37) | 21 | (32) | 11 | (39) | ||||
| 150–299 | 3 | (7) | 14 | (21) | 6 | (21) | ||||
| 300 + | 14 | (34) | 5 | (8) | 5 | (19) | ||||
| CDC activity guidelines met | ||||||||||
| No | 24 | (59) | 47 | (71) | 17 | (61) | 0.350 | 0.177 | 0.318 | 0.856 |
| Yes | 17 | (41) | 19 | (29) | 11 | (39) | ||||
Values in bold font type indicate P-value <0.05.
Includes one underweight Non-SI AA participant.
Minutes per week: includes moderate activity, plus vigorous activity where 1 min of vigorous activity counts as 2min of moderate activity; excludes activity for less than 10min per session, or of less than 3.0 metabolic equivalents (National Center for Chronic Disease Prevention and Health Promotion. Division of Nutrition Physical Activity and Obesity. CDC, 2013).
Two participants (one EA, one SI AA) did not provide information as to frequency or duration of physical activity and are excluded from this analysis.
CDC guidelines: at least 150min per week moderate aerobic physical activity, as defined above.
BMI, body mass index; EA, European American; AA, African American; SI, Sea Islander; std dev, standard deviation; CDC, Centers for Disease Control and Prevention.
3.4. Physical activity
Most participants reported having some physical activity outside of their regular job (81% of EAs, 62% of non-SI AAs, and 79% of SIs; P = 0.071; Table 2), although there was not a significant difference among or between groups. Adherence to the CDC-recommended guidelines of at least 150 min per week of moderate aerobic physical activity was low (41% of EAs, 29% of non-SI AAs, and 39% of SIs), with no significant differences among or between groups but a pattern of lowest activity was observed among non-SI AAs in both metrics.
Duration of moderate aerobic activity varied considerably from 0 to 2160min/week, was highest among EAs (median 120min/week; 52min/week among non-SI AAs, and 60min/week among SIs), but not significantly different among groups (P = 0.053) although greater among EAs than non-SI AAs (P = 0.021).
3.5. Associations with age
BMI and physical activity each were significantly associated with age at interview, consistent in terms of the direction of the association across all racial/ethnic groups except SIs (Table 3). Older participants were less likely to have higher BMIs (reduction of 0.11 BMI unit per increased year of age, P = 0.024), particularly non-SI AAs (reduction of 0.19 BMI unit per year, P = 0.015). Consistent with this finding, older participants were more likely to have met the CDC physical activity guidelines (6% increased odds per year, P < 0.001), particularly EAs (11%, P = 0.004) and non-SI AAs (6%, P = 0.028).
Table 3.
BMI, physical activity and age in the three racial/ethnic groups.
| Population | N | Coef. or OR |
P-value a | (95% CI) | |
|---|---|---|---|---|---|
| Increased BMI (per unit) | Coef. | ||||
| Age at interview (per year) | Allb | 137 | −0.11 | 0.024 | (−0.20 to −0.15) |
| EA | 42 | −0.07 | 0.237 | (−0.20 to 0.05) | |
| Non-SI AA | 66 | −0.19 | 0.015 | (−0.35 to −0.04) | |
| SI | 29 | +0.07 | 0.537 | (−0.16 to 0.30) | |
| Overweight/obesity vs normalc | OR | ||||
| Age at interview (per year) | Allb | 137 | 0.96 | 0.020 | (0.92 to 0.99) |
| EA | 42 | 0.95 | 0.091 | (0.89 to 1.01) | |
| Non-SI AA | 66 | 0.94 | 0.034 | (0.89 to 1.00) | |
| SI | 29 | 1.07 | 0.359 | (0.93 to 1.23) | |
| CDC physical activity (PA) guidelines met vs not metd | OR | ||||
| Age at Interview (per year) | Allb | 135 | 1.06 | <0.001 | (1.03 to 1.10) |
| EA | 41 | 1.11 | 0.004 | (1.03 to 1.19) | |
| Non-SI AA | 66 | 1.06 | 0.028 | (1.01 to 1.11) | |
| SI | 28 | 1.01 | 0.704 | (0.94 to 1.09) | |
| Increased BMI (per unit)e,f | Coef. | P-valuef | 95% CIf | ||
| (a) All participants | Allb | 135 | −2.11 | 0.086 | (−4.53 to 0.30) |
| EA | 41 | −2.52 | 0.125 | (−5.78 to 0.73) | |
| Non-SI AA | 66 | −2.44 | 0.249 | (−6.64 to 1.75) | |
| SI | 28 | −0.82 | 0.742 | (−5.87 to 4.23) | |
| Overweight/obesity vs normalc,e,f | OR | P-valuef | 95% CIf | ||
| (a) All participants | Allb | 135 | 0.49 | 0.118 | (0.20 to 1.20) |
| EA | 41 | 0.26 | 0.094 | (0.05 to 1.25) | |
| Non-SI AA | 66 | 0.57 | 0.393 | (0.16 to 2.05) | |
| SI | 28 | 1.33 | 0.824 | (0.11 to 16.74) | |
Values in bold font type indicate P-value <0.05.
Adjusted for race/ethnicity.
BMI category “Normal” here includes one underweight non-SI AA participant.
Two participants (one EA, one SI AA) did not provide information as to frequency or duration of PA and are excluded from the analysis of CDC PA guideline achievement.
Not adjusted for age at diagnosis, to avoid over-adjustment.
P-value and 95% confidence intervals are for one-tailed tests of the hypothesis that increased PA is associated with reduced BMI (coefficient < zero) or normal BMI (OR < 1.00).
BMI, body mass index; CI, confidence interval; Coef., regression coefficient; OR, odds ratio; P, P-value; EA, European America; AA, African American; SI, Sea Islander.
3.6. Physical activity and BMI
Having met the CDC physical activity guidelines was found to reduce BMI (0.8–2.5 units) within each racial/ethnic group and among all participants combined, but not significantly (P-values 0.086–0.742, Table 3). Reduction was least among SIs.
3.7. Comparison with state-level population-based data
Table 4 shows that our study sample compared well with all cases of invasive BC of known stage diagnosed in South Carolina among adult EA and AA women during 2011–2012 (SCCCR data). Mean ages at diagnosis were very similar: EAs in our sample were on average 1.4 years younger than in state data, and non-SI AAs (comprising the greater part of South Carolina AAs, for whom SI ethnicity data are not available) were 2.0 years younger. Of interest, SCCCR AA data were within the range of data from the study’s non-SI AA and SI study sample on all parameters: age, late state and TNBC.
Table 4.
Demographics, cancer stage, BMI and physical activity: Comparing study population to state-level data for South Carolina.
| EA | AA | ||||
|---|---|---|---|---|---|
| Current study |
State data, % |
Current study |
|||
| Non-SI | SI | ||||
|
N = 42, % |
N = 66, % |
N = 29, % |
State data, N = 6688, % |
||
| Mean age at diagnosis (years) | 61.6 | 63.0a | 56.7 | 60.2 | 58.7a |
| Breast cancer | |||||
| Late stage (regional/distant vs localized) | 21 | 35a | 53 | 28 | 48a |
| Triple negative (vs not triple negative) | 8 | 10a | 23 | 10 | 22a |
| Education | |||||
| More than high school (HS) (vs HS or less) | 64 | 57b | 55 | 45 | 44b |
| College degree (vs no college degree) | 26 | 23b | 26 | 34 | 15b |
| Overweight/obese: (BMI ≥25 kg/m2) (vs normal/underweight) | 79 | 61b | 80 | 90 | 84b |
| Physical activity | |||||
| Some leisure time activity in past 30 days | 81 | 70c | 62 | 79 | 64c |
| Minutes per weekd,e | |||||
| None | 22 | 32c | 39 | 21 | 37c |
| 0–149 | 37 | 36c | 32 | 39 | 36c |
| 150–299 | 7 | 19c | 21 | 21 | 15c |
| 300 + | 34 | 12c | 8 | 19 | 12c |
| CDC activity guidelines metd-f | 41 | 31c | 29 | 39 | 27c |
Includes all cases of invasive breast cancer of known stage diagnosed throughout South Carolina during 2011–2012, among adult EA (N = 5025) or AA (N = 1663) women. Triple Negative analysis excludes cases without complete marker data. Provided by the state central cancer registry.
Education and BMI state data: from South Carolina Behavioral Risk Factor Surveillance Survey (BRFSS) 2012–2013, for EA and AA women ages 37–89 years of age, provided by the state health department.
Physical activity data: from South Carolina Behavioral Risk Factor Surveillance Survey (BRFSS) 2013, for EA and AA women ages 37–89 years of age, provided by the state health department. To be consistent with the current study, BRFSS data were limited to the first reported physical activity only.
Minutes per week: Includes moderate aerobic physical activity, plus vigorous activity where 1 min of vigorous activity counts as 2min of moderate activity; excludes activity for less than 10min per session, or of less than 3.0 metabolic equivalents (National Center for Chronic Disease Prevention and Health Promotion. Division of Nutrition Physical Activity and Obesity. CDC, 2013).
Two participants (one EA, one SI) did not provide information as to frequency or duration of physical activity and are excluded from this analysis.
CDC guidelines: at least 150min per week moderate aerobic physical activity, as defined above.
EA, European American; AA, African American; SI, Sea Islanders; BMI, body mass index; HS, high school; CDC, Centers for Disease Control and Prevention.
By next comparing our study sample with 2012–2013 South Carolina BRFSS population-based, state-level data for EA and AA women corresponding to the age range of our study sample, we thus compared our cancer cases with the general population. Women in our study were somewhat more likely than the BRFSS population to have attained greater than a high school diploma (EAs: 64% vs 57% of BRFSS; AAs: 55% of non-SI AAs and 45% of SIs, vs 44% of BRFSS). Overweight/obesity was somewhat more prevalent among EA participants (79% vs 61% of BRFSS), but rather similar among AAs (80% of non-SI AAs and 90% of SIs, vs 84% of BRFSS).
3.8. Association between race/ethnicity and triple negative BC subtype
Table 5 presents the percentage of cases with hormone receptor positive BC was significantly lower in non-SI AAs than in the SI or EA racial/ethnic groups (P < 0.05). The less-genetically admixed groups (SIs and EAs) had a lower percentage of ER negative BC.
Table 5.
ER status, ER/PR/HER2 breast cancer status, and percentage of triple negative breast cancer cases by racial/ethnic group.a
| Non-SI AA, N = 32 (%) |
SI, N = 24 (%) |
EA, N = 30 (%) |
P- value |
|
|---|---|---|---|---|
| ER status | ||||
| Missing/indeterminate, n | 2 | 0 | 0 | |
| Number of ER + (% from non-missing) | 18 (60) | 21 (88) | 27 (90) | |
| Test for overall association among racial groups: P = 0.01 | ||||
| Non-SI AA vs EA; P = 0.02 | ||||
| Non-SI AA vs SI; P = 0.03 | ||||
| EA vs SI; P = 0.99 | ||||
| Breast cancer status | Non-SI AA, % | SI, % | EA, % | |
| ER status | ||||
| Positive | 60 | 88 | 90 | 0.01 |
| Negative | 40 | 12 | 10 | |
| PR status | ||||
| Positive | 60 | 96 | 80 | 0.01 |
| Negative | 40 | 4 | 20 | |
| HER2 status | ||||
| Positive | 28 | 20 | 12 | 0.24 |
| Negative | 68 | 60 | 65 | |
| Equivocal | 4 | 20 | 23 | |
| Triple negative, n (%) | 7 (21.9) | 1 (4.2) | 2 (6.7) | n/a |
| Total (N = 86), n (%) | 10 (11.6) | |||
Missing complete tumor marker data on 51 participants.
ER, estrogen receptor; PR, progesterone receptor; HER2, human epidermal growth factor receptor 2; SI, Sea Islander; AA, African American; EA, European American.
4. Limitations
This exploratory study is one of the first to compare BMI, physical activity, and BC subtypes among the three racially/ethnically diverse population groups. The sample sizes of EAs and SIs were relatively small in comparison to the number of non-SI AAs. However, statistically significant differences in ER positive BC subtype were found even with these relatively small sample sizes. Therefore, the data may have captured real group differences.
The sample was drawn from one state, South Carolina, and the data may not be generalizable to other states. However, the study could be replicated using cancer registry data from other states, to ascertain whether similar results are found.
The study relied on self-reported behavioral data. In future prospective studies, objective measures of physical activity and overweight/obesity could be employed, such as electronic activity tracker data, waist-to-hip ratio, skinfold thicknesses, or bioelectrical impedance.
5. Discussion
This statewide cancer registry-based study of BC survivors has many strengths. First, it shows that the age at initial BC diagnosis was similar for both EAs and AAs. This is also the first known study to examine racial/ethnic differences in BC subtype in a sample that includes the Sea Island/Gullah population (SIs) and is one of the first studies to document that while BMI rates were similar among the three racial/ethnic groups, physical activity rates and BC subtypes were more similar between EAs and SIs as compared to non-SI AAs. The data show that when hormone receptor status was taken into account, similar frequencies were seen in EAs and SI, compared to the frequencies seen in non-SI AAs.
This study is also innovative in evaluating prevalence of localized, regional, and distant BC in the SI/Gullah population. Again, similar frequencies were seen in EAs and SIs than in non-SI AAs.
With regard to BMI, the majority of participants (82%) were overweight/obese regardless of racial/ethnic group. Additionally, BMI was highest in younger non-SI AAs and older participants. Regardless of race/ethnicity, older participants were more likely to report adhering to CDC physical activity guidelines. However, only 28% of participants in the sample met the CDC physical activity guidelines (≥150 min/week). Each major study finding is discussed in greater detail below.
5.1. Relationship between overweight/obesity and BC recurrence
Eighty-two percent of participants in our study had an overweight/obese BMI. This is of great concern as obese women diagnosed with early stage BC following screening mammography have a 2.4-fold higher risk of BC recurrence and death due to BC within 10 years of diagnosis as compared to normal weight women (Kamineni et al., 2013). This association between overweight and obesity and decreased survival is seen both in premenopausal and postmenopausal women.
The results of prior studies have shown that AA women, who have the highest BC mortality rates and levels of overweight/obesity, are ideal targets for physical activity/weight reduction interventions. Therefore, in the future, investigators could focus on developing these interventions with BC survivors, particularly among AA women.
5.2. BC subtype and ethnicity
To explain the racial/ethnic differences in BC subtype observed in this study, it could be hypothesized that European admixture introduced variants affecting immune responses into African genomes. Regulatory variants affecting steady-state gene expression and transcriptional responsiveness to immune challenges may have been preferentially introduced into African genomes through admixture with Europeans primarily through the United States slave trade, which may have conferred a natural selection disadvantage to modern AAs (who, as a group, are only 400 years old, which is extremely young from an evolutionary perspective). This could explain why, for almost every type of cancer, AAs appear to have the worst mortality outcomes of any other racial/ethnic group in the United States (Gaye, Gibbons, Barry, Quarells, & Davis, 2017).
While differential access to health care among AAs is certainly a contributing factor to these worse outcomes, this factor alone cannot fully explain mortality differences, and immune response differences may play a large role in these outcomes. For example, for hormonally driven cancers such as BC, recent research shows that even after controlling for access to care, persistent disparities in survival outcomes exist for AAs vs EAs (Albain, Unger, Crowley, Coltman, & Hershman, 2009; Newman & Kaljee, 2017). The knowledge gained from these studies could shed light on the associations among ancestral background, the underlying genetic/biomarker distinctions in BC subtypes, and cancer immunologic function. In future studies, targeted dietary and physical activity behavioral interventions could be tested for their effect on reducing the risk of BC recurrence among survivors.
Acknowledgments
This work was supported by United States Department of Defense Southeastern Virtual Institute for Health Equity and Wellness grants W81XWH-11-2-0164 and W81XWH-10-2-0057, United States Department of Defense grant W81XWH-12-1-0043, and by National Institutes of Health grants P20CA157071, R01MD005892, U54CA210962, UL1TR001450, and P30CA138313.
There are no conflicts of interest to report among the authors. The authors thank Ms. Chelsea Lynes of the Division of Surveillance, Office of Public Health Statistics and Information Services, South Carolina Department of Health and Environmental Control for the BRFSS data.
References
- Albain KS, Unger JM, Crowley JJ, Coltman CA Jr., & Hershman DL (2009). Racial disparities in cancer survival among randomized clinical trials patients of the Southwest Oncology Group. Journal of the National Cancer Institute, 101(14), 984–992. 10.1093/jnci/djp175. [DOI] [PMC free article] [PubMed] [Google Scholar]
- American Cancer Society. (2013). Cancer facts & figures 2013. Retrieved from Atlanta, GA: https://www.cancer.org/research/cancer-facts-statistics/all-cancer-facts-figures/cancer-facts-figures-2013.html. [Google Scholar]
- American Cancer Society. (2014). Cancer facts & figures 2014. Retrieved from Atlanta, GA: https://www.cancer.org/research/cancer-facts-statistics/all-cancer-facts-figures/cancer-facts-figures-2014.html. [Google Scholar]
- Campbell KL, Van Patten CL, Neil SE, Kirkham AA, Gotay CC, Gelmon KA, et al. (2012). Feasibility of a lifestyle intervention on body weight and serum biomarkers in breast cancer survivors with overweight and obesity. Journal of the Academy of Nutrition and Dietetics, 112(4), 559–567. 10.1016/j.jada.2011.10.022. [DOI] [PubMed] [Google Scholar]
- Centers for Disease Control and Prevention (CDC). (2011). Behavioral Risk Factor Surveillance System survey questionnaire. Retrieved from https://www.cdc.gov/brfss/questionnaires/index.htm.
- Centers for Disease Control and Prevention (CDC). (2015). Assessing your weight. Retrieved from https://www.cdc.gov/healthyweight/assessing/index.html.
- Centers for Disease Control and Prevention (CDC). (2017). Physical activity. Retrieved from https://www.cdc.gov/physicalactivity/resources/recommendations.html.
- Centers for Disease Control and Prevention (CDC). (2018). National Health Interview Survey. Retrieved from https://www.cdc.gov/nchs/nhis/index.htm.
- Demark-Wahnefried W, Campbell KL, & Hayes SC (2012). Weight management and its role in breast cancer rehabilitation. Cancer, 118(Suppl. 8), 2277–2287. 10.1002/cncr.27466. [DOI] [PMC free article] [PubMed] [Google Scholar]
- Fabian CJ (2012). Simplifying the energy balance message for breast cancer prevention. Cancer Prevention Research (Philadelphia, PA), 5(4), 511–514. 10.1158/1940-6207.CAPR-12-0088. [DOI] [PubMed] [Google Scholar]
- Gaye A, Gibbons GH, Barry C, Quarells R, & Davis SK (2017). Influence of socioeconomic status on the whole blood transcriptome in African Americans. PLoS One, 12(12), e0187290. 10.1371/journal.pone.0187290. [DOI] [PMC free article] [PubMed] [Google Scholar]
- Kamineni A, Anderson ML, White E, Taplin SH, Porter P, Ballard-Barbash R, et al. (2013). Body mass index, tumor characteristics, and prognosis following diagnosis of early-stage breast cancer in a mammographically screened population. Cancer Causes & Control, 24(2), 305–312. 10.1007/s10552-012-0115-7. [DOI] [PMC free article] [PubMed] [Google Scholar]
- McLean DC Jr., Spruill I, Argyropoulos G, Page GP, Shriver MD, & Garvey WT (2005). Mitochondrial DNA (mtDNA) haplotypes reveal maternal population genetic affinities of Sea Island Gullah-speaking African Americans. American Journal of Physical Anthropology, 127(4), 427–438. 10.1002/ajpa.20047. [DOI] [PubMed] [Google Scholar]
- National Center for Chronic Disease Prevention and Health Promotion. Division of Nutrition Physical Activity and Obesity. CDC. (2013). A data users guide to the BRFSS physical activity questions. In How to assess the 2008 physical activity guidelines for Americans. Atlanta, GA. Retrieved from https://www.cdc.gov/brfss/pdf/PA%20RotatingCore_BRFSSGuide_508Comp_07252013FINAL.pdf. [Google Scholar]
- Newman LA, & Kaljee LM (2017). Health disparities and triple-negative breast cancer in African American women: A review. JAMA Surgery, 152(5), 485–493. 10.1001/jamasurg.2017.0005. [DOI] [PubMed] [Google Scholar]
- Ogden CL, Carroll MD, Fryar CD, & Flegal KM (2015). Prevalence of obesity among adults and youth: United States, 2011–2014. Hyattsville, MD: National Center for Health Statistics. Retrieved from https://www.cdc.gov/nchs/products/databriefs/db219.htm. [Google Scholar]
- South Carolina Department of Health and Environmental Control. (2017). South Carolina Central Cancer Registry overview. Retrieved from http://www.scdhec.gov/Health/DiseasesandConditions/Cancer/CancerStatisticsReports/CancerRegistry/.
- StataCorp. (2007). Stata statistical software: Release 10. [Google Scholar]
- Thompson CL, Owusu C, Nock NL, Li L, & Berger NA (2014). Race, age, and obesity disparities in adult physical activity levels in breast cancer patients and controls. Frontiers in Public Health, 2, 150. 10.3389/fpubh.2014.00150. [DOI] [PMC free article] [PubMed] [Google Scholar]
- Tishkoff SA, Reed FA, Friedlaender FR, Ehret C, Ranciaro A, Froment A, et al. (2009). The genetic structure and history of Africans and African Americans. Science, 324(5930), 1035–1044. 10.1126/science.1172257. [DOI] [PMC free article] [PubMed] [Google Scholar]
- US Cancer Statistics Working Group. (2017). United States cancer statistics: 1999–2014 incidence and mortality web-based report. Atlanta, GA: U.S. Department of Health and Human Services, Centers for Disease Control and Prevention and National Cancer Institute. Retrieved from www.cdc.gov/uscs. [Google Scholar]
- Zakharia F, Basu A, Absher D, Assimes TL, Go AS, Hlatky MA, et al. (2009). Characterizing the admixed African ancestry of African Americans. Genome Biology, 10(12), R141. 10.1186/gb-2009-10-12-r141. [DOI] [PMC free article] [PubMed] [Google Scholar]