

Summary
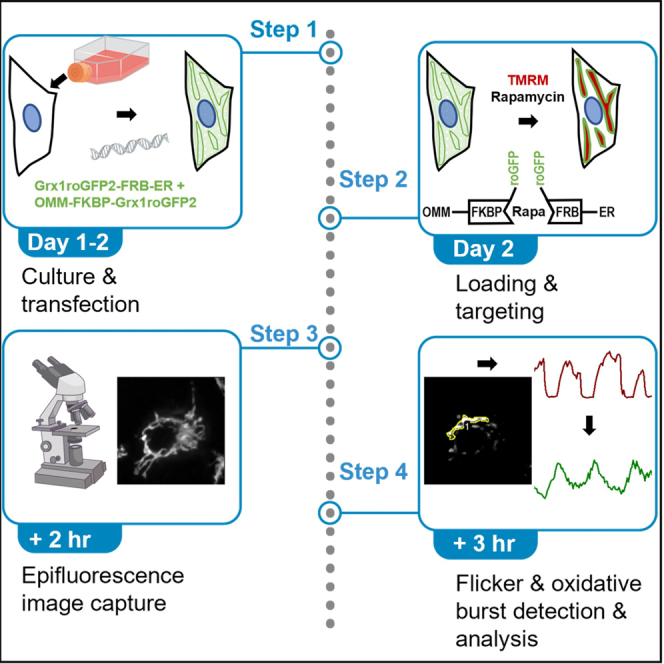
This protocol describes how to visualize, detect, and analyze redox signals (oxidative bursts) at the ER-mitochondrial interface. It uses drug-inducible crosslinking to target the genetically encoded glutathione redox sensor Grx1roGFP2 to organellar contact sites to measure local redox changes associated with transient depolarizations of the mitochondrial membrane potential (flickers). The strategy allows imaging of the oxidized to reduced glutathione ratio (GSSG:GSH) in subcellular regions below the diffraction limit with good temporal resolution and minimum phototoxicity. Moreover, the strategy also applies to diverse parameters including pH, H2O2, and Ca2+.
For complete details on the use and execution of this profile, please refer to Booth et al. (2016) and Booth et al. (2021).
Subject areas: Cell Biology, Microscopy, Molecular/Chemical Probes
Graphical abstract
Highlights
-
•
Stepwise protocol for the use of interorganelle linkers to measure redox nanodomains
-
•
Guidelines for the simultaneous imaging of mitochondrial flickers
-
•
Measurement normalization strategies to determine redox kinetics
This protocol describes how to visualize, detect, and analyze redox signals (oxidative bursts) at the ER-mitochondrial interface. It uses drug-inducible crosslinking to target the genetically encoded glutathione redox sensor Grx1roGFP2 to organellar contact sites to measure local redox changes associated with transient depolarizations of the mitochondrial membrane potential (flickers). The strategy allows imaging of the oxidized to reduced glutathione ratio (GSSG:GSH) in subcellular regions below the diffraction limit with good temporal resolution and minimum phototoxicity. Moreover, the strategy also applies to diverse parameters including pH, H2O2, and Ca2+.
Before you begin
The choice of imaging conditions, probes and cell models are critical to resolve oxidative bursts that function as retrograde signals at the ER-mitochondrial interface. To target probes to the ER-mitochondrial interface, we couple ER and mitochondria targeted probes with the two components of the FK506-binding protein (FKBP) and FKBP-rapamycin binding domain (FRB) heterodimerization system (Inoue et al., 2005). Our laboratory has adapted this strategy to create “linkers”, located in the cytosolic face of the ER membrane and outer mitochondrial membrane (OMM) that heterodimerize upon addition of rapamycin. By equipping these linkers with probes sensitive to Ca2+ and H2O2 concentrations measurement of local signaling has been made possible (Csordas et al., 2010; Booth et al., 2016). We have expanded and improved this strategy by creating linker pairs that incorporate Grx1roGFP2, an excitation-ratiometric fluorescent protein that reports the GSSG:GSH ratio (Gutscher et al., 2008). These tools allow redox measurements at the organellar membrane surfaces and ER-mitochondrial interface when targeted with rapamycin without artifacts associated with pH. Currently, experimental models expressing linker pairs to simultaneously measure GSSG:GSH and Ca2+ are under development to better understand the local interactions of these signaling pathways. Oxidative bursts are initiated by flickers, transient depolarizations of the mitochondrial membrane potential (ΔѰm), which we monitor with the potentiometric dye, tetramethylrhodamine methyl ester (TMRM). We describe measuring flicker & oxidative burst activity in HepG2 cells, a cell type with robust mitochondrial redox signaling. However, we have also used this protocol in diverse cell types including mouse embryonic fibroblasts and freshly isolated hepatocytes.
Preparation of cell culture
Timing: 1 week
-
1.Thawing and culturing HepG2 cells
-
a.Pre-warm and equilibrate cell culture media (from step 2) in vented cell culture flask in a 37°C humidified 5% CO2 incubator for >15 min to ensure normal pH.
-
b.Remove vial of cells from vapor-phase liquid N2 storage and rapidly thaw in 37°C water bath before sterilizing the exterior of the container with 70% ethanol.
-
c.In a laminar flow cabinet gently transfer vial contents to a 15 mL conical centrifuge tube with 9 mL equilibrated cell culture media. Use care to avoid damage to cells which are fragile after thawing.
-
d.Centrifuge at low speed (100×g) for 3–5 min to obtain cell pellet. Discard supernatant.
-
e.Gently resuspend cells in equilibrated media and transfer to cell culture flask seeding at greater than 15,000/cm2.
-
a.
-
2.Passaging Cells
-
a.Passage cells when confluency approaches 85% (Figure 1). Aim to passage cells 2 times per week and apply thorough resuspension to prevent formation of large cell clusters.
-
b.Pre-warm and equilibrate cell culture media (from step 2) in vented T-25 flask in a 37°C humidified 5% CO2 incubator for >15 min to ensure normal pH. Thaw TE solution.
-
c.In a laminar flow cabinet, discard spent cell culture media.
-
d.Rinse cells 2 times with PBS, 3 mL for T-25 flask.
-
e.Add 1 mL TE and carefully distribute across the surface of attached cells. Monitor cell detachment by eye and under microscope. Use only minimal agitation to confirm cell layer disruption and detachment. Incubation at 37°C speeds detachment but should be used with caution.
-
f.Inactivate TE with 4× volume of cell culture media and transfer to 15 mL conical tube.
-
g.Centrifuge cells to obtain pellet, discard supernatant.
-
h.Using a 200 μL pipette tip (hole diameter ∼400–500 μm), resuspend the pellet in cell culture media 5–10 times to mechanically break up cell colonies. Breaking up colonies and frequent passaging is key to good transfection efficiency and consistent results with HepG2.
-
i.Dilute cell suspension to 1 mL and take a sample for counting.
-
j.For ongoing culture, cells should be seeded up to 1:6 dilution. More dilute seeding results in poor growth, while cells allowed to become overconfluent should be replaced. Cells should be used up to ∼30 passages to ensure consistency.
-
k.Healthy HepG2 cells attach quickly (<4 h) which can be confirmed by microscopy.
-
l.Passage cells at least twice before use in experiments to ensure the cells have recovered from freeze/thaw stress.
-
m.Media should be replaced twice per week, while passaging.
-
a.
CRITICAL: Take all appropriate precautions to avoid contamination while culturing cells including routine testing.
Figure 1.

Culture of HepG2 cells
Phase contrast images of HepG2 cells at ∼85% max confluency. Scale bar: 50 μm
Key resources table
| REAGENT or RESOURCE | SOURCE | IDENTIFIER |
|---|---|---|
| Chemicals, peptides, and recombinant proteins | ||
| NaCl | Fisher Scientific | Cat#: S671 |
| KCl | Sigma-Aldrich | Cat#: P9541 |
| CaCl2 | Sigma-Aldrich | Cat#: 21115 |
| KH2PO4 | Fisher Scientific | Cat#: P285 |
| NaHCO3 | Fisher Scientific | Cat#: S233 |
| Glucose | Fisher Scientific | Cat#: G8270 |
| MgSO4×7H2O | Fisher Scientific | Cat#: M63 |
| NaHEPES | Fisher Scientific | Cat#: BP310 |
| BSA, Fraction V, Heat Shock | Sigma-Aldrich | Cat#: 03116964001 |
| Tetramethylrhodamine, Methyl Ester, Perchlorate (TMRM) | Thermo Fisher Scientific | Cat#: T668 |
| Poly-D-Lysine 10× solution | Merck Millipore | Cat#: A-003-E |
| Eagle’s Minimum Essential Medium | ATCC | Cat#: 30-2003 |
| Phosphate Buffered Saline | Lonza | Cat#: 17-516F |
| Opti-MEM | Gibco | Cat#: 31985070 |
| Penicillin-Streptomycin (Pen/Strep) 100× | Lonza | Cat#: DE17-602E |
| Glutamine 100× solution | Gibco | Cat#: 2503-081 |
| Trypsin-EDTA (0.25%) | Gibco | Cat#: 25200056 |
| DMSO | Sigma-Aldrich | Cat#: 8418-50 |
| Dithiothreitol | Sigma-Aldrich | Cat#: D9779 |
| 30% Hydrogen peroxide | Sigma-Aldrich | Cat#: H1009 |
| Oligomycin | Enzo | Cat#: ALX-380-037 |
| Staurosporine | Enzo | Cat#: ALX-380-014 |
| Carbonylcyanide-4-(trifluoromethoxy)-phenylhydrazone (FCCP) | Enzo | Cat#: BML-CM120 |
| Rapamycin | Enzo | Cat#: BML-A275 |
| FK506 | Enzo | Cat#: ALX-380-008 |
| Experimental models: Cell lines | ||
| HepG2 | ATCC | Cat#: HB-8065 |
| Recombinant DNA | ||
| ER-M Grx1roGFP2 (Grx1-roGFP2-HA-FRB-Sac1) | Booth et al. (2021) | N/A |
| OMM-Grx1roGFP2 (OMM-FKBP-Grx1-roGFP2) | Booth et al. (2021) | N/A |
| Software and algorithms | ||
| Fiji | NIH/ImageJ | https://fiji.sc |
| OriginPro 2017 | Origin | https://www.originlab.com |
| MultiStackReg 1.45 | http://bradbusse.net/downloads.html or https://github.com/miura/MultiStackRegistration | |
| Other | ||
| Olympus IX70 inverted Microscope | Olympus | IX70-S8F2 |
| 40×/1.35 Microscope objective | Olympus | UAPON40XO340-2 |
| Xenon arc illumination source/wavelength switcher | Sutter Instrument | Lambda DG4 |
| Switching filter wheel | ASI | FW1000 |
| Customized Dichroic Mirror | Chroma | 59022bs-UV |
| 402/15 Excitation Filter | Chroma | ET402/15x |
| 480/10 Excitation Filter | Chroma | ET480/15x |
| 577/25 Excitation Filter | Chroma | ET577/25x |
| 525/30 Emission Filter | Chroma | ET535/30m |
| Neutral Density Filter set | Chroma | 2200 |
| 512x512 pixel EMCCD camera | Photometrics | Evolve 512 |
| 50 mL Conical Tubes | Fisher Scientific | Cat#: 14-959-49A |
| 15 mL Conical Tubes | Fisher Scientific | Cat#: 14-959-70C |
| Coverslips 25mm No 1.5 | Fisher Scientific | Cat#: NC1272770 |
| T25 Cell Culture Flask | Fisher Scientific | Cat#: 10-126-28 |
| 200μL filtered pipette tips | Fisher Scientific | Cat#: 21-236-1 |
| Centrifuge | ABM | Model# Q5120 |
| Accumet basic pH meter | Fisher Scientific | Model# AB15 |
| Precision Balance | Sartorius | Model# QUINTIX65-1s |
| Cell Culture Incubator | Thermo Fisher Scientific | Model# Heracell 150i |
| Cell counting chamber: Bright line hemacytometer | Sigma-Aldrich | Cat#: Z359629-1EA |
| 35 mm cell culture dish | Corning | Cat#: 353001 |
| 25 cm2 Cell culture flask | Corning | Cat#: 43069 |
| Laminar Flow Cabinet | Thermo Fisher Scientific | Model# 1300 Series A2 |
| 1 L filter flask | Fisher Scientific | Cat#: 09-740-3B |
| Low Fluorescence Immersion Oil (Type FF) | Cargille | Cat#: 16212 |
| Attofluor Cell Chamber | Thermo Fisher Scientific | Cat#: A7816 |
| Surgical Instrument Cleaner | MillTex | Cat#: 3-725 |
Materials and equipment
Prepare aliquots of trypsin-EDTA (TE)
-
•
Thaw 100 mL bottle of TE solution by incubating in a 37°C water bath. Remove immediately when last ice melts. Wipe with 70% ethanol.
-
•
In a laminar flow cabinet, make 10 mL aliquots in 15 mL polypropylene conical tubes and store at −20°C until labeled expiration date.
Cell culture media
-
•
In a laminar flow cabinet, add 50 mL FBS, 5 mL 100× Pen/Strep and 5 mL 100× L-glutamine to 500 mL Eagle’s Minimum Essential Medium (EMEM).
-
•
Filter to 0.2 μm, store in the dark at 4°C for up to 3 months.
18% BSA solution
-
•
Add 126 g BSA to 500 mL 18.2 MΩ water and stir for 6 h in sterile conditions.
-
•
Make dialysis buffer: 4 L 18.2 MΩ water + 36 g NaCl, 40 mL 1M NaHEPES stock solution (pH 7.4)
-
•
Add fully dissolved 18% BSA solution to dialysis bags of minimum 700 mL volume. Rinse 3× with 18.2 MΩ water and dialyze ∼12 h at 4°C with magnetic stirrer.
-
•
During dialysis, the volume will expand to ∼700 mL. Aliquot and freeze at −20°C for up to 12 months.
5× Salt Solution
| Reagent | Final concentration | Amount |
|---|---|---|
| NaCl | 121 mM | 35.4 g |
| KCl | 4.7 mM | 1.77 g |
| 1M KH2PO4 | 1.2 mM | 6 mL |
| MgSO4 × 7H2O | 1.2 mM | 1.46 g |
| H2O | n/a | 994 mL |
| Total | n/a | 1000 mLmL |
Prepare in a volumetric flask and filter to 0.2 μm in laminar flow cabinet; store at 4°C for up to 12 months.
Pre-Imaging Buffer (2% BSA)
| Reagent | Final concentration | Amount |
|---|---|---|
| 5× Salt solution | 1× | 200 mL |
| NaHCO3 | 5.0 mM | 420 mg |
| 18% /BSA solution | 2.0% | 111.1 mL |
| NaHEPES/NaOH stock | 10 mM | 10 mL |
| Glucose | 10 mM | 1.8 g |
| CaCl2 stock | 2 mM | 2 mL |
| ddH2O | n/a | 676.9 mL |
| Total | n/a | 1000 mL |
Prepare in laminar-flow hood; equilibrate with air for 20 min and adjust/ensure pH is stable at 7.4. Filter to 0.2 μm in laminar flow cabinet, aliquot and store in 50 mL polypropylene conical tubes at −20°C for up to 12 months.
Imaging Buffer (0.25% BSA)
| Reagent | Final concentration | Amount |
|---|---|---|
| 5× Salt solution | 1× | 200 mL |
| NaHCO3 | 5.0 mM | 420 mg |
| 18% /BSA solution | 0.25% | 13.9 mL |
| Glucose | 10 mM | 1.8 g |
| NaHEPES/NaOH stock | 10 mM | 10 mL |
| CaCl2 stock | 2 mM | 2 mL |
| ddH2O | n/a | 774.1 mL |
| Total | n/a | 1000 mL |
Prepare in laminar-flow hood; equilibrate with air for 20 min and adjust/ensure pH is stable at 7.4. Aliquot and freeze in 50 mL polypropylene conical tubes; store at −20°C for up to 12 months.
Setup for the microscope
-
•
Excitation light is derived from a Sutter DG4 fitted with 402/15 nm, 480/10 and 577/25 nm band-pass excitation filters in positions 1–3 (Figure 2A).
-
•
Light from the DG4 is delivered via liquid light guide to an Olympus IX70 inverted microscope fitted with an Olympus UApo N 340 oil immersion 40× objective and cube-mounted 59022bs-UV dichroic (Figure 2B).
-
•
Emission light passes through the IX70 side-port through an FW1000 filter wheel containing a 525/30 nm emission filter (Figure 2C).
-
•
Light is detected using a 512 × 512 pixel Photometrics EM 512 EMCCD camera.
-
•
Frequency switching and recording should be capable of recording a set of three frequencies at three second intervals.
Alternatives: There are many alternatives to this epifluorescence microscopy setup including custom and commercially available systems. The critical components center around optical efficiency & specificity, such as the high NA objective, sensitive camera, and specific optical filters. A possible improvement would be to select a 500/30 nm emission filter to enhance Grx1roGFP2 signal. However, this is less optimal when alternative cpYFP-derived probes, e.g., the H2O2 sensor HyPer, are used.
Figure 2.

Optical setup of fluorescence microscope
(A) Excitation spectra of fluorophores with complementary excitation filters.
(B) Transmission spectra of dichroic filter.
(C) Emission spectra of fluorophores with complementary emission filter.
Step-by-step method details
Preparing cells for imaging
-
1.Day 1: Preparation of poly-D-lysine coated coverslips
-
a.Coating promotes cell adhesion and ensures cells are not washed off the coverslip during washing steps with imaging buffer and limits cell movement during lengthy imaging.
-
i.Alternatives to coverslips are available. Culture dishes with pre-installed coverslips are convenient alternative provided thicknesses and coatings are suitable.
-
i.
-
b.Immerse 100 25 mm No1.5 coverslips in 70% ethanol one-by-one to ensure full contact with both sides. Cover and let soak for 1 h minimum.
-
i.Coverslip thickness should be matched to the objective in use. For the Olympus UApo N 340 40×/1.35 Oil immersion objective used in this guide a thickness of 0.17 mm is specified, this corresponds to No 1.5.
-
i.
-
c.Allow coverslips to fully dry in sterile laminar-flow cabinet by propping them against the edge of individual open 35 mm cell culture dishes.
-
d.Create 0.1M sodium borate buffer
-
i.Dissolve 3.1 g boric acid 4.35 g sodium borate dissolved into 800 mL 18.2 MΩ water, check/adjust to pH 8.5, make up to 1 L. F
-
ii.Filter to 0.2 μm, store at 4°C for up to 6 months.
-
i.
-
e.Dilute 5 mL 10× poly-D-lysine solution to 1× using (45 mL) sterile 0.1M Borate buffer, mix well.
-
f.Move each dry coverslip to sit horizontally in the culture dish and add 500 μL 1× poly-D-lysine solution to each coverslip surface. Incubate for 15 min at RT.
-
g.Wash twice with 2 mL 18.2 MΩ water per coverslip before exposing to sterilizing UV for 1 h.
-
h.Replace lids of coverslip-containing culture dishes, and store coverslips in a sterile environment at 4°C–25°C for up to 14 days.
-
a.
-
2.Day 2: Seeding cells for imaging
-
a.Seed 30,000–40,000 in 300 μL cell culture medium per coverslip. Place in incubator for attachment.
-
b.Confirm attachment at ∼4 h by microscopy and add standard cell culture media to a total of 2 mL/35 mm dish.
-
a.
-
3.Transfecting cells with interorganelle linkers with Lipofectamine TM 3000
-
a.Remove Lipofectamine 3000 kit reagents from 4C and transfer to wet ice, read instructions.
-
b.Ensure plasmid DNA is purified to a high standard and resuspended to a concentration >1 μg/uL. Low concentration DNA dissolved in TE buffer can lead to excessive EDTA.
-
c.Add a total of 1 μg of plasmid DNA per coverslip to a 1.5 mL Eppendorf tube. Results improve when the DNA is biased toward the ER-surface targeted linker, e.g., 0.6g ER + 0.4g OMM.
-
d.Add 100 μL Opti-MEM per coverslip, gently mix before adding 1 μL P3000 per coverslip before mixing again.
-
e.To a second tube, add 100 μL Opti-MEM and 1 μL Lipofectamine 3000 per coverslip, mix well by vortex.
-
f.Combine the contents of the tubes, mix by inverting and incubate for 15–30 min.
-
g.Add 200 μL transfection solution dropwise to the 2 mL media of each coverslip and incubate for a minimum of 24 h, preferably 36 h before imaging. No media changes are necessary with Lipofectamine 3000.
-
a.
Detecting redox signals using fluorescence microscopy
-
4.Prepare calibration/stimulation solutions
-
a.200 mM H2O2 solution in 1 mL water in a 1.5 mL Eppendorf tube. Store on ice up to 8 h.
-
b.Prepare 1 M dithiothreitol (DTT) solution in 1 mL water in a 1.5 mL Eppendorf tube. Store on ice, replace every 3 h.
-
a.
-
5.Loading cells with tetramethylrhodamine, methyl ester (TMRM, ΔѰm indicator) and targeting Grx1roGFP2 to the ER-mitochondrial interface. (Figure 3)
-
a.Pre-warm pre-imaging/imaging solutions in 37°C water bath.
-
b.Create a 25 μM solution of TMRM in DMSO via serial dilution in a laminar flow cabinet.
-
c.Remove cell culture media from coverslip and wash with 2% BSA pre-imaging buffer (3b).
-
d.Incubate coverslip in 2 mL pre-imaging buffer containing a working concentration of 25 nM of TMRM for 30 m–5 mm above the water in a 37°C shaking water bath set at 25 spm.
-
e.Ensure all subsequent washing/imaging solutions contain working TMRM concentration of 25 nM.
-
f.Clean Attofluor cell chamber and gasket with surgical instrument cleaner, 70% ethanol and distilled water to prevent contamination from previous experiments.
-
g.Wash coverslip with imaging buffer and transfer coverslip to cell chamber using fine forceps and add 1 mL imaging buffer including 25 nM TMRM.
-
h.Carefully clean the lower surface of the coverslip with Kimtech wipes to ensure a completely contamination free surface and check for leaks.
-
i.Place the imaging chamber in a heated stage insert and add a drop of low fluorescence immersion oil to the objective.
-
j.Use brightfield transmitted light to focus the microscope on the cell field then use the 480 nm excitation to locate cells with bright ER-dominant Grx1roGFP2 fluorescence.
-
k.Adjust the Grx1roGFP2 fluorescence with intensity/duration so that 402 nm emission is ∼1/2, 480 nm is ¾ and TMRE approx. 1/6–1/4 (10–15,000) of the 65,535 dynamic range of the 16-bit camera.
-
l.Using 2–6 s interval time lapse, record a baseline to establish the stable equilibration of TMRM.
-
m.While recording remove ∼30% imaging solution, add 100 nM rapamycin and return to the imaging chamber and mix well.
-
n.Cells with ER-dominant Grx1roGFP2 distribution can be seen to re-arrange in in ∼80% cells indicating successful co-transfection with OMM-targeted Grx1roGFP2. In HepG2 cells 3 min rapamycin incubation generates robust targeting.
-
o.Stop linker reaction by removal of rapamycin and incubation with 2 μM FK506 for 5 min before replacing the imaging solution.
-
p.Allow approx. 5 min to ensure imaging chamber/solution is up to temperature and recovered from the mechanical stimulation from solution changes.
-
a.
-
6.Epifluorescence imaging
-
a.Set the time lapse imaging protocol to record image sets at <10 s intervals. Timing is experiment dependent, median oxidative burst duration is ∼15 s. Time resolution for kinetics etc. must be balanced with phototoxicity in long experiments. Similarly, 1 or 2× pixel binning may be chosen depending upon spatial resolution requirements. The Photometrics Evolve 512 camera has a pixel size of 16 μm which translates to a 400 × 400 nm pixel size with the 40× objective and no binning.
-
b.Oxidative bursts follow flickers, transient depolarizations of the ΔѰm. These may be stimulated with oligomycin (2.5 μg/mL) or staurosporine (2 μM) with onset ∼10 min post addition.
-
a.
-
7.Calibration of Grx1roGFP2 (Figure 4)
-
a.At the end of the experiment, Grx1roGFP2 should be subject to complete reduction and oxidation to calibrate the obtained data.
-
i.To reduce Grx1roGFP2, remove ∼300 μL media. add 1 mM DTT from 1M stock solution, add back with careful mixing and monitor Grx1roGFP2 emission wavelengths. When stable, add a second 1 mM pulse, if no further response is observed this verifies complete reduction of the probe.
-
ii.Complete oxidation requires wash-out of the DTT using 3–4 chamber volumes of 200 μM H2O2 made from 200 mM stock solution and pre-warmed imaging media. Once Grx1roGFP2 emission appears stable, add a second pulse of H2O2, if the probe is completely oxidized no further ratio change will be observed. TMRM concentration should be constant throughout.
-
i.
-
a.
-
8.Normalization of TMRM signal.
-
a.After calibration of Grx1roGFP2 (step 7) mitochondria should be depolarized by addition of 10 μM FCCP and 2.5 μg/μL oligomycin while 25 nM TMRM is maintained in all solutions.
-
b.Continue to collect images to monitor TMRM fluorescence which should show an extremely rapid decrease in mitochondria.
-
c.TMRM will move from mitochondria to the cytosol causing a temporary elevation in signal. Maintain image collection long enough so that the TMRM equilibrates across the plasma membrane to establish a lower limit.
-
a.
Figure 3.

Probe targeting in HepG2 cells
(A) HepG2 cells with TMRM loaded mitochondria (upper) expressing ER-surface and OMM-surface Grx1roGFP2 linkers (lower) before (left) and after (right) targeting to the ER-mitochondrial interface with rapamycin.
(B) Enlarged region of A showing morphology rearrangement of ER-dominant Grx1roGFP2 signal in the lower cell with no response in the upper. Scale bar: 10 μm (A) & 5 μm (B).
Figure 4.

On Stage calibration of Grx1roGFP2
Individual wavelength responses of a single HepG2 cell expressing ER-M Grx1roGFP2 & OMM-Grx1roGFP2 targeted to the ER-mitochondrial interface. Grx1 is fully reduced through addition of 1mM DTT. A second DTT addition is used to ensure complete reduction of the probe as shown by increase of the F480 emission signal and decrease of the F402 nm signal shown as fluorescence arbitrary units. The DTT containing imaging solution is replaced by multiple washes and addition of 200μM H2O2. A second pulse of H2O2 is added to ensure full oxidation as shown by a decrease of the F480 nm emission and increase of the F402 nm emission.
Analyzing flickers and oxidative bursts
This step will process microscope time lapse image files to remove background noise and movement using Fiji (ImageJ). The processed images will be used to identify flicker events and subsequent oxidative bursts and assign regions of interest (ROIs) to extract spatiotemporal information from the events.
-
9.Convert microscope files from each wavelength to .tif format using Fiji (ImageJ) and open as 3 independent image stacks derived from the 402 nm, 480 nm & 577 nm excitation wavelengths.
-
a.Ensure ImageJ image is calibrated with microscope settings: Analyze>Set Scale. Our pixel size = 0.4 μm. Alternatively, many microscope software programs include metadata which will automatically set the scale when images are imported using BioFormat.
-
b.Although whole cell fields can be processed, cropping the image stacks to a single cell area (∼150 × 150 pixels or 60 × 60 μm) aids simplicity.
-
c.Subtract background
-
i.Use a selection tool to select an area that is clear background in the entire time course of all three wavelength image stacks.
-
ii.Run the menu command Process>Subtract background for each image stack.
-
i.
-
d.Multiwavelength registration
-
i.Install MultiStackReg 1.45 by dragging and dropping “Multistackreg1.45.jar” into imageJ/FIJI “plugins” folder and restarting the program.
-
ii.Select the brightest, most stable stack, usually the 480 nm emission of reduced Grx1roGFP2, and run the menu command Plugins>Registration>MultiStackReg (Thevenaz et al., 1998). Ensure the correct stack is selected and using default “Rigid Body” and with “Save Transformation File” selected, save the file under a suitable name, and apply registration.
-
iii.Apply the saved transformation parameters to the two remaining stacks by running MultiStackReg again and selecting “Load Transformation File”. This process will ensure image stability and prevent movement artifacts, particularly from experiments with multiple positions on movable stages.
-
i.
-
e.Apply median filter. On each image stack select Process>Filters>Median3D. Selecting X:2 Y:2 Z:2. Example of processed movie: Methods video S1Methods video S1. Analyzing flickers, related to step 9 TMRMDownload video file (286.5KB, mp4)
-
f.Create a different image stack for flicker detection.
-
i.Create a copy of the 577 nm (TMRM) stack, convert to 8-bit, select Edit>Image Type>8 bit, and save with a suitable name, as information is lost when converting 16>8-bit.
-
ii.Run Analyze>Multi Kymograph>Stack Difference and select 1 frame difference. Rename/save the resultant stack.
-
iii.Denoise by running Process>Noise>Remove Outliers. A good starting point is Radius: 2 Threshold 5. Use preview function to check useful information is not lost. Example processed movie: Methods video S2Methods video S2. Analyzing flickers, related to step 9 TMRM Difference image analysisDownload video file (100.7KB, mp4)
-
i.
-
g.Move through the image stack frame-by-frame to identify and draw ROIs for flicker events.
-
i.Adjust brightness and contrast so that flickers are clearly visible.
-
ii.Draw ROIs manually using polygon selection tool or consider magic wand tool with careful adjustment.
-
iii.Save each ROI to the ROI manager (t) and save the complete ROI set at the end.
-
iv.Use ROI set to make measurements of flickers.
-
v.The ROI set can be used to make multiple measurements of the StackDifference image set, in the Results window, Set Measurements can be used to measure ROI area to indicate the mitochondrial area subject to depolarization.
-
vi.Using Set Measurements>Results>Mean gray value is used to extract time-course raw data following selection of desired ROIs and More>Multi measure in the ROI manager. Other features of Set Measurements may also be used, e.g., Min & max gray value to ensure no part of the image data is saturated.
-
vii.To normalize flicker’s fluorescence, first establish a local baseline (F0) (Figure 5). This is the stable fluorescence of the target mitochondrion preceding the flicker. Then the local minimum fluorescence (Fmin) should be established i.e., the lowest fluorescence value in the target mitochondrion following depolarization. Then raw fluorescence values (F) should have Fmin subtracted, and divided by the baseline value (F0). Output is expressed by the following formula:
-
i.
-
h.Use ROI set to measure oxidative bursts.
-
i.Apply each ROI to the two processed image stacks derived from the 402 nm (oxidized) and 480 nm (reduced) excitation wavelengths of Grx1roGFP2.
-
ii.Use ROI manager>more>multi measure with Results>Set Measurements>Mean Gray Value checked.
-
iii.Copy and paste values into a spreadsheet and create ratio of F402/F480. In this configuration increased ratio, represents an increase in the GSSG:GSH ratio, an oxidation of the glutathione pool.
-
iv.Calibrate the Grx1roGFP ratio output using the values from the same ROI in fully reduced & oxidized conditions (step 7). Output should be expressed via the following formula:CRITICAL: Regions of interest (ROIs) should be carefully checked to ensure that they consistently represent the underlying region of cell. Mitochondrial dynamics provide the possibility of mitochondria moving into/out of an ROI or undergoing fusion/fission that might compromise the fluorescence data and subsequent analysis. Slight movement of the target region can be somewhat offset by enlarging the ROI to cover the whole area pre/post movement.
-
i.
-
a.
Figure 5.

Examples of mitochondrial flicker analysis
(A) two flickers of the same organelle, A and B identified by difference image analysis. Each have stable pre-flicker fluorescence values (F0A and F0B), maximum depolarization (FminA and FminB). Half-Max depolarization is calculated and marked for each flicker (Half-MaxA and Half-MaxB). Initiation for both flickers is derived from the time of Half-Max depolarization.
(B) Fluorescence values and time points given for flickers A and B in panel A.
Expected outcomes
Cells with Grx1roGFP2 successfully targeted to the interface should exhibit local changes in Grx1roGFP2 oxidation state following mitochondrial flickers both spontaneously and in response to stimulation with oligomycin or staurosporine, shown in “Methods video S1 Analyzing Flickers and Oxidative Bursts Related to Step 9”. Difference Imaging Analysis of the TMRM signal easily highlights flickering events as shown in “Methods video S2 Analyzing Flickers and Oxidative Bursts Related to Step 9”. These events are used to identify the initiation of the oxidative bursts as detected by a change in Grx1roGFP2 ratio, shown in Methods “Methods video S3 Analyzing Flickers and Oxidative Bursts Related to Step 9”.
Quantification and statistical analysis
-
1.Quantify oxidative burst duration, amplitude and time to peak. (Figure 6)
-
a.Identify initiation point - the time point of the Half-Max depolarization of the target mitochondrion. This is indicated by the formula: Where Fmin and F0 are fluorescence values established in Step 8. Establish Grx1rGFP2 baseline: Grx1roGFP2 ratio at Half-Max depolarization. Oxidation lags depolarization so this value is usually the same as the pre-flicker value but controls for short/long flicker onset.
-
b.Identify the end point minus the time point of Grx1roGFP2 ratio returning to baseline or the initiation of another flicker-burst event. Oxidative bursts frequently occur in trains of repetitive oscillations (Figure 6C) which contributes to a rising basal oxidation.
-
c.Duration is calculated as the end point minus the start point.
-
d.Duration data on individual oxidative bursts should be stored with relevant companion data such that each event can be traced to the imaging data so that information such as time after stimulation, or iteration can be monitored.
-
e.Amplitude is calculated by subtracting the baseline value (b) from the peak value.
-
f.Time to peak is calculated by subtracting the initiation point from the time at peak Grx1roGFP2 ratio.
-
a.
-
2.Statistical analysis of oxidative burst parameters
-
a.Adjust experimental plan to data requirements. Oxidative bursts vary greatly in frequency, under staurosporine stimulation an average of six bursts/minute/cell may be expected with a typical 89 × 89 μm cell field. In these conditions ∼30 cells drawn from 3 independent transfections will generate large datasets. In unstimulated conditions flicker frequency can be reduced by 50–100 fold.
-
b.Parameters such as duration, amplitude and time to peak do not generate normally distributed data for either oxidative bursts or flickers. Many data, e.g., duration show a relationship whereby amplitude is proportional to 1/frequency. For these data, standard t-test and ANOVA strategies are not advised.
-
i.For independent pairwise comparisons, e.g., Cell genotype A Vs B, Mann-Whitney & Wilcoxon rank sum tests are suitable.
-
ii.For comparison of matched samples, e.g., cells before Vs after treatment, a Wilcoxon signed rank test is appropriate.
-
iii.For repeated measures, e.g., sequential bursts originating in the same mitochondrion, a Friedman test is suitable.
-
i.
-
c.We present data in graph form for the maximum possible transparency, e.g., histograms/scatter plots to give a good representation of the dataset. Where group comparisons are necessary, boxplots are a good strategy to convey the spread/skew in the data.
-
a.
Figure 6.

Mitochondrial membrane flickers and oxidative bursts evoked in HepG2 cells after stimulation with Staurosporine
(A) Example images from Difference Image Analysis. showing individual flickers and regions of interest (ROIs) selected around them. Area based on 0.4μm2 pixel size.
(B) Graph showing area of flickers Vs. time following stimulation (Staurosporine, 2μM at t= 5mins)
(C) Sample traces of repeated oxidative bursts derived from flicker ROI masking of Grx1roGFP2 fluorescence emission.
Limitations
Using TMRM to track mitochondrial flickers works well in ideal conditions, however, as a single-wavelength indicator the probe is subject to problems differentiating between depolarization events and mitochondrial motility. This problem is minimized under stimulation protocols since the flicker signals are robust and mitochondrial motility is inhibited. However, due to the limited diffusion characteristics of TMRM, partial or short-lived flicker events may not generate enough signal to be easily separated from motility artifacts. Similarly, attention must be paid to the behavior of TMRM loading in each model system, we find that TMRM loads into HepG2 cell mitochondria in a uniform manner. However, models where mitochondrial heterogeneity is to be expected – such as stress/disease models or models involving variable plasma membrane potentials – e.g., excitable cell types are likely subject to a wide range of potential artifacts with the distribution of TMRM fluorescence. Furthermore, the literature reports varied levels of ΔѰ-independent TMRM binding in different cell models. In such cases, careful use of an uncoupling protocol (Figure 7; Problem 1) should be used to establish the ΔѰ-dependent dynamic range in each model. A genetically-encoded ratiometric probe for mitochondrial membrane potential with roGFP-compatible spectra would be the ideal solution to this.
Figure 7.

Potential pitfalls of imaging mitochondrial membrane potential with TMRM
(A) Cells treated with a depolarization cocktail (FCCP: 5 μM & Oligomycin: 2.5 μg/μL) show an immediate transition from a mitochondrial fluorescence distribution (t = 0 min) to a less-specific whole-cell fluorescence (t = 1 min). Following rapid loss of the mitochondrial distribution, TMRM fluorescence persists for many minutes (t = 5 min). Scale bar: 10 μm.
(B) Line graph depiction of (A) in which FCCP & Oligomycin (addition indicated by arrow at 0 min) cause a rapid redistribution of TMRM fluorescence from the mitochondrial matrix (Red) to the cytosol (blue) where it is slowly lost from the whole cell region (Black). Detail of the redistribution is shown in expanded timescale (total: 90 s. Inset). The loss of TMRM fluorescence from the whole cell region may have a slow kinetic generating an artificially high Fmin (Dashed line). Replenishment of the imaging buffer (arrow at 6:30 s) speeds TMRM loss to generate a more accurate Fmin (Dotted line).
(C) Section of a HepG2 cell undergoing mitochondrial flickers stimulated by staurosporine. Transient loss of ΔѰm causes a rapid loss of TMRM fluorescence (M1, t = 19, pseudo color difference: Red) in the active mitochondrion. TMRM leaving the flickering mitochondrion is visible as a cloud of increased fluorescence in the surrounding cytosol (t = 19 pseudo color: Blue). Cytosolic fluorescence of released TMRM decreases (t = 21 s pseudo color: Red) as it is taken up by neighboring polarized mitochondria (M2, t = 21 s pseudo color: Blue), which declines upon the repolarization of the flickering mitochondrion (M1, Blue, M2, Red). Scale Bar 5μm.
(D) Line graph of 3 regions of interest (Flickering mitochondrion: M1, stable mitochondrion: M2 & extramitochondrial region of cytosol: Cyto). Demonstrating loss of TMRM from M1 to the cytosol and subsequent uptake to the polarized M2. Restoration to the starting distribution begins after repolarization of M1 (t = 20 s).
The targeting of Grx1roGFP2 to the interface with rapamycin-inducible linkers is extremely well suited to the investigation of redox signals, which are robust at the nanometer scale but are near-undetectable in the bulk cytosol. While the 2D morphology is not affected by these strategies, linker targeting introduces fixed physical tethers. As such, long-term measurements may interfere with the fundamentally dynamic nature of the organelles concerned. Furthermore, the ratio of the linker halves is subject to variation derived from plasmid/viral delivery mechanisms, cell expression, targeting and degradation pathways. While most of the probe (we estimate ∼80%) concentrates to the ER-mitochondrial contact sites, a portion remains outside. To combat this, genetic variation could be eliminated using a bicistronic construct to ensure balanced stoichiometry.
Grx1roGFP2 is a probe that senses the GSSG:GSH ratio in a cell which makes it useful to detect multiple redox inputs that converge on the glutathione pool. However, this means common experiments used to deplete the glutathione pool (e.g., buthionine sulfoximine) are unsuitable. Similarly, the dependence on glutathione means the probe is unable to distinguish between generation of specific oxidants and changing supply of reducing equivalents, e.g., NADPH.
Troubleshooting
Problem 1
Mitochondrial TMRM signals behave inconsistently or opposite to that expected following loading procedure (step 5).
Potential solution
The use of TMRM as an indicator of (ΔѰm) should be approached with care and after consideration of carefully conducted previous studies (Gerencser et al., 2012, O’reilly et al., 2003). Particularly the loading (step 5) and calibration (step 8). The distribution of TMRM in cells is due largely to the relative Voltage distribution across membranes. In cells with high plasma membrane potentials TMRM accumulates at relatively high concentrations in the cytosol. The mitochondria concentrate this still further, raising the possibility that fluorescence quenching will cause an inverse relationship between concentration and emission. Depolarization of the mitochondria reverses this effect causing a “dequench” transient increase in signal, while this is a viable approach (Duchen et al., 1998), transition between the modes likely occurs. To avoid this, TMRM equilibration concentrations should be adjusted. At the end of an experiment, addition of the protonophore FCCP should cause a depolarizqgnal for normalization purposes (step 8, Figure 7), TMRM may equilibrate slowly with the extracellular space, causing a false minimum signal (B, dashed line). Washing the cells 2× with imaging solution containing FCCP, oligomycin (B, 2nd arrow) and 25 nM TMRM generates a minimum fluorescence (B, dotted line) more in line with expectations. The TMRM accumulated by all mitochondria may raise the extracellular concentration when released wholesale by FCCP/oligomycin treatment.
Flicker activity generates similar possible artifacts at a subcellular scale. During a flicker event, TMRM signal can be seen to quickly decrease in the target mitochondrion (Figure 7C, t = 19, red &D dark red). However, this is released to the region surrounding the organelle and is observed as an increase in extramitochondrial TMRM concentration and fluorescence (Figure 7C, t = 19, blue &D blue). The excess TMRM is quickly sequestered by neighboring polarized mitochondria leading to increased fluorescence in those mitochondria (Figure 7C, t = 21). It should be noted that this does not represent an increased ΔѰm in those mitochondria. To combat this, careful organelle specific ROIs must be used to extract information from only the flickering organelle. Insufficiently specific ROIs will generate poor quality signal data.
It should also be noted that TMRM is variously reported as demonstrating Voltage-independent binding such that a component of fluorescence remains following depolarization of mitochondria. This appears to vary based on cell types and other conditions. To combat this, more robust pharmacological interventions may be attempted; addition of rotenone and antimycin.
Problem 2
Cells undergo progressive flickering and oxidative burst generation in the absence of stimulation during recording (step 6).
Potential solution
Excessive flickering in the baseline recordings (step 6) may suggest phototoxicity, this should always be a concern in the design of fluorescence microscopy experiment. Steps to avoid or mitigate this include: The optimization of the optical setup, including the use of a high-sensitivity EMCCD camera, high N.A. objective, efficient and spectrally optimized dichroic mirrors, and band pass filters to minimize the excitation light necessary for sufficient output signal. However, careful control experiments should always be included to rule out the effect of the imaging alone. We routinely perform time-control experiments where HepG2 cells expressing Grx1roGFP2 and loaded with TMRM are imaged in the same conditions as cells subject to stimulation with staurosporine. In this setting we see no significant change in flicker activity or mitochondrial morphology with >1 h imaging. Should any effect be evident, a reduction in total excitation light is necessary. This can be achieved through decreasing the time resolution (increased sampling interval) and decreasing excitation light exposure time or intensity using neutral density filters. Compensatory increases in signal output may be achieved through pixel binning at the cost of spatial resolution. For these reasons, extra care should be taken to control for phototoxicity when using higher light imaging methodologies such as confocal laser scanning microscopy. Avoid media that protect cells from phototoxicity since they can contain antioxidants that will interfere with the measurements.
Problem 3
Linker targeting to the ER-mitochondrial interface with rapamycin is not clear (step 5).
Potential solution
Targeting the same fluorophore to both the ER surface and outer surface of the OMM (step 5) allows the best concentration of probes to the interface. However, if the expression level of the ER surface component is low relative to the OMM then it will be difficult to visualize. We use titration of the plasmid DNA in favor of the ER-surface construct for two reasons: firstly, as a strategy to promote ER-dominant fluorescence which is favorable for observing rapamycin-induced targeting (Figure 3). Secondly, to maintain mitochondrial morphology. The sequence used to target the OMM linker is a fragment of the AKAP1 protein (34–63) which works well under conditions of modest expression. However, at high levels of overexpression mitochondrial morphology is compromised leading to large aggregations of mitochondria. Under these conditions, the ER-mitochondrial interface is likely compromised, and successful linker-targeting and measurements are unlikely. In HepG2 cells, a rapamycin incubation of 3 min at 37°C is sufficient for robust linker targeting, this is similar across a range of adherent cultured cells e.g., HEK293 and MEF. Ultimately each cell type should be tested to establish appropriate targeting protocol. Should further troubleshooting be necessary, the system may be tested using spectrally separated components, e.g., OMM & ER-targeted linkers equipped with RFP. These can be used to independently confirm the function of each Grx1roGFP2 probe. It is also possible in some cell types that mitochondrial & ER/SR structure prevents the close approach necessary for linker heterodimerization. To work around this ER & OMM linkers incorporating 1, 9 & 18 repeats of a spacer helix have been developed that could adapted for Grx1roGFP2 (Csordas et al., 2010).
Problem 4
The use of rapamycin-induced probe targeting (step 5) methods is incompatible with experiments that involve mTOR signaling pathways.
Potential solution
Redox signaling and mTOR pathways likely interact at many points and present interesting opportunities for investigation. As presented, the current protocol involves the use of relatively low concentrations (100 nM) of rapamycin for short periods (1–5 min). However, ER-surface probes containing the T209L mutant of FRB are under development. These probes dimerize in response to “rapalogs” analogs of rapamycin that do not cross-react with the endogenous FRB domain of mTOR.
Resource availability
Lead contact
Further information and requests for resources and reagents should be directed to and will be fulfilled by the lead contact, Gyorgy Hajnoczky: (gyorgy.hajnoczky@jefferson.edu).
Materials availability
This study does not generate any novel reagents.
Acknowledgments
The work was supported by NIH training grant 5T32AA007463-33 and NIH grants CA216254, GM59419, and ES025672 and Foundation Leducq Mitocardia grant.
Author contributions
The protocol was written by D.B. utilizing comments of G.H.
Declaration of interests
The authors declare no competing interests.
Footnotes
Supplemental information can be found online at https://doi.org/10.1016/j.xpro.2021.101119.
Contributor Information
David M. Booth, Email: bs0u0155@gmail.com.
György Hajnóczky, Email: gyorgy.hajnoczky@jefferson.edu.
Data and code availability
This study does not generate any novel dataset/code.
References
- Booth D.M., Enyedi B., Geiszt M., Varnai P., Hajnoczky G. Redox nanodomains are induced by and control calcium signaling at the ER-mitochondrial interface. Mol. Cell. 2016;63:240–248. doi: 10.1016/j.molcel.2016.05.040. [DOI] [PMC free article] [PubMed] [Google Scholar]
- Booth D.M., Varnai P., Joseph S.K., Hajnoczky G. Oxidative bursts of single mitochondria mediate retrograde signaling toward the ER. Mol. Cell. 2021 doi: 10.1016/j.molcel.2021.07.014. [DOI] [PMC free article] [PubMed] [Google Scholar]
- Csordas G., Varnai P., Golenar T., Roy S., Purkins G., Schneider T.G., Balla T., Hajnoczky G. Imaging interorganelle contacts and local calcium dynamics at the ER-mitochondrial interface. Mol. Cell. 2010;39:121–132. doi: 10.1016/j.molcel.2010.06.029. [DOI] [PMC free article] [PubMed] [Google Scholar]
- Duchen M.R., Leyssens A., Crompton M. Transient mitochondrial depolarizations reflect focal sarcoplasmic reticular calcium release in single rat cardiomyocytes. J. Cell Biol. 1998;142:975–988. doi: 10.1083/jcb.142.4.975. [DOI] [PMC free article] [PubMed] [Google Scholar]
- Gerencser A.A., Chinopoulos C., Birket M.J., Jastroch M., Vitelli C., Nicholls D.G., Brand M.D. Quantitative measurement of mitochondrial membrane potential in cultured cells: calcium-induced de- and hyperpolarization of neuronal mitochondria. J. Physiol. 2012;590:2845–2871. doi: 10.1113/jphysiol.2012.228387. [DOI] [PMC free article] [PubMed] [Google Scholar]
- Gutscher M., Pauleau A.L., Marty L., Brach T., Wabnitz G.H., Samstag Y., Meyer A.J., Dick T.P. Real-time imaging of the intracellular glutathione redox potential. Nat. Methods. 2008;5:553–559. doi: 10.1038/nmeth.1212. [DOI] [PubMed] [Google Scholar]
- Inoue T., Heo W.D., Grimley J.S., Wandless T.J., Meyer T. An inducible translocation strategy to rapidly activate and inhibit small GTPase signaling pathways. Nat. Methods. 2005;2:415–418. doi: 10.1038/nmeth763. [DOI] [PMC free article] [PubMed] [Google Scholar]
- O’reilly C.M., Fogarty K.E., Drummond R.M., Tuft R.A., Walsh J.V., JR. Quantitative analysis of spontaneous mitochondrial depolarizations. Biophys. J. 2003;85:3350–3357. doi: 10.1016/S0006-3495(03)74754-7. [DOI] [PMC free article] [PubMed] [Google Scholar]
- Thevenaz P., Ruttimann U.E., Unser M. A pyramid approach to subpixel registration based on intensity. IEEE Trans. Image Process. 1998;7:27–41. doi: 10.1109/83.650848. [DOI] [PubMed] [Google Scholar]
Associated Data
This section collects any data citations, data availability statements, or supplementary materials included in this article.
Supplementary Materials
Data Availability Statement
This study does not generate any novel dataset/code.