

Visual Abstract

Keywords: diabetes and the kidney, chronic hemodialysis, cohort studies, diabetes mellitus, hemodialysis units, Ontario, quality of care
Key Points
Little is known about diabetes care gaps and predictors in patients using in-center hemodialysis.
In Ontario, almost half of patients with diabetes on hemodialysis have diabetes care gaps; most commonly, gaps in retinopathy screening.
Significant predictors of care gaps include younger age, female sex, shorter duration of diabetes, dementia, and fewer physician visits.
Abstract
Background
Patients with diabetes receiving chronic, in-center hemodialysis face healthcare challenges. We examined the prevalence of gaps in their diabetes care, explored regional differences, and determined predictors of care gaps.
Methods
We conducted a population-based, retrospective study between January 1, 2016 and January 1, 2018 in Ontario, Canada. We included adults with prevalent diabetes mellitus receiving in-center hemodialysis as of January 1, 2018 and examined the proportion with (1) insufficient or excessive glycemic monitoring, (2) suboptimal screening for diabetes-related complications (retinopathy and cardiovascular screening), (3) hospital encounters for hypo- or hyperglycemia, and (4) hospital encounters for hypertension in the 2 years prior (January 1, 2016 to January 1, 2018). We then identified patient, provider, and health-system factors associated with more than one care gap and used multivariable logistic regression to determine predictors. Further, we used geographic information systems to explore spatial variation in gaps.
Results
There were 4173 patients with diabetes receiving in-center hemodialysis; the mean age was 67 years, 39% were women, and the majority were of lower socioeconomic status. Approximately 42% of patients had more than one diabetes care gap, the most common being suboptimal retinopathy screening (53%). Significant predictors of more than one gap included younger age, female sex, shorter duration of diabetes, dementia, fewer specialist visits, and not seeing a physician for diabetes. There was evidence of spatial variation in care gaps across our region.
Conclusions
There are opportunities to improve diabetes care in patients receiving in-center hemodialysis, particularly screening for retinopathy. Focused efforts to bring diabetes support to high-risk individuals might improve their care and outcomes.
Introduction
Approximately 11,000 patients with diabetes receive dialysis treatment for ESKD across Canada (1). These individuals experience numerous health and healthcare challenges (2). Patients on hemodialysis are among the highest at risk of diabetes-related complications, including hypoglycemia, cardiovascular disease, retinopathy, and amputation (3–5). They have a high burden of medical appointments and diagnostic tests, and juggle healthcare visits with dialysis treatments three times per week (2). They are frequently hospitalized (6,7), take many medications, have difficulty with adherence, and often feel poorly (2,8). With lower levels of education and income, they frequently struggle with diabetes self-management (9). These individuals are at risk of gaps in their diabetes healthcare.
Although diabetes care gaps have been examined in the general CKD population (10,11), and small studies have investigated glycemic control in those using hemodialysis (12), there has yet to be a comprehensive examination of diabetes care gaps in patients on in-center hemodialysis with publicly funded healthcare. Knowledge of care gaps in this unique, high-risk population can support the creation of targeted interventions to improve patient care and outcomes. For example, if gaps in hypoglycemia are identified, patients might receive targeted education and self-management support about hypoglycemia avoidance. If it is observed that patients are not receiving diabetes-related laboratory testing, best practices might be reviewed with care professionals who manage this patient population. If patients using dialysis are not visiting physicians for diabetes care, outreach opportunities might be explored (e.g., remote diabetes support).
In this study, we examined diabetes care gaps in patients receiving chronic, in-center hemodialysis in Canada's most populous province (Ontario, Canada), and identified modifiable predictors of care gaps. We hypothesized that patients receiving in-center hemodialysis would experience gaps in their diabetes care, and that those with sociodemographic challenges and less frequent healthcare might be at higher risk of gaps.
Materials and Methods
Design and Setting
We conducted a population-based, retrospective study in Ontario, Canada between January 1, 2016 and January 1, 2018. Ontario has >14 million residents who have universal access to hospital and physician services. Those ≥65 years have universal access to medications covered by the Ontario Drug Benefits (ODB) Program. Information on their use of health services is held in secure administrative databases available for access at ICES.
ICES is an independent, nonprofit research institute whose legal status under the Information and Privacy Commissioner of Ontario allows it to collect and analyze healthcare and demographic data, without individual-level patient consent, for health-system evaluation and improvement. The use of data in this project was authorized under Section 45 of Ontario's Personal Health Information Protection Act, which does not require review by a research ethics board. Our study followed the Reporting of studies Conducted using the Observational Routinely-collected Data statement (Supplemental Table 1) (13).
Patients
We identified adults, age ≥18 years, with prevalent diabetes who were receiving in-center hemodialysis on our index date (January 1, 2018). We excluded non-Ontario residents; those >105 years; and those who had evidence of death, withdrawal from dialysis, or transplant before the index date. To facilitate a 2-year “look-back” period for care gaps, we also excluded those with a diabetes diagnosis <2 years and those who used in-center hemodialysis for <2 years from the index date.
Data Sources
We used databases available at ICES to conduct our study. These datasets were linked using unique, encoded identifiers and analyzed at ICES. We captured vital statistics and demographics from the Registered Persons Database of Ontario. This database contains information for all those issued an Ontario health card. Diabetes status was ascertained from the Ontario Diabetes Database, which defines diabetes by receipt of two outpatient diagnostic codes for diabetes, one drug claim for a diabetes medication, or one hospitalization with diabetes within a 1-year period (14). Compared with medical-chart review, this algorithm has a sensitivity of 90% and specificity of 98% in adults (15). We used the Ontario Renal Reporting System (ORRS) to capture use of in-center hemodialysis and the characteristics of patients using dialysis. In Ontario, all dialysis providers submit activity data on the use of acute and chronic dialysis services to the ORRS to improve health-system quality, performance, and planning (16).
We captured additional descriptors from the Ontario Marginalization Index database, a geographically based index that quantifies degrees of marginalization. Measures include residential instability (e.g., living alone, multiunit housing), material deprivation (e.g., low income, unemployment), dependency (e.g., age ≥65 years), and ethnic concentration (e.g., recent immigrant, visible minority) (17,18). We used the Canadian Institute for Health Information's Discharge Abstract Database and the National Ambulatory Care Reporting System Database for medical diagnoses and receipt of procedures during inpatient and emergency-department visits, respectively (via International Classification of Diseases Tenth Revision codes and Canadian Classification of Health Intervention Codes).
We also used datasets derived from validated case definitions of comorbidities, including the ICES Congestive Heart Failure (19), Chronic Obstructive Pulmonary Disease (20), Hypertension (21), and Dementia datasets (22,23). We used the Canadian Organ Replacement Registry to determine the transplant status of patients.
To present health-services use, we used the Ontario Health Insurance Plan database, which is a collection of physician diagnostic and billing codes. For visits to physicians and family physician roster status (i.e., registration status with a family physician for the provision of health services), we used the ICES Physician's Database, Corporate Provider Database, and the Client Agency Program Enrollment Database. We used the Ontario Laboratories Information System Database for laboratory data, including hemoglobin A1c (HbA1c) levels (24). For those aged ≥65 years, we also used the ODB database and the Drug Identification Number database for prescription medications. A list of study variables, related administrative codes, and originating data sources is included in Supplemental Table 2.
Primary Outcome
We examined measurable, intervenable diabetes care gaps in the 2 years before January 1, 2018 (i.e., January 1, 2016 to January 1, 2018). Although we recognize that best diabetes practices in patients using hemodialysis is controversial, we drew upon clinical practice guidelines (25–27), previous care quality assessments (28,29), and clinical expertise to define gaps. We chose gaps based upon Donabedian's (30) framework (structure, process, and outcomes). We selected a look-back rather than a “look-forward” period to define gaps, because we felt this to be most clinically relevant (care providers inquire about past diabetes screening and management during patient encounters).
We examined the following gaps over the 2-year period: (1) no evidence of at least annual HbA1c testing, (2) more than eight HbA1c tests (excessive monitoring), (3) no evidence of at least one diabetes eye exam, (4) no evidence of at least one electrocardiogram or cardiac stress test, (5) hospital encounter with hypoglycemia, (6) hospital encounter with hyperglycemia, and (7) hospital encounter with hypertension. We defined hospital encounters as emergency-department visits or hospitalizations where the outcome was captured as the primary diagnosis, and we used validated coding algorithms where possible (Supplemental Table 3) (31,32). Although examined as a baseline measure, we did not include HbA1c value in our care-gap analysis because most guidelines suggest individualized glycemic targets, particularly in vulnerable populations (33,34). We also did not include use of medications or glucose test strips, because this information was only available for a subpopulation (i.e., ≥65 years).
To facilitate our predictive analysis, we then calculated a care-gap “score” for each patient. We did this by summing the total number of care gaps per person over the 2-year period (Supplemental Table 3). A higher gap score equated to lower quality of care.
Secondary Outcomes
As secondary outcomes, we identified predictors of diabetes care gaps. We focused on patient (age, sex, residential status, income, comorbidities, duration of diabetes), provider (type of physician seen for diabetes), and health-system factors (roster status with family physician, visits to specialists and family doctors, diabetes-related visits with physicians) (30). We examined predictors in the 1 year before the care-gap period. We also examined for spatial distribution in care gaps, aggregated to Local Health Integration Network (LHIN). Over the study period, LHINs were the geographic units used to plan, organize, and integrate health services in our province (35).
Statistical Analyses
We present the characteristics of included patients descriptively using means (SDs), medians (interquartile ranges), numbers, and percentages. We report individual diabetes care gaps using numbers and percentages. We describe the characteristics of those with care gap scores greater than and less than or equal to the median, and compared groups using standardized differences (differences >10% were considered meaningful) (36). We used Poisson regression to determine predictors of a gap score above the median and present relative risks (RRs) and 95% confidence intervals (CIs).
For our spatial analysis, we examined rates of care-gap scores above the median by geographic location. Crude rates were obtained by dividing the number of patients with gap scores above the median by the total eligible study population as of January 1, 2018. Due to low counts (particularly in those <49 years), there was instability in age-adjusted gap rates. As such, we display gaps by age category (18–49, 50–65, 66–74, ≥75 years). Maps were created using ArcGIS software (version 10.3). All other analyses were conducted using SAS version 9.4 (SAS Institute, Cary, NC).
Results
There were 4173 patients included in the study (flow diagram in Supplemental Figure 1). Baseline characteristics are detailed in Table 1. The mean±SD age was 67±13 years and 39% were women. Patients received hemodialysis across 26 programs.
Table 1.
Characteristics of 4173 patients with prevalent diabetes receiving chronic, in-center hemodialysis in Ontario, Canada on January 1 2018
| Characteristics | Number (%)i |
| Demographics | |
| Age | |
| Mean±SD, yr | 67±13 |
| Median (IQR), yr | 68 (59–77) |
| 18–49 years, n (%) | 413 (10) |
| 50–65 years, n (%) | 1308 (31) |
| 66–74 years, n (%) | 1127 (27) |
| ≥75 years, n (%) | 1325 (32) |
| Women, n (%) | 1627 (39) |
| Race, n (%) | |
| White | 2401 (58) |
| Black | 438 (11) |
| Other | 1320 (32) |
| Missing | 14 (0.3) |
| Family physician roster status, n (%)a | |
| Not rostered | 293 (7) |
| Rostered | 3202 (77) |
| Virtually rostered | 678 (16) |
| Income quintile, n (%)b | |
| 1 (lowest) | 1362 (33) |
| 2 | 981 (24) |
| 3 | 772 (19) |
| 4 | 588 (14) |
| 5 (highest) | 470 (11) |
| Distance from primary residence to dialysis center (km)c | |
| Mean±SD | 18.9±64.2 |
| Median (IQR) | 6.3 (3.3–13.1) |
| Marginalization index, n (%) | |
| Instability quintile | |
| 1 (lowest instability) | 626 (15) |
| 2 | 595 (14) |
| 3 | 688 (17) |
| 4 | 819 (20) |
| 5 (highest instability) | 1359 (33) |
| Missing | 86 (2) |
| Deprivation quintile | |
| 1 (lowest deprivation) | 533 (13) |
| 2 | 657 (16) |
| 3 | 724 (17) |
| 4 | 923 (22) |
| 5 (highest deprivation) | 1250 (30) |
| Missing | 86 (2) |
| Dependency quintile | |
| 1 (lowest dependency) | 808 (19) |
| 2 | 716 (17) |
| 3 | 696 (17) |
| 4 | 750 (18) |
| 5 (highest dependency) | 1117 (27) |
| Missing | 86 (2) |
| Ethnic concentration quintile | |
| 1 (lowest ethnic concentration) | 632 (15) |
| 2 | 621 (15) |
| 3 | 652 (16) |
| 4 | 758 (18) |
| 5 (highest ethnic concentration) | 1424 (34) |
| Missing | 86 (2) |
| Long-term care, n (%) | 263 (6) |
| Rural location, n (%)b,d | 446 (11) |
| Duration of diabetes before index date, yr | |
| Mean±SD | 17.6±7.4 |
| Median (IQR) | 19.0 (11.9–24.5) |
| Duration of ESKD before index date, yr | |
| Mean±SD | 5.4±5.2 |
| Median (IQR) | 3.8 (2.4–6.6) |
| Comorbidities | |
| Chronic obstructive pulmonary disease, n (%) | 1275 (31) |
| Congestive heart failure, n (%) | 2298 (55) |
| Dementia, n (%) | 379 (9) |
| Coronary artery disease, n (%) | 2595 (62) |
| Stroke, n (%) | 583 (14) |
| Foot ulcer, n (%) | 489 (12) |
| Amputation, n (%) | 294 (7) |
| Retinopathy, n (%) | 473 (11) |
| Depression and anxiety, n (%) | 374 (9) |
| Hospital encounter with hypoglycemia, n (%) | 472 (11) |
| Hospital encounter with hyperglycemia, n (%) | 18 (0.4) |
| Cancer, n (%) | 618 (15) |
| Chronic liver disease, n (%) | 608 (15) |
| Charlson score | |
| Mean±SD | 4.9±1.9 |
| Median (IQR) | 5.0 (4.0–6.00) |
| 0, n (%) | 27 (0.6) |
| 1, n (%) | 26 (0.6) |
| 2, n (%) | 413 (10) |
| 3, n (%) | 268 (6) |
| ≥4, n (%) | 3363 (81) |
| Missing, n (%) | 76 (2) |
| Healthcare utilization in the prior year | |
| Number of specialist visitsg | |
| Mean±SD | 17.2±14.0 |
| Median (IQR) | 14.0 (7.0–24.0) |
| 0, n (%) | 135 (3) |
| 1–2, n (%) | 222 (5) |
| 3–5, n (%) | 450 (11) |
| 6–11, n (%) | 885 (21) |
| ≥12, n (%) | 2481 (60) |
| Number of primary care visits | |
| Mean±SD | 8.5±11.9 |
| Median (IQR) | 6.0 (2.0–11.0) |
| 0, n (%) | 524 (13) |
| 1–2, n (%) | 687 (17) |
| 3–5, n (%) | 842 (20) |
| ≥6, n (%) | 2120 (51) |
| At least one outpatient visit for diabetes, n (%) e , h | 2349 (56) |
| Number of diabetes visitsh | |
| Mean±SD | 2.66±4.35 |
| Median (IQR) | 1.00 (0.00–4.00) |
| 0, n (%) | 1824 (44) |
| 1–2, n (%) | 839 (20) |
| 3–5, n (%) | 817 (20) |
| ≥6, n (%) | 693 (17) |
| Physician seen for diabetes care, n (%)f,h | |
| Family physician | 1291 (31) |
| Internal medicine | 326 (8) |
| Endocrinology | 719 (17) |
| Other | 13 (0.3) |
| No visit for diabetes | 1824 (44) |
| Number of unique physician visits | |
| Mean±SD | 38.7±25.0 |
| Median (IQR) | 33.0 (21.0–51.0) |
| All cause emergency department visits | |
| Mean±SD | 3.1±5.0 |
| Median (IQR) | 2.0 (1.0–4.0) |
| All cause hospitalizations | |
| Mean±SD | 3.1±3.1 |
| Median (IQR) | 2.0 (1.0–4.0) |
| At least one HbA1c value, n (%) | 3454 (83) |
| HbA1c value | |
| Mean±SD, % | 6.9±1.6 |
| ≤7%, n (%) | 2136 (51) |
| >7%, n (%) | 1318 (32) |
| Medications (≥66 yr, n=2452), n (%) | |
| Insulin or oral antihyperglycemic medication | 1460 (60) |
| Insulin | 1168 (48) |
| Oral antihyperglycemic medication | 564 (23) |
| Acarbose | 0 (0) |
| Other sulphonylurea | 0 (0) |
| Gliclazide | 207 (8) |
| Glyburide | ≤5 |
| Metformin | 25 (1) |
| Thiazolidinedione | ≤5 |
| Sodium-glucose cotransporter 2 inhibitor | ≤5 |
| Other diabetes medication | 422 (17) |
| Glucose test strips | 1197 (49) |
| Last prescriber of diabetes medication | |
| Family physician | 777 (32) |
| Internal medicine | 186 (8) |
| Endocrinology | 180 (7) |
| Nephrology | 246 (10) |
| Other specialty | 71 (3) |
| ACEi/ARB | 1080 (44) |
| Statin | 1782 (73) |
| Other lipid medication | 203 (8) |
| β-Blocker | 1429 (58) |
Cell sizes of less than six are not presented due to ICES privacy policies. IQR, interquartile range; HbA1c, hemoglobin A1c; ACEi/ARB, angiotensin-converting enzyme inhibitor or angiotensin receptor blocker; OHIP, Ontario Health Insurance Plan.
Patient rostering is a process by which patients register with a family practice, family physician, or team. It defines the population for which the primary care organization or provider is responsible (66).
To avoid small cells from being recalculated, missing income quintiles was recoded as “3.” Missing rural was also recoded as “no” (urban).
Distance from primary residence to dialysis center was calculated using great circle distances (in kilometers) on the basis of latitudes and longitudes. Equations were obtained from Statistics Canada.
The definition of rural was based on that used by Statistics Canada (communities <10,000 population).
Outpatient visit for diabetes was defined by receipt of OHIP diagnostic code 250 during an outpatient clinical encounter with a physician.
Physician seen for diabetes care was defined as the physician who billed OHIP code 250 during an outpatient physician encounter.
Specialist visits included dermatology, general surgery, neurosurgery, community medicine, orthopedic surgery, geriatrics, plastic surgery, cardiothoracic surgery, emergency medicine, internal medicine, endocrinology, nephrology, vascular surgery, neurology, psychiatry, obstetrics and gynecology, genetics, ophthalmology, otolaryngology, physical medicine, urology, gastroenterology, medical oncology, infectious disease, respiratory disease, rheumatology, optometrists, osteopaths, chiropodists, chiropractor, cardiology, hematology, clinical immunology, nuclear medicine, and thoracic surgery.
Physicians seen for diabetes visits included internists, nephrologists, endocrinologists, general practitioners, and geriatricians.
Unless otherwise indicated.
Over half of the patients were in the lowest two income quintiles and had high levels of instability, deprivation, and dependency. In addition to using hemodialysis, patients had many other medical comorbidities, including coronary artery disease and heart failure. Mean±SD duration of diabetes was 17.6±7.4 years. Mean±SD HbA1c was 6.9%±1.6% and the proportion with a mean HbA1c ≤7% was 51%.
We found 42% of patients had more than one diabetes care gap evident (Table 2). The most common gap was suboptimal retinopathy screening (53%), followed by suboptimal glycemic monitoring, as defined by at least an annual HbA1c test (34% had no evidence of an annual HbA1c). Suboptimal glycemic monitoring was also observed by use of glucose test strips in a subpopulation of older adults (1115 of 2337 or 48% of patients did not have at least an annual prescription for glucose test strips over 2 years). A total of 308 patients (7%) had no stress test or electrocardiogram in the 2 years prior. Only a small proportion of patients had hospital encounters for hypertension, hyperglycemia, or hypoglycemia (5%, 0.4% and 4%, respectively).
Table 2.
Two-year diabetes care gaps in 4173 patients using chronic, in-center hemodialysis in Ontario, Canada as of January 1, 2018
| Diabetes Care Gap | Number (%) |
| No evidence of at least annual HbA1c | 1410 (34) |
| >8 HbA1c tests | 1278 (31) |
| No evidence of retinopathy screening | 2201 (53) |
| No electrocardiogram or cardiac stress test | 308 (7) |
| Hospitalization for hyperglycemiaa | 18 (0.4) |
| Hospitalization for hypoglycemiaa | 182 (4) |
| Hospitalization for hypertensiona | 217 (5) |
| Age ≥67 with no evidence of annual test strip prescription (n=2334)b | 1115 (48) |
HbA1c, hemoglobin A1c.
Recorded as main diagnosis.
Only patients aged ≥67 were included to facilitate a 2-yr look-back period for use of medications.
The characteristics of patients by care-gap score are shown in Table 3. There were 1775 patients (43%) with a gap score above the median (i.e., one) and 2398 (58%) with a score less than or equal to the median (i.e., ≤1). Compared with those with a gap score of less than or equal to one, patients with a score greater than one were more often not rostered to a family physician, had a shorter duration of diabetes, and fewer comorbidities and hospitalizations. They also had fewer diabetes-related healthcare visits.
Table 3.
Characteristics of patients with diabetes using in-center hemodialysis with a care gap score above and below the median as of January 1, 2018
| Characteristics | Gap Score >1 (N=1775) | Gap Score ≤1 (N=2398) | Standardized Difference |
| Age | |||
| Mean±SD, yr | 66.83±14.2 | 67.54±12.31 | 0.05 |
| Median (IQR), yr | 68.00 (57.00–77.00) | 68.00 (59.00–77.00) | 0.02 |
| 18–49 yr, n (%) | 213 (12) | 200 (8) | 0.12 |
| 50–65 yr, n (%) | 541 (31) | 767 (32) | 0.03 |
| 66–74 yr, n (%) | 430 (24) | 697 (29) | 0.11 |
| ≥75 yr, n (%) | 591 (33) | 734 (31) | 0.06 |
| Female sex, n (%) | 742 (42) | 885 (37) | 0.1 |
| Race, n (%) | |||
| White | 1050 (59) | 1351 (56) | 0.06 |
| Black | 192 (11) | 246 (10) | 0.02 |
| Other | 526 (30) | 794 (33) | 0.07 |
| Missing | 7 (0.4) | 7 (0.3) | 0.02 |
| Rostered to family doctor, n (%) | |||
| 0 (not rostered) | 153 (9) | 140 (6) | 0.11 |
| 1 (rostered) | 1361 (77) | 1841 (77) | 0 |
| 2 (virtually rostered) | 261 (15) | 417 (17) | 0.07 |
| Income quintile, n (%) a | |||
| 1 (lowest) | 577 (33) | 785 (33) | 0 |
| 2 | 427 (24) | 554 (23) | 0.02 |
| 3 | 326 (18) | 446 (19) | 0.01 |
| 4 | 238 (13) | 350 (15) | 0.03 |
| 5 (highest) | 207 (12) | 263 (11) | 0.02 |
| Distance to dialysis center (km) | |||
| Mean±SD | 17.85±49.9 | 19.63±72.92 | 0.03 |
| Median (IQR) | 6.53 (3.21–13.87) | 6.21 (3.28–12.57) | 0.03 |
| Marginalization index, n (%) | |||
| Instability quintile | |||
| 1 (lowest instability) | 265 (15) | 361 (15) | 0 |
| 2 | 269 (15) | 326 (14) | 0.04 |
| 3 | 308 (17) | 380 (16) | 0.04 |
| 4 | 348 (20) | 471 (20) | 0 |
| 5 (highest instability) | 552 (31) | 807 (34) | 0.05 |
| Missing | 33 (2) | 53 (2) | 0.02 |
| Deprivation quintile | |||
| 1 (lowest deprivation) | 218 (12) | 315 (13) | 0.03 |
| 2 | 274 (15) | 383 (16) | 0.01 |
| 3 | 306 (17) | 418 (17) | 0.01 |
| 4 | 405 (23) | 518 (22) | 0.03 |
| 5 (highest deprivation) | 539 (30) | 711 (30) | 0.02 |
| Missing | 33 (2) | 53 (2) | 0.02 |
| Dependency quintile | |||
| 1 (lowest dependency) | 338 (19) | 470 (20) | 0.01 |
| 2 | 311 (18) | 405 (17) | 0.02 |
| 3 | 279 (16) | 417 (17) | 0.04 |
| 4 | 330 (19) | 420 (18) | 0.03 |
| 5 (highest dependency) | 484 (27) | 633 (26) | 0.02 |
| Missing | 33 (2) | 53 (2) | 0.02 |
| Ethnic concentration quintile | |||
| 1 (lowest concentration) | 273 (15) | 359 (15) | 0.01 |
| 2 | 269 (15) | 352 (15) | 0.01 |
| 3 | 290 (16) | 362 (15) | 0.03 |
| 4 | 311 (18) | 447 (19) | 0.03 |
| 5 (highest concentration) | 599 (34) | 825 (34) | 0.01 |
| Missing | 33 (2) | 53 (2) | 0.02 |
| Long-term care, n (%) | 131 (7) | 132 (6) | 0.08 |
| Lives in rural locationa | 204 (12) | 242 (10) | 0.05 |
| Duration of diabetes, yr | |||
| Mean±SD | 16.5±7.7 | 18.4±7.0 | 0.26 |
| Median (IQR) | 17.2 (10.2–23.9) | 20.0 (13.7–24.8) | 0.24 |
| Comorbidities | |||
| COPD, n (%) | 539 (30) | 736 (31) | 0.01 |
| CHF, n (%) | 930 (52) | 1368 (57) | 0.09 |
| Dementia, n (%) | 169 (10) | 210 (9) | 0.03 |
| CAD, n (%) | 1016 (57) | 1579 (66) | 0.18 |
| Stroke, n (%) | 225 (13) | 358 (15) | 0.07 |
| Foot ulcer, n (%) | 163 (9) | 326 (14) | 0.14 |
| Amputation, n (%) | 95 (5) | 199 (8) | 0.12 |
| Depression and anxiety, n (%) | 158 (9) | 216 (9) | 0 |
| Hypoglycemia, n (%) | 209 (12) | 263 (11) | 0.03 |
| Hyperglycemia, n (%) | 9 (0.5) | 9 (0.4) | 0.02 |
| Retinopathy, n (%) | 118 (7) | 355 (15) | 0.27 |
| Cancer, n (%) | 238 (13) | 380 (16) | 0.07 |
| Liver, n (%) | 242 (14) | 366 (15) | 0.05 |
| Charlson score | |||
| Mean±SD | 4.8±2.0 | 5.1±1.9 | 0.15 |
| Median (IQR) | 5.0 (4.0–6.0) | 5.0 (4.0–6.0) | 0.15 |
| 0, n (%) | 16 (0.9) | 11 (0.5) | 0.05 |
| 1, n (%) | 8 (0.5) | 18 (0.8) | 0.04 |
| 2, n (%) | 223 (13) | 190 (8) | 0.15 |
| 3, n (%) | 126 (7) | 142 (6) | 0.05 |
| ≥4, n (%) | 1344 (76) | 2019 (84) | 0.21 |
| Missing, n (%) | 58 (3) | 18 (0.8) | 0.18 |
| Healthcare utilization in the prior year | |||
| Number of specialist visitsb | |||
| Mean±SD | 13.5±12.1 | 20.1±14.7 | 0.48 |
| Median (IQR) | 11.0 (5.0–19.0) | 17.0 (10.0–27.0) | 0.55 |
| 0, n (%) | 116 (7) | 19 (0.8) | 0.31 |
| 1–2, n (%) | 152 (9) | 70 (3) | 0.24 |
| 3–5, n (%) | 258 (15) | 192 (8) | 0.21 |
| 6–11, n (%) | 422 (24) | 463 (19) | 0.11 |
| ≥12, n (%) | 827 (47) | 1654 (69) | 0.47 |
| Number of primary care visits | |||
| Mean±SD | 8.1±12.4 | 8.7±11.5 | 0.06 |
| Median (IQR) | 5.0 (2.0–11.0) | 6.0 (2.0–11.0) | 0.13 |
| 0, n (%) | 261 (15) | 263 (11) | 0.11 |
| 1–2, n (%) | 311 (18) | 376 (16) | 0.05 |
| 3–5, n (%) | 366 (21) | 476 (20) | 0.02 |
| ≥6, n (%) | 837 (47) | 1283 (54) | 0.13 |
| At least one diabetes visit, n (%)c | 865 (49) | 1484 (62) | 0.27 |
| Number of diabetes visitsc | |||
| Mean±SD | 2.3±4.3 | 2.9±4.4 | 0.13 |
| Median (IQR) | 0.0 (0.0–3.0) | 1.0 (0.0–4.0) | 0.24 |
| 0, n (%) | 910 (51) | 914 (38) | 0.27 |
| 1–2, n (%) | 311 (18) | 528 (22) | 0.11 |
| 3–5, n (%) | 294 (17) | 523 (22) | 0.13 |
| ≥6, n (%) | 260 (15) | 433 (18) | 0.09 |
| Physician seen for diabetes, n (%) | |||
| General practitioner | 496 (28) | 795 (33) | 0.11 |
| Internal medicine | 112 (6) | 214 (9) | 0.1 |
| Endocrinology | 248(14) | 456 (19) | 0.14 |
| Other | ≤5 | ≤5 | 0.01 |
| No visits | 910 (51) | 914 (38) | 0.27 |
| Number of unique physician visits | |||
| Mean±SD | 35.5±25.2 | 41.0±24.5 | 0.22 |
| Median (IQR) | 29.0 (17.0–48.0) | 36.0 (23.0–53.0) | 0.29 |
| All cause ED visits | |||
| Mean±SD | 3.2±5.6 | 3.1±4.5 | 0.02 |
| Median (IQR) | 2.0 (0.0–4.0) | 2.0 (1.0–4.0) | 0.02 |
| All cause hospitalization | |||
| Mean±SD | 2.9±3.2 | 3.3±3.0 | 0.15 |
| Median (IQR) | 2.0 (1.0–4.0) | 3.0 (1.0–5.0) | 0.23 |
| Laboratory tests | |||
| At least one HbA1c, n (%) | 1272 (72) | 2182 (91) | 0.51 |
| HbA1c value | |||
| Mean±SD, % | 6.8±1.6 | 6.9±1.6 | 0.08 |
| Median (IQR), % | 6.5 (5.6–7.7) | 6.6 (5.8–7.8) | 0.11 |
| ≤7%, n (%) | 820 (46) | 1316 (55) | 0.17 |
| >7%, n (%) | 452 (26) | 866 (36) | 0.23 |
| Missing, n (%) | 503 (28) | 216 (9) | 0.51 |
Cell sizes of less than six were suppressed for patient privacy, as per ICES privacy policies. IQR, interquartile range; COPD, chronic obstructive pulmonary disorder; CHF, congestive heart failure; CAD, coronary artery disease; HbA1c, hemoglobin A1c.
Fewer than 3% of patients had missing data. To avoid small cells from being recalculated, missing income quintiles was recoded as “3.” Missing rural was also recoded as “no” (urban).
Selected specialties in “specialist visits” included: dermatology, dermatology, general surgery, neurosurgery, community medicine, orthopedic surgery, geriatrics, plastic surgery, cardiothoracic surgery, emergency medicine, internal medicine, endocrinology, nephrology, vascular surgery, neurology, psychiatry, obstetrics and gynecology, genetics, ophthalmology, otolaryngology, physical medicine, urology, gastroenterology, medical oncology, infectious disease, respiratory disease, rheumatology, optometrists, osteopaths, chiropodists, chiropractor, cardiology, hematology, clinical immunology, nuclear medicine, and thoracic surgery.
Physicians seen for “diabetes visits” included internists, nephrologists, endocrinologists, general practitioners, and geriatricians.
Significant predictors of more than one diabetes care gap are shown in Table 4. These included younger age (RR, 1.00; 95% CI, 0.99 to 1.00), female sex (RR, 1.08; 95% CI, 1.01 to 1.16), shorter duration of diabetes (RR, 0.985; 95% CI, 0.98 to 0.99), dementia (RR, 1.21; 95% CI, 1.06 to 1.38), fewer specialist visits (RR, 0.99; 95% CI, 0.98 to 0.99), and no diabetes-related visit with a physician (RR, 1.14; 95% CI, 1.01 to 1.28). We note regional variation in gaps: across most age groups, southern and northern areas of our province appeared vulnerable. There was less geographic variation in care gaps in younger individuals, but overall gap rates were high in this group (Figure 1).
Table 4.
Predictors of more than one diabetes care gap in patients using chronic, in-center hemodialysis in Ontario, Canada
| Predictors | Relative Risk (95% CI) | P Value | ||
| Age | 1.00 (0.99 to 1.00) | 0.02a | ||
| Female sex | 1.08 (1.01 to 1.16) | 0.02a | ||
| Rostered to family doctor | ||||
| 0 (not rostered) | 1.13 (1.00 to 1.28) | 0.05 | ||
| 1 (rostered) | Reference | |||
| 2 (virtually rostered) | 0.95 (0.86 to 1.05) | 0.32 | ||
| Income quintile b | ||||
| 1 (lowest) | 0.95 (0.85 to 1.07) | 0.40 | ||
| 2 | 0.98 (0.87 to 1.11) | 0.76 | ||
| 3 | 0.99 (0.87 to 1.12) | 0.84 | ||
| 4 | 0.90 (0.78 to 1.03) | 0.12 | ||
| 5 (highest) | Reference | |||
| Rural location | 1.09 (0.98 to 1.21) | 0.12 | ||
| Duration of diabetes | 0.99 (0.98 to 0.99) | <0.001a | ||
| Congestive heart failure | 0.99 (0.91 to 1.07) | 0.75 | ||
| Chronic obstructive pulmonary disease | 1.03 (0.95 to 1.12) | 0.42 | ||
| Dementia | 1.21 (1.06 to 1.38) | 0.006a | ||
| Coronary artery disease | 0.97 (0.90 to 1.04) | 0.36 | ||
| Stroke | 1.01 (0.90 to 1.13) | 0.93 | ||
| Amputation | 0.91 (0.75 to 1.11) | 0.35 | ||
| Anxiety/depression | 1.02 (0.89 to 1.16) | 0.81 | ||
| Cancer | 1.05 (0.95 to 1.17) | 0.32 | ||
| Liver | 0.93 (0.83 to 1.04) | 0.18 | ||
| Charlson score | ||||
| 0 or no hospitalizations | Reference | |||
| 1 | 0.66 (0.35 to 1.24) | 0.19 | ||
| 2 | 1.07 (0.88 to 1.30) | 0.48 | ||
| 3 | 1.01 (0.81 to 1.25) | 0.96 | ||
| ≥4 | 0.94 (0.78 to 1.13) | 0.50 | ||
| Specialist visits | 0.99 (0.98 to 0.99) | <0.001a | ||
| Primary care visits | 1.00 (1.00 to 1.00) | 0.75 | ||
| Diabetes visits | 1.01 (1.00 to 1.02) | 0.06 | ||
| Physician seen for diabetes | ||||
| General/family physician | 0.95 (0.85 to 1.06) | 0.37 | ||
| Internal medicine | 0.88 (0.74 to 1.04) | 0.13 | ||
| Endocrinology | Reference | |||
| Otherb | 0.93 (0.59 to 1.49) | 0.77 | ||
| No visits | 1.14 (1.01 to 1.28) | 0.03a | ||
P<0.05.
Other physician included nephrologist, geriatrician.
Figure 1.
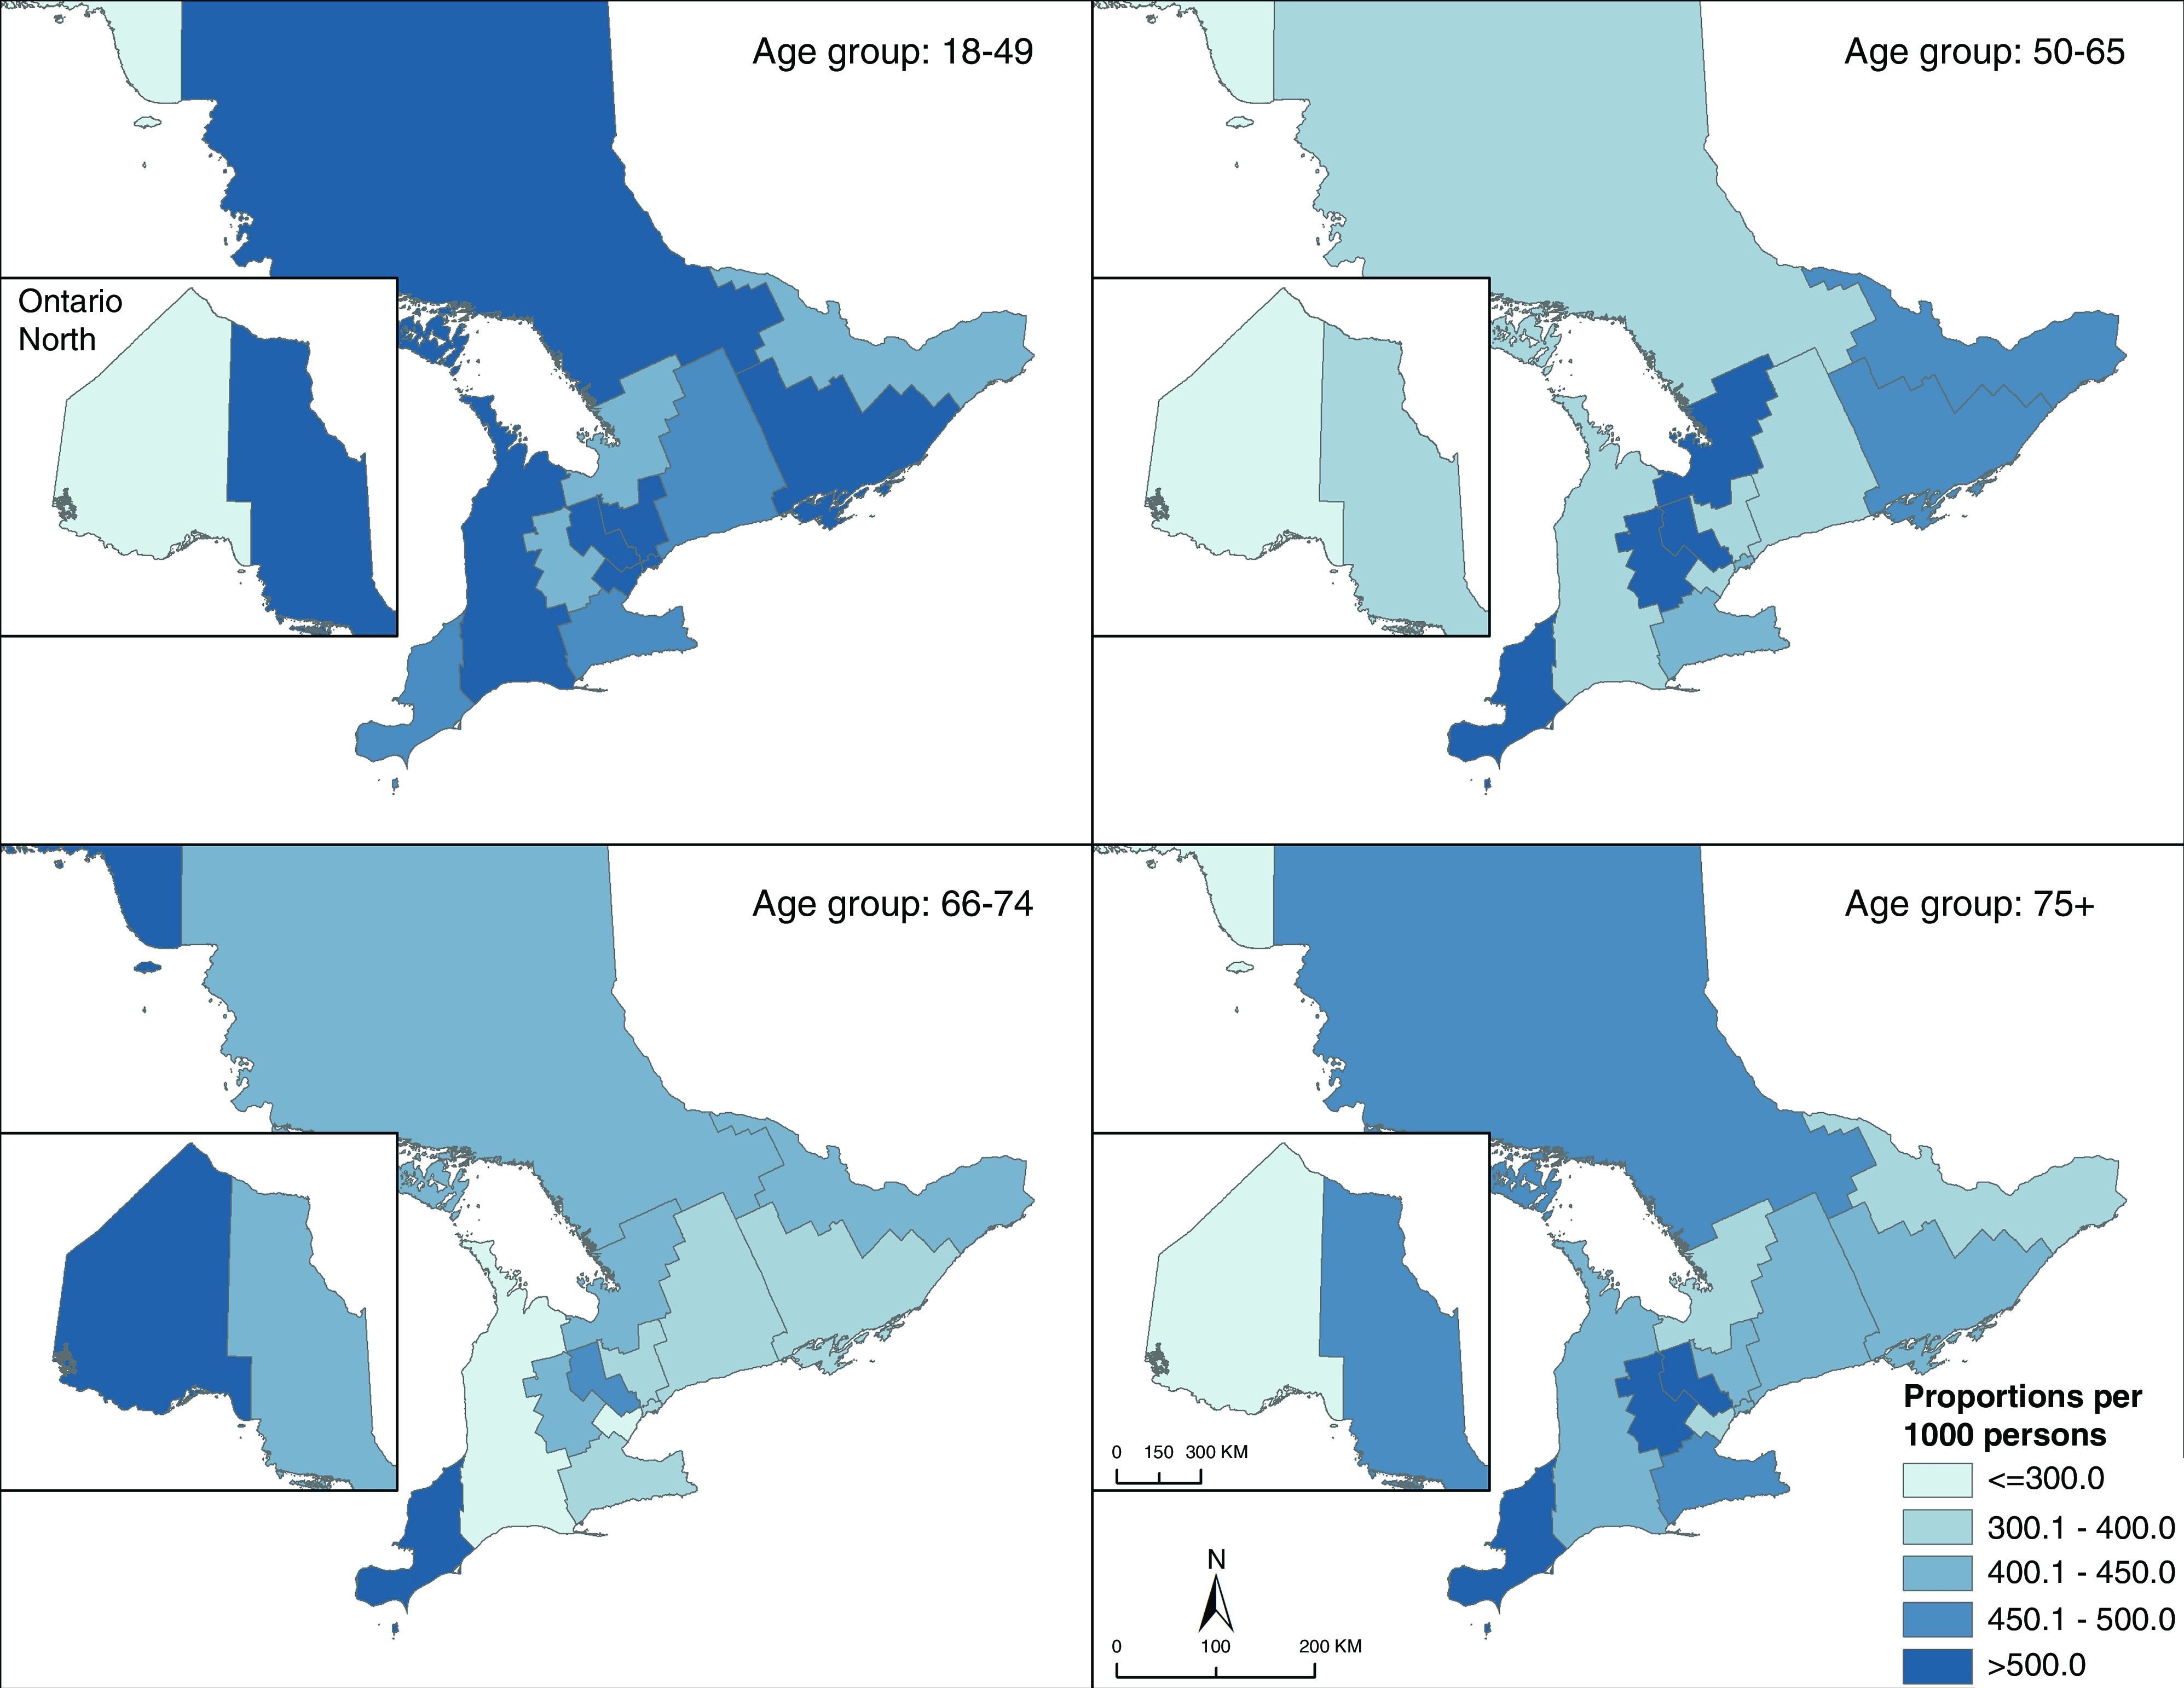
There is geographic variation in diabetes gap scores over one, in Ontario Canada. Care gaps included (1) insufficient or excessive glycemic monitoring; (2) suboptimal screening for diabetes-related complications (retinopathy and cardiovascular screening); and (3) hospitalizations for hypoglycemia, hyperglycemia, and hypertension. Results were sex-adjusted proportions per 1000, aggregated to Local Health Integration Network.
Discussion
In this large, population-based, cohort study of patients with diabetes receiving in-center hemodialysis in Ontario, we note opportunities to improve diabetes care. There is special need to improve retinopathy screening, which has also been described in the general diabetes population (37,38). Efforts might also be made to improve glycemic monitoring. Further, there may be a need to “loosen” glycemic control, given our cohort had a mean HbA1c of 6.9%±1.6%, and the majority had an HbA1c level of ≤7%. It is generally recommended that tight control is avoided in those with functional limitation and significant comorbidities (27,39) due to a heightened risk of hypoglycemia.
There have been limited studies to examine diabetes gaps in the hemodialysis population. In a small study (n=100) in southeastern Ontario, Canada in 2006, >50% of patients had “suboptimal” glycemic control, at that time defined as an HbA1c level of >7% (12). In a study of patients with diabetes and CKD in Australia (20% receiving dialysis), patients self-reported suboptimal use of statins, out-of-target BPs, and low rates of retinopathy screening (40). In a 2018 United States Renal Data System report, 17% of patients with diabetes and ESKD had not had an annual HbA1c test, and 53% did not have a diabetes eye exam (29).
Reasons for diabetes care gaps in hemodialysis are likely multifactorial and related to patient, provider, and health-system factors. Low eye screening might relate to the need to schedule and attend separate outpatient appointments, lack of awareness of the need for eye screening, lower socioeconomic status, behavioral and cultural factors, or geographic barriers (38,41,42). Suboptimal eye screening is concerning, given those on dialysis are at very high risk of vision-threatening retinopathy (43,44). Early detection and appropriate treatment can reduce vision impairment (45).
Suboptimal glycemic monitoring may have been due to limitations in diabetes self-management skills or competing medical appointments making it difficult to attend the laboratory for testing. Although we recognize the use of HbA1c for glycemic monitoring in CKD is controversial (46), HbA1c remains a common clinical tool to assess glycemic control in this population. We also observed a similar monitoring gap with the use of glucose test strips. Glycemic monitoring is important in diabetes to capture and act upon hyper- and hypoglycemia. Hypoglycemia is particularly common in patients on dialysis (3).
In terms of predictors of care gaps, younger individuals, females, and those with a shorter duration of diabetes had more gaps. Gaps in younger patients may have been due to suboptimal education, personal/social influences, or treatment inertia in younger, more recently diagnosed patients (40,47). Sex disparities in both CKD (48,49) and diabetes management have been described previously (50–52). The gaps observed in patients with dementia might have been due to cognitive limitations or suboptimal access to care. We also found that patients who saw fewer specialists or who did not have diabetes care visits faced more gaps. The importance of routine diabetes follow-up and specialist care in diabetes has been described previously (42,53).
Like our study, studies of other diabetes cohorts have noted spatial variation in care quality (54,55). A Canadian study of patients with diabetes and CKD in Alberta found that remote dwellers were less likely to have an HbA1c and urinary albumin-creatinine ratio measured and were less likely to receive an angiotensin-converting enzyme inhibitor, angiotensin receptor blocker, or statin than those who lived closer to a nephrologist (56). Geographic variation in care gaps might be related to physician volumes in particular regions; lack of specialists; or the health behaviors, beliefs, and socioeconomic characteristics of the populations who live in the area (54,56–59). It also remains possible that northern and southern residents of our province might seek and receive care in other provinces or states, precluding full capture of healthcare utilization (60).
Our study has clinical and research implications. Where suboptimal diabetes healthcare has been linked with adverse outcomes for patients with CKD (61), this study might inform targeted efforts to improve the care of this high-risk population. Interventions to improve rates of eye screening (e.g., patient education, assistance with appointment scheduling, ocular telemedicine strategies) might be helpful (62,63). To support glycemic control, self-management, and monitoring, there may be value in outreach diabetes support in the hemodialysis unit, or in interdisciplinary care clinics (64).
Our study has many strengths. We captured care gaps across several hemodialysis units across the province rather than focusing on a single center. We conducted a comprehensive gap analysis, focusing on those that are modifiable and targetable for intervention. Instead of relying on patient self-report, we used healthcare data captured in administrative databases. In terms of limitations, care gaps had to be measurable using administrative data. As such, we could not examine for adequate foot screening or BP control. However, we did examine hospitalizations for hypertension in our gap analysis. Further, administrative codes can be limited in sensitivity (31) and, as such, we missed outcome events that did not lead to hospital presentation (e.g., events that prompted emergency medical services only). We defined suboptimal glycemic monitoring using HbA1c tests, which is controversial considering its measure can be influenced by uremia, anemia, and use of erythropoietic-stimulating agents (65). However we also examined monitoring by use of glucose test strips and noted consistent results. We could only examine prescription medications in those ≥65 years and did not incorporate this into our care-gap analysis. Further, guidelines for diabetes management in hemodialysis are sparse, necessitating use of other general CKD/diabetes guidelines and clinical expertise for our analysis. Finally, our results are only fully generalizable to those receiving in-center hemodialysis in the province of Ontario.
In conclusion, there are opportunities to improve diabetes care in patients on chronic, in-center hemodialysis. Focused efforts to increase patients’ access to diabetes health services might be considered to improve outcomes.
Disclosures
K.K. Clemens received a diabetes research award sponsored by AstraZeneca; honoraria for delivering certified continuing medical education talks from the Canadian Medical and Surgical Knowledge Translation Research Group and Sutherland Global Services Canada ULC; and has attended Merck-sponsored conferences. A.X. Garg reports being on the editorial boards of American Journal of Kidney Diseases and Kidney International; receiving research funding from Astellas; serving on the data safety and monitoring board for an investigator-initiated trial program funded by GlaxoSmithKline; and serving as medical lead role to improve access to kidney transplantation and living kidney donation for the Ontario Renal Network (government-funded agency located within Ontario Health). S. Silver reports receiving honoraria from Baxter and Sanofi and serving on the editorial board of the Canadian Journal of Kidney Health and Disease. All remaining authors have nothing to disclose.
Funding
This study was supported by ICES, which is funded by an Ontario Ministry of Health and Long-Term Care (MOHLTC) annual grant. The study was completed at the ICES Western site, where core funding is provided by the Academic Medical Organization of Southwestern Ontario, the Schulich School of Medicine and Dentistry, Western University, and the Lawson Health Research Institute. K.K. Clemens received funding for this study from Diabetes Canada (Junior Investigator Award 2017) and the Department of Medicine, Western University. S.A. Silver is supported by the Kidney Foundation of Canada, Canadian Society of Nephrology, and Canadian Institutes of Health Research through the Kidney Research Scientist Core Education and National Training (KRESCENT) Program New Investigator Award. A.X. Garg was supported by a Canadian Institutes of Health Research Foundation Grant (FRN 148377), the Dr. Adam Linton Chair in Kidney Health Analytics award, and a Clinician Investigator Award.
Acknowledgments
The authors thank IMS Brogan Inc. for use of their drug information database.
Parts of this material are based on data and information compiled and provided by the MOHLTC, Canadian Institute of Health Information, and Cancer Care Ontario. The opinions, results, views, and conclusions reported in this paper are those of the authors and do not reflect those of the funding or data sources; no endorsement is intended or should be inferred.
Author Contributions
K.K. Clemens, A.X. Garg, and D.M. Nash conceptualized the study; K.K. Clemens was responsible for funding acquisition; A.M. Ouédraogo was responsible for data curation and formal analysis; K.K. Clemens, A.X. Garg, D.M. Nash, and S.A. Silver were responsible for investigation; and all authors were responsible for methodology.
Supplemental Material
This article contains the following supplemental material online at http://kidney360.asnjournals.org/lookup/suppl/doi:10.34067/KID.0007082020/-/DCSupplemental.
Flow diagram of inclusions and exclusions. Download Supplemental Figure 1, PDF file, 221 KB (220.6KB, pdf)
RECORD checklist of recommendations for the reporting of studies conducted using routinely collected health data. Download Supplemental Table 1, PDF file, 221 KB (220.6KB, pdf)
List of variables and data sources. Download Supplemental Table 2, PDF file, 221 KB (220.6KB, pdf)
Diabetes care gaps. Download Supplemental Table 3, PDF file, 221 KB (220.6KB, pdf)
References
- 1.Canadian Institute for Health Information: Access data and reports. Available at: https://www.cihi.ca/en/access-data-reports/results?query=Treatment+of+End-Stage+Organ+Failure+in+Canada%2C+Canadian+Organ+Replacement+Register%2C+2007+to+2016%3A+Data+Tables%2C+End-Stage+Kidney&Search+Submit=. Accessed January 22, 2021
- 2.Clemens KK, Getchell L, Robinson T, Ryan BL, O’Donnell J, Reichert SM: Clinical care gaps and solutions in diabetes and advanced chronic kidney disease: A patient-oriented qualitative research study. CMAJ Open 7: E258–E263, 2019. 10.9778/cmajo.20180177 [DOI] [PMC free article] [PubMed] [Google Scholar]
- 3.Hodge M, McArthur E, Garg AX, Tangri NCK, Clemens KK: Hypoglycemia incidence in older adults by estimated GFR. Am J Kidney Dis 70: 59–68, 2016. 10.1053/j.ajkd.2016.11.019 [DOI] [PubMed] [Google Scholar]
- 4.Pugliese G, Solini A, Bonora E, Orsi E, Zerbini G, Fondelli C, Gruden G, Cavalot F, Lamacchia O, Trevisan R, Vedovato M, Penno G; RIACE Study Group: Distribution of cardiovascular disease and retinopathy in patients with type 2 diabetes according to different classification systems for chronic kidney disease: A cross-sectional analysis of the renal insufficiency and cardiovascular events (RIACE) Italian multicenter study. Cardiovasc Diabetol 13: 59, 2014. 10.1186/1475-2840-13-59 [DOI] [PMC free article] [PubMed] [Google Scholar]
- 5.Otte J, van Netten JJ, Woittiez A-JJ: The association of chronic kidney disease and dialysis treatment with foot ulceration and major amputation. J Vasc Surg 62: 406–411, 2015. 10.1016/j.jvs.2015.02.051 [DOI] [PubMed] [Google Scholar]
- 6.Chan L, Chauhan K, Poojary P, Saha A, Hammer E, Vassalotti JA, Jubelt L, Ferket B, Coca SG, Nadkarni GN: National estimates of 30-day unplanned readmissions of patients on maintenance hemodialysis. Clin J Am Soc Nephrol 12: 1652–1662, 2017. 10.2215/CJN.02600317 [DOI] [PMC free article] [PubMed] [Google Scholar]
- 7.Tohme F, Mor MK, Pena-Polanco J, Green JA, Fine MJ, Palevsky PM, Weisbord SD: Predictors and outcomes of non-adherence in patients receiving maintenance hemodialysis. Int Urol Nephrol 49: 1471–1479, 2017. 10.1007/s11255-017-1600-4 [DOI] [PMC free article] [PubMed] [Google Scholar]
- 8.Murali KM, Mullan J, Roodenrys S, Hassan HC, Lambert K, Lonergan M: Strategies to improve dietary, fluid, dialysis or medication adherence in patients with end stage kidney disease on dialysis: A systematic review and meta-analysis of randomized intervention trials. PLoS One 14: e0211479, 2019. 10.1371/journal.pone.0211479 [DOI] [PMC free article] [PubMed] [Google Scholar]
- 9.Shirazian S, Crnosija N, Weinger K, Jacobson AM, Park J, Tanenbaum ML, Gonzalez JS, Mattana J, Hammock AC: The self-management experience of patients with type 2 diabetes and chronic kidney disease: A qualitative study. Chronic Illn 12: 18–28, 2016. 10.1177/1742395315614381 [DOI] [PubMed] [Google Scholar]
- 10.Rucker D, Hemmelgarn BR, Lin M, Manns BJ, Klarenbach SW, Ayyalasomayajula B, James MT, Bello A, Gordon D, Jindal KK, Tonelli M: Quality of care and mortality are worse in chronic kidney disease patients living in remote areas. Kidney Int 79: 210–217, 2011. 10.1038/ki.2010.376 [DOI] [PubMed] [Google Scholar]
- 11.Mark P, McNally M, Jones GC: Deficiencies in foot care of diabetic patients on renal replacement therapy. Pract Diabetes Int 20: 294–296, 2003. 10.1002/pdi.535 [DOI] [Google Scholar]
- 12.Tascona DJ, Morton AR, Toffelmire EB, Holland DC, Iliescu EA: Adequacy of glycemic control in hemodialysis patients with diabetes. Diabetes Care 29: 2247–2251, 2006. 10.2337/dc06-0845 [DOI] [PubMed] [Google Scholar]
- 13.Benchimol EI, Smeeth L, Guttmann A, Harron K, Moher D, Petersen I, Sørensen HT, von Elm E, Langan SM; RECORD Working Committee: The REporting of studies Conducted using Observational Routinely-collected health Data (RECORD) statement. PLoS Med 12: e1001885, 2015. 10.1371/journal.pmed.1001885 [DOI] [PMC free article] [PubMed] [Google Scholar]
- 14.Hux JE, Ivis F, Flintoft V, Bica A: Diabetes in Ontario: Determination of prevalence and incidence using a validated administrative data algorithm. Diabetes Care 25: 512–516, 2002. 10.2337/diacare.25.3.512 [DOI] [PubMed] [Google Scholar]
- 15.Lipscombe LL, Hwee J, Webster L, Shah BR, Booth GL, Tu K: Identifying diabetes cases from administrative data: A population-based validation study. BMC Health Serv Res 18: 316, 2018. 10.1186/s12913-018-3148-0 [DOI] [PMC free article] [PubMed] [Google Scholar]
- 16.Ontario Renal Network: About the data – Ontario renal network. Available at: https://www.ontariorenalnetwork.ca/en/renal-network-data/about-data. Accessed June 1, 2020
- 17.Matheson FI, Dunn JR, Smith KLW, Moineddin R, Glazier RH: Development of the Canadian marginalization index: A new tool for the study of inequality. Can J Public Health 103[Suppl 2]: S12–S16, 2012. 10.1007/BF03403823 [DOI] [PMC free article] [PubMed] [Google Scholar]
- 18.Public Health Ontario : 2011. Ontario marginalization index: Technical document. Available at: https://www.publichealthontario.ca/en/data-and-analysis/health-equity/ontario-marginalization-index. Accessed September 19, 2019
- 19.Schultz SE, Rothwell DM, Chen Z, Tu K: Identifying cases of congestive heart failure from administrative data: A validation study using primary care patient records. Chronic Dis Inj Can 33:160–166, 2013 [PubMed] [Google Scholar]
- 20.Gershon AS, Wang C, Guan J, Vasilevska-Ristovska J, Cicutto L, To T: Identifying individuals with physcian diagnosed COPD in health administrative databases. COPD 6: 388–394, 2009 [DOI] [PubMed] [Google Scholar]
- 21.Tu K, Campbell NR, Chen Z-L, Cauch-Dudek KJ, McAlister FA: Accuracy of administrative databases in identifying patients with hypertension. Open Med 1: e18–e26, 2007 [PMC free article] [PubMed] [Google Scholar]
- 22.Gershon AS, Wang C, Guan J, Vasilevska-Ristovska J, Cicutto L, To T: Identifying patients with physician-diagnosed asthma in health administrative databases. Can Respir J 16: 183–188, 2009. 10.1155/2009/963098 [DOI] [PMC free article] [PubMed] [Google Scholar]
- 23.Jaakkimainen RL, Bronskill SE, Tierney MC, Herrmann N, Green D, Young J, Ivers N, Butt D, Widdifield J, Tu K: Identification of physician-diagnosed Alzheimer's disease and related dementias in population-based administrative data: A validation study using family physicians’ electronic medical records. J Alzheimers Dis 54: 337–349, 2016. 10.3233/JAD-160105 [DOI] [PubMed] [Google Scholar]
- 24.Iskander C, McArthur E, Nash DM, Gandhi-Banga S, Weir MA, Muanda FT, Garg AX: Identifying Ontario geographic regions to assess adults who present to hospital with laboratory-defined conditions: A descriptive study. CMAJ Open 7: E624–E629, 2019. 10.9778/cmajo.20190065 [DOI] [PMC free article] [PubMed] [Google Scholar]
- 25.Molitch ME, Adler AI, Flyvbjerg A, Nelson RG, So W-Y, Wanner C, Kasiske BL, Wheeler DC, de Zeeuw D, Mogensen CE: Diabetic kidney disease: A clinical update from kidney disease: Improving global outcomes. Kidney Int 87: 20–30, 2015. 10.1038/ki.2014.128 [DOI] [PMC free article] [PubMed] [Google Scholar]
- 26.Frankel A, Kazempour-Ardebili S, Bedi R, Chowdhury TA, De P, El-Sherbini N, Game F, Gray S, Hardy D, James J, Kong MF, Ramlan G, Southcott E, Winocour P: Management of adults with diabetes on the haemodialysis unit: Summary of new guidance from the joint British diabetes Societies (JBDS) and the renal association. Br J Diabetes Vasc Dis 16: 69–77, 2016. 10.15277/bjd.2016.073 [DOI] [PubMed] [Google Scholar]
- 27.Diabetes Canada: Clinical practice guidelines – 2018 full guidelines. Available at: http://guidelines.diabetes.ca/cpg. Accessed May 20, 2020
- 28.Cheung A, Stukel TA, Alter DA, Glazier RH, Ling V, Wang X, Shah BR: Primary care physician volume and quality of diabetes care: A population-based cohort study. Ann Intern Med 166: 240–247, 2017 [DOI] [PubMed] [Google Scholar]
- 29.United States Renal Data Sysytem: Previous ADRs. Available at: https://www.usrds.org/annual-data-report/previous-adrs/. Accessed September 11, 2020
- 30.Donabedian A: The quality of care. How can it be assessed? JAMA 260: 1743–1748, 1988. 10.1001/jama.1988.03410120089033 [DOI] [PubMed] [Google Scholar]
- 31.Hodge MC, Dixon S, Garg AX, Clemens KK: Validation of an international statistical classification of diseases and related health problems 10th revision coding algorithm for hospital encounters with hypoglycemia. Can J Diabetes 41: 322–328, 2017. 10.1016/j.jcjd.2016.11.003 [DOI] [PubMed] [Google Scholar]
- 32.Quan H, Khan N, Hemmelgarn BR, Tu K, Chen G, Campbell N, Hill MD, Ghali WA, McAlister FA; Hypertension Outcome and Surveillance Team of the Canadian Hypertension Education Programs: Validation of a case definition to define hypertension using administrative data. Hypertension 54: 1423–1428, 2009 [DOI] [PubMed] [Google Scholar]
- 33.Ramirez SPB, McCullough KP, Thumma JR, Nelson RG, Morgenstern H, Gillespie BW, Inaba M, Jacobson SH, Vanholder R, Pisoni RL, Port FK, Robinson BM: Hemoglobin A(1c) levels and mortality in the diabetic hemodialysis population: Findings from the Dialysis Outcomes and Practice Patterns Study (DOPPS). Diabetes Care 35: 2527–2532, 2012. 10.2337/dc12-0573 [DOI] [PMC free article] [PubMed] [Google Scholar]
- 34.Diabetes Canada: Clinical practice guidelines – chapter 8: Targets for glycemic control. Available at: http://guidelines.diabetes.ca/cpg/chapter8. Accessed April 28, 2020
- 35.Local Health Integration Network (LHIN). Local Health Integration Networks (LHINs) plan, integrate and fund local health care, improving access and patient experience. Available at: http://www.lhins.on.ca/. Accessed May 13, 2020
- 36.Austin PC: Using the standardized difference to compare the prevalence of a binary variable between two groups in observational research. Commun Stat Simul Comput 38: 1228–1234, 2009. 10.1080/03610910902859574 [DOI] [Google Scholar]
- 37.Kiran T, Kopp A, Moineddin R, Victor JC, Campbell RJ, Shah BR, Glazier RH: Unintended consequences of delisting routine eye exams on retinopathy screening for people with diabetes in Ontario, Canada. CMAJ 185: E167–E173, 2013. 10.1503/cmaj.120862 [DOI] [PMC free article] [PubMed] [Google Scholar]
- 38.Benoit SR, Swenor B, Geiss LS, Gregg EW, Saaddine JB: Eye care utilization among insured people with diabetes in the U.S., 2010-2014. Diabetes Care 42: 427–433, 2019. 10.2337/dc18-0828 [DOI] [PubMed] [Google Scholar]
- 39.Gerstein HC, Miller ME, Byington RP, Goff DC Jr, Bigger JT, Buse JB, Cushman WC, Genuth S, Ismail-Beigi F, Grimm RH Jr, Probstfield JL, Simons-Morton DG, Friedewald WT; Action to Control Cardiovascular Risk in Diabetes Study Group: Effects of intensive glucose lowering in type 2 diabetes. N Engl J Med 358: 2545–2559, 2008. 10.1056/NEJMoa0802743 [DOI] [PMC free article] [PubMed] [Google Scholar]
- 40.Lo C, Teede H, Fulcher G, Gallagher M, Kerr PG, Ranasinha S, Russell G, Walker R, Zoungas S: Gaps and barriers in health-care provision for co-morbid diabetes and chronic kidney disease: A cross-sectional study. BMC Nephrol 18: 80, 2017. 10.1186/s12882-017-0493-x [DOI] [PMC free article] [PubMed] [Google Scholar]
- 41.Kashim RM, Newton P, Ojo O: Diabetic retinopathy screening: A systematic review on patients’ non-attendance. Int J Environ Res Public Health 15: 157, 2018 [DOI] [PMC free article] [PubMed] [Google Scholar]
- 42.Shah BR: Utilization of physician services for diabetic patients from ethnic minorities. J Public Health (Oxf) 30: 327–331, 2008. 10.1093/pubmed/fdn042 [DOI] [PubMed] [Google Scholar]
- 43.Grunwald JE, Alexander J, Ying G-S, Maguire M, Daniel E, Whittock-Martin R, Parker C, McWilliams K, Lo JC, Go A, Townsend R, Gadegbeku CA, Lash JP, Fink JC, Rahman M, Feldman H, Kusek JW, Xie D, Jaar BG; CRIC Study Group: Retinopathy and chronic kidney disease in the Chronic Renal Insufficiency Cohort (CRIC) study. Arch Ophthalmol 130: 1136–1144, 2012 [DOI] [PMC free article] [PubMed] [Google Scholar]
- 44.Deva R, Alias MA, Colville D, Tow FKN-FH, Ooi QL, Chew S, Mohamad N, Hutchinson A, Koukouras I, Power DA, Savige J: Vision-threatening retinal abnormalities in chronic kidney disease stages 3 to 5. Clin J Am Soc Nephrol 6: 1866–1871, 2011. 10.2215/CJN.10321110 [DOI] [PMC free article] [PubMed] [Google Scholar]
- 45.Ting DSW, Cheung GCM, Wong TY: Diabetic retinopathy: Global prevalence, major risk factors, screening practices and public health challenges: A review. Clin Exp Ophthalmol 44: 260–277, 2016. 10.1111/ceo.12696 [DOI] [PubMed] [Google Scholar]
- 46.Perkovic V, Agarwal R, Fioretto P, Hemmelgarn BR, Levin A, Thomas MC, Wanner C, Kasiske BL, Wheeler DC, Groop PH; Conference Participants: Management of patients with diabetes and CKD: Conclusions from a “Kidney Disease: Improving global outcomes” (KDIGO) Controversies Conference. Kidney Int 90: 1175–1183, 2016. 10.1016/j.kint.2016.09.010 [DOI] [PubMed] [Google Scholar]
- 47.Strain WD, Paldanius PM: Clinical inertia affects younger and older adults with T2DM equally, with or without CKD. Diabetes 64: A384, 2015 [Google Scholar]
- 48.Carrero JJ, Hecking M, Chesnaye NC, Jager KJ: Sex and gender disparities in the epidemiology and outcomes of chronic kidney disease. Nat Rev Nephrol 14: 151–164, 2018. 10.1038/nrneph.2017.181 [DOI] [PubMed] [Google Scholar]
- 49.Brar A, Markell M: Impact of gender and gender disparities in patients with kidney disease. Curr Opin Nephrol Hypertens 28: 178–182, 2019. 10.1097/MNH.0000000000000482 [DOI] [PubMed] [Google Scholar]
- 50.Clemens KK, Woodward M, Neal B, Zinman B: Sex disparities in cardiovascular outcome trials of populations with diabetes: A systematic review and meta-analysis. Diabetes Care 43: 1157–1163, 2020. 10.2337/dc19-2257 [DOI] [PubMed] [Google Scholar]
- 51.Šekerija M, Poljicanin T, Erjavec K, Liberati-Cizmek A-M, Prašek M, Metelko Z: Gender differences in the control of cardiovascular risk factors in patients with type 2 diabetes -a cross-sectional study. Intern Med 51: 161–166, 2012. 10.2169/internalmedicine.51.6094 [DOI] [PubMed] [Google Scholar]
- 52.Yu MK, Lyles CR, Bent-Shaw LA, Young BA: Sex disparities in diabetes process of care measures and self-care in high-risk patients. J Diabetes Res 2013: 575814, 2013. 10.1155/2013/575814 [DOI] [PMC free article] [PubMed] [Google Scholar]
- 53.Shah BR, Hux JE, Laupacis A, Zinman B, van Walraven C: Clinical inertia in response to inadequate glycemic control: Do specialists differ from primary care physicians? Diabetes Care 28: 600–606, 2005. 10.2337/diacare.28.3.600 [DOI] [PubMed] [Google Scholar]
- 54.Booth GL, Hux JE, Fang J, Chan BTB: Time trends and geographic disparities in acute complications of diabetes in Ontario, Canada. Diabetes Care 28: 1045–1050, 2005. 10.2337/diacare.28.5.1045 [DOI] [PubMed] [Google Scholar]
- 55.Jani PD, Forbes L, McDaniel P, Viera A, Garg S: Geographic information systems mapping of diabetic retinopathy in an ocular telemedicine network. JAMA Ophthalmol 135: 715–721, 2017. 10.1001/jamaophthalmol.2017.1153 [DOI] [PMC free article] [PubMed] [Google Scholar]
- 56.Bello AK, Hemmelgarn B, Lin M, Manns B, Klarenbach S, Thompson S, James M, Tonelli M; Alberta Kidney Disease Network: Impact of remote location on quality care delivery and relationships to adverse health outcomes in patients with diabetes and chronic kidney disease. Nephrol Dial Transplant 27: 3849–3855, 2012. 10.1093/ndt/gfs267 [DOI] [PubMed] [Google Scholar]
- 57.Harris SB, Naqshbandi M, Bhattacharyya O, Hanley AJG, Esler JG, Zinman B; CIRCLE Study Group: Major gaps in diabetes clinical care among Canada's First nations: Results of the CIRCLE study. Diabetes Res Clin Pract 92: 272–279, 2011. 10.1016/j.diabres.2011.02.006 [DOI] [PubMed] [Google Scholar]
- 58.Glasgow RE, Hampson SE, Strycker LA, Ruggiero L: Personal-model beliefs and social-environmental barriers related to diabetes self-management. Diabetes Care 20: 556–561, 1997. 10.2337/diacare.20.4.556 [DOI] [PubMed] [Google Scholar]
- 59.Brown AF, Gerzoff RB, Karter AJ, Gregg E, Safford M, Waitzfelder B, Beckles GLA, Brusuelas R, Mangione CM; TRIAD Study Group: Health behaviors and quality of care among Latinos with diabetes in managed care. Am J Public Health 93: 1694–1698, 2003. 10.2105/AJPH.93.10.1694 [DOI] [PMC free article] [PubMed] [Google Scholar]
- 60.Northern Policy Institute: Health care co-operation between Northwestern Ontario and Manitoba. Available at: https://www.northernpolicy.ca/healthcarecooperation. Accessed January 22, 2021
- 61.Li P-I, Wang J-N, Guo H-R: Long-term quality-of-care score predicts incident chronic kidney disease in patients with type 2 diabetes. Nephrol Dial Transplant 33: 2012–2019, 2018. 10.1093/ndt/gfx375 [DOI] [PubMed] [Google Scholar]
- 62.Zangalli CS, Murchison AP, Hale N, Hark LA, Pizzi LT, Dai Y, Leiby BE, Haller JA: An education- and telephone-based intervention to improve follow-up to vision care in patients with diabetes: A prospective, single-blinded, randomized trial. Am J Med Qual 31: 156–161, 2016. 10.1177/1062860614552670 [DOI] [PubMed] [Google Scholar]
- 63.Mansberger SL, Sheppler C, Barker G, Gardiner SK, Demirel S, Wooten K, Becker TM: Long-term comparative effectiveness of telemedicine in providing diabetic retinopathy screening examinations: A randomized clinical trial. JAMA Ophthalmol 133: 518–525, 2015. 10.1001/jamaophthalmol.2015.1 [DOI] [PMC free article] [PubMed] [Google Scholar]
- 64.Clemens KK, Kalatharan V, Ryan BL, Reichert S: Nonconventional diabetes-related care strategies for patients with chronic kidney disease: A scoping review of the literature. J Comorb 9: 2235042X19831918, 2019 [DOI] [PMC free article] [PubMed] [Google Scholar]
- 65.Tuttle KR, Bakris GL, Bilous RW, Chiang JL, de Boer IH, Goldstein-Fuchs J, Hirsch IB, Kalantar-Zadeh K, Narva AS, Navaneethan SD, Neumiller JJ, Patel UD, Ratner RE, Whaley-Connell AT, Molitch ME: Diabetic kidney disease: A report from an ADA Consensus Conference. Diabetes Care 37: 2864–2883, 2014. 10.2337/dc14-1296 [DOI] [PMC free article] [PubMed] [Google Scholar]
- 66.The College of Family Physicians of Canada: Best advice guide: Patient rostering in family practice. Available at: https://www.cfpc.ca/en/policy-innovation/health-policy-goverment-relations/cfpc-policy-papers-position-statements/best-advice-guide-patient-rostering. Accessed September 21, 2020
Associated Data
This section collects any data citations, data availability statements, or supplementary materials included in this article.
Supplementary Materials
Flow diagram of inclusions and exclusions. Download Supplemental Figure 1, PDF file, 221 KB (220.6KB, pdf)
RECORD checklist of recommendations for the reporting of studies conducted using routinely collected health data. Download Supplemental Table 1, PDF file, 221 KB (220.6KB, pdf)
List of variables and data sources. Download Supplemental Table 2, PDF file, 221 KB (220.6KB, pdf)
Diabetes care gaps. Download Supplemental Table 3, PDF file, 221 KB (220.6KB, pdf)