

Abstract
Previous studies in our laboratory have suggested that the increase in stillbirth in pregnancies complicated by chronic maternal stress or hypercortisolemia is associated with cardiac dysfunction in late stages of labor and delivery. Transcriptomics analysis of the overly represented differentially expressed genes in the fetal heart of hypercortisolemic ewes indicated involvement of mitochondrial function. Sodium dichloroacetate (DCA) has been used to improve mitochondrial function in several disease states. We hypothesized that administration of DCA to laboring ewes would improve both cardiac mitochondrial activity and cardiac function in their fetuses. Four groups of ewes and their fetuses were studied: control, cortisol-infused (1 g/kg/day from 115 to term; CORT), DCA-treated (over 24 h), and DCA + CORT-treated; oxytocin was delivered starting 48 h before the DCA treatment. DCA significantly decreased cardiac lactate, alanine, and glucose/glucose-6-phosphate and increased acetylcarnitine/isobutyryl-carnitine. DCA increased mitochondrial activity, increasing oxidative phosphorylation (PCI, PCI + II) per tissue weight or per unit of citrate synthase. DCA also decreased the duration of the QRS, attenuating the prolongation of the QRS observed in CORT fetuses. The effect to reduce QRS duration with DCA treatment correlated with increased glycerophosphocholine and serine and decreased phosphorylcholine after DCA treatment. There were negative correlations of acetylcarnitine/isobutyryl-carnitine to both heart rate (HR) and mean arterial pressure (MAP). These results suggest that improvements in mitochondrial respiration with DCA produced changes in the cardiac lipid metabolism that favor improved conduction in the heart. DCA may therefore be an effective treatment of fetal cardiac metabolic disturbances in labor that can contribute to impairments of fetal cardiac conduction.
Keywords: cortisol, ECG, fetus, labor, stress
INTRODUCTION
Glucocorticoids play an important role in organ maturation during late gestation of the human and ovine fetus (1–4). However, studies suggest that excess corticosteroids in human pregnancy, as would occur in maternal hypercortisolemia or chronic stress, increase the incidence of stillbirth (5–13). Previous studies in our laboratory in fetal sheep have shown that modest chronic increases in maternal cortisol in the last month of gestation (starting at approximately day 115 of gestation, equivalent to 80% of gestation) increased the incidence of stillbirth (14). Excess glucocorticoids have been shown to disrupt the normal maturation of the heart (15–18). In further studies, we have noted both bradycardia and an increase in arrhythmias in the fetuses of the cortisol-treated ewes at the time of birth (19). Transcriptomics provided the hypothesis that the mechanism was related to impaired mitochondrial function and oxidative phosphorylation. Specifically, PDK4 (pyruvate dehydrogenase kinase isoform 4) mRNA expression was significantly increased in fetal heart and skeletal muscles in response to maternal cortisol treatment (20, 21). PDK4, the isoform of the pyruvate dehydrogenase kinase predominantly expressed in the heart (22), inhibits the activity of pyruvate dehydrogenase complex (PDC), which normally promotes flux of glycolytically derived pyruvate into the mitochondria to stimulate aerobic respiration and ATP generation. Glucocorticoids are known to transcriptionally increase PDK4. PDC activity is decreased by almost half in the septum of newborn lambs of cortisol-treated ewes (unpublished). In addition, mitochondrial DNA content decreased in the hearts and biceps femoris of the late gestation fetuses from cortisol-infused ewes (20, 21), and cytochrome c oxidase protein content decreased in the hearts of newborn lambs of cortisol-infused ewes (23). Thus, chronic exposure to excess maternal cortisol in late gestation may be associated with decreased mitochondrial oxidative capacity in the fetal heart, leading to a fall in ATP production during labor and delivery. Hence, we hypothesized that pharmacological inhibition of cardiac PDK4 would stimulate PDC activity and thus, myocardial bioenergetics that, in turn, would translate into enhanced fetal heart function during labor.
To test this hypothesis, we administered sodium dichloroacetate (DCA), a PDK inhibitor (24), in early labor to determine if increased PDC activity could improve fetal cardiac mitochondrial respiration and thus, function. Our previous study with intravenously administered DCA in pregnant ewes demonstrated that DCA decreased plasma lactate levels in both the mother and fetus (25). In the present study, we investigated whether DCA administered to the mother during labor affected fetal cardiac electrophysiology and mitochondrial metabolism in the basal state and following administration of cortisol to the mother.
METHODS
Experimental Design and Animal Use
All use of animals in this study was approved by the University of Florida Institutional Animal Care and Use and Committee. The overall experimental design and timeline for animal treatments is shown in Fig. 1. The study included four groups of animals: control, no cortisol or DCA treatment (n = 7); CORT, ewes treated with cortisol (n = 7); control + DCA, ewes treated with DCA (n = 6); and CORT + DCA, ewes treated with cortisol and DCA (n = 5). Animals in the CORT and CORT + DCA groups were implanted subcutaneously with pellets of cortisol hemisuccinate (Innovative Research, Sarasota, FL) midscapula or infused with cortisol hemisuccinate (Solu-Cortef, Pfizer, Inc.) using an ambulatory pump (3 D Micro Infusion Pump; Strategic Applications Inc.; Lake Villa, IL) to provide dosing of cortisol at 1 mg/kg/day beginning on days 115–116 of gestation until the end of the experiment when the animals were humanely killed. This dose of cortisol increased maternal cortisol concentrations to ∼1.5-fold, mimicking the rise in cortisol in moderate stress (26).
Figure 1.
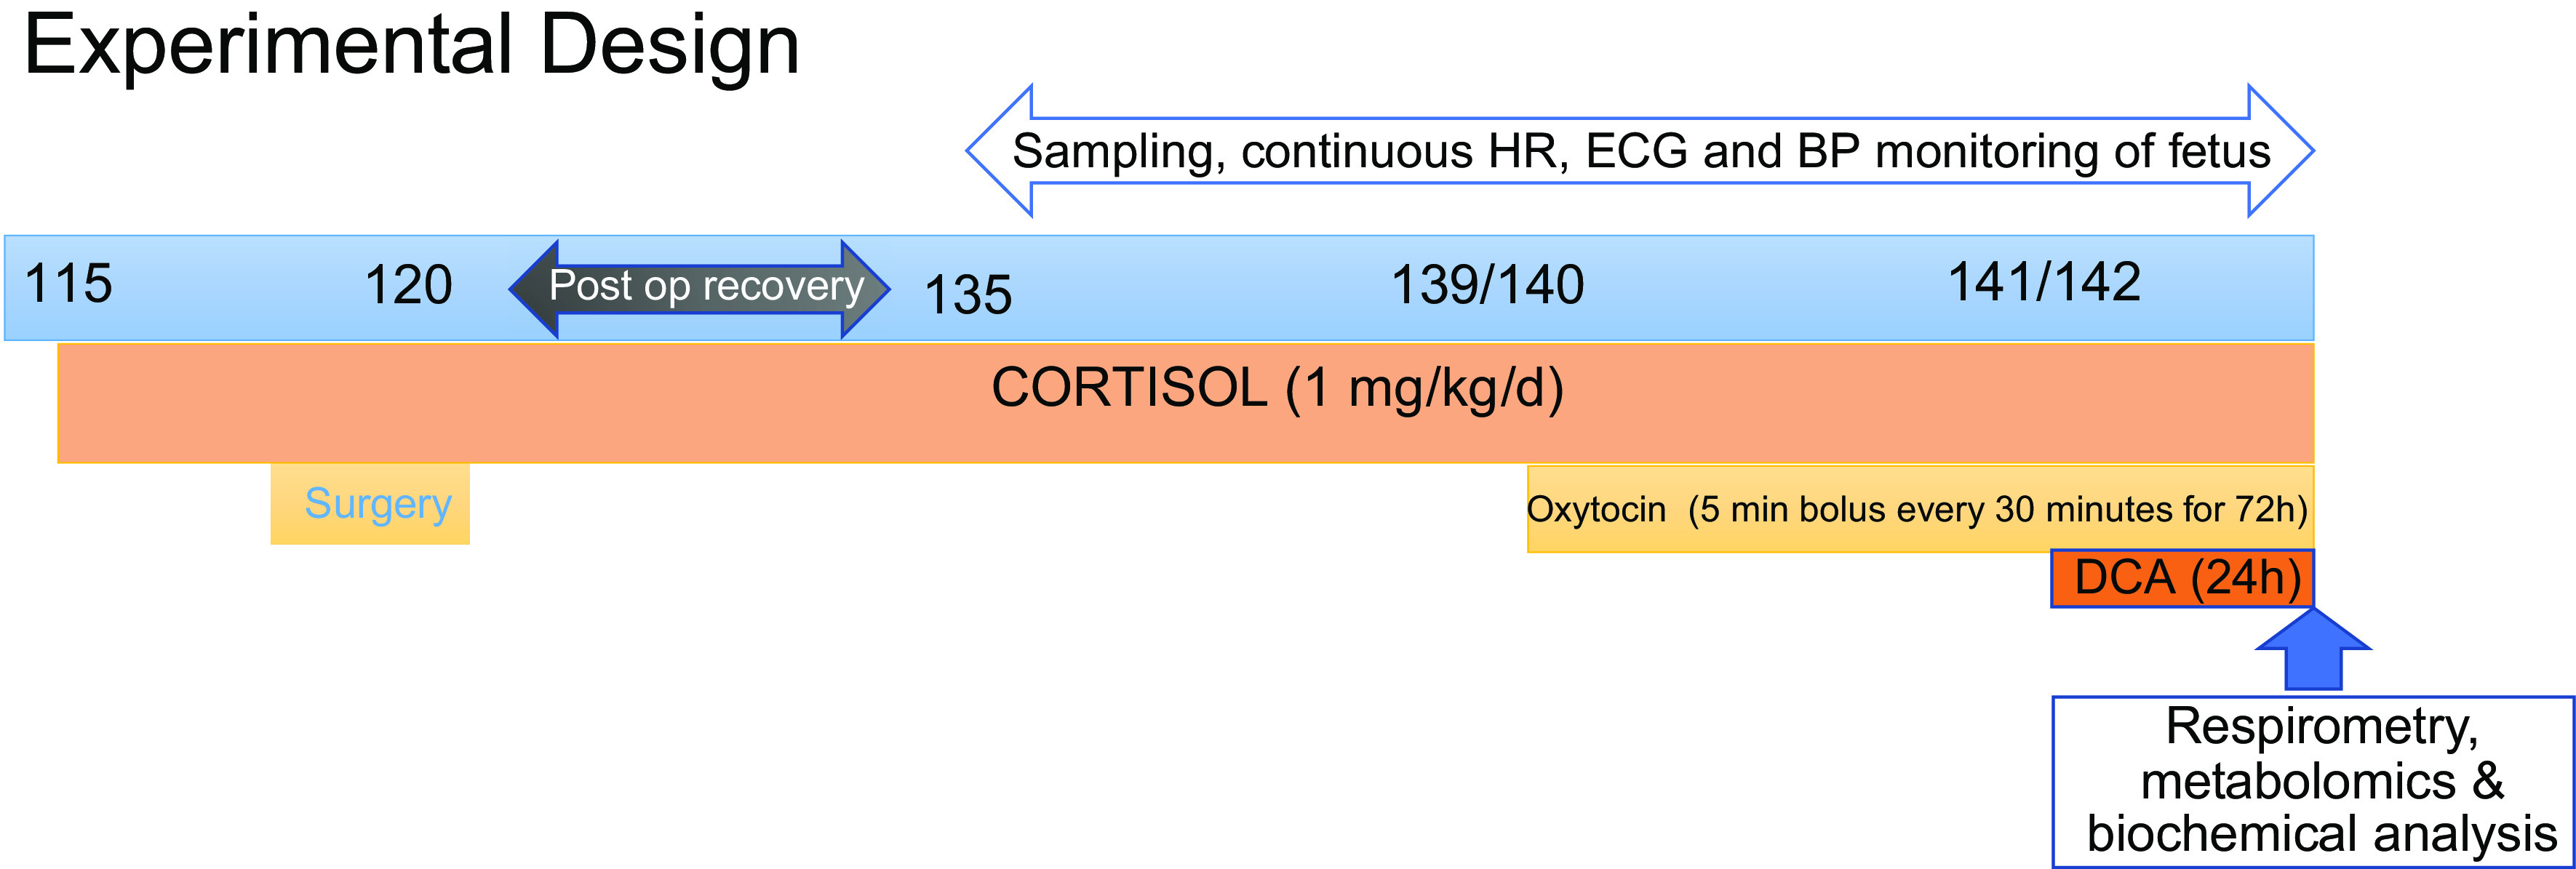
Summary of the experimental design depicting timing of treatments to the ewe. DCA, dichloroacetate; HR, heart rate.
Fetal and maternal catheters and a fetal telemetry device were surgically implanted between days 120 and 130 of pregnancy. Anesthesia in the pregnant ewes was either induced with isoflurane by mask and the ewe intubated for delivery of isoflurane anesthesia during the surgical procedure or anesthesia was induced with intravenous propofol and an intramuscular injection of ketamine after which the ewe was intubated and surgery was performed using isoflurane anesthesia and intravenous infusion of ketamine. A uterine flow probe (6 mm 6PSS; Transonics Inc., Ithaca, NY) was placed on the main uterine artery for measurement of uterine blood flow to assess progression of labor. A radiotelemetry transmitter (DSI PA- D70 PCTP or L21; Data Sciences International Inc., Minneapolis, MN) including two pressure catheters and biopotential and grounding leads was placed in the fetus to allow continuous measurement of fetal aortic pressure, amniotic pressure, ECG, and temperature. The transmitter was placed in the subcutaneous space of the fetal neck. The ground lead for ECG was secured to the fetal chest near the sternum; the biopotential lead was inserted into the fetal jugular vein and advanced until a strong P wave was identified. One pressure catheter was inserted into the fetal carotid artery, advanced to the aorta outside the heart, and secured in place with a purse-string tie and tissue adhesive (Vetbond glue, 3M, Minneapolis, MN). The second pressure catheter was sewn to the fetal neck with the lumen facing the amniotic fluid space. Both pressure catheters are fluid filled by the manufacturer; the surgical procedure and data collection with this system have been previously described (27).
Catheters (medical grade Tygon tubing; Saint Gobain Performance Plastics) were placed in the fetal tibial arteries and advanced to the femoral arteries, in the maternal femoral arteries to allow blood sampling during the study period, and into the maternal femoral veins to allow infusion of DCA and/or cortisol; these catheters were filled with heparin (10 U/mL) and plugged with sterile brads. Postoperative treatment of the ewes included measurement of rectal temperature (twice daily for 5 days), administration of antibiotics (Polyflex, ampicillin, 12.5 mg/kg twice daily for 5 days, Boehringer Ingelheim Vetmedica, St. Joseph, MO, or ceftiofur sodium, 2.2 ng/kg once daily for 3 days, Zoetis, Parsippany-Troy Hills, NJ), and with an analgesic (meloxicam, 1 mg/kg once daily for 2–3 days; Cipla USA, Inc, Warren, NJ), which was supplemented in some cases with one dose of flunixin meglumine (0.5 mg/kg; Merck Animal Health) (28). All animals were fed a pelleted feed ration calculated to meet National Research Council recommendations. The animals could move unrestrained in the pens.
After the end of postsurgical recovery period, a baseline blood sample was collected from each ewe on approximately day 135 of gestation. To produce a regular pattern of labor, ewes were infused with oxytocin (Aspen Veterinary Resources) beginning at days 138–140 of gestation; oxytocin was infused over 5 min every 30 min [820 µU/kg/min iv; (29)] using an infusion pump controlled by a timed controller (ChronTrol Corp, Inc.). Labor was monitored using changes in uterine blood flow (Transonics Physiogear; Transonics, Inc., Ithaca, NY) to assess the patterns of uterine contractures or contractions in the ewe over the course of the oxytocin treatment.
In those ewes infused with DCA (control + DCA or CORT + DCA groups), DCA infusion was started 48 h after the start of oxytocin. DCA was administered as an intravenous bolus of 25 mg/kg over 3 min, followed by an infusion of 12.5 mg DCA/kg/h for 8 h, and an infusion of 6.25 mg DCA/kg/h for the next 8 h. These doses are similar to those that significantly decrease circulating lactate concentrations in humans (30).
The timed infusions of oxytocin continued for 72 h, and the study was terminated after 24 h of DCA and/or 72 h of oxytocin infusion, unless ewes were in the process of delivery or birth occurred. Three lambs in the control + DCA group delivered after initiating treatment with DCA. They were euthanized within 30 min, 1 h, and 5–6 h after birth, respectively. One pregnancy in the CORT group ended in stillbirth; the data were included in all analyses except metabolomics and respirometry, as the sample failed the quality control test in the respirometry protocol.
Blood Samples and Analysis
Blood samples (∼7 mL) were collected from the ewe and fetus on approximately day 135 of gestation, before the start of the first oxytocin bolus (days 138–141 of gestation), at 5 min after the first pulse of oxytocin (+5 min), and at the end of a 5-min oxytocin pulse at 24, 48, and 72 h of oxytocin. Samples for cortisol analysis were collected in tubes containing heparin, samples for glucose and lactate were collected in tubes with potassium oxalate and sodium fluoride, and samples for metabolomics were collected without coagulant. Fetal blood samples collected in heparinized syringes were analyzed for fetal , , and pH (iSTAT Handheld; Abbott Point of Care, Inc.; Princeton, NJ or ABL80 FLEX CO-OX analyzer, Radiometer, Brea, CA) and the values were corrected for fetal body temperature of 39°C. Plasma glucose and lactate (YSI model 2700 Glucose/Lactate Analyzer, Yellow Springs, OH) and cortisol (EA65; Oxford Biomedical, Oxford, MI) were measured in both maternal and fetal plasma samples. In the animals treated with DCA, maternal and fetal blood samples (2 mL) were also collected in EDTA-containing tubes at −5 min, +5 min, 2, 4, 8, and 24 h of DCA infusion to measure DCA (31), as well as for glucose and lactate concentrations in maternal and fetal plasma.
One ewe in the control and one in the CORT group did not undergo surgery, and thus, no blood samples were collected during the study, but fetal tissues were collected and used in the respirometry analysis. One fetus in the control + DCA group also did not have fetal catheters, and therefore, did not have hormone, glucose, lactate, or blood gas values available. The average age of the fetuses at the time of euthanasia was 142 ± 1 days.
Maternal and fetal cortisol, glucose and lactate, and fetal blood gases were analyzed by two-way analysis of variance (ANOVA) corrected for repeated measures across time using values from samples collected before the first oxytocin bolus, 5 min after the first bolus, and 24 h later in order to determine effects of cortisol and time (SPSS software, IBM Corp.; Armonk, NY). Differences in mean values at specific time points were determined by post hoc Student’s t test using a Bonferroni adjustment. Missing values were substituted with the mean value at that time point for that group to avoid the loss of power and to facilitate a repeated two-way ANOVA in the maternal and fetal cortisol, glucose, and lactate. Mauchly’s test of sphericity was done to determine sphericity and if sphericity assumption failed, then P values from Greenhouse–Geisser test were used. Three-way analysis of variance was used to test for effects of DCA treatment and for interaction of cortisol and DCA on the values of glucose and lactate during the DCA infusion.
Analysis of Fetal Cardiovascular Variables
Fetal aortic pressure, heart rate (HR), and ECG were analyzed at specific times over the course of the study from the data continuously collected from the telemetry device (Ponemah 6.40 software, Data Sciences International Inc., Minneapolis, MN). Systolic pressure (SP), diastolic pressure (DP), and mean arterial pressure (MAP) values were corrected for amniotic pressure. For ECG, the Ponemah Analysis Module assigned patterns of ECG cycle (i.e., P wave, QRS, and T wave), which was adjusted by the operator to create a template library used to match the other ECG cycles for each subject (27). In all analyses of ECG, more than 80% of cycles matched to the template library. The MAP, SP, DP, and ECG parameters, P duration, PR interval, QRS duration, ST interval, and corrected QT interval [QTcb, using Bazett’s formula (32)], were analyzed as minute means for the 5 min before, 5 min during, and 5 min after oxytocin boluses at 1.5 h before the first bolus, and at 8, 12–12.5, 22.5, and 47–47.5 h after the first oxytocin bolus (n = 7 for all analyses, except n = 8 for HR and MAP analyses in the CORT group); these times were chosen for records of MAP and ECG during the 10-min interval. These data were analyzed by two-way repeated-measures ANOVA to determine effects of cortisol and time.
Some lambs delivered before the planned end of the study at 24 h of DCA treatment, and in one lamb, the DCA infusion did not continue for the full 24 h. Therefore, to assess the effects of DCA, we analyzed the data collected at 4 h (3.9 ± 0.1), 5 h (5.0 ± 0.1), and 6 h (6.1 ± 0.1) after DCA infusion (52, 53, and 54 h after the start of oxytocin boluses) by three-way ANOVA to determine interaction among effects of DCA, CORT, and time (control: n = 3; CORT: n = 4; control + DCA: n = 4; and CORT + DCA: n = 4). The effects of cortisol, DCA, and time were also analyzed for one pulse per hour over the last 3 h before the birth of the lamb or end of the study (at 19.1 ± 1.1, 20.1 ± 1.1, and 21.1 ± 1.1 h after start of the DCA infusion), to assess the effects of DCA on the changes close to delivery or the study end.
Cardiac Metabolomic Analysis
Samples of left ventricular and right ventricular free wall and interventricular septum were snap frozen in liquid nitrogen and stored at −80°C or on dry ice before analysis. Samples of all three sections of the heart were independently analyzed for metabolomics using high-resolution magic angle spinning (HRMAS) proton nuclear magnetic resonance (1H-NMR).
Sample order was randomized, and each part of the heart was measured as one batch following the same sample order. Heart tissues were cut to ∼30 mg and weighted (control: 35.98 ± 5.44 mg; CORT: 32.51 ± 5.38 mg; control + DCA: 31.88 ± 6.84 mg; CORT + DCA: 32.01 ± 5.81 mg). Each tissue was added to 30 µL of D2O (Cambridge Isotope Labs, Inc.) with 10/3 mM sodium 3-(trimethylsilyl)propane-1-sulfonate (DSS; Cambridge Isotope Labs, Inc.) and transferred to a 4-mm zirconium dioxide rotor with Kel-F cap and polytetrafluoroethylene spacer provided by Bruker Biospin. Samples were kept on dry ice during sample preparation. Spectra were acquired on a Bruker NEO 600 MHz NMR spectrometer with a 4-mm CMP-HRMAS probe. The sample temperature was 283K and the HRMAS spinning rate was 6,000 Hz. For each sample, we collected a one-dimensional (1 D) 1H nuclear Overhauser effect spectroscopy with water presaturation (NOESYPR) spectrum, a 1 D 1H Carr–Purcell–Meiboom–Gill (CPMG) with water presaturation spectrum, and a 2 D 1H J-resolved (Jres) with water presaturation spectrum.
Buffer blank controls were measured before, after sets of ∼8 samples, and after each batch of samples for quality assurance. Spectra with bad shimming quality were recollected. Because data acquisition required ∼30 min for each sample, when possible, new pieces of tissue from the same sample were used for remeasurement to avoid the impact of degradation. If a sample had visible adipose tissue, its spectrum was also recollected. Nineteen of the spectra from the left ventricular samples were collected ∼3 mo earlier than the other samples. However, principal component analysis (PCA) did not show separations between spectra collected in different batches (data not shown), indicating that batch effects were not significant.
For spectral annotation, samples after HRMAS acquisition were pooled by group for extraction. Polar extraction was performed following the same protocol as Joseph et al. (33). Briefly, samples were extracted using 80:20 MeOH:H2O with homogenization and reconstituted in NMR buffer (1 M sodium phosphate + 0.33 mM DSS). For each extraction sample, 1H-13C heteronuclear single-quantum coherence (HSQC) and 1H-13C heteronuclear single-quantum coherence–total correlation spectroscopy (HSQC-TOCSY) spectra were collected at 600 MHz at 298K on Bruker AVIII-HD with a 5-mm TXI cryoprobe. 1 D noesypr spectra were also collected before and after 2 D experiments for each sample. Buffer blank and extraction blank were included for 1 D NMR acquisition to monitor for extraction contamination. NMR acquisition for annotation was automated using iconNMR.
To identify the lipids in the HRMAS spectra, lipid extraction was also performed following HRMAS data collection. Because the three sections had the similar lipid compositions, one representative sample was used for lipid extraction. A tissue sample of left ventricular free wall (89.15 mg, not measured on HRMAS experiments) was extracted by isopropyl alcohol (IPA) with homogenization and dissolved in 500 µL CDCl3 (Cambridge Isotope Labs, Inc.) for NMR acquisition. The experiment included one extraction control sample for quality assurance. For the extraction control and tissue extraction sample, 1H-13C HSQC, 1H-1H TOCSY, 1H-13C HSQC-TOCSY spectra, 1 D spectra before 2 D experiments, and 1 D spectra after 2 D experiments were collected at 600 MHz at 298K on Bruker AVIII-HD with a 5-mm TXI cryoprobe.
For statistical analysis, HRMAS spectra were imported to MATLAB. The water region (4.79–5.15 ppm) and regions below −0.5 ppm or after 10 ppm were removed from analysis. Spectra were aligned by Constrained Correlation Optimized Warping (CCOW) alignment [https://doi.org/10.1016/S0021-9673(98)00021-1] and normalized by probabilistic quotient normalization (34). Spectra were bucketed into bins semiautomatically with an in-house peak picking algorithm and custom optimized bucketing (https://doi.org/10.1016/j.chemolab.2013.01.006) MATLAB scripts, resulting in 265 bins. Orthogonal signal-corrected partial least squares discriminant analysis (OSC-PLSDA) was conducted on these 265 bins for discriminant analysis via PLS Toolbox (version 881, Eigenvector Research, Inc., Manson, WA). Data were autoscaled in the OSC-PLSDA. The top 15 metabolites were identified based on VIP score ranking from OSC-PLSDA on both noesypr spectra and CPMG spectra; one representative bin was used for metabolites with more than one bin. A three-way ANOVA (factors were CORT, DCA, and tissue: LV, IVS, or RV) was conducted on these 15 metabolites. Because there was no CORT effect found for any of the metabolites, two-way ANOVA was performed to determine effects of DCA and tissue location. Their P values were false discovery rate (FDR) corrected by Benjamin–Hochberg method. Fold-change was calculated by dividing the mean of one group by the mean of the other group (group names indicated in the tables).
The metabolomics data are available at the NIH Common Fund's National Metabolomics Data Repository (NMDR) website, the Metabolomics Workbench (35), https://www.metabolomicsworkbench.org, where it has been assigned Project ID PR001179. These data include detailed NMR experimental parameters and supplemental data (Supplemental Tables S1, S2, and S3; PR001179 includes study ST 001867 containing CMPG data and ST001868 containing noesy data.
Measurement of Mitochondrial Respiration by High-Resolution Respirometry
Mitochondrial respiration was assessed in samples of cardiac interventricular septum and diaphragm collected from the fetus at necropsy. Tissue was quickly collected into ice-cold biopsy preservation medium (BIOPS: 2.77 mM CaK2EGTA, 7.23 mM K2EGTA, 5.77 mM Na2ATP, 6.56 mM MgCl2·6H2O, 20 mM taurine, 15 mM Na2phosphocreatine, 20 mM imidazole, 0.5 mM dithiothreitol, and 50 mM MES, pH adjusted to 7.1 at 0°C using 5 N KOH) (36) and analyzed as soon as possible after collection without freezing. To facilitate measurement of mitochondrial function within the cytoarchitecture of the cell, we assessed oxygen consumption of permeabilized muscle fibers. Briefly, muscle fiber bundles of heart or diaphragm tissue were cleaned from fat and connective tissue, the fibers, immersed in BIOPS, carefully teased apart with fine forceps, and the bundles subsequently permeabilized with saponin (50 µg saponin/mL BIOPS) for 15 or 20 min, respectively, on a rotator at 2°C–8°C. Permeabilization was followed by a 10-min wash step in ice-cold respiration medium (MiR05: 0.5 mM EGTA, 3 mM MgCl2·6H2O, 60 mM lactobionic acid, 20 mM taurine, 10 mM KH2PO4, 20 mM HEPES, 110 mM d-sucrose, and 1 g/L BSA essentially fat acid free, pH 7.10) (36). The permeabilized muscle fiber bundle was gently blotted dry using filter paper, weighed (1–3 mg of heart; 2–5 mg of diaphragm), and immediately transferred to a previously calibrated Oroboros O2K oxygraph chamber (Oroboros Instruments, Innsbruck, Austria). The chamber was maintained at 39°C and contained MiR05 with 20 mM creatine, which was supplemented to facilitate mitochondrial ATP transport (37, 38). Samples were assessed in duplicate under hyperoxic conditions to avoid oxygen diffusion limitation (290–500 µM O2), as previously described (36).
Oxygen consumption, or O2 flux, was measured using substrate-uncoupler-inhibitor titration (SUIT) protocols. The SUIT protocols allowed us to assess function of the electron transport system (ETS) complexes and to determine maximum capacity of the ETS. Specifically (concentrations in parentheses denote final concentrations in the oxygraph chamber), we measured 1) LEAK respiration (L) after TCA cycle stimulation with NADH-linked substrates pyruvate (5 mM), glutamate (10 mM), malate (2 mM) to support electron flow through complex I (CI) of the ETS; 2) activated, CI-supported respiration (OXPHOS; PCI) after addition of adenosine diphosphate (ADP, 2.5 mM); 3) activated, CI- and CII-supported respiration (OXPHOS; PCI + II) after addition of succinate (10 mM); 4) uncoupled respiration, representing maximum ETS capacity (ECI + II) after step-wise titration of the uncoupler carbonyl cyanide 4-(trifluoromethoxy) phenylhydrazone (FCCP; 0.5-µL steps of a 0.1 mM stock solution); 5) maximum ETS capacity in the presence of CII-supporting substrate only (ECII) after addition of CI inhibitor rotenone (0.5 µM); 6) residual, nonmitochondrial oxygen consumption (ROX) after inhibiting complex III (CIII) of the ETS with antimycin A (2.5 µM; ROX was subtracted from all preceding respiratory states); and 7) maximum electron transport capacity of complex IV (CIV) of the ETS (ECIV) after addition of N,N,N′,N′-tetramethyl-p-phenylenediamine (TMPD, 0.5 mM) in the presence of ascorbate (2 mM; to prevent TMPD-autoxidation). The chemical background oxidation rate in the presence of TMPD/ascorbate was assessed by adding the complex IV inhibitor sodium azide (100 mM; chemical background flux was subtracted from the preceding ECIV flux). Mitochondrial outer membrane integrity was evaluated in the SUIT protocol in respiratory state PCI + II by the addition of cytochrome c (10 µM). Only samples with a response to cytochrome c addition that remained equal or below a 15% increase in flux were included in the analysis.
Data were acquired and analyzed using Oroboros data acquisition and analysis software (DatLab, version 7.1; Oroboros Instruments). Analysis of raw data (O2 flux) was performed by the same person to avoid variability. Oxygen flux was recorded as O2 consumed per unit time and mg tissue (pmol O2/s/mg wet wt) and represented integrative mitochondrial respiratory function (respiratory function per tissue mass). To evaluate intrinsic mitochondrial respiratory function (respiratory function per mitochondrial unit), we normalized mass-specific O2 flux to mass-specific citrate synthase (CS) activity as a proxy measure for mitochondrial content (39), resulting in intrinsic O2 flux per unit CS activity (pmol O2/s/U CS activity). CS activity was measured by adapting a previously described method (40). Briefly, cryopulverized tissues (cardiac septum and diaphragm) were homogenized in sucrose buffer containing 5% n-dodecyl B-maltoside, the homogenate cleared by centrifugation, and CS activity analyzed in a kinetic spectrophotometric assay at 412 nm by measuring the linear rate of reaction of free CoA-SH with DTNB. Flux control ratios (FCRs) were calculated as ratios of mass specific O2 flux in different respiratory states normalized to maximum ETS capacity (ECI + II) as the reference state. Flux control ratios represent an internal normalization that renders the respective mitochondrial respiratory function independent of mitochondrial content and assay conditions (tissue weight or normalization to a mitochondrial content marker).
Integrative and intrinsic oxygen flux as well as FCR data were statistically compared by a two-way ANOVA. Flux control ratios for L and PCI + II were log-transformed to achieve normality before ANOVA. A nonparametric equivalent was used when conditions of normality were not met after a log transformation; Kruskal–Wallis one-way ANOVA was used to compare data for FCRs of PCI and PCII in the cardiac septum.
Assessment of the Fetal Cardiac PDC/PDK Axis
To assess effects on the PDC, the abundance of PDK2 and PDK4, the two kinases that phosphorylate and inactivate the PDC component PDHE1α (pyruvate dehydrogenase E1α), and the phosphorylated form of PDHE1α were assessed. Protein extracts were prepared for immunoblotting from whole tissue homogenates of the interventricular septum. Tissue samples were sonicated on ice in a buffer (50 mM Tris, pH 8.0, 150 mM NaCl, 1% NP-40, 1 mM sodium orthovanadate) containing phosphatase and protease inhibitors and centrifuged at 13,000 rpm for 15 min. Samples were denatured in loading buffer with 10% β-mercaptoethanol by boiling for 5 min. Equal concentrations of proteins were loaded on a polyacrylamide gel, and proteins subsequently transferred to a nitrocellulose membrane. Equal protein loading was confirmed using a total protein stain (Revert 700 total protein stain; Li-Cor Biosciences, Lincoln, NE). The abundance of PDK2 (Cat. No. ab68164, 1:1,000; Abcam, Cambridge, MA) and PDK4 (Cat. No. ab1103369, 1:2,000), the phosphorylated form of the PDHE1α subunit (p-S293; Cat. No. ab177461, 1:1,000), and the total PDHE1α subunit (Cat. No. ab110334, 1:1,000) was determined. Antibodies were validated by testing for increase in intensity of signal with increasing concentrations of proteins and the presence of band at the specified bandwidth by the manufacturers. The blots were probed after treating with secondary antibodies (1:20,000) specific to the species in which the primary antibody was generated, and the immunoblots were imaged using the Li-Cor system. The blots were normalized to the total protein stain intensity in equal areas across the blot, in the same molecular mass range (∼70–15 kDa for the p-PDHE1α subunit blot/total PDHE1α subunit blot, ∼125–70 kDa for the PDK2 blot, and ∼160–15 kDa for the PDK4 blot). Total PDC activity was measured in whole tissue homogenates of the interventricular septum using a commercially available assay kit (PDH immunocapture kit, Cat. No. ab109902).
RESULTS
Effect of Maternal Cortisol on Maternal and Fetal Cortisol Concentrations
Chronic infusion of cortisol to the ewe increased the maternal plasma cortisol concentrations; the average maternal plasma cortisol values in the control and CORT groups were 15.0 ± 3.2 and 24.0 ± 4.5 ng/mL, respectively. There was no significant effect of oxytocin on maternal cortisol concentrations (Fig. 2). There was a significant effect of time (P < 0.001) on fetal cortisol concentrations over the oxytocin treatment; however, there was no significant main effect of maternal cortisol treatment, and there was no interaction between time of oxytocin administration and maternal cortisol treatment, likely reflecting that fetal adrenal cortisol production becomes the main source of circulating fetal cortisol in late gestation.
Figure 2.

Maternal (left) and fetal (right) cortisol concentrations at 135 days gestation, and before (0 h) and after the start of oxytocin (at end of first pulse at 5 min, and after pulses at 24 h and 48 h). Circles represent data from control group; squares represent data from CORT group; hatched symbols are data collected before DCA infusion; open symbols at 48 and 72 h are from the groups not treated with DCA, closed symbols are from DCA-treated animals. All data are shown as means ± SE for 6 control fetuses (4 females, 2 males), 6 CORT (3 females, 3 males), 5 CORT + DCA (3 female and 2 male), and 6 control + DCA (4 males and 2 females; last time point n = 3 fetuses). CORT, cortisol-infused; DCA, dichloroacetate.
Effect of Maternal Cortisol and DCA on Maternal and Fetal Glucose, Lactate, and Blood Gases
There was a small, but significant increase in Pco2 after the first oxytocin bolus (Table 1). Cortisol administration to the ewe did not alter either the fetal Po2, Pco2, or pH responses to administration of oxytocin. There was also no significant effect of DCA administration on fetal blood gases or pH (Table 1).
Table 1.
Fetal blood gas values at 135 days and immediately before the first oxytocin infusion (pre), at the end of the first infusion (5 min), and at the end of the 5-min infusions delivered 24, 48, and 72 h
| Po2, mmHg |
Pco2, mmHg |
pH |
||||
|---|---|---|---|---|---|---|
| Sample Time | Control | Cortisol | Control | Cortisol | Control | Cortisol |
| 135 days (basal) | 18 ± 1 (10) |
19 ± 1 (11) |
51 ± 1 (10) |
51 ± 1 (11) |
7.37 ± 0.01 (10) |
7.37 ± 0.00 (11) |
| Pre, first oxytocin infusion | 19 ± 1 (11) |
21 ± 1 (11) |
51 ± 1 (11) |
50 ± 1 (11) |
7.37 ± 0.01 (11) |
7.38 ± 0.01 (11) |
| 5 min after first oxytocin infusion at 0 h | 16 ± 1 (10) |
19 ± 1 (11) |
52 ± 1 (10) |
52 ± 1 (11) |
7.35 ± 0.01 (10) |
7.37 ± 0.01 (11) |
| 5 min after oxytocin infusion at 24 h | 17 ± 1 (11) |
19 ± 1 (11) |
51 ± 1 (11) |
50 ± 1 (11) |
7.37 ± 0.01 (11) |
7.38 ± 0.01 (11) |
| No DCA | +DCA | No DCA | +DCA | No DCA | +DCA | No DCA | +DCA | No DCA | +DCA | No DCA | +DCA | |
|---|---|---|---|---|---|---|---|---|---|---|---|---|
| After oxytocin infusion at 48 h | 19 ± 2 (4) |
16 ± 2 (5) |
19 ± 2 (4) |
18 ± 2 (5) |
50 ± 3 (4) |
53 ± 1 (5) |
51 ± 2 (4) |
52 ± 1 (5) |
7.35 ± 0.02 (4) |
7.36 ± 0.01 (5) |
7.37 ± 0.01 (5) |
7.38 ± 0.01 (5) |
| After oxytocin infusion at 72 h | 20 ± 2 (4) |
16 ± 2 (4) |
19 ± 2 (4) |
19 ± 2 (5) |
52 ± 1 (4) |
53 ± 1 (4) |
48 ± 2 (4) |
51 ± 1 (5) |
7.34 ± 0.03 (4) |
7.37 ± 0.01 (4) |
7.39 ± 0.02 (4) |
7.39 ± 0.01 (5) |
Dichloroacetate (DCA) was infused into the ewes starting at 48 h and continuing until 72 h or delivery of the fetus. Data are expressed as means ± SE (n, number of fetuses).
Maternal plasma glucose concentrations were significantly increased during oxytocin administration in both groups, but there was no significant effect of cortisol treatment on maternal glucose concentrations or on the increase in maternal plasma glucose concentrations during oxytocin administration (Table 2). Maternal plasma lactate concentrations were also not significantly different between the control and CORT ewes during oxytocin administration before DCA treatment (Table 2).
Table 2.
Maternal and fetal plasma glucose and lactate values at 135 days and immediately before the first oxytocin infusion (pre), at the end of the first infusion (5 min), and at the end of the 5-min infusions delivered 24, 48, and 72 h
| Maternal |
Fetal |
|||||||
|---|---|---|---|---|---|---|---|---|
| Plasma glucose, mM |
Plasma lactate, mM |
Plasma glucose, mM |
Plasma lactate, mM |
|||||
| Sample time | Control | Cortisol | Control | Cortisol | Control | Cortisol | Control | Cortisol |
| Pre, first oxytocin infusion | 3.7 ± 0.1 (10) |
3.6 ± 0.1 (11) |
0.69 ± 0.06 (11) |
0.81 ± 0.08 (11) |
1.0 ± 0.1 (11) |
1.1 ± 0.1 (11) |
1.68 ± 0.11 (11) |
1.81 ± 0.18 (11) |
| 5 min (after first oxytocin infusion) |
3.9 ± 0.1 (11) |
3.8 ± 0.1 (11) |
0.77 ± 0.06 (10) |
0.87 ± 0.08 (11) |
1.0 ± 0.1 (10) |
1.1 ± 0.1 (10) |
1.82 ± 0.12 (10) |
1.82 ± 0.18 (10) |
| After oxytocin infusion at 24 h | 3.8 ± 0.2 (10) |
3.5 ± 0.2 (11) |
0.69 ± 0.04 (11) |
1.18 ± 0.23 (11) |
1.0 ± 0.1 (11) |
1.1 ± 0.1 (11) |
2.02 ± 0.22 (11) |
2.18 ± 0.12 (11) |
| No DCA | +DCA | No DCA | +DCA | No DCA | +DCA | No DCA | No DCA | +DCA | +DCA | No DCA | +DCA | No DCA | +DCA | No DCA | +DCA | |
|---|---|---|---|---|---|---|---|---|---|---|---|---|---|---|---|---|
| After oxytocin infusion at 48 h | 3.9 ± 0.1 (4) |
4.8 ± 0.5 (5) |
4.0 ± 0.1 (4) |
3.6 ± 0.2 (5) |
0.8 ± 0.1 (4) |
0.7 ± 0.2 (5) |
0.8 ± 0.1 (4) |
1.4 ± 0.4 (4) |
1.0 ± 0.1 (5) |
1.2 ± 0.3 (5) |
1.2 ± 0.1 (4) |
1.0 ± 0.1 (5) |
1.8 ± 0.2 (4) |
3.3 ± 0.9 (5) |
2.0 ± 0.2 (4) |
3.0 ± 1.0 (5) |
| After oxytocin infusion at 72 h | 4.3 ± 0.4 (4) |
3.7 ± 0.1 (4) |
3.7 ± 0.22 (4) |
3.8 ± 0.2 (5) |
0.7 ± 0.1 (4) |
0.3 ± 0.0 (4) |
0.6 ± 0.0 (4) |
0.4 ± 0.1 (4) |
1.2 ± 0.1 (4) |
0.7 ± 0.4 (4) |
1.1 ± 0.1 (4) |
1.0 ± 0.1 (4) |
1.9 ± 0.6 (4) |
1.3 ± 0.3 (4) |
2.2 ± 0.2 (4) |
2.0 ± 0.7 (4) |
Dichloroacetate (DCA) was infused into the ewes starting at 48 h and continuing until 72 h or delivery of the fetus. Data are expressed as mean ± SE (n, number of fetuses).
Maternal cortisol treatment also did not significantly change fetal plasma glucose concentrations in the fetus before the start of oxytocin (Table 2). There was no effect of oxytocin administration on fetal plasma glucose concentrations, nor an interaction of the cortisol treatment on the response over time during oxytocin administration. Maternal cortisol treatment also did not significantly change fetal lactate levels. Fetal lactate levels increased significantly over the course of oxytocin treatment; however, there was no difference in this increase between those in the CORT and control groups.
Although there was a tendency (P = 0.06) for DCA treatment to reduce maternal lactate concentrations, maternal lactate was not significantly different between groups (control vs. CORT) during DCA treatment (Table 2). There was a significant effect of cortisol on the maternal glucose response to DCA; however, this appears to be the result of unexpectedly high maternal plasma glucose in some ewes in the control group at the start of the DCA infusion. DCA treatment did not alter fetal lactate concentration. Fetal plasma glucoses tended to be reduced by DCA in the CORT fetuses, but not in control fetuses (Table 2; P = 0.06 for the interaction of DCA, CORT, and time).
Effect of Maternal Cortisol and DCA Treatment on Fetal Cardiovascular Variables
There was a significant effect of time on MAP, but no effect of cortisol on the response over time to the infusions of oxytocin (Table 3). Cortisol did significantly alter the HR response to oxytocin over the course of the oxytocin treatments; in the CORT fetuses, HR tended to initially increase over time (Table 3). There was also an interaction between cortisol and time on several aspects of the ECG: PR interval was reduced and ST interval was increased in the CORT fetuses with the continuing oxytocin treatment. Corrected QT interval (QTcb) also tended to increase in the CORT fetuses, although this difference over time did not achieve statistical significance (P = 0.08). There were no differences in the QRS duration response to oxytocin with cortisol treatment, although there was a tendency for QRS duration to be longer in the CORT fetuses (main effect of cortisol, P = 0.056; Table 3).
Table 3.
Fetal mean arterial pressure (MAP), heart rate (HR), PR interval (PR-I), ST interval (ST-I), and QRS duration calculated from the ECG data over 10 min starting at the start of the first and subsequent infusions of oxytocin at 8, 12, 22.5, and 48 h
| MAP, mmHg |
HR, beats/min |
PR-I, ms |
ST-I, ms |
QRS Duration, ms |
||||||
|---|---|---|---|---|---|---|---|---|---|---|
| Sample time | Control | Cortisol | Control | Cortisol | Control | Cortisol | Control | Cortisol | Control | Cortisol |
| 0 | 50.5 ± 2.8 (7) |
48.7 ± 2.5 (8) |
157 ± 7 (7) |
149 ± 5 (7) |
82.2 ± 4.7 (7) |
81.0 ± 3.7 (7) |
162.7 ± 8.4 (7) |
170.7 ± 5.8 (7) |
36.4 ± 1.6 (7) |
41.6 ± 3.1 (7) |
| 8 h | 51.9 ± 2.4 (7) |
52.3 ± 2.7 (8) |
159 ± 8 (7) |
155 ± 6 (7) |
81.8 ± 4.1 (7) |
83.4 ± 3.0 (7) |
166.0 ± 6.9 (7) |
163.1 ± 6.0 (7) |
37.8 ± 1.2 (7) |
43.3 ± 2.7 (7) |
| 12 h | 52.2 ± 1.5 (7) |
50.8 ± 3.3 (8) |
153 ± 7 (7) |
151 ± 4 (7) |
77.9 ± 2.7 (7) |
79.5 ± 3.2 (7) |
164.0 ± 8.6 (7) |
165.9 ± 6.8 (7) |
38.9 ± 1.2 (7) |
43.2 ± 3.2 (7) |
| 22.5 h | 51.1 ± 2.7 (7) |
50.1 ± 2.8 (8) |
145 ± 5 (7) |
150 ± 6 (7) |
82.1 ± 2.1 (7) |
78.2 ± 3.1 (7) |
168.0 ± 6.7 (7) |
169.8 ± 7.8 (7) |
38.3 ± 1.4 (7) |
41.5 ± 3.4 (7) |
| 48 h | 53.0 ± 3.5 (7) |
52.6 ± 2.4 (8) |
154 ± 8 (7) |
150 ± 4 (7) |
86.4 ± 5.6 (7) |
76.2 ± 3.2 (7) |
161.6 ± 7.0 (7) |
171.3 ± 3.7 (7) |
35.9 ± 1.5 (7) |
44.2 ± 2.6 (7) |
Values are the means over 10 min ± SE (n, number of fetuses).
To assess the effect of DCA treatment in labor, we examined the ECG during boluses of oxytocin 4–6 h after the start of the DCA (data not shown). There was a significant effect of DCA to reduce HR and duration of the QRS. In contrast, although there was still a cortisol effect over time on both PR and ST intervals, there was no interaction between cortisol and DCA on PR or ST intervals. In the last period before delivery (for the 2 lambs who delivered) or close to the end of the study (within 3 h of the end of the study), we analyzed data from three oxytocin pulses at approximately 19, 20, and 21 h after the start of the DCA treatment (Fig. 3, data from 20 h). Over these times, there was no significant effect of cortisol or DCA on HR or MAP, but there was significant interaction between DCA and cortisol over time on fetal QRS duration. The QRS duration was longer in fetuses of CORT ewes and was normalized by DCA (Fig. 3). P wave duration also tended to be increased in the CORT fetuses and normalized by DCA treatment, although the interaction between CORT and DCA was not statistically significant (P = 0.06; Fig. 3).
Figure 3.

Fetal mean aortic pressure (MAP), heart rate (HR), P width, ST interval (middle), and QRS duration (bottom) calculated from the fetal ECG during an oxytocin pulse administered at 48 h after start of oxytocin pulses (left); n = 7 control (4 males, 3 females), 7 CORT (3 males, 4 females) for ECG, 8 CORT for HR and MAP (3 males, 5 females). Data are also shown at ∼20 h after the start of DCA infusion (∼68 h after the start of oxytocin pulses; right); n = 3 control fetuses (2 males, 1 female), 4 CORT fetuses (2 males, 2 females), 4 control + DCA fetuses (3 males, 1 female), 4 CORT + DCA fetuses (1 male, 3 females). Circles represent data from control group; squares represent data from CORT group; cross-hatched symbols at 48 h represent pre-DCA infusion values, open symbols are from the groups not treated with DCA, and closed symbols are from DCA-treated animals. All data are shown as means ± SE. CORT, cortisol-infused; DCA, dichloroacetate; bpm, beats per minute.
Effect of Maternal Cortisol and DCA Treatment on Metabolomics in the Fetal Heart
Metabolic analysis of samples from right and left ventricular free walls and intraventricular septum by three-way ANOVA did not reveal any effects of maternal cortisol administration in these fetuses. There was an effect of DCA treatment on the metabolomics when data from CORT and control groups without DCA administration were compared with the CORT + DCA and control + DCA groups by two-way ANOVA (using DCA and site of sample as factors). The metabolites lactate and alanine were reduced in abundance in the hearts of the DCA-treated fetuses, along with peaks representing pantothenate (overlap with carnitine), fumarate, and glucose/glucose-6-phosphate. dl-α-glycerol phosphate, 1,2-propanediol, isobutyryl-carnitine, choline, ITP, peaks representing serine overlap with glycerophosphocholine, and peaks representing phosphoethanolamine overlap with serine were more abundant in the cardiac tissue of the DCA-treated fetuses (Fig. 4; Table 4). When comparisons were made of the samples in control fetuses with or without DCA treatment, glucose, threonine, as well as a peak of several overlapping amino acids including homoarginine were also less abundant in the DCA-treated fetuses (see Supplemental Table S2). When comparisons were made of CORT fetuses with and without DCA treatment, d-fructose/d-fructose-1-phosphate (overlap with asparagine), inosine, and glutamine were also reduced in the DCA-treated CORT fetuses, and guanosine was also increased with DCA (Supplemental Table S2).
Figure 4.

Variable influence on projection (VIP) from OSC-PLSDA of the top 15 metabolites identified by NMR metabolomics measurements (NOESYPR) in hearts (left and right ventricular free wall and septum) from fetuses treated with DCA as compared with non-DCA-treated fetuses (with and without maternal cortisol infusion). Inset shows the scores plot. Red symbols indicate metabolites with greater abundance in hearts of DCA-treated fetuses; green symbols indicate metabolites with reduced abundance in hearts of DCA-treated fetuses. For the DCA group, n = 48 tissue samples from 16 animals (control DCA and CORT + DCA), for non-DCA group, n = 39 tissue samples from 13 animals (control and CORT without DCA administration). UK indicates unknown. OL indicates overlap, OL1: phosphoethanolamine overlaps with serine, OL2: serine overlaps with glycerophosphocholine, OL3: pantothenate overlap with carnitine. CORT, cortisol-infused; DCA, dichloroacetate; NOESYPR, nuclear overhauser effect spectroscopy with water presaturation; OSC-PLSDA, orthogonal signal-corrected partial least squares discriminant analysis.
Table 4.
Metabolites with differential abundance in heart of fetuses after maternal DCA infusiona
| Metabolite | Fold-Change (DCA/Non-DCA) | FDR-Corrected P Value: DCA Treatmentb | FDR-Corrected P Value: Tissue Locationb | Confidence Scorec |
|---|---|---|---|---|
| Alanine | 0.83 | 3.16E-04 | 9.29E-01 | 4 |
| Lactate | 0.85 | 3.27E-04 | 1.73E-01 | 4 |
| UK3 | 0.84 | 1.35E-03 | 7.56E-01 | NA |
| UK10* | 0.65 | 4.59E-03 | 1.27E-01 | NA |
| UK2 | 1.22 | 5.28E-03 | 2.24E-01 | NA |
| OL2 | 1.19 | 2.04E-02 | 4.79E-01 | NA |
| UK6 | 1.21 | 2.04E-02 | 6.93E-02 | NA |
| OL1 | 1.17 | 2.12E-02 | 8.94E-01 | NA |
| Isobutyryl-carnitine | 1.21 | 2.19E-02 | 8.50E-01 | 2 |
| dl-α-glycerol phosphate | 1.19 | 2.73E-02 | 9.66E-01 | 4 |
| Acetylcarnitine/isobutyryl-carnitine* | 1.23 | 3.24E-02 | 5.19E-04 | 3/2 |
| Fumarate* | 0.72 | 3.25E-02 | 1.04E-04 | 3 |
| Choline* | 1.27 | 3.64E-02 | 8.99E-03 | 4 |
| 1,2-Propanediol | 1.15 | 4.63E-02 | 7.99E-01 | 4 |
| UK1 | 0.90 | 4.63E-02 | 6.15E-01 | NA |
| UK4 | 0.92 | 4.63E-02 | 8.50E-01 | NA |
| UK5 | 1.12 | 5.16E-02 | 8.21E-01 | NA |
| ITP | 1.18 | 5.16E-02 | 7.58E-02 | 3 |
| Glucose/glucose-6-phosphate* | 0.71 | 5.50E-02 | 6.49E-01 | 4/3 |
| OL3 | 0.88 | 5.69E-02 | 8.58E-01 | NA |
aMeasured by NOESYPR and CPMG. Metabolites that are only differentiating on CPMG spectra are labeled by *, metabolites that are differentiating on NOESYPR or NOESYPR + CPMG are not labeled. Fold-changes and P values are calculated from NOESYPR data if not labeled by *.
For non-DCA group, n = 39 tissue samples from 13 animals (control and CORT without DCA administration), for DCA group, n = 48 tissue samples from 16 animals (control DCA and CORT + DCA).
bP for DCA treatment effect in two-way ANOVA (DCA treatment and tissue location). The P values for the interaction (between DCA treatment and tissue location) term are all above 0.05 and are not included in the table.
cConfidence scale is defined as follows: 1) putatively characterized compounds or compound classes, 2) 1 D NMR matches to literature and/or database (BMRB and/or HMDB), 3) HSQC matches on COLMARm, 4) HSQC and HSQC-TOCSY match on COLMARm, and 5) verified by spiking.
UK indicates unknown. OL indicates overlap, OL1: phosphoethanolamine overlaps with serine, confidence scores are 4, 4, respectively, phosphoethanolamine peaks shift ∼0.005 ppm between on HRMAS and on polar extraction spectra; OL2: serine overlaps with glycerophosphocholine, confidence scores are 4, 3, respectively; OL3: pantothenate overlaps with carnitine, confidence scores are 3, 3, respectively.
CORT, cortisol-infused; CPMG, Carr–Purcell–Meiboom–Gill; DCA, sodium dichloroacetate; HRMAS, high-resolution magic angle spinning; HSQC, heteronuclear single-quantum coherence; NOESYPR, nuclear Overhauser effect spectroscopy with water presaturation; TOCSY, total correlation spectroscopy.
There was a significant correlation of the lactate and glycerol abundance in the heart with the HR in the last 3 h, and there was a correlation of the abundance of lactate, alanine, glutamine, glycerol, unsaturated fatty acid, and pantothenate to MAP in the last 3 h (Table 5). There were negative correlations of the acetyl carnitine/isobutyryl-carnitine to both HR and MAP, as well as between ITP and MAP and taurine and HR. Serine and the phospholipid breakdown product glycerophosphocholine were negatively correlated to QRS duration, whereas phosphorylcholine was positively correlated to QRS duration (Table 5).
Table 5.
Correlation of metabolite abundance in fetal/newborn hearts to mean arterial pressure (MAP), heart rate (HR), or QRS duration
| Metabolite | r | P Value | Confidence Scorea |
|---|---|---|---|
| Correlation to MAP | |||
| Alanine | 0.79 | 4.06E-04 | 4 |
| Glutamine | 0.64 | 1.01E-02 | 4 |
| Glycerol | 0.76 | 1.05E-03 | 4 |
| Lactate | 0.60 | 1.88E-02 | 4 |
| Isobutyryl-carnitine* | −0.70 | 3.71E-03 | 2 |
| ITP | −0.54 | 3.82E-02 | 3 |
| Pantothenate | 0.79 | 4.54E-04 | 3 |
| UK1* | 0.58 | 2.20E-02 | NA |
| Unsaturated fatty acidsb | 0.59 | 1.96E-02 | NA |
| Correlation to HR | |||
| Lactate | 0.60 | 1.35E-02 | 4 |
| Glycerol | 0.56 | 2.40E-02 | 4 |
| Taurine | −0.58 | 1.95E-02 | 4 |
| Isobutyryl-carnitine | −0.65 | 6.09E-03 | 2 |
| UK1* | 0.54 | 2.98E-02 | NA |
| Correlation to QRS duration | |||
| Glycerophosphocholine | −0.63 | 1.51E-02 | 3 |
| OL8 | 0.61 | 1.97E-02 | NA |
| UK6* | −0.65 | 1.23E-02 | NA |
| Serine | −0.63 | 1.60E-02 | 4 |
*Metabolite peaks from CPMG.
aConfidence scale is defined as follows: 1) putatively characterized compounds or compound classes, 2) 1 D NMR matches to literature and/or database (BMRB and/or HMDB), 3) HSQC matches on COLMARm, 4) HSQC and HSQC-TOCSY match on COLMARm, and 5) verified by spiking.
bPotential assignments of this peak are listed in Supplemental Table S3.
CPMG, Carr–Purcell–Meiboom–Gill; HSQC, heteronuclear single-quantum coherence; OL, overlap, OL8, threonine overlaps with phosphorylcholine; BMRB, Biological Magnetic Resonance Bank; HMDB, Human Metabolome Database; COLMAR, Complex Mixture Analysis by NMR;TOCSY, total correlation spectroscopy; UK, unknown metabolites.
Effect of Maternal Cortisol and DCA Treatment on Respirometry in the Fetal Cardiac Interventricular Septum
There was no significant effect of cortisol treatment on mitochondrial respiratory function in permeabilized muscle fibers from the cardiac septum (Fig. 5). On the other hand, administration of DCA, independent of the presence of cortisol, significantly increased mitochondrial activity, increasing integrative (per muscle mass) and intrinsic (normalized by weight-specific CS activity as indicator of mitochondrial content) OXPHOS (PCI, PCI + II; Fig. 5), and integrative maximum ETS capacity (ECI + II, ECII; Fig. 5). Intrinsic maximum ETS capacity did not change significantly with DCA administration. Furthermore, DCA did not affect maximum electron transferring capacity of C-IV (ECIV), which normally operates in excess. There was no significant interaction between cortisol and DCA for any of the mitochondrial respiratory states measured. Finally, there was no change in CS activity with cortisol administration or DCA treatment nor an interaction of the two.
Figure 5.
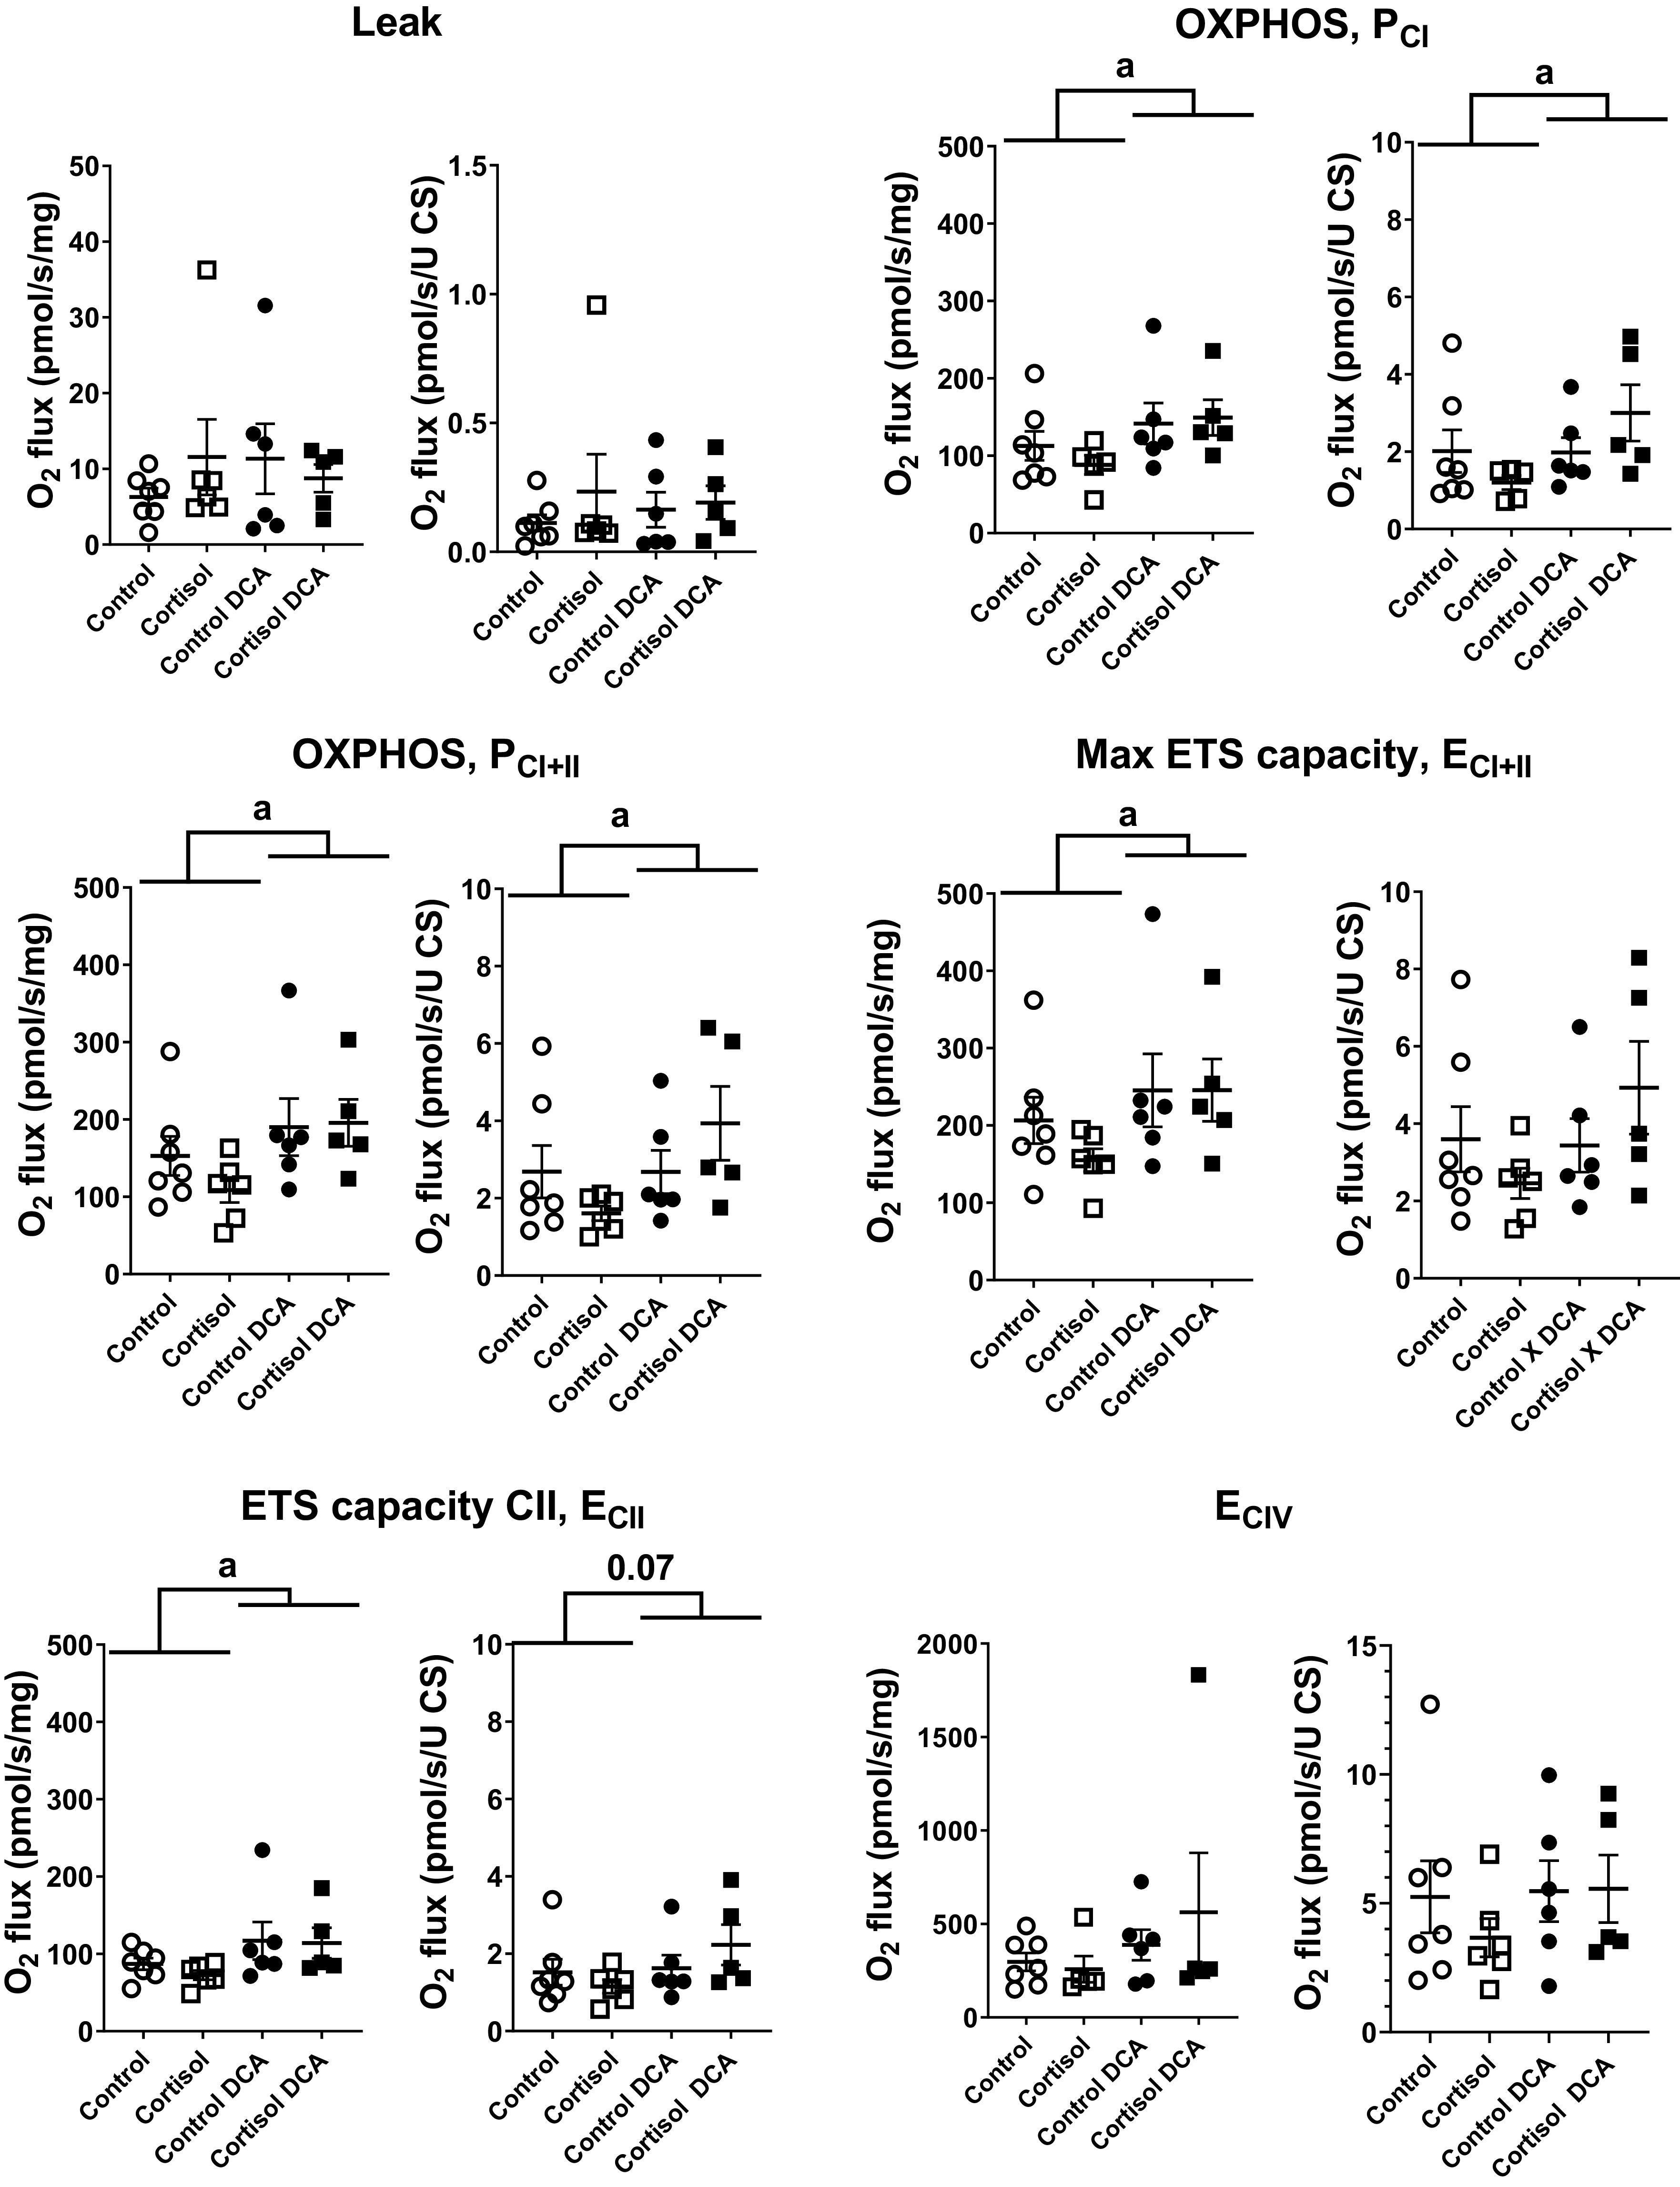
Mitochondrial respiration of permeabilized muscle fibers from the cardiac septum of control fetuses, and fetuses in the CORT, DCA, and CORT + DCA groups. Oxygen consumption (O2 flux) is reported as integrative mitochondrial function (per tissue weight, pmol·s−1·mg wet wt−1) and as intrinsic mitochondrial function (per mitochondrial unit, with weight-specific citrate synthase activity as a proxy for mitochondrial content; pmol·s−1·U CS activity−1) in the following respiratory states: LEAK respiration, activated respiration supported by complex I substrates (OXPHOS, PCI), activated respiration supported by complex I and II substrates (OXPHOS, PCI+II), maximal respiration (maximal ETS capacity, ECI+II), ETS capacity with only complex II substrates (ECII), and maximal electron transport capacity of complex IV (ECIV; with TMPD as the electron donor in the presence of ascorbate; for concentrations of all substrates, inhibitors, and uncoupler, see text. Leak, PCI, PCI+II, ECI+II, and ECII are corrected for residual, nonmitochondrial oxygen consumption (ROX), whereas ECIV is corrected for chemical background. Values are means ± SE; n = 7 control, 6 CORT, 6 control + DCA, and 5 CORT + DCA samples of septum. aMain effect of DCA treatment at P < 0.05. CORT, cortisol-infused; DCA, dichloroacetate; ETS, electron transport system; TMPS, N,N,N′,N′-tetramethyl-p-phenylenediamine.
Based on flux in the different mitochondrial respiratory states, we calculated flux control ratios (FCRs), which express respiratory flux in each state relative to a reference state (maximum ETS capacity, ECI + II). The FCRs serve as an internal normalization, rendering the interpretation of flux independent of mitochondrial content of the assessed sample. This relative flux allows for an evaluation of the effect of a metabolic variable on respiration (for example, control of activated respiration, PCI, by C-I supporting substrates) and of limitation of OXPHOS capacity by the capacity of the phosphorylation system. There was no change in FCRs of any mitochondrial respiratory state assessed in cardiac septum, indicating that metabolic control of LEAK, OXPHOS, and maximum ETS capacities were not affected by either DCA or cortisol (data not shown).
Interrogation of PDC/PDK Axis and Activity
Neither cortisol nor DCA, alone or in combination, altered protein expression of phosphorylated or total PDHE1α or of either PDK2 or PDK4 (Table 6). Cortisol did not alter PDC activity; however, there was a tendency for DCA to increase PDC activity (P = 0.07).
Table 6.
Biochemical analysis of components of the pyruvate dehydrogenase complex
| Control | Cortisol | Control + DCA | Cortisol + DCA | |
|---|---|---|---|---|
| n | 6 | 6 | 5 | 5 |
| PDHE1α | 1.00 ± 0.07 | 1.06 ± 0.05 | 1.07 ± 0.08 | 1.04 ± 0.06 |
| p-S293/PDHE1α | 1.00 ± 0.11 | 0.96 ± 0.17 | 1.01 ± 0.25 | 0.93 ± 0.22 |
| p-S293/PDHE1α | 1.00 ± 0.16 | 0.85 ± 0.14 | 1.01 ± 0.20 | 0.92 ± 0.23 |
| PDK2 | 1.00 ± 0.04 | 0.97 ± 0.08 | 0.86 ± 0.12 | 0.84 ± 0.14 |
| PDK4 | 1.00 ± 0.09 | 1.05 ± 0.05 | 0.92 ± 0.04 | 0.96 ± 0.09 |
| PDH activity | 1.00 ± 0.09 | 1.08 ± 0.04 | 1.17 ± 0.06 | 1.18 ± 0.07 |
Data are expressed as fold-changes in protein expression or PDH activity relative to the control group, means ± SE. DCA, dichloroacetate; PDH, pyruvate dehydrogenase; PDK, pyruvate dehydrogenase kinase; p-S293 PDHE1α, PDHE1α phosphorylated at S293; p-S293/PDHE1α, ratio of phosphorylated PDHE1α to total PDHE1α.
DISCUSSION
In this study, DCA treatment of the ewe and fetus altered fetal cardiac physiology: DCA administration increased cardiac mitochondrial respiration, specifically complex I and II-associated OXPHOS and maximal respiratory capacity, decreased cardiac lactate concentrations, and ameliorated the effects of chronic elevation of maternal cortisol on fetal ECG.
We had expected that DCA administration would increase PDC activity. Although PDC activity was not significantly altered by either cortisol or DCA in the current study, PDC activity did trend toward an increase in the hearts of the fetuses treated with DCA, regardless of whether there was maternal cortisol treatment. Consistent with higher PDC activity in vivo, the metabolomics analysis found decreased lactate, increased acetylcarnitine/isobutyryl-carnitine, and decreased levels of carnitine in the hearts of DCA-treated animals, suggesting that in vivo DCA did increase PDC activity, despite the lack of significant increase in activity in the ex vivo assay system. There was also a significant increase in mitochondrial respiration in the fetal cardiac tissue collected from fetuses treated with DCA, regardless of maternal cortisol treatment. PDC promotes the flux of pyruvate into the TCA cycle, and thus increases availability of reducing equivalents (NADH, FADH2) and substrates (succinate) for mitochondrial respiration. DCA decreases phosphorylation of the PDHE1α subunit of PDC and promotes oxidative metabolism (41). Mitochondrial respiration studies performed by others using the Agilent/Seahorse Flux Analyzer demonstrated that activation of PDC increased the respiratory reserve capacity of cardiomyocytes through complex II and that PDK negatively regulated reserve capacity (42). Consistent with this finding, we detected a significant increase in ECII respiration with DCA treatment in the interventricular septum. We did not find a change in mitochondrial content, indicated by citrate synthase activity as a surrogate measure, which could have caused an increase in integrative mitochondrial respiration; instead, intrinsic mitochondrial function, respiration per mitochondrial unit, in most respiratory states, including ECII, was likewise elevated in the DCA treatment group. Taken together, these findings suggest that DCA increases mitochondrial respiratory capacity in the cardiac interventricular septum, and thus energy production, through an increase in substrate availability.
We had expected, based on previous studies in which expression of genes in mitochondrial pathways were altered, (20, 21), that there would be reduced mitochondrial function in the CORT fetal tissue, and that stimulation of PDC with DCA would preferentially improve mitochondrial function in CORT treated fetuses. Although DCA affected OXPHOS and ETS capacity in the fetal cardiac septum, there were no changes in mitochondrial respiratory function following maternal cortisol treatment. Similarly, there was no effect of cortisol on citrate synthase activity in fetal cardiac septum. Our present data suggest that the maternal cortisol exposure is not altering net fetal mitochondrial function or efficiency in the presence of substrates and oxygenation, which are both provided in the SUIT protocol using the Oroboros.
In our studies of the effects of chronic maternal elevation in cortisol, one finding that stands out is that the incidence of bradycardia, arrhythmias, and fetal demise seems to be associated with either preterm labor or with the final stages of term delivery and/or the immediate postnatal period. Our previous studies have found that excess maternal cortisol is most detrimental to fetal heart rate and blood pressure in the hour of birth (19), and the decrease in PDC activity we previously found was in the newborn septum (CORT 0.53 ± 0.14 compared with 1.00 ± 0.16 in control, normalized to equal amounts of protein). The intense contractions at delivery are associated with hypoxia (43–46), which may be a contributing factor that is absent in the current study in fetuses that have not yet undergone delivery. PDK activity is normally increased, and PDC activity therefore decreased, by hypoxia and HIF-1 activation (47). Although fetal hypercortisolemia induced expression of PDK4, hypoxia may be needed to cause PDK activity to increase to clinically important levels. We hypothesize therefore that the adverse effects of cortisol on PDC activity and mitochondrial function may only develop in the context of cord compression and/or hypoxia and that the contractions induced by our oxytocin treatment were not strong enough to produce hypoxia and to reproduce the consequences of natural labor. Our results indicate it is not cortisol per se at the time of delivery, but rather that cortisol modifies the response to delivery or the hypoxia associated with delivery. This is consistent with the fact that cortisol concentrations are not different between CORT and control fetuses in the days leading up to birth, despite increases in fetal cortisol in the CORT group at earlier time points (19, 26). It is known that fetal acidemia and hypoxia are associated with fetal decelerations in heart rate (43, 46, 48) and either maternal or fetal treatment with exogenous glucocorticoids exacerbates the bradycardia in response to hypoxia or cord compression (49). Thus, the lack of acidemia and lactate accumulation in these fetuses with no differences in either blood or tissue lactate in the CORT fetuses at the time of this study may have prevented the discovery of an effect of DCA to modify adverse effects of CORT on metabolism revealed by either metabolomics or respirometry.
DCA did impact fetal ECG patterns, ameliorating the increase in QRS duration apparent in the fetuses of the cortisol-infused ewes. The QRS complex represents the conduction and depolarization of the left and the right ventricles, and widening of the QRS may occur with pathophysiologies causing delays in conduction, altered conduction pathways, or ventricular hypertrophy (50). Lengthening of the QRS and the QT interval has been shown in the mouse model of cardiomyocyte-specific glucocorticoid receptor overexpression (18). A wide QRS indicates asynchrony between left and right ventricular mechanical events in dilated cardiomyopathy; in this pathology, ventricular fibrosis is thought to impair conduction (51). Widening of the QRS correlates with reduced ejection fraction in adult patients with heart failure and has been identified as a marker for increased incidence of ventricular tachycardias and increased mortality among patients with heart failure, cardiomyopathy, or bundle branch block (52–56). In the fetus, heart rate is high relative to these conditions in the adult, and the QRS interval is therefore reduced compared with adult values; the QRS interval may increase in the normal course of pregnancy as the fetus grows (57). There has been some evidence for an increase in QRS duration as labor progresses (58, 59) or with increases in fetal heart rate (60). QRS width is increased in fetuses with Rh incompatibility, presumably related to fetal chronic fetal hypoxia and cardiac hypertrophy (61), although there is no consistent evidence that the QRS duration is altered by fetal hypoxia in normal labor (62). The finding of widened QRS in the CORT fetuses relative to control fetuses suggests that there is an underlying disturbance in ventricular conduction in the fetus exposed to chronically increased cortisol, which becomes evident during delivery, and the effect of DCA suggests that lactic acidosis may further exacerbate the severity of the conduction defect. Our transcriptomic study found that the genes for calmodulins (CALM1 and CALM2) in septum were upregulated in heart of the newborns whose mothers were infused with cortisol during late pregnancy, as were genes in the transforming growth factor (TGF) pathway [SMAD2, SMAD4, BMP2, and BMP4 (23)]. In mouse models, the increased activity of the Ca2/calmodulin-dependent protein kinase II (CaMKII)-dependent pathway prolonged QRS and QT intervals and predisposed the mice to develop ventricular tachyarrhythmias (63, 64). An increase in the delta-3 isoform of CAMKII has also been found in the adult heart with dilated cardiomyopathy (65). TGFβ activation can contribute to collagen deposition (66); in these newborn lambs, we found an increase in collagen content (23). Thus, we speculate that the modest (∼20%) increase in QRS duration may be indicative of underlying fibrosis and altered calcium signaling due to chronic increase in cortisol exposure, which predisposes these hearts to more dramatic impairments in ventricular conduction at the time of birth. The metabolomic analysis also suggests that changes in membrane lipids are correlated to indices of adverse cardiac function. Choline, phosphoethanolamine (PE), glycerophosphocholine, and dl-α-glycerol phosphate are all involved in glycerol phospholipid dynamics and were altered by administration of DCA. In particular, glycerophosphocholine was negatively correlated to QRS duration, whereas phosphorylcholine was positively correlated to QRS duration. There is some evidence that the ratio of phosphatidylcholine (PC) to PE is important to mitochondrial energetics, with a relative decrease in PC/PE ratio associated with increased electron transport chain activity and mitochondrial respiration (67), whereas an increase in PC/PE molar ratio reduces oxygen consumption, ATP generation, and activity of complexes I and IV (68, 69). In addition, a decreased level of PE inhibits the activity of sarcoplasmic/endoplasmic reticulum calcium ATPase (SERCA) and reduces activity of SERCA2a (the major isoform SERCA expressed in cardiomyocytes) and is associated with ventricular arrhythmias (70–72). The increases in glycerophosphocholine, a metabolite of PC, and the increase in PE with DCA administration are consistent with the overall increase in mitochondrial respiration. The results also suggest that disturbances in mitochondrial membrane lipids may underlie changes in mitochondrial function and in conduction occurring in our model.
Perspectives and Significance
Our previous studies have indicated that late gestation maternal hypercortisolemia leads to differences in the fetal responses to delivery that are revealed at the time of birth. This model mirrors the outcomes in human pregnancies complicated by chronic maternal stress or hypercortisolemia, in which the incidence of stillbirth is increased (5, 6, 12, 73). Our studies demonstrate that DCA can cross the placenta and increase mitochondrial capacity in metabolically active fetal tissues, and thereby reduce tissue lactate in the heart and adverse effects on the fetal ECG in labor. Fetal distress during labor and delivery is associated with fetal metabolic acidosis and increased plasma lactate and with decelerations in fetal heart rate. We conclude that DCA, which is known to stimulate PDC activity and improves systemic acid-base metabolism, may have a therapeutic potential to improve lactic acidosis and cardiac function in the fetus during late stages of labor and delivery in the setting of maternal-fetal stress.
SUPPLEMENTAL DATA
Supplemental Tables S1 and S2: https://www.metabolomicsworkbench.org/data in ST001868; the supplementary tables can be downloaded from ST001868_noesy_rev.zip in the folder PackageForMW_noesy.
GRANTS
This work was supported by National Institutes of Health (NIH) award R21 HD091599 to M. Keller-Wood and NIH 1S10OD021623-01 to J. Prestegard for the upgrade of the NMR spectrometer. A. S. Edison was also supported by the Georgia Research Alliance. This work was also supported by the NIH Common fund grant U2C-DK119886. This study was supported by NIH Grant HD091599 (to M. Keller-Wood).
DISCLOSURES
No conflicts of interest, financial or otherwise, are declared by the authors.
AUTHOR CONTRIBUTIONS
S.J., S.Z., L.H., P.W.S., S.E.W., A.S.E., C.W., and M.K.-W. conceived and designed research; S.J., M.L., S.Z., S.E.W., C.W., and M.K.-W. performed experiments; S.J., M.L., S.Z., S.E.W., and M.K.-W. analyzed data; S.J., M.L., S.Z., L.H., P.W.S., S.E.W., A.S.E., C.W., and M.K.-W. interpreted results of experiments; S.J., M.L., S.Z., and M.K.-W. prepared figures; S.J., S.Z., A.S.E. and M.K.-W. drafted manuscript; S.J., M.L., S.Z., L.H., P.W.S., S.E.W., A.S.E., C.W., and M.K.-W. edited and revised manuscript; S.J., M.L., S.Z., L.H., P.W.S., S.E.W., A.S.E., C.W., and M.K.-W. approved final version of manuscript.
REFERENCES
- 1.Lebenthal A, Lebenthal E. The ontogeny of the small intestinal epithelium. JPEN J Parenter Enteral Nutr 23 (Suppl 5): S3–S6, 1999. doi: 10.1177/014860719902300502. [DOI] [PubMed] [Google Scholar]
- 2.Fowden AL, Forhead AJ. Adrenal glands are essential for activation of glucogenesis during undernutrition in fetal sheep near term. Am J Physiol Endocrinol Physiol 300: E94–E102, 2011. doi: 10.1152/ajpendo.00205.2010. [DOI] [PMC free article] [PubMed] [Google Scholar]
- 3.Rog-Zielinska EA, Thomson A, Kenyon CJ, Brownstein DG, Moran CM, Szumska D, Michailidou Z, Richardson J, Owen E, Watt A, Morrison H, Forrester LM, Bhattacharya S, Holmes MC, Chapman KE. Glucocorticoid receptor is required for foetal heart maturation. Hum Mol Genet 22: 3269–3282, 2013. doi: 10.1093/hmg/ddt182. [DOI] [PubMed] [Google Scholar]
- 4.Liggins GC. The role of cortisol in preparing the fetus for birth. Reprod Fertil Dev 6: 141–150, 1994. doi: 10.1071/rd9940141. [DOI] [PubMed] [Google Scholar]
- 5.Lindsay JR, Jonklaas J, Oldfield EH, Nieman LK. Cushing's syndrome during pregnancy: personal experience and review of the literature. J Clin Endocrinol Metab 90: 3077–3083, 2005. doi: 10.1210/jc.2004-2361. [DOI] [PubMed] [Google Scholar]
- 6.Wisborg K, Barklin A, Hedegaard M, Henriksen TB. Psychological stress during pregnancy and stillbirth: prospective study. BJOG 115: 882–885, 2008. doi: 10.1111/j.1471-0528.2008.01734.x. [DOI] [PubMed] [Google Scholar]
- 7.Hillis SD, Anda RF, Dube SR, Felitti VJ, Marchbanks PA, Marks JS. The association between adverse childhood experiences and adolescent pregnancy, long-term psychosocial consequences, and fetal death. Pediatrics 113: 320–327, 2004. doi: 10.1542/peds.113.2.320. [DOI] [PubMed] [Google Scholar]
- 8.Hogue CJ, Parker CB, Willinger M, Temple JR, Bann CM, Silver RM, Dudley DJ, Koch MA, Coustan DR, Stoll BJ, Reddy UM, Varner MW, Saade GR, Conway D, Goldenberg RL; Eunice Kennedy Shriver National Institute of Child Health and Human Development Stillbirth Collaborative Research Network Writing Group. A population-based case-control study of stillbirth: the relationship of significant life events to the racial disparity for African Americans. Am J Epidemiol 177: 755–767, 2013. doi: 10.1093/aje/kws381. [DOI] [PMC free article] [PubMed] [Google Scholar]
- 9.Kishor S, Johnson K. Reproductive health and domestic violence: are the poorest women uniquely disadvantaged? Demography 43: 293–307, 2006. doi: 10.1353/dem.2006.0014. [DOI] [PubMed] [Google Scholar]
- 10.Pinhas-Hamiel O, Rotstein Z, Achiron A, Gabbay U, Achiron R, Barak Y, Israeli A, Noy S. Pregnancy during residency—an Israeli survey of women physicians. Health Care Women Int 20: 63–70, 1999. doi: 10.1080/073993399245962. [DOI] [PubMed] [Google Scholar]
- 11.El Kady D, Gilbert WM, Xing G, Smith LH. Maternal and neonatal outcomes of assaults during pregnancy. Obstet Gynecol 105: 357–363, 2005. doi: 10.1097/01.AOG.0000151109.46641.03. [DOI] [PubMed] [Google Scholar]
- 12.László KD, Svensson T, Li J, Obel C, Vestergaard M, Olsen J, Cnattingius S. Maternal bereavement during pregnancy and the risk of stillbirth: a nationwide cohort study in Sweden. Am J Epidemiol 177: 219–227, 2013. doi: 10.1093/aje/kws383. [DOI] [PubMed] [Google Scholar]
- 13.Heazell A, Budd J, Smith LK, Li M, Cronin R, Bradford B, McCowan L, Mitchell EA, Stacey T, Roberts D, Thompson J. Associations between social and behavioural factors and the risk of late stillbirth - findings from the Midland and North of England Stillbirth case-control study. BJOG 128: 704–713, 2021. doi: 10.1111/1471-0528.16543. [DOI] [PubMed] [Google Scholar]
- 14.Keller-Wood M, Feng X, Wood CE, Richards E, Anthony RV, Dahl GE, Tao S. Elevated maternal cortisol leads to relative maternal hyperglycemia and increased stillbirth in ovine pregnancy. Am J Physiol Regul Integr Comp Physiol 307: R405–R413, 2014. doi: 10.1152/ajpregu.00530.2013. [DOI] [PMC free article] [PubMed] [Google Scholar]
- 15.Rudolph AM, Roman C, Gournay V. Perinatal myocardial DNA and protein changes in the lamb: effect of cortisol in the fetus. Pediatr Res 46: 141–146, 1999. doi: 10.1203/00006450-199908000-00002. [DOI] [PubMed] [Google Scholar]
- 16.Feng X, Reini SA, Richards E, Wood CE, Keller-Wood M. Cortisol stimulates proliferation and apoptosis in the late gestation fetal heart: differential effects of mineralocorticoid and glucocorticoid receptors. Am J Physiol Regul Integr Comp Physiol 305: R343–R350, 2013. doi: 10.1152/ajpregu.00112.2013. [DOI] [PMC free article] [PubMed] [Google Scholar]
- 17.Giraud GD, Louey S, Jonker S, Schultz J, Thornburg KL. Cortisol stimulates cell cycle activity in the cardiomyocyte of the sheep fetus. Endocrinology 147: 3643–3649, 2006. doi: 10.1210/en.2006-0061. [DOI] [PubMed] [Google Scholar]
- 18.Sainte-Marie Y, Nguyen Dinh Cat A, Perrier R, Mangin L, Soukaseum C, Peuchmaur M, Tronche F, Farman N, Escoubet B, Benitah J-P, Jaisser F. Conditional glucocorticoid receptor expression in the heart induces atrio-ventricular block. FASEB J 21: 3133–3141, 2007. doi: 10.1096/fj.07-8357com. [DOI] [PubMed] [Google Scholar]
- 19.Antolic A, Wood CE, Keller-Wood M. Chronic maternal hypercortisolemia in late gestation alters fetal cardiac function at birth. Am J Physiol Regul Integr Comp Physiol 314: R342–R352, 2018. doi: 10.1152/ajpregu.00296.2017. [DOI] [PMC free article] [PubMed] [Google Scholar]
- 20.Richards EM, Wood CE, Rabaglino MB, Antolic A, Keller-Wood M. Mechanisms for the adverse effects of late gestational increases in maternal cortisol on the heart revealed by transcriptomic analyses of the fetal septum. Physiol Genomics 46: 547–559, 2014. doi: 10.1152/physiolgenomics.00009.2014. [DOI] [PMC free article] [PubMed] [Google Scholar]
- 21.Joseph S, Alava B, Antolic A, Richards EM, Wood CE, Keller-Wood M. Fetal ovine skeletal and cardiac muscle transcriptomics are differentially altered by increased maternal cortisol during gestation. Physiol Genomics 52: 178–190, 2020. doi: 10.1152/physiolgenomics.00096.2019. [DOI] [PMC free article] [PubMed] [Google Scholar]
- 22.Connaughton S, Chowdhury F, Attia RR, Song S, Zhang Y, Elam MB, Cook GA, Park EA. Regulation of pyruvate dehydrogenase kinase isoform 4 (PDK4) gene expression by glucocorticoids and insulin. Mol Cell Endocrinol 315: 159–167, 2010. doi: 10.1016/j.mce.2009.08.011. [DOI] [PMC free article] [PubMed] [Google Scholar]
- 23.Antolic A, Li M, Richards EM, Curtis CW, Wood CE, Keller-Wood M. Mechanisms of in utero cortisol effects on the newborn heart revealed by transcriptomic modeling. Am J Physiol Regul Integr Comp Physiol 316: R323–R337, 2019. doi: 10.1152/ajpregu.00322.2018. [DOI] [PMC free article] [PubMed] [Google Scholar]
- 24.Stacpoole PW, Henderson GN, Yan Z, Cornett R, James MO. Pharmacokinetics, metabolism and toxicology of dichloroacetate. Drug Metab Rev 30: 499–539, 1998. doi: 10.3109/03602539808996323. [DOI] [PubMed] [Google Scholar]
- 25.Joseph S, Sharma A, Horne LP, Wood CE, Langaee T, James MO, Stacpoole PW, Keller-Wood M. Pharmacokinetic and biochemical profiling of sodium dichloroacetate in pregnant ewes and fetuses. Drug Metab Dispos 49: 451–458, 2021. doi: 10.1124/dmd.120.000330. [DOI] [PMC free article] [PubMed] [Google Scholar]
- 26.Reini SA, Dutta G, Wood CE, Keller-Wood M. Cardiac corticosteroid receptors mediate the enlargement of the ovine fetal heart induced by chronic increases in maternal cortisol. J Endocrinol 198: 419–427, 2008. doi: 10.1677/JOE-08-0022. [DOI] [PMC free article] [PubMed] [Google Scholar]
- 27.Antolic A, Wood CE, Keller-Wood M. Use of radiotelemetry to assess perinatal cardiac function in the ovine fetus and newborn. Am J Physiol Regul Integr Comp Physiol 313: R660–R668, 2017. doi: 10.1152/ajpregu.00078.2017. [DOI] [PMC free article] [PubMed] [Google Scholar]
- 28.Varcoe TJ, Darby JRT, Gatford KL, Holman SL, Cheung P, Berry MJ, Wiese MD, Morrison JL. Considerations in selecting postoperative analgesia for pregnant sheep following fetal instrumentation surgery. Anim Front 9: 60–67, 2019. doi: 10.1093/af/vfz019. [DOI] [PMC free article] [PubMed] [Google Scholar]
- 29.Shinozuka N, Yen A, Nathanielsz PW. Increased myometrial contracture frequency at 96-140 days accelerates fetal cardiovascular maturation. Am J Physiol Heart Circ Physiol 278: H41–H49, 2000. doi: 10.1152/ajpheart.2000.278.1.H41. [DOI] [PubMed] [Google Scholar]
- 30.James MO, Jahn SC, Zhong G, Smeltz MG, Hu Z, Stacpoole PW. Therapeutic applications of dichloroacetate and the role of glutathione transferase zeta-1. Pharmacol Ther 170: 166–180, 2017. doi: 10.1016/j.pharmthera.2016.10.018. [DOI] [PMC free article] [PubMed] [Google Scholar]
- 31.Yan Z, Henderson GN, James MO, Stacpoole PW. Determination of dichloroacetate and its metabolites in human plasma by gas chromatography-mass spectrometry. J Chromatogr B Biomed Sci Appl 703: 75–84, 1997. doi: 10.1016/s0378-4347(97)00404-0. [DOI] [PubMed] [Google Scholar]
- 32.Stramba-Badiale M, Karnad DR, Goulene KM, Panicker GK, Dagradi F, Spazzolini C, Kothari S, Lokhandwala YY, Schwartz PJ. For neonatal ECG screening there is no reason to relinquish old Bazett's correction. Eur Heart J 39: 2888–2895, 2018. doi: 10.1093/eurheartj/ehy284. [DOI] [PubMed] [Google Scholar]
- 33.Joseph S, Walejko JM, Zhang S, Edison AS, Keller-Wood M. Maternal hypercortisolemia alters placental metabolism: a multiomics view. Am J Physiol Endocrinol Physiol 319: E950–E960, 2020. doi: 10.1152/ajpendo.00190.2020. [DOI] [PMC free article] [PubMed] [Google Scholar]
- 34.Dieterle F, Ross A, Schlotterbeck G, Senn H. Probabilistic quotient normalization as robust method to account for dilution of complex biological mixtures. Application in 1H NMR metabonomics. Anal Chem 78: 4281–4290, 2006. doi: 10.1021/ac051632c. [DOI] [PubMed] [Google Scholar]
- 35.Sud M, Fahy E, Cotter D, Azam K, Vadivelu I, Burant C, Edison A, Fiehn O, Higashi R, Nair KS, Sumner S, Subramaniam S. Metabolomics workbench: an international repository for metabolomics data and metadata, metabolite standards, protocols, tutorials and training, and analysis tools. Nucleic Acids Res 44: D463–D470, 2016. doi: 10.1093/nar/gkv1042. [DOI] [PMC free article] [PubMed] [Google Scholar]
- 36.Li C, White SH, Warren LK, Wohlgemuth SE. Effects of aging on mitochondrial function in skeletal muscle of American American Quarter Horses. J Appl Physiol (1985) 121: 299–311, 2016. doi: 10.1152/japplphysiol.01077.2015. [DOI] [PMC free article] [PubMed] [Google Scholar]
- 37.Kuznetsov AV, Veksler V, Gellerich FN, Saks V, Margreiter R, Kunz WS. Analysis of mitochondrial function in situ in permeabilized muscle fibers, tissues and cells. Nat Protoc 3: 965–976, 2008. doi: 10.1038/nprot.2008.61. [DOI] [PubMed] [Google Scholar]
- 38.Walsh B, Tonkonogi M, Söderlund K, Hultman E, Saks V, Sahlin K. The role of phosphorylcreatine and creatine in the regulation of mitochondrial respiration in human skeletal muscle. J Physiol 537: 971–978, 2001. doi: 10.1113/jphysiol.2001.012858. [DOI] [PMC free article] [PubMed] [Google Scholar]
- 39.Larsen S, Nielsen J, Hansen CN, Nielsen LB, Wibrand F, Stride N, Schroder HD, Boushel R, Helge JW, Dela F, Hey-Mogensen M. Biomarkers of mitochondrial content in skeletal muscle of healthy young human subjects. J Physiol 590: 3349–3360, 2012. doi: 10.1113/jphysiol.2012.230185. [DOI] [PMC free article] [PubMed] [Google Scholar]
- 40.Spinazzi M, Casarin A, Pertegato V, Salviati L, Angelini C. Assessment of mitochondrial respiratory chain enzymatic activities on tissues and cultured cells. Nat Protoc 7: 1235–1246, 2012. doi: 10.1038/nprot.2012.058. [DOI] [PubMed] [Google Scholar]
- 41.Ruggieri V, Agriesti F, Scrima R, Laurenzana I, Perrone D, Tataranni T, Mazzoccoli C, Lo Muzio L, Capitanio N, Piccoli C. Dichloroacetate, a selective mitochondria-targeting drug for oral squamous cell carcinoma: a metabolic perspective of treatment. Oncotarget 6: 1217–1230, 2015. doi: 10.18632/oncotarget.2721. [DOI] [PMC free article] [PubMed] [Google Scholar]
- 42.Pfleger J, He M, Abdellatif M. Mitochondrial complex II is a source of the reserve respiratory capacity that is regulated by metabolic sensors and promotes cell survival. Cell Death Dis 6: e1835, 2015. doi: 10.1038/cddis.2015.202. [DOI] [PMC free article] [PubMed] [Google Scholar]
- 43.Huch A, Huch R, Schneider H, Rooth G. Continuous transcutaneous monitoring of fetal oxygen tension during labour. Br J Obstet Gynaecol 84 (Suppl 1): 1–39, 1977. doi: 10.1111/j.1471-0528.1977.tb16231.x. [DOI] [PubMed] [Google Scholar]
- 44.Peebles DM, Edwards AD, Wyatt JS, Bishop AP, Cope M, Delpy DT, Reynolds EO. Changes in human fetal cerebral hemoglobin concentration and oxygenation during labor measured by near-infrared spectroscopy. Am J Obstet Gynecol 166: 1369–1373, 1992. doi: 10.1016/0002-9378(92)91606-b. [DOI] [PubMed] [Google Scholar]
- 45.McNamara H, Johnson N. The effect of uterine contractions on fetal oxygen saturation. Br J Obstet Gynaecol 102: 644–647, 1995. doi: 10.1111/j.1471-0528.1995.tb11403.x. [DOI] [PubMed] [Google Scholar]
- 46.Lear CA, Wassink G, Westgate JA, Nijhuis JG, Ugwumadu A, Galinsky R, Bennet L, Gunn AJ. The peripheral chemoreflex: indefatigable guardian of fetal physiological adaptation to labour. J Physiol 596: 5611–5623, 2018. doi: 10.1113/JP274937. [DOI] [PMC free article] [PubMed] [Google Scholar]
- 47.Lee JH, Kim EJ, Kim DK, Lee JM, Park SB, Lee IK, Harris RA, Lee MO, Choi HS. Hypoxia induces PDK4 gene expression through induction of the orphan nuclear receptor ERRγ. PLoS One 7: e46324, 2012. doi: 10.1371/journal.pone.0046324. [DOI] [PMC free article] [PubMed] [Google Scholar]
- 48.Martin CB Jr. Physiology and clinical use of fetal heart rate variability. Clin Perinatol 9: 339–352, 1982. doi: 10.1016/S0095-5108(18)31029-7. [DOI] [PubMed] [Google Scholar]
- 49.Fletcher AJ, Gardner DS, Edwards CM, Fowden AL, Giussani DA. Cardiovascular and endocrine responses to acute hypoxaemia during and following dexamethasone infusion in the ovine fetus. J Physiol 549: 271–287, 2003. doi: 10.1113/jphysiol.2002.036418. [DOI] [PMC free article] [PubMed] [Google Scholar]
- 50.Garmel GM. Wide complex tachycardias: understanding this complex condition: part 1—epidemiology and electrophysiology. West J Emerg Med 9: 28–39, 2008. [PMC free article] [PubMed] [Google Scholar]
- 51.Rouleau F, Merheb M, Geffroy S, Berthelot J, Chaleil D, Dupuis JM, Victor J, Geslin P. Echocardiographic assessment of the interventricular delay of activation and correlation to the QRS width in dilated cardiomyopathy. Pacing Clin Electrophysiol 24: 1500–1506, 2001. doi: 10.1046/j.1460-9592.2001.01500.x. [DOI] [PubMed] [Google Scholar]
- 52.Horwich T, Lee SJ, Saxon L. Usefulness of QRS prolongation in predicting risk of inducible monomorphic ventricular tachycardia in patients referred for electrophysiologic studies. Am J Cardiol 92: 804–809, 2003. doi: 10.1016/S0002-9149(03)00887-7. [DOI] [PubMed] [Google Scholar]
- 53.Kalahasti V, Nambi V, Martin DO, Lam CT, Yamada D, Wilkoff BL, Niebauer MJ, Jaeger FJ, Tchou PJ, Chung MK. QRS duration and prediction of mortality in patients undergoing risk stratification for ventricular arrhythmias. Am J Cardiol 92: 798–803, 2003. doi: 10.1016/S0002-9149(03)00886-5. [DOI] [PubMed] [Google Scholar]
- 54.Breidthardt T, Christ M, Matti M, Schrafl D, Laule K, Noveanu M, Boldanova T, Klima T, Hochholzer W, Perruchoud AP, Mueller C. QRS and QTc interval prolongation in the prediction of long-term mortality of patients with acute destabilised heart failure. Heart 93: 1093–1097, 2007. doi: 10.1136/hrt.2006.102319. [DOI] [PMC free article] [PubMed] [Google Scholar]
- 55.Adesanya CO, Yousuf KA, Co C, Gaur S, Ahmed S, Pothoulakis A, Suryaprasad A, Gupta S. Is wider worse? QRS duration predicts cardiac mortality in patients with right bundle branch block. Ann Noninv Electrocard 13: 165–170, 2008. doi: 10.1111/j.1542-474X.2008.00216.x. [DOI] [PMC free article] [PubMed] [Google Scholar]
- 56.Prinzen FW, Auricchio A. Is echocardiographic assessment of dyssynchrony useful to select candidates for cardiac resynchronization therapy? Echocardiography is not useful before cardiac resynchronization therapy if QRS duration is available. Circ Cardiovasc Imaging 1: 70–77, 2008. doi: 10.1161/CIRCIMAGING.108.791772. [DOI] [PubMed] [Google Scholar]
- 57.Brambati B, Pardi G. The intraventricular conduction time of fetal heart in uncomplicated pregnancies. Br J Obstet Gynaecol 87: 941–948, 1980. doi: 10.1111/j.1471-0528.1980.tb04456.x. [DOI] [PubMed] [Google Scholar]
- 58.Larks SD, Longo LD. Electrocardiographic studies of the fetal heart during delivery. Obstet Gynecol 19: 740–747, 1962. [PubMed] [Google Scholar]
- 59.Smith V, Arunthavanathan S, Nair A, Ansermet D, da Silva Costa F, Wallace EM. A systematic review of cardiac time intervals utilising non-invasive fetal electrocardiogram in normal fetuses. BMC Pregnancy Childbirth 18: 370, 2018. doi: 10.1186/s12884-018-2006-8. [DOI] [PMC free article] [PubMed] [Google Scholar]
- 60.Lee KH, Blackwell R. Observations on the configuration of the fetal electrocardiogram before and during labour. J Obstet Gynaecol Br Commonw 81: 61–69, 1974. doi: 10.1111/j.1471-0528.1974.tb00366.x. [DOI] [PubMed] [Google Scholar]
- 61.Brambati B, Pardi G. The intraventricular conduction time of fetal heart in pregnancies complicated by rhesus haemolytic disease. Br J Obstet Gynaecol 88: 1233–1240, 1981. doi: 10.1111/j.1471-0528.1981.tb01203.x. [DOI] [PubMed] [Google Scholar]
- 62.Oudijk MA, Kwee A, Visser GH, Blad S, Meijboom EJ, Rosén KG. The effects of intrapartum hypoxia on the fetal QT interval. BJOG 111: 656–660, 2004. doi: 10.1111/j.1471-0528.2004.00178.x. [DOI] [PubMed] [Google Scholar]
- 63.Wu Y, Temple J, Zhang R, Dzhura I, Zhang W, Trimble R, Roden DM, Passier R, Olson EN, Colbran RJ, Anderson ME. Calmodulin kinase II and arrhythmias in a mouse model of cardiac hypertrophy. Circulation 106: 1288–1293, 2002. doi: 10.1161/01.cir.0000027583.73268.e7. [DOI] [PubMed] [Google Scholar]
- 64.Wagner S, Dybkova N, Rasenack EC, Jacobshagen C, Fabritz L, Kirchhof P, Maier SK, Zhang T, Hasenfuss G, Brown JH, Bers DM, Maier LS. Ca2+/calmodulin-dependent protein kinase II regulates cardiac Na+ channels. J Clin Invest 116: 3127–3138, 2006. doi: 10.1172/JCI26620. [DOI] [PMC free article] [PubMed] [Google Scholar]
- 65.Hoch B, Meyer R, Hetzer R, Krause EG, Karczewski P. Identification and expression of δ-isoforms of the multifunctional Ca2+/calmodulin-dependent protein kinase in failing and nonfailing human myocardium. Circ Res 84: 713–721, 1999. doi: 10.1161/01.RES.84.6.713. [DOI] [PubMed] [Google Scholar]
- 66.Hao J, Ju H, Zhao S, Junaid A, Scammell-La Fleur T, Dixon IM. Elevation of expression of Smads 2, 3, and 4, decorin and TGF-beta in the chronic phase of myocardial infarct scar healing. J Mol Cell Cardiol 31: 667–678, 1999. doi: 10.1006/jmcc.1998.0902. [DOI] [PubMed] [Google Scholar]
- 67.van der Veen JN, Lingrell S, da Silva RP, Jacobs RL, Vance DE. The concentration of phosphatidylethanolamine in mitochondria can modulate ATP production and glucose metabolism in mice. Diabetes 63: 2620–2630, 2014. doi: 10.2337/db13-0993. [DOI] [PubMed] [Google Scholar]
- 68.van der Veen JN, Kennelly JP, Wan S, Vance JE, Vance DE, Jacobs RL. The critical role of phosphatidylcholine and phosphatidylethanolamine metabolism in health and disease. Biochim Biophys Acta Biomembr 1859: 1558–1572, 2017. doi: 10.1016/j.bbamem.2017.04.006. [DOI] [PubMed] [Google Scholar]
- 69.Tasseva G, Bai HD, Davidescu M, Haromy A, Michelakis E, Vance JE. Phosphatidylethanolamine deficiency in mammalian mitochondria impairs oxidative phosphorylation and alters mitochondrial morphology. J Biol Chem 288: 4158–4173, 2013. doi: 10.1074/jbc.M112.434183. [DOI] [PMC free article] [PubMed] [Google Scholar]
- 70.Gustavsson M, Traaseth NJ, Karim CB, Lockamy EL, Thomas DD, Veglia G. Lipid-mediated folding/unfolding of phospholamban as a regulatory mechanism for the sarcoplasmic reticulum Ca2+-ATPase. J Mol Biol 408: 755–765, 2011. doi: 10.1016/j.jmb.2011.03.015. [DOI] [PMC free article] [PubMed] [Google Scholar]
- 71.Bick RJ, Buja LM, Van Winkle WB, Taffet GE. Membrane asymmetry in isolated canine cardiac sarcoplasmic reticulum: comparison with skeletal muscle sarcoplasmic reticulum. J Membr Biol 164: 169–175, 1998. doi: 10.1007/s002329900402. [DOI] [PubMed] [Google Scholar]
- 72.Bers DM. Calcium and cardiac rhythms: physiological and pathophysiological. Circ Res 90: 14–17, 2002. [PubMed] [Google Scholar]
- 73.Silver RM, Ruiz RJ. Invited commentary: maternal stress and stillbirth—another piece of the puzzle. Am J Epidemiol 177: 228–229, 2013. doi: 10.1093/aje/kws384. [DOI] [PubMed] [Google Scholar]
Associated Data
This section collects any data citations, data availability statements, or supplementary materials included in this article.
Supplementary Materials
Supplemental Tables S1 and S2: https://www.metabolomicsworkbench.org/data in ST001868; the supplementary tables can be downloaded from ST001868_noesy_rev.zip in the folder PackageForMW_noesy.