

Abstract
Objective:
The purpose of this study was to explore the associations of race/ethnicity and menopausal status to gastrointestinal (GI) symptoms experienced during the menopausal transition while considering multiple factors that could influence the symptoms.
Methods:
This secondary analysis was conducted with the data among 1,051 women from two Internet-based studies on midlife women’s health issues. In the original studies, the data were collected using a dozen questions on sociodemographic and health/menopausal factors and the GI Index for Midlife Women (GIMW). The data were analyzed utilizing ANOVA, multiple logistic regression and hierarchical linear regression analyses.
Results:
When co-variates were controlled, being N-H Asians was a significant factor that influenced the total numbers of GI symptoms (β = −.26) and total severity scores of GI symptoms (β =−.26). When co-variates were controlled, pre-menopausal status was the strongest factor that influenced the total numbers of GI symptoms in all participants, Hispanics, Non-Hispanic (N-H) Whites, N-H African Americans, and N-H Asians (β = 53, −.40 −.77, −.76, −.26, respectively) and the total severity scores of GI symptoms in all participants, Hispanics, N-H Whites, N-H African Americans, and N-H Asians (β = −.50, −.38, −.72, −.75, −.25, respectively).
Conclusions:
This study supports the association of race/ethnicity and menopausal status to GI symptoms experienced during the menopausal transition.
Keywords: gastrointestinal symptoms, midlife women, race, ethnicity, menopause
Introduction
Hormonal changes during the menopausal transition reportedly influence midlife women’s gastrointestinal (GI) functions, subsequently resulting in such symptoms as nausea, bloating, and abdominal pain.1 Decreases in estrogen and progesterone due to the menopausal transition have a direct impact on cortisol hormone.2 In other words, when the estrogen level is high enough, cortisol level (that maintains blood glucose and blood pressure at the proper level) is low. However, with the menopausal transition, the level of estrogen decreases, and cortisol level becomes high,2 which initiates the increase in adrenalin. This change results in changes in digestive functions and a variety of digestive symptoms.3 Gas could build up with bloating. Foods could just go through GI tract without being fully broken down, resulting in constipation. Acid could break the mucous lining of the stomach wall, resulting in abdominal pain and/or indigestion. Indeed, in the Seattle Midlife Women’s Health Study (SMWHS), the association of estrone glucuronide (E1G) to abdominal pain was reported.4
Racial/ethnic variances in hormonal changes during the menopausal transition (e.g., changes in estrogens) have been reported,5,6 and consequential racial/ethnic differences in GI symptoms could be easily inferred. For instance, Sutton-Tyrrell et al.6 indicated significant dissimilarities in free androgen index (FAI) and sex hormone-binding globulin (SHBG) by race/ethnicity in pre-menopausal and peri-menopausal women. Despite the recent argument on indistinct racial/ethnic differences in hormone levels during the menopausal transition,5 the racial/ethnic variances could result in differences in GI symptoms experienced during the menopausal transition.
Despite these findings supporting the potential association of the menopausal transition to GI symptoms and possible racial/ethnic differences in the symptoms, very little is known about the association of race/ethnicity and menopausal status to GI symptoms that were experienced during the menopausal transition.7,8 When the PUBMED was searched using keywords of menopause, GI symptom, and race or ethnicity, no article was retrieved. When the search was expanded with just two keywords of menopause and GI symptoms, a total of 352 articles were retrieved. However, virtually no article was about the associations of race/ethnicity and menopausal status to GI symptoms experienced during the menopausal transition.
In this study, the association of race/ethnicity and menopausal status to GI symptoms that were experienced during the menopausal transition was explored while considering multiple factors that were known to influence the symptoms. Here, GI symptoms are defined as “subjective experience of changes in GI functions (e.g., indigestion, bloating, abdominal pain, constipation, diarrhea).” In this study, a broad definition of GI symptoms was made because little is known about racial/ethnic diversities in GI symptoms that were experienced during the menopausal transition. Specific aims that were addressed in this study were:
To determine if there existed significant associations of race/ethnicity to the total numbers and total severity scores of GI symptoms after controlling for co-variates; and
To determine if there existed significant associations of menopausal status to the total numbers and total severity scores of GI symptoms after controlling for co-variates.
To theoretically frame the study, the UCSF symptom management model9 was used in this analysis. The model is a widely adopted and tested model in symptom research of various health/disease conditions.9–11 The model includes three domains (person, health and illness, and environments) that relate to three concepts (symptom experience, symptom management strategies, and outcomes). The concepts include a few sub-concepts. For example, three sub-concepts (perception of symptoms, evaluation of symptoms, and response to symptoms) were included in the concept of symptom experience. In this study, the relationship between race/ethnicity (a sub-concept of person) and GI symptom experience (the concept of symptom experience) was explored while controlling for co-variates (sub-concepts of person and health/illness; Aim #1). Then, the relationship between menopausal status (a sub-concept of health/illness) and GI symptom experience (the concept of symptom experience) was explored while controlling for co-variates (sub-concepts of person and health/illness; Aim #2).
Methods
This secondary analysis was conducted with the data from two Internet-based studies on midlife women’s health issues.11,12 The institutional review board approval was gotten from the institutes of the researchers.
Samples and Settings
The data from a total of 1,051 women (315 Non-Hispanic (N-H) Whites, 249 N-H African Americans, 255 Hispanics, and 232 N-H Asians) who provided their answers to the items on their GI symptoms were used in this secondary analysis. The participants of the parent studies were recruited in online groups for midlife women (general and racial/ethnic-specific). In total, 1,245 participants were included in the parent studies; the response rates were 95~96% in the two studies. The response rates were assessed by calculating the ratio of the number of participants to the number of visitors at the project website. The participants were included if they were 40 to 60 years old and literate in English, and self-identified themselves as N-H White, N-H African American, N-H Asian, or Hispanic. The number of samples was restricted by the parent studies, but it was adequate to address the specific aims. The necessary sample size was calculated using the G*Power 3.1.9.4 software (with an effect size of 0.25, a power of 95%, and an alpha of 0.05); the analysis indicated that the necessary sample size was 175 participants in each racial/ethnic group.
Instruments
The original studies included a dozen of instruments, but this secondary analysis used the data that were gathered using only the instruments described below.
Background characteristics.
Background characteristics of the participants were measured with multiple questions on sociodemographics such as age, employment, marital status, family income, country of birth, and the number of children. Family income was measured using a question about subjective ability to pay for basic needs, such as clothing, food, housing, and healthcare and was categorized into “very hard to pay” (very low income), “somewhat hard to pay” (somewhat low income), and “not hard to pay” (sufficient income). Social support was determined based on the questions about the amount of support provided by family, relatives, or friends and was measured using a four-point ordinal scale (1 = “none of the time,” 2 = “a little of the time,” 3 = “some of the time,” and 4 = “most of the time”).
Perceived health and menopausal status.
Perceived health status and menopausal status were assessed using multiple questions including the items on body weight and height (to calculate the body-mass index; BMI in kg/m2BMI), self-reported health status (a 5-point Likert scale item; 1 = “very unhealthy” to 5 = “very healthy”), diagnosed GI diseases (yes or no), menopausal status (seven questions on menstrual cycle, regularity, and flow during the past one year), and hormone usages. To determine the diagnosed GI diseases, the participants were asked to indicate if they had a diagnosed disease or not. Then, they were asked to specify their diagnosed diseases. The GI diseases were determined based on the categories of GI diseases by the American College of Gastroenterology. Based on the women’s responses to the questions on menopausal status, their menopausal status was determined based on the criteria used in the Study of Women’s Health Across the Nation (SWAN) study.13 Those with menstruation in the previous 3 months with no regularity change were considered as pre-menopausal. Those with menstruation in the previous 3 months with some regularity changes in the former year and those with no menstruation in the previous three months, but with menstruation in the previous year (within 12 months) were considered as peri-menopausal. Those without any menstruation during the past one year (not influenced by hormone, medication, weight loss, or pregnancy) were considered as post-menopausal. Those who had a hysterectomy and/or a bilateral oophorectomy were not included in this analysis. Those who had steroids or hormones in the previous three months were not included as well.
GI Symptoms.
GI symptoms were assessed using a sub-scale on GI symptoms of the Midlife Women’s Symptoms Index (MSI).14 The MSI includes 73 symptoms that could be experienced during the menopausal transition. Individual items of the MSI include two sub-items on “having the symptom or not” (no = 0, yes = 1; the prevalence scale) and “the severity of the symptom” (“not at all”= 0 to “extremely”= 4; the severity scale). The sub-scale on GI symptoms includes a total of 9 items on GI symptoms that could be experienced during the menopausal transition and each item includes the same two sub-items on “having the symptom or not” and “the severity of the symptom.” The items were selected based on a literature review on GI symptoms that could be experienced by midlife women during their menopausal transition. 7,8,15,16 The total numbers of GI symptoms were calculated by summing the items answered as “yes” in the frequency sub-scale (range from 0 to 9). The total severity scores of GI symptoms were calculated by adding the severity scores of nine items (range from 0 to 36). Higher scores (total numbers and total severity scores) mean higher prevalence and severity of GI symptoms. Cronbach’s alpha of the prevalence subscale was .61 and that of the severity subscale was .69 for the severity scale (total severity scores of GI symptoms).
Data Collection Procedures
The original studies used the Internet surveys to collect the data. Thus, project websites were developed to gather the data while observing the security and safety measures required by the institutes where the data collection of the parent studies was conducted. The project websites had the informed consent sheet and the questionnaires that the participants could review and enter their answers. When potential participants visited the project websites of the parent studies, they were asked to review the study materials first and give their electronic consent to participate. After getting their consent, they were inquired against the inclusion and exclusion criteria. When they successfully went through the inclusion and exclusion criteria questions, they were automatically forwarded to the survey questionnaire site. More details on the data collection procedures in the parent studies are available elsewhere.11,12
Data Analysis
SPSS 26.0 (IBM Corporation, Armonk, NY) was used for the data analysis. No replacement for the missing fields was done while setting the alpha level as 0.05. First of all, descriptive statistics (frequencies, percent, means and standard deviation) were analyzed to determine background characteristics and perceived health and menopausal status of the participants. To address Aim 1, Chi-square tests and ANOVA were firstly performed to determine racial/ethnic differences in the frequencies and severity scores of individual symptoms. Then, to compare the frequencies and severity scores of individual GI symptoms among four racial/ethnic groups, multinomial logistic regression analyses were conducted while controlling for age, BMI, menopausal status, and the diagnosis of GI diseases. N-H Whites were the reference group. The frequencies of individual symptoms were dichotomized into “presence” and “absence” of the symptoms. The severity scores were dichotomized into “severe” and “not severe” by the mean value of the severity scores in the total sample. To address Aim 2, ANOVA and post hoc tests by Bonferroni were conducted to determine differences in the total numbers and severity scores of GI symptoms by menopausal status.
Finally, hierarchical linear regression analyses were conducted to determine the associations of race/ethnicity and menopausal status to the total numbers (Model 1) and total severity scores (Model 2) of GI symptoms while controlling for co-variates (Aims 1 and 2). Further, both Models 1 and 2 were run in the total sample and separately within each racial/ethnic group. The multicollinearity test was performed using the variance inflation factor (VIF). Sociodemographic characteristics (including age, education, marital status, family income, employment), and health-related characteristics (including BMI, perceived health status, and diagnosed GI diseases) were controlled to determine the associations of race/ethnicity and menopausal status to the total numbers and severity scores of GI symptoms. These co-variates were determined based on a literature review.8,16 In the first step, sociodemographic characteristics except race/ethnicity were entered into the regression models. Then, health-related characteristics except menopausal status were entered into the models as the second step. Menopausal status was entered in the third step. Finally, race/ethnicity was entered into the model. Marital status, family income, BMI, perceived health status, menopausal status, and race/ethnicity were recoded as dummy variables. Standardized coefficients (β1, β2, β3 and β4) were calculated to compare the strength of the effects of each independent variable, including race/ethnicity and menopause status, to the total numbers and the total severity scores of GI symptoms. The R2 and R2 changes (R2) were computed to determine if adding menopausal status and race/ethnicity significantly increased the model prediction. The significance level 0.05 was set in all analyses.
Results
Characteristics of the Participants
Table 1 presents the characteristics of the study participants. The mean age of the participants was 48.96 years (SD = 5.68). Over 86% of the participants were high school graduates. Approximately 68% of the participants were married or partnered. Among the participants, about 75% were employed, and about 17% had difficulties in meeting their basic needs (e.g., foods, clothes, housing) with their family income. About 42% of the participants reported that they had poor social support. About 24% were Hispanic, 30% were N-H White, 24% were N-H African American, and 22% were H-H Asian. Approximately 40% of the participants had a normal BMI. Over 28% were pre-menopausal, about 32% were peri-menopausal, and about 40% were post-menopausal. About 95% of the participants reported that they did not have any diagnosed GI diseases, and over 73% of them perceived their general health as good.
Table 1.
Characteristics of the participants (N = 1,051).
| Characteristics | Categories | Race/ethnicity (n = 1,051) |
F or X2 (p) | ||||
|---|---|---|---|---|---|---|---|
| Hispanic (n = 255) |
N-H White (n = 315) |
N-H AA (n = 249) |
N-H Asian (n = 232) |
Total (n = 1,051) |
|||
| Age (Years), Mean±SD | 48.85±5.40 | 49.05±5.60 | 49.30±5.71 | 48.58±6.06 | 48.96±5.68 | 0.70 (.555) | |
| Education | ≤ High school | 43 | 51 | 17 | 30 | 141 (13.4) | 14.05 (.003) |
| > High school | 212 | 264 | 232 | 202 | 910 (86.6) | ||
| Employment | Yes | 208 | 227 | 209 | 144 | 788 (75.0) | 38.59 (<.001) |
| No | 47 | 88 | 40 | 88 | 263 (25.0) | ||
| Marital status | Married/partnered | 172 | 211 | 134 | 196 | 713 (67.8) | 52.03 (<.001) |
| Single/separated | 83 | 104 | 115 | 36 | 338 (32.2) | ||
| Family income | Very low | 41 | 92 | 31 | 19 | 183 (17.4) | 52.57 (<.001) |
| Somewhat low | 104 | 111 | 102 | 88 | 405 (38.5) | ||
| Sufficient | 110 | 112 | 116 | 125 | 463 (44.1) | ||
| Social support | None of time | 42 | 39 | 43 | 46 | 170 (16.2) | 20.96 (.013) |
| A little of time | 58 | 103 | 53 | 55 | 269 (25.6) | ||
| Some of the time | 61 | 72 | 77 | 64 | 274 (26.1) | ||
| Most of the time | 94 | 101 | 76 | 67 | 338 (32.2) | ||
| BMI (kg/m2), Mean±SD | 29.68±7.03 | 29.25±7.69 | 30.96±7.55 | 23.49±4.17 | 28.49±7.38 | 55.64 (<.001) | |
| Normal (<25) | 72 | 127 | 59 | 164 | 422 (40.2) | 166.32 (<.001) | |
| Overweight (25 to 30) | 83 | 67 | 61 | 54 | 265 (25.2) | ||
| Obese (≥30) | 100 | 121 | 129 | 14 | 364 (34.6) | ||
| Menopause status | Premenopausal | 58 | 99 | 95 | 44 | 296 (28.2) | 197.84 (<.001) |
| Perimenopausal | 90 | 130 | 104 | 13 | 337 (32.1) | ||
| Postmenopausal | 107 | 86 | 50 | 175 | 418 (39.8) | ||
| Diagnosed GI disease | Yes | 12 | 29 | 9 | 1 | 51 (4.9) | 23.60 (<.001) |
| No | 243 | 286 | 240 | 231 | 1000 (95.1) | ||
| Perceived general health | Unhealthy | 60 | 76 | 33 | 32 | 201 (19.2) | 20.38 (.002) |
| Don’t know | 17 | 21 | 15 | 22 | 75 (7.1) | ||
| Healthy | 178 | 218 | 201 | 178 | 775 (73.7) | ||
N-H = Non-Hispanic, AA = African American/ GI=Gastrointestinal
Race/ethnicity and GI Symptoms (Aim 1)
The mean total number of GI symptoms per participant was 1.98 out of 9 (SD = 1.79) (Table 2). The most frequently reported GI symptoms in total participants included: weight gain (44.3%), bloating (32.1%), and loss of weight (26.9%). The total numbers of GI symptoms were significantly different among racial/ethnic groups (F = 13.05, p < .001), where N-H Asians had significantly lower mean total numbers of GI symptoms (1.37±1.44 out of 9) compared to other racial/ethnic groups. At a significance level of 5%, significant racial/ethnic differences were found in the frequencies of nausea/vomiting, diarrhea, constipation, loss of weight, gain of weight, bloating, and heartburn, while there were no racial/ethnic differences in the frequencies of stomach pain, and loss of appetite. N-H Asians reported the lowest symptom prevalence across all GI symptoms among four racial/ethnic groups (all pairwise p-values < .003).
Table 2.
Individual GI Symptoms among four racial/ethnic groups: Frequencies and severity scores (N = 1,051).
| Symptom | Total | Hispanic (n = 255) |
N-H White (n = 315) |
N-H AA (n = 249) |
N-H Asian (n = 232) |
X2 (p) | F (p) | |||||
|---|---|---|---|---|---|---|---|---|---|---|---|---|
|
| ||||||||||||
| Frequency n (%) |
Severity Mean (SD) |
Frequency n (%) |
Severity Mean (SD) |
Frequency n (%) |
Severity Mean (SD) |
Frequency n (%) |
Severity Mean (SD) |
Frequency n (%) |
Severity Mean (SD) |
Frequency | Severity | |
| Stomach Pain | 194 (18.5) |
0.56 (1.26) |
47 (18.4) |
0.60 (1.33)a |
70 (22.2) |
0.63 1.30)a |
45 (18.1) |
0.55 (1.25)a |
32 (13.8) |
0.43 (1.15)a |
6.344 (.096) |
1.25 (.289) |
| Nausea/Vomiting | 199 (18.9) |
0.60 (1.31) |
49 (19.2) |
0.62 (1.34)ab |
77 (24.4) |
0.78 (1.47)b |
43 (17.3) |
0.53 (1.22)a |
30 (12.9) |
0.39 (1.07)a |
12.141 (.007) |
4.33 (.005) |
| Diarrhea | 154 (14.7) |
0.45 (1.15) |
34 (13.3) |
0.42 (1.12)b |
82 (26.0) |
0.84 (1.50)c |
21 (8.4) |
0.23 (0.81)ab |
17 (7.3) |
0.20 (0.73)a |
50.625 (<.001) |
19.95 (<.001) |
| Constipation | 166 (15.8) |
0.52 (1.26) |
46 (18.0) |
0.65 (1.44)b |
61 (19.4) |
0.63 (1.35)b |
33 (13.3) |
0.44 (1.20)ab |
26 (11.2) |
0.31 (0.86)a |
8.866 (.031) |
4.34 (.005) |
| Loss of appetite | 90 (8.6) |
0.26 (0.90) |
18 (7.1) |
0.24 (0.89)ab |
37 (11.7) |
0.38 (0.10)b |
20 (8.0) |
0.22 (0.77)ab |
15 (6.5) |
0.18 (0.72)a |
6.206 (.102) |
2.70 (.044) |
| Loss of weight | 283 (26.9) |
0.53 (0.98) |
73 (28.6) |
0.57 (1.04)bc |
80 (25.4) |
0.47 (0.92)ab |
90 (36.1) |
0.71 (1.08)c |
40 (17.2) |
0.35 (0.84)a |
22.563 (<.001) |
6.15 (<.001) |
| Gain of weight | 466 (44.3) |
1.29 (1.56) |
133 (52.2) |
1.57 (1.66)c |
133 (42.2) |
1.26 (1.60)b |
119 (47.8) |
1.42 (1.65)bc |
81 (34.9) |
0.88 (1.31)a |
16.440 (.001) |
8.76 (<.001) |
| Bloating | 337 (32.1) |
0.99 (1.54) |
103 (40.4) |
1.28 (1.67)c |
112 (35.6) |
1.10 (1.60)bc |
74 (29.7) |
0.90 (1.47)b |
48 (20.7) |
0.59 (1.25)a | 24.290 (<.001) |
9.24 (<.001) |
| Heartburn | 195 (18.6) |
0.48 (1.06) |
54 (21.2) |
0.55 (1.11)b |
59 (18.7) |
0.51 (1.13)b |
53 (21.3) |
0.51 (0.04)b |
29 (12.5) |
0.32 (0.90)a |
8.023 (.046) |
2.35 (.071) |
GI=Gastrointestinal/ Post hoc tests by Duncan (a ≤ ab ≤ b ≤ bc ≤ c)/ N-H = Non-Hispanic, AA = African American
The mean total severity score of GI symptoms in total participants was 5.67 out of 36 (SD = 6.01; Table 2). Among all symptoms, the highest severity score in all participants was reported in weight gain (1.29±1.56 out of 5). The mean total severity scores of GI symptoms were significantly different among racial/ethnic groups (F = 13.44, p < .001). N-H Asians had significantly lower total severity scores (3.65±4.48 out of 45), and N-H White had higher total severity scores (6.63±6.72 out of 45), compared to other racial/ethnic groups (all pairwise p-values < .001). At a significance level of 5%, significant racial/ethnic differences were found in the severity scores of nausea/vomiting, diarrhea, constipation, loss of appetite, loss of weight, gain of weight, and bloating. Compared to other racial/ethnic groups, N-H Whites reported higher severity scores of nausea/vomiting (0.78±1.47), diarrhea (0.84±1.50), constipation (0.63±1.35), and loss of appetite (0.38±0.10), Compared with other racial/ethnic groups, Hispanics were more likely to have higher severity scores of constipation (0.65±1.44), gain of weight (1.57±1.66), and bloating (1.28±1.67), and N-H African Americans were more likely to have report higher severity scores of weight loss (0.71±1.08).
The results of multinomial logistic regression analyses are as follows. Compared with N-H Whites, Hispanics were more likely to report weight gain (OR = 1.48, 95% Confidence Interval [CI] = 1.01–2.17), but less likely to report diarrhea (OR = 0.37, CI = 0.23–0.62). Compared to N-H Whites, N-H African Americans were more likely to report weight loss (OR = 2.07, CI = 1.38–3.11), weight gain (OR = 1.68, CI = 1.14–2.48), and heartburn (OR = 1.68, CI = 1.02–2.77). They were less likely to report diarrhea (OR = 0.24, CI =0.13–0.43) than N-H Whites. Compared to N-H Whites, N-H Asians were less likely to report constipation (OR = 0.51, CI = 0.27–0.97), loss of appetite (OR = 0.38, CI = 0.17–0.85), and diarrhea (OR = 0.25, CI = 0.12–0.50). Hispanics were less likely to report severe diarrhea (OR = 0.72, CI = 0.61–0.84) than N-H Whites. Here, again, the severity scores were dichotomized into “severe” and “not severe” by the mean value of the severity scores in the total sample. Compared to N-H Whites, N-H African Americans were more likely to report severe weight loss (OR = 1.38, CI = 1.15–1.66) and weight gain (OR = 1.15, CI = 1.02–1.30) whereas they were less likely to have severe diarrhea (OR = 0.61, CI = 0.50–0.74). Compared to N-H Whites, N-H Asians were less likely to report severe diarrhea (OR = 0.60, CI = 0.46–0.77), constipation (OR = 0.77, CI = 0.63–0.95), loss of appetite (OR = 0.74, CI = 0.56–0.97), and bloating (OR = 0.82, CI = 0.68–0.98).
Menopausal Status and GI Symptoms (Aim 2)
The total numbers and total severity scores of GI symptoms were significantly different across pre-, peri- and post-menopausal status in all symptoms except loss of weight (all p-values < .001;Table 3). Pre-menopausal women (compared with peri- and post-menopausal women) had lower total numbers and total severity scores of GI symptoms across all racial/ethnic groups (Figure 1). The results of post hoc tests by Bonferroni showed that the total numbers and total severity scores continuously increased throughout the menopausal transition period in Hispanics, N-H Whites, and N-H African Americans. Yet, only among N-H Asians, the total numbers and severity scores were highest in the peri-menopausal period, and then decreased in the post-menopausal period (Figure 1).
Table 3.
The total numbers and total severity scores of GI symptoms by menopausal status and racial/ethnic groups (N = 1,051).
| Total Numbers | Menopausal Status | F (p) | |||
|---|---|---|---|---|---|
|
| |||||
| Prea | Perib | Postc | |||
|
| |||||
| Mean (SD) | Mean (SD) | Mean (SD) | |||
| Hispanic | 0.86 (0.94) | 2.12 (1.38) | 2.95 (2.07) | Ethnicity | 12.26 (<.001) |
| N-H White | 0.86 (1.03) | 1.95 (1.33) | 4.34 (1.95) | Menopause | 184.68 (<.001) |
| N-H AA | 0.94 (0.88) | 2.14 (1.39) | 3.72 (1.76) | Ethnicity*Menopause | 15.68 (<.001) |
| N-H Asian | 0.68 (0.67) | 1.92 (1.71) | 1.50 (1.52) | ||
| Total Severity Scores | Menopausal Status | F (p) | |||
|
| |||||
| Prea | Perib | Postc | |||
|
| |||||
| Mean (SD) | Mean (SD) | Mean (SD) | |||
|
| |||||
| Hispanic | 2.26 (2.84) | 5.86 (4.54) | 9.29 (7.65) | Ethnicity | 11.77 (<.001) |
| N-H White | 2.10 (2.78) | 5.39 (4.25) | 13.70 (7.33) | Menopause | 176.22 (<.001) |
| N-H AA | 2.33 (2.57) | 5.64 (4.15) | 11.36 (6.65) | Ethnicity*Menopause | 15.58 (<.001) |
| N-H Asian | 1.61 (1.63) | 5.15 (4.85) | 4.05 (4.80) | ||
GI=Gastrointestinal/ Post hoc tests by Bonferroni (a < b < c)/ N-H = Non-Hispanic, AA = African American.
Figure 1.
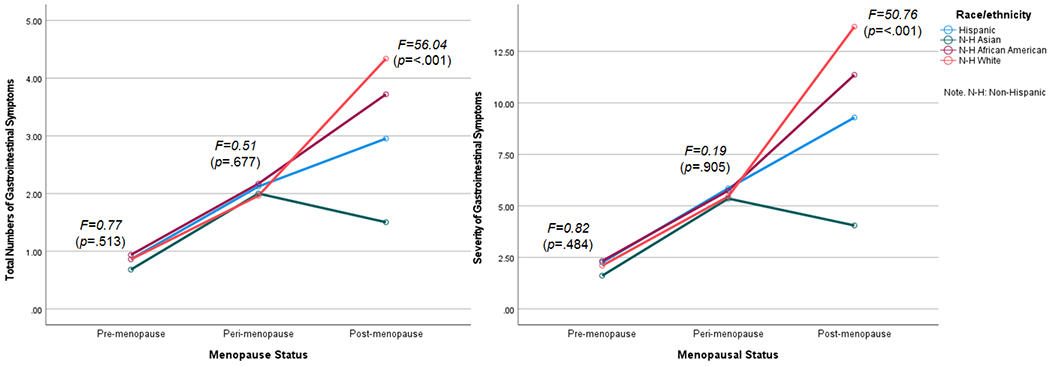
The mean total numbers and total severity scores of GI symptoms by menopausal status and race/ethnicity.
Associations of Race/Ethnicity and Menopausal Status to GI Symptoms
The effects of race/ethnicity, menopausal status, interaction between race/ethnicity, and menopausal status were all significant for the total numbers and total severity scores of GI symptoms (all p < .001; Table 4). In the hierarchical linear regression analyses, all the variables accounted for 32% of the total variances of the total numbers of GI symptoms in the second step of the model for all participants (F = 33.31, p < .001) (Table 4). When all co-variates were controlled, pre-menopausal status was the strongest factor that influenced the total numbers of GI symptoms in total participants, Hispanics, N-H White, N-H African Americans, and N-H Asians (β = −.53, −.40, −.77, −.76, −.26, respectively; Aim 2).
Table 4.
Multiple factors associated with the total numbers and total severity scores of GI symptoms by racial/ethnic group (N = 1,051).
| Factor | Total (n = 1,051) | |||||||
|---|---|---|---|---|---|---|---|---|
|
| ||||||||
| Model 1 | Model 2 | |||||||
|
| ||||||||
| β1 | β2 | β3 | β4 (CI) | β1 | β2 | β3 | β4 (95% CI) | |
| Step 1 | ||||||||
| Age (Years) | −.05 | −.05 | −.03 | −.04 (−.02, .002) | −.05 | −.05 | −.03 | −.04 (−.05, −.01) |
| Education | .004 | .01 | .04 | .05 (−.001, .32) | .01 | .02 | .05 | .06a (.10, 1.18) |
| Marital status | .07a | .04 | .06a | .04 (−.02, .20) | .05 | .02 | .05 | .03 (−.04, .23) |
| Family income (Ref.: sufficient) |
||||||||
| Very low | .19c | .14c | .12c | .07a (.02, .35) | .23c | .17c | .16c | .11b (.41, 1.52) |
| Somehow low | .10 b | .06 | .04 | .03 (−.06, .17) | .14c | .09b | .07a | .06a (.02, .82) |
| Employment | .07a | .07a | .01 | .05 (−.02, .23) | .07a | .07a | .02 | .05 (−.06, .81) |
| Step 2 | ||||||||
| BMI | .11a | .11c | .03 (.003, .01) | .11c | .13c | .05 (−.004, .21) | ||
| Perceived health | ||||||||
| Healthy | .05 | .06 | .05 (−.11, .34) | .12a | .13a | .11a (.21, 1.75) | ||
| Unhealthy | −.13a | −.06 | −.08 (−.40, .02) | −.09 | −.02 | −.04 (−1.01, .39) | ||
| Diagnosed GI disease | .14c | .12c | .10c (.23, .71) | .14c | .12c | .10c (.78, 2.43) | ||
| Step 3 | ||||||||
| Menopausal status (Ref.: postmenopausal) |
||||||||
| Premenopausal | −.43c | −.53c (−1.33, −1.05) | −.41c | −.50c (−4.39, −3.44) | ||||
| Perimenopausal | −.18c | −.29c (−.78, −.50) | −.21c | −.32c (−2.86, −1.93) | ||||
| Step 4 | ||||||||
| Race/ethnicity (Ref.: Hispanic) |
||||||||
| White | .06 (−.01, .27) | .05 (−.13, .85) | ||||||
| N-H AA | .06 (−.02, .29) | .03 (−.24, .79) | ||||||
| N-H Asian | −.26c (−.08, −.46) | −.26c (−2.73, −1.59) | ||||||
| Adjusted R2 (%) | .05 | .12 | .26 | .32 | .07 | .15 | .28 | .33 |
| ΔR2 (%) | — | .07 | .14 | .06 | — | .08 | .13 | .05 |
| F | 10.23c | 15.12c | 31.37c | 33.31c | 13.42c | 19.12c | 34.12c | 35.19c |
| Factor | Hispanic (n = 255) | N-H White (n = 315) | ||||||||||
|---|---|---|---|---|---|---|---|---|---|---|---|---|
|
| ||||||||||||
| Model 1 | Model 2 | Model 1 | Model 2 | |||||||||
|
| ||||||||||||
| β1 | β2 | β3 (95% CI) | β1 | β2 | β3 (95% CI) | β1 | β2 | β3 (95% CI) | β1 | β2 | β3 (95% CI) | |
| Step 1 | ||||||||||||
| Age (Years) | .07 | .05 | .04 (−.01, .03) | .07 | .05 | .04 (−.05, .10) | −.12a | −.09 | −.05 (−.03, −.37) | −.12a | −.10 | −.05 (−.11, .03) |
| Education | .09 | .06 | .09 (−.05, .57) | .13a | .10 | .13a (.18., 2.40) | −.08 | −.06 | .01 (−.37, .26) | −.07 | −.05 | −.01 (−1.16, 1.01) |
| Marital status | .06 | −.02 | −.01 (−.26, .23) | .05 | −.03 | −.02 (−.98, .74) | .02 | .04 | .02 (−.19, .31) | .02 | .04 | .03 (−.58, 1.10) |
| Family income (Ref.: sufficient) |
||||||||||||
| Very low | −07 | −.13 | −.12a (−.71, −.003) | −.01 | .07 | −.07 (−1.98, .50) | .30c | .25c | .08 (−.11, .57) | .34c | .27c | .11a (.01, 2.30) |
| Somehow low | .01 | −.05 | .07 (−.40, .10) | .07 | .01 | .01 (−.34, .85) | .15a | .12a | .01 (−.26, .30) | .16b | .13a | .02 (−.72, 1.19) |
| Employment | .22b | .20b | .14a (.06, .69) | .22b | .20b | .14a (.23, 2.44) | .07 | .06 | .06 (−.09, .46) | .08 | .06 | .07 (−.24, 1.64) |
| Step 2 | ||||||||||||
| BMI | .12 | .09 (−.004, .03) | .13a | .10 (−.01, .11) | −.03 | −.09a (.03, .00) | −.02 | −.07 (−.10, .01) | ||||
| Perceived health | ||||||||||||
| Healthy | .09 | .10 (−.25, .76) | .13 | .13 (−.58, 2.96) | .11 | .01 (−.45, .54) | .18 | .09 (−.74, 2.64) | ||||
| Unhealthy | −.18 | −.14 (−.79, .12) | −.16 | −.13 (−2.65, 5.19) | −.10 | −.04 (−.59, .36) | −.06 | −.003 (−1.63, 1.57) | ||||
| Diagnosed GI disease | .23c | .20c (.45, 1.52) | .21c | .19b (1.42, −2.35) | .06 | .04 (−.59, .58) | .06 | .04 (−1.63, 1.96) | ||||
| Step 3 | ||||||||||||
| Menopausal status (Ref.: postmenopausal) |
||||||||||||
| Premenopausal | −.40c (−1.33, −.73) | −.38c (1.42, −2.35) | −.77c (−.21, −1.97) | −.72c (−.70, −6.25) | ||||||||
| Perimenopausal | −.16b (−.62, −.10) | .20b (2.48, −.65) | −.54c (−1.82, −1.23) | −.53c (−6.12, −4.11) | ||||||||
| Adjusted R2 (%) | .04 | .19 | .32 | .04 | .21 | .32 | .12 | .14 | .47 | .14 | .18 | .48 |
| ΔR2 (%) | — | .15 | .13 | — | .17 | .11 | — | — | .04 | .30 | ||
| F | 2.54a | 7.00c | 10.80c | 3.05b | 7.73c | 10.92c | 7.87c | 6.29c | 24.61c | 9.58c | 7.98c | 25.04c |
| Factor | N-H AA (n = 249) | N-H Asian (n = 232) | ||||||||||
|---|---|---|---|---|---|---|---|---|---|---|---|---|
|
| ||||||||||||
| Model 1 | Model 2 | Model 1 | Model 2 | |||||||||
|
| ||||||||||||
| β1 | β2 | β3 (95% CI) | β1 | β2 | β3 (95% CI) | β1 | β2 | β3 (95% CI) | β1 | β2 | β3 (95% CI) | |
| Step 1 | ||||||||||||
| Age (Years) | −.05 | −.05 | −.05 (−.03, .01) | −.05 | −.05 | −.05 (−.09, .03) | −.06 | −.08 | −.07 (−.02, .01) | −.05 | −.08 | −.07 (−.06, .02) |
| Education | −.06 | .05 | −.03 (−.59, .31) | −.05 | −.05 | −.02 (−1.78, 1.13) | .17a | .19b | .22b (.13, .59) | .16a | .18b | .22b (.42, 1.89) |
| Marital status | .05 | .02 | −.003 (−.22, .21) | .02 | −.01 | −.03 (−.92, .51) | .02 | .02 | .08 (−.08, .32) | .01 | .001 | .06 (−.37, .92) |
| Family income (Ref.: sufficient) |
||||||||||||
| Very low | .22b | .21b | .15a (.11, .85) | .26c | .25c | .19b (.80, 3.21) | .06 | .05 | .05 (−.17, .37) | .07 | .05 | .06 (−.50, 1.21) |
| Somehow low | .14a | .12 | .06 (−.10, .37) | .15a | .13a | .07 (−.24, 1.28) | .11 | .06 | .06 (−.10, .23) | .18a | .12 | .12 (−.07, .97) |
| Employment | .05 | .03 | .05 (−.14, .46) | .05 | .03 | .05 (−.50, 1.48) | .07 | .08 | .05 (−.10, .20) | .06 | .08 | .04 (.35, .61) |
| Step 2 | ||||||||||||
| BMI | .04 | .001 (−.02, .02) | .08 | .04 (−.03, .07) | .20b | .19b (.01, .04) | .22b | .23b (.04, .16) | ||||
| Perceived health | ||||||||||||
| Healthy | −.10 | −.09 (−.81, .24) | −.04 | −.03 (−2.05, 1.37) | −.03 | .002 (−.29, .30) | .05 | .09 (−.50, 1.41) | ||||
| Unhealthy | −.20 | −.10 (−.73, .20) | −.13 | −.04 (−1.88, 1.15) | −.12 | −.07 (−.34, .15) | −.06 | −.01 (−.83, .73) | ||||
| Diagnosed GI disease | .19b | .12a (−.73, 1.28) | .19b | .13a (−1.88, 4.35) | .08 | .07 (−.49, 1.62) | .05 | .04 (−2.22, 4.55) | ||||
| Step 3 | ||||||||||||
| Menopausal status (Ref.: postmenopausal) |
||||||||||||
| Premenopausal | −.76c (.13, −1.38) | −.75c (.60, −4.42) | −.26c (−.56, −.17) | −.25c (−1.76, −.54) | ||||||||
| Perimenopausal | −.43c (−1.24, −.65) | −.48c (−4.35, −2.45) | .002 (−.32, .33) | −.03 (−1.27, .80) | ||||||||
| Adjusted R2 (%) | .05 | .09 | .40 | .06 | .11 | .40 | .01 | .05 | .11 | .02 | .07 | .12 |
| ΔR2 (%) | — | .04 | .31 | — | .05 | .29 | — | .04 | .06 | — | .05 | .05 |
| F | 3.16a | 3.51c | 14.57c | 3.83 | 4.01 | 14.71 | 1.54 | 2.30a | 3.26c | 1.77 | 2.78b | 3.59c |
Ref. = reference group/ GI=Gastrointestinal/ Model 1 = the model for total numbers of GI symptoms, Model 2 = the model for total severity scores of GI symptoms/ β1 = β coefficients in Step 1, β2 = β coefficients in Step 2, β3 = β coefficients in Step 3, β4 = β coefficients in Step 4/ CI = 95% Confidence Interval/ N-H = Non-Hispanic, AA = African American, BMI = Body Mass Index / Education (1 = high school or less and 2 = college or above), marital status (1 = married or partnered and 2 = single, unmarried or separated), employment (1 = yes and 0 = no), diagnosed GI diseases (1 = yes and 0 = no)/
p < .05,
p < .01,
p < .001.
In the hierarchical linear regression analyses, all the variables accounted for 33% of the total variances of the total severity scores of GI symptoms in the second step of the model for all participants (F = 35.19, p < .001). When co-variates were controlled, pre-menopausal status was the strongest factor that influenced the total severity scores of GI symptoms in all participants, Hispanics, N-H Whites, N-H African Americans, and N-H Asians (β = −.50, −.38, −.72, −.75, −.25, respectively; Aim 2).
Discussion
The findings supported that race/ethnicity (Aim 1) and menopausal status (Aim 2) were significant factors that influenced the total numbers and total severity scores of GI symptoms among midlife women when background characteristics and health-related factors were controlled. The findings on the significant associations of race/ethnicity to GI symptoms (Aim 1) are consistent with the literature on menopausal symptoms and GI symptoms in general.15–17 Specifically, the finding that Asians had significantly lower total numbers and lower total severity scores of GI symptoms than other racial/ethnic groups is consistent with the findings on Asian midlife women’s menopausal symptoms and Asians’ GI symptoms in general. Studies have reported that Asian women are less likely to have psychological, physical, and psychosomatic symptoms during the menopausal transition compared with other racial/ethnic groups.15–17 Also, Asians in general have been reported to have less GI symptoms compared with Whites.18,19 For instance, in the study by Han et al.,18 Asian Americans tended to have lower percent days with abdominal pain (moderate/severe) and lower psychological distress than Whites, and had lower prevalence rates of constipation-dominant and diarrhea-dominant subtypes of bowel patterns.
The findings on the differences in the most frequently reported GI symptoms among different racial/ethnic groups are also consistent with the literature. For instance, Asians tend to have different symptom presentation and disease sub-tying in functional dyspepsia and irritable bowel syndrome from their Western counterparts, and the differences in cultural dietary practices, defecating practices, and cultural perception of symptoms are reportedly the factors influencing a lower prevalence of constipation among Asian populations.19 Furthermore, Asians are well known about their cultural stoicism toward symptoms and subsequent hesitancy in reporting symptoms.15–17, 20 However, little is still known on the racial/ethnic differences in specific individual symptoms and the association of race/ethnicity to GI symptoms during the menopausal transition, which makes this paper unique in the literature. Furthermore, although researchers have reported that GI symptoms are greatly impacted by many cultural factors (e.g., diet patterns and practices, defecation practices),18,19 very few studies have actually been conducted on the cultural influences on GI symptoms of midlife women in their menopausal transition while considering multiple influencing factors.
When controlling for co-variates, only menopausal status was significantly related to the total numbers and total severity scores of GI symptoms in all racial/ethnic groups (Aim 2), which is consistent with the literature on menopausal symptoms in general.12,13 14 The finding that the total numbers and total severity scores of GI symptoms were the lowest among pre-menopausal women compared with peri- and post-menopausal women across racial/ethnic groups is consistent with the literature as well.12,13 14 As the menopausal transition results in a number of physiological and psycho-socio-cultural changes that are often connected to changes in GI functions,2,4 it would be natural that women experience more frequent and severe GI symptoms in their peri-menopausal and post-menopausal periods compared with in their pre-menopausal period.14
The finding that the total numbers and total severity scores of GI symptoms were the highest in the post-menopausal period except in Asian women is somewhat different from the literature though. The literature is clear that women in late peri-menopausal stage are more likely to have menopausal symptoms compared with post-menopausal women except several symptoms such as sleep complaints, vaginal dryness, and cognitive symptoms.12,13 14 Considering that the prevalence and severity of menopausal symptoms by menopausal status are different depending on the types of symptoms,12,13 14 this finding needs to be interpreted in the same line of thought related to the specific symptoms that reportedly increase during the post-menopausal period (e.g., sleep complaints, vaginal dryness, and cognitive symptoms). The prevalence and severity of GI symptoms in Asian women may increase as aging process progresses in some reasons.
The interpretation of the findings reported in this paper needs to be carefully done due to several study limitations. First of all, the participants were a selected group of midlife women; they tended to be married, employed, and highly educated. Also, the participants might not include various sub-ethnic groups within individual racial/ethnic groups. Furthermore, only self-reported data that were not objectively validated by health care providers were used in this study. In addition, the statistically significant differences by menopausal status and race/ethnicity that were found in this study need a careful interpretation of their clinical meanings. Finally, the original study was a cross-sectional study, which could not provide any information on temporal or possible causal relations of the variables that were included in the study.
Conclusions
This secondary analysis supported significant associations of race/ethnicity to GI symptoms that were experienced during the menopausal transition. Also, the findings supported significant association of menopausal status to GI symptoms across racial/ethnic groups and in individual racial/ethnic groups. The following implications for future research and practice are proposed based on the findings. First of all, more in-depth studies are needed on the influences of menopausal status on specific types of GI symptoms. Second, further studies on racial/ethnic differences in specific types of GI symptoms that are experienced during the menopausal transition and on their influencing factors (e.g., psychological symptoms including depression, symptom perception) are necessary. Especially, more studies on the influences of cultural factors (e.g., cultural dietary patterns and practices, defecation practices) on GI symptoms during the menopausal transition would be essential to understand the racial/ethnic differences in specific types of GI symptoms. Finally, considering the limitations in generalizability of this study, further studies with diverse groups of midlife women in individual racial/ethnic groups are warranted.
Supplementary Material
Sources of Funding:
This is a secondary analysis of the quantitative data from two larger studies that were funded by the National Institute of Health (NIH/NINR/NIA, 1R01NR008926 and NIH/NINR/ NHLBI, R01NR010568).
Footnotes
Financial disclosures/Conflicts of Interest: None reported.
References
- 1.Heitkemper MM, Chang L. Do Fluctuations in Ovarian Hormones Affect Gastrointestinal Symptoms in Women With Irritable Bowel Syndrome? Gend Med. 2009;6(Suppl 2):152–167. doi: 10.1016/j.genm.2009.03.004 [DOI] [PMC free article] [PubMed] [Google Scholar]
- 2.Woods NF, Mitchell ES, Smith-DiJulio K. Cortisol Levels during the Menopausal Transition and Early Postmenopause: Observations from the Seattle Midlife Women’s Health Study. Menopause. 2009;16(4):708–718. doi: 10.1097/gme.0b013e318198d6b2 [DOI] [PMC free article] [PubMed] [Google Scholar]
- 3.Karling P, Norrback K-F, Adolfsson R, Danielsson A. Gastrointestinal symptoms are associated with hypothalamic-pituitary-adrenal axis suppression in healthy individuals. Scand J Gastroenterol. 2007;42(11):1294–1301. doi: 10.1080/00365520701395945 [DOI] [PubMed] [Google Scholar]
- 4.Callan NGL, Mitchell ES, Heitkemper MM, Woods NF. Abdominal pain during the menopause transition and early postmenopause: observations from the Seattle Midlife Women’s Health Study. Womens Midlife Health. 2019;5(1):2. doi: 10.1186/s40695-019-0046-5 [DOI] [PMC free article] [PubMed] [Google Scholar]
- 5.Richard-Davis G, Wellons M. Racial and ethnic differences in the physiology and clinical symptoms of menopause. Semin Reprod Med. 2013;31(5):380–386. doi: 10.1055/s-0033-1348897 [DOI] [PubMed] [Google Scholar]
- 6.Sutton-Tyrrell K, Wildman RP, Matthews KA, et al. Sex-hormone-binding globulin and the free androgen index are related to cardiovascular risk factors in multiethnic premenopausal and perimenopausal women enrolled in the Study of Women Across the Nation (SWAN). Circulation. 2005;111(10):1242–1249. doi: 10.1161/01.CIR.0000157697.54255.CE [DOI] [PubMed] [Google Scholar]
- 7.Bernstein MT, Graff LA, Avery L, Palatnick C, Parnerowski K, Targownik LE. Gastrointestinal symptoms before and during menses in healthy women. BMC Womens Health. 2014;14:14. doi: 10.1186/1472-6874-14-14 [DOI] [PMC free article] [PubMed] [Google Scholar]
- 8.Jang S-H, Ryu H-S, Choi S-C, Lee H-J, Lee S-Y. Psychological factors influence the overlap syndrome in functional gastrointestinal disorders (FGIDs) among middle-aged women in South Korea. Women Health. 2018;58(1):112–127. doi: 10.1080/03630242.2017.1282394 [DOI] [PubMed] [Google Scholar]
- 9.Dodd M, Janson S, Facione N, et al. Advancing the science of symptom management. J Adv Nurs. 2001;33(5):668–676. doi: 10.1046/j.1365-2648.2001.01697.x [DOI] [PubMed] [Google Scholar]
- 10.Linder L Analysis of the UCSF Symptom Management Theory: implications for pediatric oncology nursing. J Pediatr Oncol Nurs. 2010;27(6):316–324. doi: 10.1177/1043454210368532 [DOI] [PMC free article] [PubMed] [Google Scholar]
- 11.Skelly AH, Leeman J, Carlson J, Soward ACM, Burns D. Conceptual model of symptom-focused diabetes care for African Americans. J Nurs Scholarsh. 2008;40(3):261–267. doi: 10.1111/j.1547-5069.2008.00236.x [DOI] [PMC free article] [PubMed] [Google Scholar]
- 12.Santoro N, Epperson CN, Mathews SB. Menopausal Symptoms and Their Management. Endocrinol Metab Clin North Am. 2015;44(3):497–515. doi: 10.1016/j.ecl.2015.05.001 [DOI] [PMC free article] [PubMed] [Google Scholar]
- 13.Avis NE, Brockwell S, Colvin A. A universal menopausal syndrome? Am J Med. 2005;118(Suppl 12B):37–46. doi: 10.1016/j.amjmed.2005.09.057. [DOI] [PubMed] [Google Scholar]
- 14.Pérez JAM, Garcia FC, Palacios S, Pérez M. Epidemiology of risk factors and symptoms associated with menopause in Spanish women. Maturitas. 2009;62(1):30–36. doi: 10.1016/j.maturitas.2008.10.003 [DOI] [PubMed] [Google Scholar]
- 15.Koloski NA, Talley NJ, Boyce PM. Does psychological distress modulate functional gastrointestinal symptoms and health care seeking? A prospective, community Cohort study. Am J Gastroenterol. 2003;98(4):789–797. doi: 10.1111/j.1572-0241.2003.07388.x [DOI] [PubMed] [Google Scholar]
- 16.Li C, Borgfeldt C, Samsioe G, Lidfeldt J, Nerbrand C. Background factors influencing somatic and psychological symptoms in middle-age women with different hormonal status. A population-based study of Swedish women. Maturitas. 2005;52(3-4):306–318. doi: 10.1016/j.maturitas.2005.05.005 [DOI] [PubMed] [Google Scholar]
- 17.Avis NE, Crawford SL, Greendale G, et al. Duration of Menopausal Vasomotor Symptoms Over the Menopause Transition. JAMA Intern Med. 2015;175(4):531. doi: 10.1001/jamainternmed.2014.8063 [DOI] [PMC free article] [PubMed] [Google Scholar]
- 18.Harlow SD, Karvonen-Gutierrez C, Elliott MR, et al. It is not just menopause: symptom clustering in the Study of Women’s Health Across the Nation. Womens Midlife Health. 2017;3(1):2. doi: 10.1186/s40695-017-0021-y [DOI] [PMC free article] [PubMed] [Google Scholar]
- 19.Im E-O, Lee SH, Chee W. Sub-Ethnic Differences in the Menopausal Symptom Experience: Asian American Midlife Women. J Transcult Nurs. 2010;21(2):123–133. doi: 10.1177/1043659609357639 [DOI] [PMC free article] [PubMed] [Google Scholar]
- 20.Purnell LD, Fenkl E. Textbook for Transcultural Health Care: A Population Approach. Springer; 2020. ISBN-13: 978-3030513986 [Google Scholar]
Associated Data
This section collects any data citations, data availability statements, or supplementary materials included in this article.