

Abstract
BACKGROUND AND PURPOSE:
Recent studies have suggested that maternal obesity during pregnancy is associated with differences in neurodevelopmental outcomes in children. In this study, we aimed to investigate the relationships between maternal obesity during pregnancy and neonatal brain cortical development.
MATERIALS AND METHODS:
Forty-four healthy women (28 normal-weight, 16 obese) were prospectively recruited at <10 weeks’ gestation, and their healthy full-term neonates (23 boys, 21 girls) underwent brain MR imaging. All pregnant women had their body composition (fat mass percentage) measured at ∼12 weeks of pregnancy. All neonates were scanned at ∼2 weeks of age during natural sleep without sedation, and their 3D T1-weighted images were postprocessed by the new iBEAT2.0 software. Brain MR imaging segmentation and cortical surface reconstruction and parcellation were completed using age-appropriate templates. Mean cortical thickness for 34 regions in each brain hemisphere defined by the UNC Neonatal Cortical Surface Atlas was measured, compared between groups, and correlated with maternal body fat mass percentage, controlled for neonate sex and race, postmenstrual age at MR imaging, maternal age at pregnancy, and the maternal intelligence quotient and education.
RESULTS:
Neonates born to obese mothers showed significantly lower (P ≤ .05, false discovery rate–corrected) cortical thickness in the left pars opercularis gyrus, left pars triangularis gyrus, and left rostral middle frontal gyrus. Mean cortical thickness in these frontal lobe regions negatively correlated (R = –0.34, P = .04; R = –0.50, P = .001; and R = –0.42, P = .01; respectively) with the maternal body fat mass percentage measured at early pregnancy.
CONCLUSIONS:
Maternal obesity during pregnancy is associated with lower neonate brain cortical thickness in several frontal lobe regions important for language and executive functions.
The most recent National Health and Nutrition Examination Survey reported that 39.7% of women in the United States 20–39 years of age are obese (body mass index [BMI], ≥30),1 and the most recent national birth data showed that 54.7% of neonates in 2018 in the United States were born to overweight (BMI ≥25) or obese women.2 Maternal obesity during pregnancy has become a prevalent health concern, not only for the pregnant women but also for their offspring,3 including their neurodevelopment.4,5 Recent studies have shown negative associations between maternal obesity and neurodevelopmental outcomes of children, including reduced infant cognitive development scores, increased risk of delayed mental development, lower cognitive performance, impaired executive function, lower full-scale intelligence quotient (IQ) and verbal IQ, higher attention-deficit/hyperactivity disorder symptom scores, increased risk for inattention and negative emotionality, and higher prevalence of autism.4,6-18 These findings strongly suggest that maternal obesity during pregnancy can negatively influence an offspring’s cognitive and neurodevelopmental outcomes. Nevertheless, little is known regarding the underlying mechanism of these associations.
Recent advances in early neuroimaging, particularly advanced and quantitative MR imaging, which can detect subtle changes in the brain, provide a sensitive tool to detect the potential in utero effects of maternal obesity on the developing brain. These direct effects on early brain development, if observed, may link maternal obesity during pregnancy with adverse long-term neurodevelopmental outcomes in children and may shed light on the underlying mechanism. In fact, a few recent studies have reported significant changes in neonatal brain structural and functional development associated with maternal obesity. For example, neonates of obese, otherwise healthy, women showed lower brain white matter development measured by diffusion tensor imaging in widespread regions in the frontal and parietal lobes compared with neonates of healthy normal-weight women.19 Weaker functional connectivity of the dorsal anterior cingulate cortex to the prefrontal networks in neonates born to obese-versus-normal-weight women was also observed in a study using independent component analysis of resting-state fMRI data,20 and a further seed-based and graph theory of functional connectivity study indicated possible neonatal functional connectivity alterations in 4 functional domains implicated in adult obesity: sensory processing, reward processing, cognitive control, and motor control.21 In addition, another study also observed that a higher maternal prepregnancy BMI was associated with greater local thalamic and lower frontothalamic functional connectivity in the neonatal brain.22 Furthermore, studies have also shown that brain imaging features measured by early MR imaging are associated with long-term neurodevelopmental outcomes not only in neonates with medical conditions such as prematurity, congenital heart diseases, or hypoxic-ischemic encephalopathy23-25 but also in neonates who are born full-term, healthy, and typically developing.26 These findings suggest the importance of early neuroimaging in understanding the potential effects of maternal obesity during pregnancy on children’s neurodevelopmental outcomes.
Brain cortical development starts in the first trimester of gestation and continues in the fetal and postnatal stages, with dynamic synapse formation in early life followed by gradual pruning throughout childhood. This process can be reflected by measurements of cortical thickness, which reaches a peak between 1 and 2 years of age27 and starts to decrease thereafter.28 Despite the obvious importance of brain cortical development in a child’s brain function and cognitive outcomes, so far no published studies have evaluated whether maternal obesity during pregnancy would alter cortical development in the developing brain at early ages. In this study, we aimed to investigate relationships between maternal obesity and neonate brain cortical development. Our hypothesis was that maternal obesity during pregnancy would slow fetal cortical development and result in lower neonate cortical thickness in different brain regions. To test our hypothesis, we enrolled healthy normal-weight and obese pregnant women at first trimester, measured their BMI and body composition, performed brain MR imaging examination on their neonates, compared cortical thickness between the 2 groups of neonates, and evaluated its relationship with maternal body fat mass percentage measured at early pregnancy.
MATERIALS AND METHODS
Subjects
Healthy pregnant women of <10 weeks’ gestation and their full-term healthy neonates were included in this study. All study procedures were approved by the University of Arkansas for Medical Sciences institutional review board, and all participants provided written informed consents. Inclusion criteria for the pregnant women were the following: prepregnancy BMI of 18.5–24.9 kg/m2 [normal-weight group] or 30–35 kg/m2 [obese group]), second parity, singleton pregnancy, 21 years of age or older, and conceived without assisted fertility treatments. Exclusion criteria for the pregnant women were the following: pre-existing medical conditions such as diabetes mellitus, seizure disorder, and serious psychiatric disorders; drug or alcohol abuse; sexually transmitted diseases; and medical complications during pregnancy such as gestational diabetes and pre-eclampsia. In addition, neonates born preterm (<37 weeks of gestation) or with medical conditions or medications known to influence growth and development or those unable to complete a brain MR imaging examination during natural sleep were also excluded.
All pregnant women had their body composition assessed using air displacement plethysmography (BOD POD; Cosmed) and BMI measured at ∼12 weeks of pregnancy at Arkansas Children’s Nutrition Center. Maternal IQ was also assessed using the Wechsler Abbreviated Scale of Intelligence (Pearson). After delivery, birth weight and the length of the neonates were retrieved from the medical records, while head circumference was measured at ∼2 weeks of age during the infant’s study visit. Family socioeconomic status of the neonates including parental education and income was also obtained during the mother’s pregnancy visits.
In total, 44 pregnant women (28 normal-weight, 16 obese) and their neonates completed the experimental procedures and were included in this study. Table summarizes the demographic information of the study participants.
Demographic information of the study participants
| Normal Weight (n = 28) | Obese (n = 16) | P Value | |
|---|---|---|---|
| Maternal BMI (kg/m2) | 22.2 (SD, 1.9) | 33.2 (SD, 1.5) | <.001 |
| Maternal fat mass (%) | 28.8 (SD, 4.2) | 44.0 (SD, 3.9) | <.001 |
| Maternal age at pregnancy (yr) | 28.7 (SD, 2.9) | 30.7 (SD, 5.0) | .19 |
| Maternal IQ | 107 (SD, 9.2) | 106.6 (SD, 8.3) | .50 |
| Gestational age (day) | 275.1 (SD, 6.7) | 274.7 (SD, 6.4) | .96 |
| Neonate sex (boy/girl) | 15/13 | 8/8 | .83 |
| Birth weight (kg) | 3.5 (SD, 0.5) | 3.6 (SD, 0.5) | .38 |
| Birth length (cm) | 50.6 (SD, 2.8) | 50.5 (SD, 2.5) | .89 |
| Head circumference (cm) | 36.2 (SD, 1.1) | 36.0 (SD, 0.8) | .25 |
| Neonate age at MR imaging (day) | 14.3 (SD, 1.6) | 14.3 (SD, 1.7) | 1 |
| Postmenstrual age at MR imaging (day) | 289.4 (SD, 6.4) | 289 (SD, 6.3) | .93 |
| Neonate race | |||
| White/African American/American Indian/other) | 22/2/1/3 | 10/5/1/0 | .18 |
| Mother’s education | |||
| No college/some college/graduate degree | 3/17/8 | 0/9/7 | .30 |
| Father’s education | |||
| NA/no college/some college/graduate degree) | 1/24/3/0 | 2/10/4/0 | .20 |
| Mother’s income (US dollar) | |||
| NA/ ≤ 20k/20–50k/>50k) | 6/6/12/4 | 1/3/9/3 | .57 |
| Father’s income (US dollar) | |||
| NA/≤ 20k/20–50k/>50k) | 1/0/14/13 | 3/0/6/7 | .23 |
Note:—NA indicates not applicable.
MR Imaging Data Acquisition
At ∼2 weeks of age, all neonates underwent an MR imaging examination of the brain during natural sleep without sedation at the Arkansas Children’s Hospital, Department of Radiology. They were fed 15–30 minutes before the scan, swaddled in warm sheets, and bundled using a MedVac Infant Immobilizer (CFI Medical Solutions). No sedation was used. A pulse oximeter probe (InVivo) was placed on a foot to monitor oxygen saturation and heart rate, and Mini Muffs (Natus Medical) and a headset were placed over the ears to protect the neonates from the noise generated during the scan. The MR imaging examinations were performed on a 1.5T Achieva MR imaging scanner (Philips Healthcare) with a 60-cm bore size, 33-mT/m gradient amplitude, and 100-mT/m/ms maximum slew rate. We used a pediatric 8-channel sensitivity encoding head coil and a neonatal brain MR imaging protocol, which included sagittal 3D turbo field echo T1-weighted imaging reconstructed to 3 planes, axial T2-weighted, axial diffusion-weighted, and axial susceptibility-weighted imaging sequences. This conventional neonatal MR imaging protocol was used for the neuroradiologists to screen subjects for incidental findings, while the 3D T1-weighted images with TR =7.1 ms, TE = 3.2 ms, flip angle = 8°, and resolution = 1 × 1 × 1 mm were used for subsequent cortical brain morphometry analysis, particularly measurements of cortical thickness. Imaging quality control was performed on the scanner by experienced MR imaging technicians. Scans were repeated if considerable motion artifacts were present, and those neonates who woke up during the scan without a valid 3D T1 dataset were excluded from this study.
MR Imaging Data Analysis
All MR images were exported to the local PACS system from the scanner and were reviewed by one of our neuroradiologists. No incidental findings needing medical attention were noted. All of the 3D T1-weighted images were also exported to local workstations for further cortical analysis. Specifically, DICOM images were converted to NIfTI format and were postprocessed by the new iBEAT V2.0 software (Developing Brain Computing Lab and Baby Brain Mapping Lab). iBEAT V2.0 is a toolbox using advanced approaches including deep learning for processing pediatric brain T1- and T2-weighted MR images. It is an upgrade from the previous iBEAT software and has demonstrated superior capability and accuracy in infant structural MR imaging data postprocessing. For neonatal MR imaging, 3D T1-weighted images are adequate for the automated postprocessing because of the considerable contrast between different tissues. For this study, 3D T1-weighted MR images were corrected for inhomogeneity before skull stripping,29 followed by tissue segmentation to gray matter, white matter, and CSF. Left/right hemisphere separation and topology correction were then performed.30,31 Cortical surfaces including inner cortical and outer cortical surfaces were reconstructed. Cortical parcellation was performed on the basis of the infant developmental parcellation maps.27,32 The UNC Neonatal Cortical Surface Atlas,32,33 which parcellates the brain cortex in each hemisphere into 34 different regions, was used to calculate the mean cortical thickness for each cortical region for each neonate. Cortical thickness was defined as the closest distance from the white surface to the pial surface at each vertex of each surface.
Statistics
For the comparison of demographic parameters between the normal-weight and obese groups, Wilcoxon rank sum tests were performed to determine whether there were significant group differences (P values ≤ .05) for numeric parameters, while χ2 tests were used for categoric parameters. To compare the cortical thickness between neonates born to normal-weight or obese mothers, we performed ANOVA with covariates of neonate sex and race, postmenstrual age at MR imaging, maternal age at pregnancy, as well as IQ and education for each cortical region defined by the UNC Neonatal Cortical Surface Atlas. Sex and postmenstrual age were controlled as potential confounders because infant brain differences associated with sex and gestational/postmenstrual age have been reported.34,35 Effects of maternal age and IQ were also controlled because of potential effects on the offspring’s brain development or neurodevelopmental outcomes.36 For family socioeconomic status, due to missing data in the father’s education and parental income for several subjects, only maternal education was added as a covariate in the analysis. The cortical thickness was not normalized to total brain volume because the literature suggested that normalizing did not improve the discriminant and predictive performance of cortical thickness measures.37 False discovery rate (FDR) correction was used for multiple-comparison correction associated with the 68 brain cortical regions evaluated in total, and regions with FDR-corrected P values ≤.05 were regarded as significant regarding cortical thickness. In addition, to investigate whether there is a linear relationship between maternal body composition and neonate brain development, we evaluated correlations between maternal fat mass percentage measured at ∼12 weeks of gestation and neonate brain cortical thickness at ∼2 weeks of postnatal age for those regions identified by ANOVA using the Spearman rank partial-correlation test. Partial correlation coefficients (R values) and significance levels (P values) were calculated, and those correlations with P values ≤ .05 after controlling of neonate sex and race, postmenstrual age at MR imaging, maternal age at pregnancy, and IQ and education were regarded as significant. All statistics analyses were done in Matlab software, Version R2018b (MathWorks).
RESULTS
The normal-weight and obese pregnant women differed significantly in mean BMI measured at ∼12 weeks of pregnancy (22.2 [SD, 1.9] versus 33.2 [SD, 1.5], P < .001), as well as in body fat percentage (28.8% [SD, 4.2%] versus 44.0% [SD, 3.9%], P < .001). Other maternal/family measures such as maternal age at pregnancy and IQ as well as family socioeconomic status were not different (Table). For the neonates, there were no group differences in sex, race, birth weight/height, head circumference, gestational age at birth, or postmenstrual age at MR imaging (Table).
For comparison of cortical thickness at ∼2 weeks’ postnatal age for the neonates, the ANOVA analysis (with effects of neonate sex and race, postmenstrual age at MR imaging, maternal age at pregnancy, and IQ- and education-controlled) showed that there were 3 regions with significant differences (FDR-corrected, P ≤ .05) between neonates born to normal-weight versus obese women in the 68 cortical regions defined by the UNC Neonatal Cortical Surface Atlas. Specifically, the mean cortical thickness in the left pars opercularis gyrus was higher in neonates born to normal-weight-versus-obese women (1.99 [SD, 0.07] mm versus 1.90 [SD, 0.07] mm; FDR-corrected, P = .01); the mean cortical thickness in the left pars triangularis gyrus was also higher in neonates born to normal-weight-versus-obese women (1.92 [SD, 0.07] mm versus 1.84 [SD, 0.06] mm; FDR-corrected, P = .04); and the mean cortical thickness in the left rostral middle frontal gyrus was also higher in neonates born to normal-weight-versus-obese women (1.78 [SD, 0.03] mm versus 1.74 [SD, 0.04] mm; FDR-corrected, P = .04). The anatomic location of these 3 cortical regions as well as the comparison of mean cortical thickness in these 3 regions are illustrated in Fig 1. No other regions showed differences in cortical thickness between the 2 neonate groups.
FIG 1.

The anatomic locations for the 3 brain cortical regions that showed significant differences (FDR-corrected P ≤ .05) in mean cortical thickness between neonates born to normal-weight-versus-obese women: the left pars opercularis (LPO) gyrus (A), the left pars triangularis (LPT) gyrus (B), and the left rostral middle frontal (LFMF) gyrus (C). The comparison of mean cortical thickness for these 3 regions in these groups of neonates is illustrated in D.
For the 3 cortical regions identified using the ANOVA analysis, the Spearman rank partial correlation test was used to evaluate whether there is a linear relationship the between mother’s body composition (particularly body fat mass percentage) and the neonatal brain development (particularly cortical thickness). Similarly, neonate sex and race and postmenstrual age at MR imaging, as well as maternal age at pregnancy and IQ and education were controlled in the partial correlation analysis. There were significant negative correlations (P < .05) between maternal fat mass percentage and neonate brain cortical thickness in all of these 3 regions (Fig 2). Specifically, neonate brain regional mean cortical thickness measured at ∼2 weeks’ postnatal age negatively correlated with maternal body fat mass percentage measured at ∼12 weeks of pregnancy in the left pars opercularis gyrus (R = −0.34, P = .04), the left pars triangularis gyrus (R = −0.50, P = .001), and the left rostral middle frontal gyrus (R = −0.42, P = .01).
FIG 2.
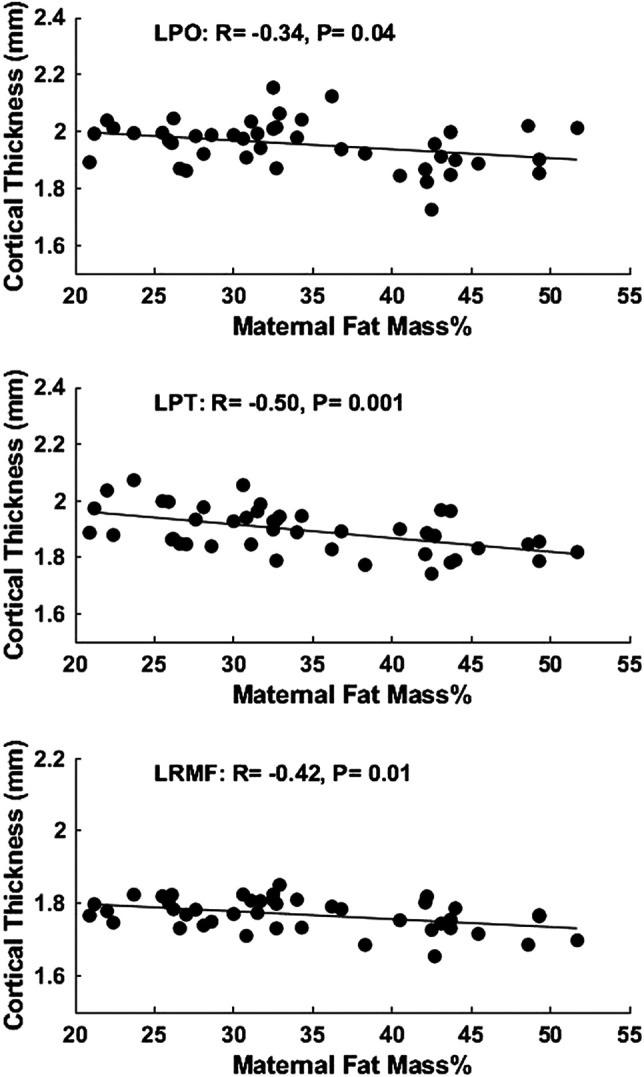
Partial correlation analysis showed significant negative correlations (P < .05) between maternal body fat mass percentage measured at ∼12 weeks of pregnancy and neonate brain mean cortical thickness measured at ∼2 weeks’ postnatal age in the left pars opercularis (LPO) gyrus, left pars triangularis (LPT) gyrus, and left rostral middle frontal (LRMF) gyrus.
DISCUSSION
Our study indicated significant relationships between the mother’s BMI status and body composition at early pregnancy and the neonate’s brain cortical development at ∼2 weeks of age. The more obese the pregnant women were during early pregnancy, the lower the cortical thickness was in several brain regions in their neonates. All pregnant women included in this study were healthy, without medical conditions or medication use during pregnancy that may affect fetal brain development, and all neonates were also healthy, born full-term, without any birth defects or medical conditions that may impact their brain development. Our results suggest that there may be a negative impact of maternal obesity during pregnancy on the offspring’s brain development because cortical thickness increases during infancy in normal development and it appears that maternal obesity may have slowed or impaired cortical development at 2 weeks’ postnatal age.
The brain regions showing the potential impact of maternal obesity on cortical development are all in the frontal lobe, indicating that frontal lobe brain regions may be most vulnerable to potential disturbances in fetal programming due to maternal obesity. This finding is consistent with previous findings that microstructure integrity evaluated by DTI was lower in widespread frontal white matter regions in neonates born to obese-versus-normal-weight mothers19 and that functional connectivity from the dorsal anterior cingulate cortex to the prefrontal network measured by resting-state fMRI was lower in neonates born to obese-versus-normal-weight mothers.20 This is also consistent with another functional connectivity study of infants born to adolescents or young adult women that demonstrated that higher maternal BMI was associated with lower frontothalamic connectivity in the infant brain.23 While the underlying and potential neurobiologic processes for the vulnerability of frontal lobe development to maternal obesity are unclear, numerous studies have indicated that the rapid infant frontal brain development is sensitive to early environmental experiences,38 including exposures to different adverse prenatal environmental factors.39,40
For the 3 specific frontal lobe regions that showed decreased cortical thickness associated with maternal obesity, the left pars opercularis gyrus and the left pars triangularis gyrus form the middle and posterior parts of the left inferior frontal gyrus and are commonly regarded as the Broca area, which is important for expressive language function such as speech production. The left rostral middle frontal gyrus largely overlaps with the dorsolateral prefrontal cortex and is critical for executive function such as emotion regulation and working memory. Thinner cortices in these language- and executive function–related brain regions in early life may have important functional implications because recent studies have shown that maternal obesity is associated with lower composite language scores14 or a different language developmental trajectory,41 as well as lower cognitive flexibility42 or poorer executive functioning in areas of attention, inhibition control, and working memory43 in children.
Most interesting, frontal brain structural and functional changes have also been observed in children, associated with childhood obesity. For example, in recent analyses of National Institutes of Health Adolescent Brain and Cognitive Development Study data, increased BMI in 9- to 11-year-old children significantly correlated with reduced cortical thickness in the frontal lobe and lower performance in several tasks involving executive functions,44 and reduced thickness in a number of frontal cortical regions partially accounted for reductions in executive function.45 Many fMRI studies have also demonstrated differences in brain activation involving the frontal lobe during task performance between normal-weight and overweight/obese children/adolescents.46-50 Given that maternal obesity may predispose offspring to a higher risk of childhood obesity, the similarities of changes in the developing brain associated with maternal obesity and childhood obesity may suggest potential consequential effects, eg, maternal obesity may possibly program persistent changes in certain regions of the developing brain, which, in turn, may cause behavior issues in childhood (such as deficiency in inhibitory control toward food) and further increase the risk of developing childhood obesity. While this is a speculation that cannot be validated by the data in our current study alone (eg, whether there are persistent changes in the brain associated with maternal obesity that will require follow-up imaging studies), our results certainly can contribute to the growing field striving to understand more about obesity-brain relationships.
Our study design was prospective and longitudinal, and we recruited pregnant women in early pregnancy, measured their body composition, followed up their pregnancy, and evaluated their infants’ brain development using MR imaging. Nevertheless, 1 limitation of our findings is that we only have complete MR imaging data for the cohort at neonatal age. Follow-up MR imaging and neurodevelopmental assessments at later ages will be necessary to determine whether brain changes associated with maternal obesity in neonates persist into later childhood and impact long-term neurodevelopmental outcomes. Another limitation is the relatively small sample size of this study. A larger-scale study may allow us to control for more potential confounders and may identify more brain regions and imaging features in the developing brain associated with maternal obesity. Last, family socioeconomic status may also be a confounding factor for infant brain development.
In our statistical analysis, we controlled for the mother’s education, for which we have data for all subjects (n = 44). For other socioeconomic parameters for which we have missing data including the mother’s income (n = 37) and the father’s education (n = 41) and income (n = 40), we compared the available data, and there were no group differences (Table). In addition, the significant group differences as well as significant correlations between maternal body fat mass percentage and neonate cortical thickness in the 3 regions we report still hold (all P values in Figs 1D and 2 are still < .05 except for one) if we add parental incomes and the father’s education as additional covariates in the data analysis (despite the missing data and the relatively large number of covariates compared with the sample size in the statistical model).
CONCLUSIONS
Neonates born to obese women showed lower cortical thickness measured by MR imaging at ∼2 weeks of age in several frontal brain regions important for language and executive function. The mother’s body fat mass percentage measured in early pregnancy negatively correlated with the neonate’s brain cortical thickness in these regions. Our results indicate that there may be a negative impact of maternal obesity during pregnancy on the offspring’s cortical brain development.
ABBREVIATIONS:
- BMI
body mass index
- FDR
false discovery rate
- IQ
intelligence quotient
Footnotes
This study was supported, in part, by the National Institutes of Health, R01HD099099, R01MH117943, R01MH116225, and US Department of Agriculture/Agricultural Research Service, 6026-51000-012-06-S.
Disclosure forms provided by the authors are available with the full text and PDF of this article at www.ajnr.org.
References
- 1.Hales CM, Carroll MD, Fryar CD, et al. Prevalence of obesity and severe obesity among adults: United States, 2017-2018. NCHS Data Brief 2020:1–8 [PubMed] [Google Scholar]
- 2.Martin JA, Hamilton BE, Osterman MJ, et al. Births: final data for 2018. Natl Vital Stat Rep 2019;68:1–47 [PubMed] [Google Scholar]
- 3.Santangeli L, Sattar N, Huda SS. Impact of maternal obesity on perinatal and childhood outcomes. Best Pract Res Clin Obstet Gynaecol 2015;29:438–48 10.1016/j.bpobgyn.2014.10.009 [DOI] [PubMed] [Google Scholar]
- 4.Edlow AG. Maternal obesity and neurodevelopmental and psychiatric disorders in offspring. Prenat Diagn 2017;37:95–110 10.1002/pd.4932 [DOI] [PMC free article] [PubMed] [Google Scholar]
- 5.Kong L, Chen X, Gissler M, et al. Relationship of prenatal maternal obesity and diabetes to offspring neurodevelopmental and psychiatric disorders: a narrative review. Int J Obes (Lond) 2020;44:1981–2000 10.1038/s41366-020-0609-4 [DOI] [PMC free article] [PubMed] [Google Scholar]
- 6.Casas M, Chatzi L, Carsin AE, et al. Maternal pre-pregnancy overweight and obesity, and child neuropsychological development: two Southern European birth cohort studies. Int J Epidemiol 2013;42:506–17 10.1093/ije/dyt002 [DOI] [PubMed] [Google Scholar]
- 7.Hinkle SN, Schieve LA, Stein AD, et al. Associations between maternal prepregnancy body mass index and child neurodevelopment at 2 years of age. Int J Obes (Lond) 2012;36:1312–19 10.1038/ijo.2012.143 [DOI] [PMC free article] [PubMed] [Google Scholar]
- 8.Basatemur E, Gardiner J, Williams C, et al. Maternal prepregnancy BMI and child cognition: a longitudinal cohort study. Pediatrics 2013;131:56–63 10.1542/peds.2012-0788 [DOI] [PubMed] [Google Scholar]
- 9.Buss C, Entringer S, Davis EP, et al. Impaired executive function mediates the association between maternal pre-pregnancy body mass index and child ADHD symptoms. PLoS One 2012;7:e37758 10.1371/journal.pone.0037758 [DOI] [PMC free article] [PubMed] [Google Scholar]
- 10.Huang LS, Yu XD, Keim S, et al. Maternal prepregnancy obesity and child neurodevelopment in the Collaborative Perinatal Project. Int J Epidemiol 2014;43:783–92 10.1093/ije/dyu030 [DOI] [PubMed] [Google Scholar]
- 11.Rodriguez A, Miettunen J, Henriksen TB, et al. Maternal adiposity prior to pregnancy is associated with ADHD symptoms in offspring: evidence from three prospective pregnancy cohorts. Int J Obes (Lond) 2008;32:550–57 10.1038/sj.ijo.0803741 [DOI] [PubMed] [Google Scholar]
- 12.Rodriguez A. Maternal pre-pregnancy obesity and risk for inattention and negative emotionality in children. J Child Psychol Psychiatry 2010;51:134–43 10.1111/j.1469-7610.2009.02133.x [DOI] [PubMed] [Google Scholar]
- 13.Krakowiak P, Walker CK, Bremer AA, et al. Maternal metabolic conditions and risk for autism and other neurodevelopmental disorders. Pediatrics 2012;129:E1121–28 10.1542/peds.2011-2583 [DOI] [PMC free article] [PubMed] [Google Scholar]
- 14.Reynolds LC, Inder TE, Neil JJ, et al. Maternal obesity and increased risk for autism and developmental delay among very preterm infants. J Perinatol 2014;34:688–92 10.1038/jp.2014.80 [DOI] [PMC free article] [PubMed] [Google Scholar]
- 15.Jo H, Schieve LA, Sharma AJ, et al. Maternal prepregnancy body mass index and child psychosocial development at 6 years of age. Pediatrics 2015;135:e1198– 209 10.1542/peds.2014-3058 [DOI] [PMC free article] [PubMed] [Google Scholar]
- 16.Girchenko P, Tuovinen S, Lahti-Pulkkinen M, et al. Maternal early pregnancy obesity and related pregnancy and pre-pregnancy disorders: associations with child developmental milestones in the prospective PREDO Study. Int J Obes (Lond) 2018;42:995–1007 10.1038/s41366-018-0061-x [DOI] [PubMed] [Google Scholar]
- 17.Casas M, Forns J, Martinez D, et al. Maternal pre-pregnancy obesity and neuropsychological development in pre-school children: a prospective cohort study. Pediatr Res 2017;82:596–606 10.1038/pr.2017.118 [DOI] [PubMed] [Google Scholar]
- 18.Contu L, Hawkes CA. A review of the impact of maternal obesity on the cognitive function and mental health of the offspring. Int J Mol Sci 2017;18:1093 10.3390/ijms18051093 [DOI] [PMC free article] [PubMed] [Google Scholar]
- 19.Ou X, Thakali KM, Shankar K, et al. Maternal adiposity negatively influences infant brain white matter development. Obesity 2015;23:1047–54 10.1002/oby.21055 [DOI] [PMC free article] [PubMed] [Google Scholar]
- 20.Li X, Andres A, Shankar K, et al. Differences in brain functional connectivity at resting state in neonates born to healthy obese or normal-weight mothers. Int J Obes (Lond) 2016;40:1931–34 10.1038/ijo.2016.166 [DOI] [PubMed] [Google Scholar]
- 21.Salzwedel AP, Gao W, Andres A, et al. Maternal adiposity influences neonatal brain functional connectivity. Front Hum Neurosci 2018;12:514 10.3389/fnins.2018.00514 [DOI] [PMC free article] [PubMed] [Google Scholar]
- 22.Spann MN, Scheinost D, Feng T, et al. Association of maternal prepregnancy body mass index with fetal growth and neonatal thalamic brain connectivity among adolescent and young women. JAMA Netw Open 2020;3:e2024661 10.1001/jamanetworkopen.2020.24661 [DOI] [PMC free article] [PubMed] [Google Scholar]
- 23.Perlman JM. White matter injury in the preterm infant: an important determination of abnormal neurodevelopment outcome. Early Hum Dev 1998;53:99–120 10.1016/S0378-3782(98)00037-1 [DOI] [PubMed] [Google Scholar]
- 24.Peyvandi S, Chau V, Guo T, et al. Neonatal brain injury and timing of neurodevelopmental assessment in patients with congenital heart disease. J Am Coll Cardiol 2018;71:1986–96 10.1016/j.jacc.2018.02.068 [DOI] [PMC free article] [PubMed] [Google Scholar]
- 25.Weeke LC, Groenendaal F, Mudigonda K, et al. A novel magnetic resonance imaging score predicts neurodevelopmental outcome after perinatal asphyxia and therapeutic hypothermia. J Pediatr 2018;192:33–40.e2 10.1016/j.jpeds.2017.09.043 [DOI] [PMC free article] [PubMed] [Google Scholar]
- 26.Feng K, Rowell AC, Andres A, et al. Diffusion tensor MRI of white matter of healthy full-term newborns: relationship to neurodevelopmental outcomes. Radiology 2019;292:179–87 10.1148/radiol.2019182564 [DOI] [PMC free article] [PubMed] [Google Scholar]
- 27.Wang F, Lian C, Wu Z, et al. Developmental topography of cortical thickness during infancy. Proc Natl Acad Sci U S A 2019;116:15855–60 10.1073/pnas.1821523116 [DOI] [PMC free article] [PubMed] [Google Scholar]
- 28.Fjell AM, Grydeland H, Krogsrud SK, et al. Development and aging of cortical thickness correspond to genetic organization patterns. Proc Natl Acad Sci U S A 2015;112:15462–67 10.1073/pnas.1508831112 [DOI] [PMC free article] [PubMed] [Google Scholar]
- 29.Wang L, Li G, Shi F, et al. Volume-based analysis of 6-month-old infant brain MRI for autism biomarker identification and early diagnosis. Med Image Comput Comput Assist Interv 2018;11072:411–19 10.1007/978-3-030-00931-1_47 [DOI] [PMC free article] [PubMed] [Google Scholar]
- 30.Li G, Nie J, Wang L, et al. Measuring the dynamic longitudinal cortex development in infants by reconstruction of temporally consistent cortical surfaces. Neuroimage 2014;90:266–79 10.1016/j.neuroimage.2013.12.038 [DOI] [PMC free article] [PubMed] [Google Scholar]
- 31.Li G, Wang L, Yap PT, et al. Computational neuroanatomy of baby brains: a review. Neuroimage 2019;185:906–25 10.1016/j.neuroimage.2018.03.042 [DOI] [PMC free article] [PubMed] [Google Scholar]
- 32.Li G, Wang L, Shi F, et al. Construction of 4D high-definition cortical surface atlases of infants: methods and applications. Med Image Anal 2015;25:22–36 10.1016/j.media.2015.04.005 [DOI] [PMC free article] [PubMed] [Google Scholar]
- 33.Wu Z, Li G, Meng Y, et al. 4D infant cortical surface atlas construction using spherical patch-based sparse representation. Med Image Comput Comput Assist Interv 2017;10433:57–65 10.1007/978-3-319-66182-7_7 [DOI] [PMC free article] [PubMed] [Google Scholar]
- 34.Ou X, Glasier CM, Ramakrishnaiah RH, et al. Gestational age at birth and brain white matter development in term-born infants and children. AJNR Am J Neuroradiol 2017;38:2373–79 10.3174/ajnr.A5408 [DOI] [PMC free article] [PubMed] [Google Scholar]
- 35.Lehtola SJ, Tuulari JJ, Karlsson L, et al. Associations of age and sex with brain volumes and asymmetry in 2-5-week-old infants. Brain Struct Funct 2019;224:501–13 10.1007/s00429-018-1787-x [DOI] [PMC free article] [PubMed] [Google Scholar]
- 36.Veldkamp SA, Zondervan-Zwijnenburg MA, van Bergen E, et al. Parental age in relation to offspring's neurodevelopment. J Clin Child Adolesc Psychol 20201–13 10.1080/15374416.2020.1756298 [DOI] [PubMed] [Google Scholar]
- 37.Westman E, Aguilar C, Muehlboeck JS, et al. Regional magnetic resonance imaging measures for multivariate analysis in Alzheimer’s disease and mild cognitive impairment. Brain Topogr 2013;26:9–23 10.1007/s10548-012-0246-x [DOI] [PMC free article] [PubMed] [Google Scholar]
- 38.Hodel AS. Rapid infant prefrontal cortex development and sensitivity to early environmental experience. Dev Rev 2018;48:113–44 10.1016/j.dr.2018.02.003 [DOI] [PMC free article] [PubMed] [Google Scholar]
- 39.Posner J, Cha J, Roy AK, et al. Alterations in amygdala–prefrontal circuits in infants exposed to prenatal maternal depression. Transl Psychiatry 2016;6:e935 10.1038/tp.2016.146 [DOI] [PMC free article] [PubMed] [Google Scholar]
- 40.Humphreys KL, Camacho MC, Roth MC, et al. Prenatal stress exposure and multimodal assessment of amygdala–medial prefrontal cortex connectivity in infants. Dev Cogn Neurosci 2020;46:100877 10.1016/j.dcn.2020.100877 [DOI] [PMC free article] [PubMed] [Google Scholar]
- 41.Torres-Espinola FJ, Berglund SK, García-Valdés LM, et al. ; PREOBE team. Maternal obesity, overweight and gestational diabetes affect the offspring neurodevelopment at 6 and 18 months of age: a follow up from the PREOBE cohort. PLoS One 2015;10:e0133010 10.1371/journal.pone.0133010 [DOI] [PMC free article] [PubMed] [Google Scholar]
- 42.Menting MD, van de Beek C, de Rooij SR, et al. The association between pre-pregnancy overweight/obesity and offspring's behavioral problems and executive functioning. Early Hum Dev 2018;122:32–41 10.1016/j.earlhumdev.2018.05.009 [DOI] [PubMed] [Google Scholar]
- 43.Mina TH, Lahti M, Drake AJ, et al. Prenatal exposure to maternal very severe obesity is associated with impaired neurodevelopment and executive functioning in children. Pediatr Res 2017;82:47–54 10.1038/pr.2017.43 [DOI] [PubMed] [Google Scholar]
- 44.Laurent JS, Watts R, Adise S, et al. Associations among body mass index, cortical thickness, and executive function in children. JAMA Pediatr 2020;174:170–77 10.1001/jamapediatrics.2019.4708 [DOI] [PMC free article] [PubMed] [Google Scholar]
- 45.Ronan L, Alexander-Bloch A, Fletcher PC. Childhood obesity, cortical structure, and executive function in healthy children. Cereb Cortex 2020;30:2519–28 10.1093/cercor/bhz257 [DOI] [PMC free article] [PubMed] [Google Scholar]
- 46.Batterink L, Yokum S, Stice E. Body mass correlates inversely with inhibitory control in response to food among adolescent girls: An fMRI study. Neuroimage 2010;52:1696–703 10.1016/j.neuroimage.2010.05.059 [DOI] [PMC free article] [PubMed] [Google Scholar]
- 47.Bruce AS, Holsen LM, Chambers RJ, et al. Obese children show hyperactivation to food pictures in brain networks linked to motivation, reward and cognitive control. Int J Obes (Lond) 2010;34:1494–500 10.1038/ijo.2010.84 [DOI] [PMC free article] [PubMed] [Google Scholar]
- 48.Bruce AS, Lepping RJ, Bruce JM, et al. Brain responses to food logos in obese and healthy weight children. J Pediatr 2013;162:759–764.e2 10.1016/j.jpeds.2012.10.003 [DOI] [PubMed] [Google Scholar]
- 49.Davids S, Lauffer H, Thoms K, et al. Increased dorsolateral prefrontal cortex activation in obese children during observation of food stimuli. Int J Obes (Lond) 2010;34:94–104 10.1038/ijo.2009.193 [DOI] [PubMed] [Google Scholar]
- 50.van Meer F, van der Laan LN, Eiben G, et al. ; I.Family Consortium. Development and body mass inversely affect children’s brain activation in dorsolateral prefrontal cortex during food choice. Neuroimage 2019;201:116016 10.1016/j.neuroimage.2019.116016 [DOI] [PubMed] [Google Scholar]