Abstract
Background
The differential diagnosis between uterine fibroid and adenomyosis is sometimes difficult; a precise diagnosis is required in women with infertility because of the different choice of treatments. Ultrasound elastography (UE) is a novel technique to evaluate the elasticity or the stiffness of the tissue of interest. The present study aims to compare UE shear wave velocity (SWV) among normal uterine myometrium, uterine fibroid, and adenomyosis, and assess the accuracy of shear wave elastography in the diagnosis of adenomyosis.
Materials and Methods
This cross-sectional study recruited 25 subjects for each group (control, adenomyosis, and fibroid) from April 2019 to April 2020. Transvaginal UE using an Aplio 500 (Toshiba Medical Systems, Japan) with ultrasound mapping for point of tissue biopsy was performed for all subjects. The diagnosis was confirmed by histology. Masson’s trichrome staining for collagen was performed and quantified
Results
The mean ± standard deviation (SD) for SWV was 3.44 ± 0.95 m/seconds (control group), 4.63 ± 1.45 m/seconds (adenomyosis group), and 4.53 ± 1.07 m/seconds (fibroid group). The mean SWV differed when comparing normal myometrium and adenomyosis after adjustments for age and endometrial pathology (P=0.019). The cut-off point of SWV at 3.465 m/seconds could differentiate adenomyosis from the normal uterus with an 80% sensitivity, 80% specificity, and an area under the curve (AUC) of 0.80 (95% confidence interval [CI]: 0.68-0.93) (P<0.001). No significant difference in SWV between the adenomyosis and fibroid groups was detected.
Conclusion
Shear wave elastography could be an alternative tool to distinguish between normal myometrium and adenomyosis; however, it could not differentiate adenomyosis from uterine fibroid or uterine fibroid from normal myometrium.
Keywords: Adenomyosis, Elasticity, Elasticity Imaging Techniques, Leiomyoma, Uterus
Introduction
Uterine fibroids and adenomyosis are common gynaecologic problems, with reported incidences of 20-70% and 5%-70%, respectively (1-3). Both diseases have unspecific and similar clinical symptoms, including abnormal uterine bleeding, cyclic and non-cyclic pelvic pain, dyspareunia, and infertility (4-8). Management for both diseases overlap and depend on clinical features, age, fertility desire, and preference of patients. Although differential diagnosis between these two diseases is sometimes difficult, the precise diagnosis is important, especially in women with infertility or incomplete childbearing because of the different choice of treatments. Ultrasonography (USG) is the most common investigation for distinguishing these two conditions; however, there is a wide range of accuracy for USG results (mostly attributed to technician experience), thus requiring an additional tool to overcome this problem (9, 10).
Ultrasound elastography (UE) is a novel technique to evaluate the elasticity or the stiffness of the tissue of interest. UE is now available in some sonogram machines. The UE measurement depends on the excitation methods (manual, acoustic radiation force impulse or external vibration) and the imaging technique (strain or shear wave imaging). In strain imaging, the stimuli trigger the longitudinal wave to move through the tissue, whereas in elastography or shear wave imaging, the stimuli cause shear wave propagations, which move up and down throughout the tissue (11).
Adenomyosis is typically diagnosed when ectopic glands and stroma are observed in the myometrial with surrounding hyperplasic and hypertrophic smooth muscle cells in a hyper-fasciculate trabecular pattern. The histology shows extensive fibrosis and increased microvascularisation. The progression of fibrosis in advanced adenomyosis has been demonstrated in a mouse study (12). The microscopic pathology of uterine fibroid shows the hypertrophy and hyperplasia of the smooth muscle cells with a prominent nucleus surrounded by an abnormal increase in the fibrous extracellular matrix. These changes in the tissue ultrastructure might modify the stifness of the myometrium, which may be detected by UE. The tissue elasticity of normal myometrium, adenomyosis, and fibroids are assumed to be different.
The few previous studies on uterine pathologic elastography reported inconsistent results (13-16). Several limitations from these studies included the use of strain elastography (SE), which required uncontrolled external force from the user; lack of tissue pathology; and limited sample size. The present study aims to compare the ultrasound elastographic shear wave velocity (SWV) among normal uterine myometrium, uterine fibroids, and adenomyosis confirmed diagnoses with histology.
Materials and Methods
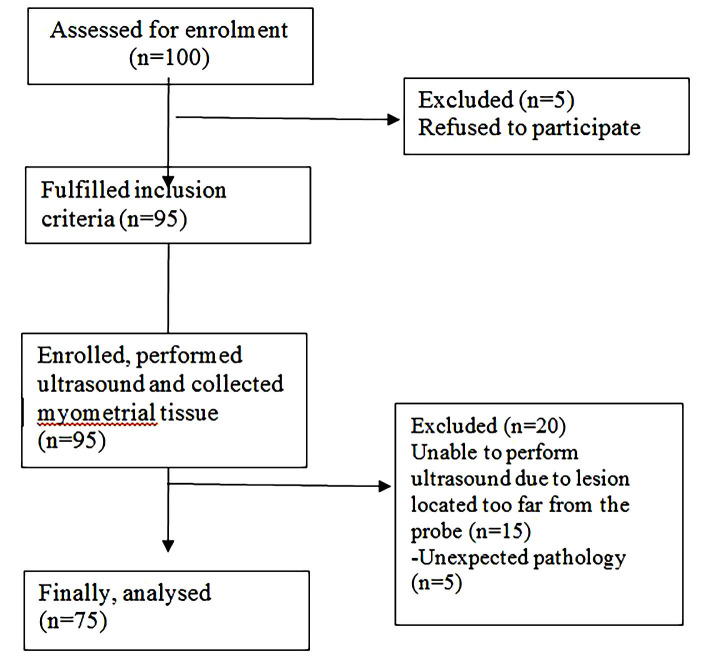
The present cross-sectional study was approved by the Ethical Clearance Committee on Human Rights Related to Research Involving Human Subjects, Faculty of Medicine, Ramathibodi Hospital, Bangkok, Thailand (MURA 2019/195). The study was conducted at the Department of Obstetrics and Gynaecology, Ramathibodi Hospital Faculty of Medicine, Mahidol University in Bangkok, Thailand. All patients with benign gynaecologic diseases who were candidates for abdominal, vaginal, laparoscopic hysterectomy or conservative surgery from April 2019 to April 2020 were assessed for enrolment (Fig .1). Finally, 75 patients were recruited for study participation and they provided informed consent. The patients were recruited into one of three groups: normal myometrium, adenomyosis, or fibroid. The participants of these three groups were not matched. The inclusion criteria were women (20-70 years old); uterus length 16 cm or less; a lesion in the myometrium with a diameter of 1 cm or more; and willingness to co-operate for transvaginal ultrasonography (TVS). The participants were excluded if there was a suspected myometrial cyst; degeneration of fibroids or calcified fibroids; gynaecologic cancer; or refusal to provide consent. Pelvic examination and TVS were performed for all participants one day before surgery. The following ultrasonographic features were criteria for suspicion of adenomyosis: globular uterine configuration, heterogeneous myometrial echotexture, myometrial anterior-posterior asymmetry, poor definition of the junctional zone, and subendometrial cysts (17, 18). Adenomyosis is suspected to be present in the uterus when there are three or more ultrasonographic features. Focal adenomyosis is defined when normal myometrium surrounds the adenomyosis lesion by more than 25% (4, 19). Uterine fibroid ultrasonographic features are defined as well-defined hypoechoic masses (normal myometrium surrounds the uterine fibroid lesion by more than 75%) with possible calcifications and acoustic shadowing (20). During the TVS procedure, SWV was measured at the point of interest (POI) (Fig .2). TVS and SWV were performed by one trained gynaecologist (S.P.). After the surgery, tissue at the POI that was approximately 0.5×0.5×0.5 cm was collected and kept in 10% formaldehyde. The biopsied tissue was sent for haematoxylin and eosin (H&E) and Masson’s trichrome staining, while the remaining operative tissue was sent for routine histopathological diagnosis. Both tissues were verified and definitely diagnosed by clinical pathologists (T.C.). Participants whose biopsied tissue results were negative for adenomyosis or myoma were excluded from the study. Biopsied tissue stained with Masson’s trichrome was evaluated for the ratio and area of collagen or fibrous tissue compared to overall tissue area with ImageJ software. The data (age, menstrual phase [identified by histology], parity, uterine volume, pre-operative diagnosis, indication for surgery, type of surgery, and type of adenomyosis [focal or diffused]) were collected and analysed.
Fig.1.
Study flow chart.
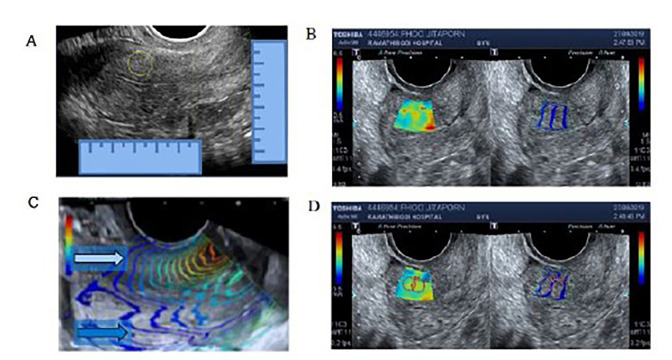
Fig.2.
Method used to locate and measure shear wave velocity (SWV). A. Locating the point of interest (POI) by bright mode transvaginal ultrasonography (TVS) at the sagittal view of the uterus. B. Left side: elastography mapping. Right side: shear wave propagation mapping. C. The white arrow points to the propagation waves which are parallel and considered suitable for SWV measurement. The blue arrow points to the propagation waves, which are chaotic and not suitable for shear wave speed measurement. D. The cursors are placed at the POI.
Sample size
We converted the elastographic shear wave medians and 95% interquartile ranges (IQRs) of: 72.7 (22.6-274.2, adenomyosis), 28.3 (12.7-59.5, fibroid), and 24.4 (17.9-32.4, normal uterus), which were reported by Acar (14), into the following mean ± standard deviation (SD): 110.6 ± 72 (adenomyosis), 32.2 ± 13.5 (fibroid), and 24.8 ± 4.2 (normal uterus). These values were subsequently used to calculate the sample size by formulation testing of two independent means.
The sample size was 19 subjects per group. The sample size with 20% sample loss was at least 23 subjects per group. The final sample size was 25 subjects per group.
Shear wave velocity measurement
The TVS shear wave was measured by ultrasound (Aplio 500, Toshiba Medical Systems, Tochigi, Japan). A transvaginal curve arrayed probe with an operative frequency range of 3.0-11.0 MHz was placed adjacent to the uterus in the true sagittal plane. The POI was located by measuring from the upper border, serosal border, inner endometrial border, and junction between the uterine corpus and cervix (Fig .2A). The region of interest was placed over the measuring point; then, the SWV was created as a single shot elastography map (Fig .2B, left) and shear wave propagation map (Fig .2B, right). In order to obtain an accurate SWV measurement, the propagate wave lines must be parallel and usually no more than 3 cm from the tip of the transvaginal probe (Fig .2B, C). The POI was measured using a circular cursor, which was adjusted to the smallest possible size, while still covering the parallel wave line (Fig .2D). The wave speeds were measured at the same point for at least ten values per patient before calculating the mean velocity. While the diffuse type adenomyosis was measured in the same way as the normal uterus, the mass was mapped by bright mode ultrasound and then measured for SWV at the centre of the focal adenomyosis or fibroids. If the location of the mass was determined to be questionable during surgery, then the case was excluded from the study.
Tissue biopsy
The uterus was removed from the patient and subsequently cut at the midsagittal plane. Then, the POI was identified using the previous measurement by USG. We used a scalpel to remove a 0.5×0.5×0.5 cm section of the tissue for biopsy. This specimen was sent with the remainder of the tissue for processing.
Fibrous area measurement
The tissue slides stained with Masson’s trichome were examined and ten fields per glass slide were photographed under X40 light microscopy. The pictures were analysed using ImageJ software to detect the presence of blue staining, which represents fibrotic/collagen tissue. The fibrous area ratio was estimated as the measured fibrous area divided by the total area for ten whole tissue areas.
Statistical analysis
Statistical analyses were performed using IBM SPSS for Windows version 18 (IBM Corp., Armonk, NY, USA). The Kolmogorov-Smirnov test was used to determine the distribution of the data. For baseline characteristics, the results are written as mean ± SD for continuous normally distributed data, median (25th-75th percentile) for continuous non-normally distributed data, and number (%) of patients in each group for categorical data. The SWV and continuous normally distributed data were compared using one-way analysis of variance (ANOVA) and multiple comparisons. The continuous non-normally distributed data and uterine volume were compared using Kruskal-Wallis and pairwise comparison. Fisher’s exact test was used for categorical data wherever small, expected cell counts (less than 5) were present for more than 20% of the cells (e.g, endometrial pathology, menopausal status, parity, type of surgery). For any independent factors with a significant difference among the three groups, the dependent outcomes were adjusted for these factors by univariate analysis. The relationship between SWV and the area of fibrous tissue was analysed by Pearson’s correlation. The receiver operating characteristic (ROC) curve and area under the curve (AUC) were analysed. The cut-off point value for differentiation between the three groups was defined using ROC with sensitivity and specificity. The SWVs between pre- and post-menopausal women and continuous normally distributed data were compared using the student’s t test. The level of statistical significance was set as P<0.05.
Results
There were significant differences between age, uterine volume, endometrial phase/pathology, and menopausal status among the control, adenomyosis, and uterine fibroid groups (Table 1). Multiple comparisons showed that the mean age of subjects with normal myometrium was 62.5 years, which was significantly higher than the adenomyosis (48.1 years) and fibroid (46.9 years) groups (P<0.001). The majority of the endometrial pathology in the control group was inactive endometrium (84%), while this proportion was 40% in the fibroid group. The mean uterine volume was significantly larger in the adenomyosis and fibroid groups when compared to the normal myometrium group.
Table 1.
Demographic data
|
| ||||||
|---|---|---|---|---|---|---|
| Variables | Control (n=25) | Adenomyosis (n=25) | Fibroid (n=25) | P value (three-groupcomparison) | P value (betweengroups) | |
|
| ||||||
| Age (Y) | 62.5 ± 15.5 | 48.1 ± 27.9 | 46.9 ± 16.1 | <0.001 | <0.001*,** | |
| Endometrial pathology | 0.001*,** | |||||
| Proliferative | 3(12) | 16(64) | 7(28) | 0.001 | ||
| Secretory | 1(4) | 2(8) | 4(16) | |||
| Inactive | 21(84) | 6(24) | 10940 | 2(8) | ||
| Progestin effect | 0(0) | 1(4) | ||||
| Unknown | 0(0) | 0(0) | 2(8) | |||
| Menopausal status | <0.001*,** | |||||
| Premenopausal | 4(16) | 20(80) | 19(76) | <0.001 | ||
| Postmenopausal | 21(84) | 5(20) | 6(24) | |||
| Parity | ||||||
| Null | 5(20) | 7(28) | 9(36) | 0.452 | ||
| Parous | 20(80) | 18(72) | 16(64 | |||
| Type of surgery | ||||||
| Hysterectomy | 25(100) | 25(100) | 23(92) | <0.001 | <0.001*,** | |
| Excision | 0(0) | 0(0) | 2(8) | |||
| Uterine volume, cm3 | 45.4 ± 48.2 | 219.5 ± 201.1 | 232.2 ± 187.3 | <0.001 | 0.001* <0.001** | |
| Type of adenomyosis | N/A | |||||
| Diffuse | N/A | 22(88) | N/A | |||
| Focal | 3(12) | |||||
|
| ||||||
Data are presented as mean ± SD. SD; Standard deviation, NA; Not available, *; Control vs. adenomyosis, **; Control vs. fibroid, and ***; Adenomyosis vs. fibroid.
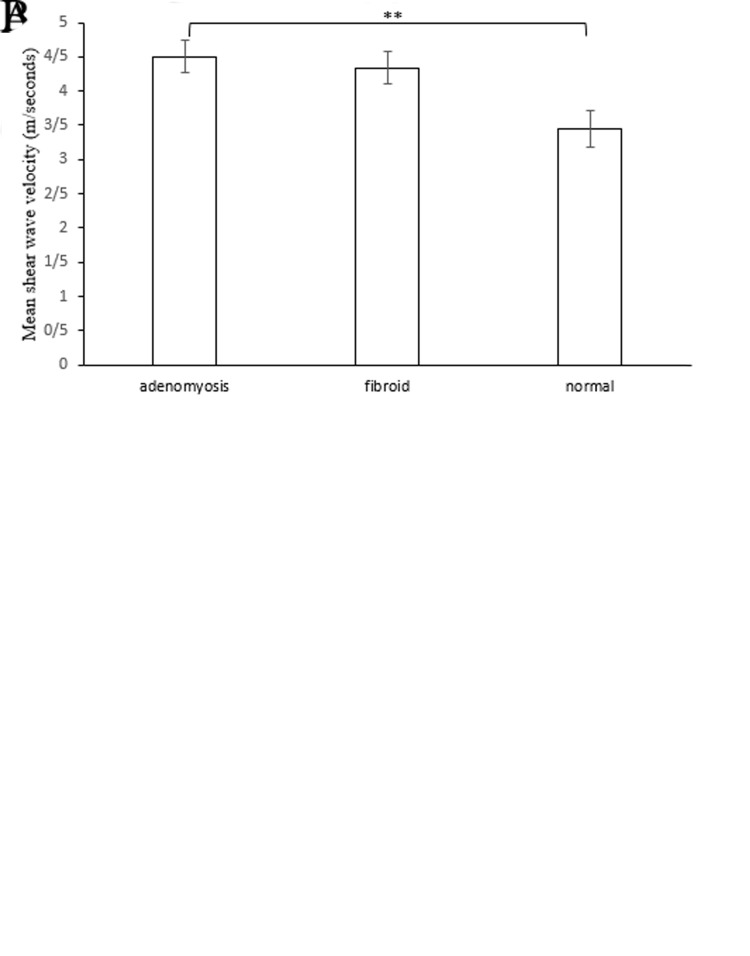
The SWV values were 3.44 ± 0.95 m/seconds (control group), 4.63 ± 1.45 m/seconds (adenomyosis group), and 4.53 ± 1.07 m/seconds (fibroid group). Participants in the adenomyosis and fibroid groups had significantly higher mean SWV than those with normal myometrium (P<0.001, Fig .3A). However, the mean SWV was not significantly different between the adenomyosis and fibroid groups. Only the mean SWV was significantly different when comparing the normal myometrium and adenomyosis, which was adjusted for age and endometrial pathology (P=0.019, Fig .3B).
Fig.3.
Mean shear wave velocity (SWV) of all patients. A. Mean SWV of the adenomyosis, fibroid and normal control groups. B. Mean SWV of the three groups adjusted by age and endometrial histology. * ; P<0.001 and **; P=0.019.
The mean SWV between pre- and post-menopausal participants was also compared. No difference in SWV was detected when comparing these two groups of patients (P=0.390). There was no difference in mean SWV between pre- and post-menopausal participants in the adenomyosis (P=0.061) and fibroid (P=0.843) groups (Table S1, See Supplementary Online Information at www.ijfs.ir). The relationship between mean SWV and uterine volume in each group was also analysed, but no correlation was found (data not shown). Subgroup analysis was performed by comparing the mean SWV between focal (n=3) and diffuse adenomyosis (n=22). The mean SWV values were 5.59 ± 1.84 m/seconds (focal adenomyosis) and 4.47 ± 1.38 m/seconds (diffuse adenomyosis) (P=0.211). There was no correlation between the fibroid maximum diameter and SWV (data not shown).
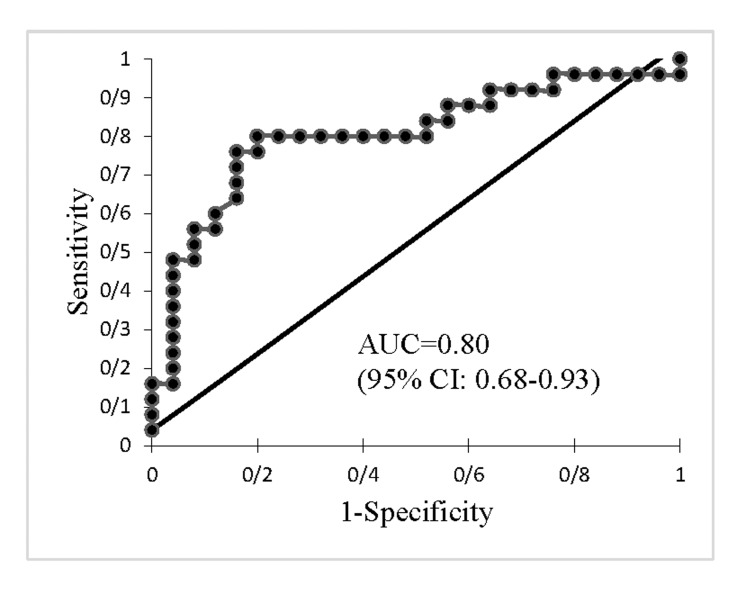
ROC was analysed to distinguish adenomyosis from normal uterus (Fig .4). The cut-off SWV value of 3.465 m/ seconds could differentiate adenomyosis from a normal uterus with 80% sensitivity and 80% specificity, at an AUC of 0.80 (95% confidence interval [CI]: 0.68-0.93) (P<0.001).
Fig.4.
ROC curve of SWV of adenomyosis and normal uteri. ROC; Receiver operating characteristic, SWV; Shear wave velocity, AUC; Area under the curve, and CI; Confidence interval.
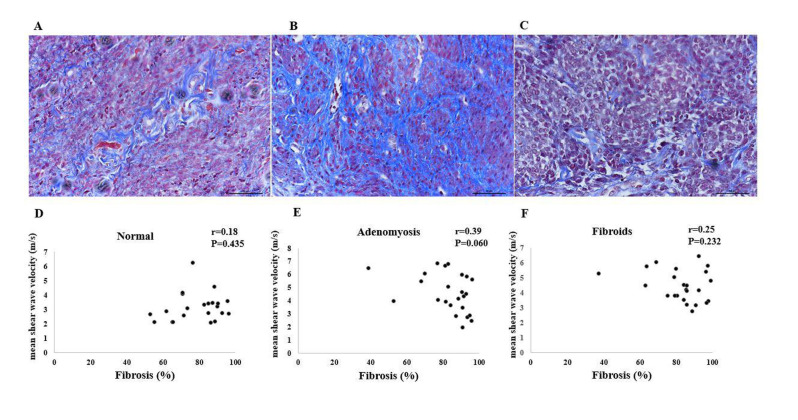
The analyses showed no correlation between the extension of fibrosis from Masson’s trichrome staining and mean SWV, regardless of whether we evaluated the whole group or individual groups (Fig .5). The means for fibrosis were 78.66 ± 13.01% (control group), 82.92 ± 13.95% (adenomyosis group), and 82.85 ± 14.04% (fibroid group). The mean difference was not statistically significant when comparing the three groups (P=0.492, data not shown).
Fig.5.
Masson’s trichrome staining and correlation between shear wave velocity (SWV) and fibrosis. A, D. Normal myometrium, B, E. Adenomyosis, C, and F. Fibroid.
Discussion
The present study demonstrates that the mean SWV for adenomyosis was significantly higher than normal myometrium, which resulted in improved differentiation of adenomyosis from normal myometrium. There was no significant mean SWV difference when comparing the fibroid and normal myometrium. Shear wave elastography could not differentiate adenomyosis/adenomyoma from uterine fibroids. Additionally, no significant correlation between myometrium stiffness (identified by SWV) and fibrosis (identified by collagen special histological staining) was detected.
Adenomyosis could be differentially diagnosed from normal myometrium by shear wave elastography with a high sensitivity and specificity. However, adenomyosis could not be differentiated from the fibroid group with this elastography. The stiffness of adenomyosis measured by SWV was higher than normal myometrium, but not significantly different when comparing the adenomyosis and fibroid groups. Interestingly, our results were consistent with the only two published studies that focused on shear wave elastography (14, 16). One previous study (14) used histopathology as a final diagnosis, which was similar to our study, while the other study (16) used magnetic resonance imaging (MRI) for the diagnosis of adenomyosis.
The accuracy of conventional TVS for the diagnosis of adenomyosis depends on operator experience and USG image characteristics of the myometrium. Data from the literature show a wide range of USG sensitivity and specificity for the diagnosis of adenomyosis, which ranges from 80% to 90% and 60% to 80%, respectively (10). Image characteristics, such as myometrial echoic heterogeneity, provide high sensitivity (80.8%) but moderate specificity (61.4%), while sub-endometrial echogenic linear striations show very high specificity (95.5%) and unacceptable low sensitivity (30.8%). In addition, globular shape and disproportionate uterine wall provide only moderate sensitivity and specificity (70%) (21). However, few women who present with early-stage adenomyosis have typical USG characteristics for adenomyosis. In these cases, conventional USG could show a normal uterine appearance or only a slightly enlarged uterus. Data from the present study show that shear wave elastography could be useful for diagnosis in this situation, with up to 80% sensitivity and specificity. However, future work should investigate whether there are correlations between the early diagnosis of adenomyosis as well as stiffness assessment of adenomyosis and clinical outcomes (e.g., preterm labour pain, abortion).
Different types of USG elastography demonstrated different results for the diagnosis of a pathological uterus (e.g., adenomyosis and uterine fibroid). The most frequent elastography technique reported in the literature was strain elastography (SE) (13, 15, 22, 23). However, it is difficult to compare between studies because both qualitative (22, 23) and quantitative (13, 15) measurements were used to evaluate the outcome. Until now, no standardized measurement for these techniques has been defined. However, the results from most of these studies concluded that SE could differentiate adenomyosis from fibroid and normal myometrium, which were not in line with studies on shear wave elastography, including our study. One bias could possibly occur during the examination, when applying pressure on the SE probe, which depends on the amount of pressure applied by the sonographer to the area being examined. Theoretically, shear wave elastography would provide more precise outcomes than SE because it records the propagation of shear waves after stimulation without the need for application of pressure on the probe.
In the present study, we did not detect any significant correlation between stiffness verified by SWV and fibrosis identified by collagen histological staining of both adenomyosis and fibroid tissues. There are multiple hypotheses that could explain this finding. First, different locations of measurement have different SWV values. The older adenomyosis lesions close to the endometrium-myometrial junction (EMJ) or uterine serosa might have more advanced fibrosis than newer lesions at the mid-uterine wall. Adenomyosis is reported to originate from the inside (endometrial invasion from EMJ) or from the outside (invasion of seeding peritoneal endometriosis from the uterine serosa) (24). The results of previous studies indicate that substantial fibrosis in fibroids increases with larger fibroid mass (25), while the ability of the shear wave elastography probe was limited depending on the distance from the tip of the probe. Second, there were heterogeneities of cellular and fibrotic components in each fibroid mass (26). Biopsy tissue at the centre of the mass might not represent the entire amount of fibrosis in the uterus. Third, the stiffness of the myometrium of adenomyosis might not be explained only by the collagen staining area but also by hyperplasia and hypertrophy of the myometrium that surrounds the endometrial gland. Fourth, the type of elastography might influence the results. A study on SE demonstrated a correlation between SE lesion stiffness and extension of fibrosis in adenomyosis, fibroid, and benign pathologic uterus groups (15), while no correlation between fibroid stiffness and fibrotic extension was evaluated by directed tissue shear modulus rheometry (26).
The limitations of the present study included the limited distance for measurement of transvaginal elastography because the acoustic stimuli could pass through the tissue only by about 3 cm from the ultrasound probe. Therefore, the pathologic lesion had to be located at the middle to the lower part of the uterus or at the superficial part in case of a large lesion. Participants in the control group were older and more frequently post-menopausal. However, the data of our study show no mean shear wave difference when comparing pre- and post-menopause subgroups in each group.
The strengths of this research included the use of shear wave elastography with acoustic radiofrequency impulse and the stimulation method, which minimized inter- and intra-observer bias. While most previous experiments have used SE, this is associated with an increased probe pressure that might lead to an overestimation of the results. The shear wave propagation mapping on shear wave elastography with parallel waveform and the ultrasound mapping for point of tissue biopsy improved assessment at the measuring point. However, a future study should be considered to compare SE and shear wave elastography on benign myometrial diseases. No previous studies have noted an effort to collect tissue as close as possible to the POI on the USG. Furthermore, this study provides a larger number of samples with histopathological confirmation, while most published studies have used MRI for the diagnosis of normal and pathologic uterus.
Conclusion
Shear wave elastography can be used as an alternative diagnostic tool to distinguish between normal myometrium and uterine fibroid located at the middle to lower part of the uterus by measuring SWV. This UE technique could not differentiate adenomyosis from uterine fibroid.
Supplementary PDF
Acknowledgements
The authors thank Ms. Umaporn Udomsubpayakul for statistical assistance and Ms. Sermsum Wattakawikran at the Institute of Pathology Department of Medical Services, Ministry of Public Health for histopathology technical assistance. This study was supported by the Faculty of Medicine, Ramathibodi Hospital, Mahidol University. The authors declare that they have no conflicts of interest.
Authors’ Contributions
S.P., A.S.; Contributed to study conception and design. S.P., P.P.; Performed ultrasound elastography and data collection. T.C.; Interpreted the pathology results and contributed to data interpretation. W.W., M.S.; Performed technical analyses. S.P., P.W., A.S.; Contributed to data analysis, interpretation and writing the manuscript. All authors have read and approved the final manuscript.
References
- 1.Yu O, Scholes D, Schulze-Rath R, Grafton J, Hansen K, Reed SD. A US population-based study of uterine fibroid diagnosis incidence, trends, and prevalence: 2005 through 2014. Am J Obstet Gynecol. 2018;219(6):591–591. doi: 10.1016/j.ajog.2018.09.039. e1-e8. [DOI] [PubMed] [Google Scholar]
- 2.Stewart EA, Cookson CL, Gandolfo RA, Schulze-Rath R. Epidemiology of uterine fibroids: a systematic review. BJOG. 2017;124(10):1501–1512. doi: 10.1111/1471-0528.14640. [DOI] [PubMed] [Google Scholar]
- 3.Yu O, Schulze-Rath R, Grafton J, Hansen K, Scholes D, Reed SD. Adenomyosis incidence, prevalence and treatment: United States population-based study 2006-2015. Am J Obstet Gynecol. 2020;223(1):94–94. doi: 10.1016/j.ajog.2020.01.016. e1-e10. [DOI] [PubMed] [Google Scholar]
- 4.Chapron C, Vannuccini S, Santulli P, Abrao MS, Carmona F, Fraser IS, et al. Diagnosing adenomyosis: an integrated clinical and imaging approach. Hum Reprod Update. 2020;26(3):392–411. doi: 10.1093/humupd/dmz049. [DOI] [PubMed] [Google Scholar]
- 5.Vannuccini S, Petraglia F. Recent advances in understanding and managing adenomyosis. F1000Res. 2019;8 doi: 10.12688/f1000research.17242.1. F1000 Faculty Rev-283. [DOI] [PMC free article] [PubMed] [Google Scholar]
- 6.Dessouky R, Gamil SA, Nada MG, Mousa R, Libda Y. Management of uterine adenomyosis: current trends and uterine artery embolization as a potential alternative to hysterectomy. Insights Imaging. 2019;10(1):48–48. doi: 10.1186/s13244-019-0732-8. [DOI] [PMC free article] [PubMed] [Google Scholar]
- 7.El-Balat A, DeWilde RL, Schmeil I, Tahmasbi-Rad M, Bogdanyova S, Fathi A, et al. Modern myoma treatment in the last 20 years: a review of the literature. Biomed Res Int. 2018;2018:4593875–4593875. doi: 10.1155/2018/4593875. [DOI] [PMC free article] [PubMed] [Google Scholar]
- 8.Sohn GS, Cho S, Kim YM, Cho CH, Kim MR, Lee SR, et al. Current medical treatment of uterine fibroids. Obstet Gynecol Sci. 2018;61(2):192–201. doi: 10.5468/ogs.2018.61.2.192. [DOI] [PMC free article] [PubMed] [Google Scholar]
- 9.Sam M, Raubenheimer M, Manolea F, Aguilar H, Mathew RP, Patel VH, et al. Accuracy of findings in the diagnosis of uterine adenomyosis on ultrasound. Abdom Radiol (NY) 2020;45(3):842–850. doi: 10.1007/s00261-019-02231-9. [DOI] [PubMed] [Google Scholar]
- 10.Andres MP, Borrelli GM, Ribeiro J, Baracat EC, Abrão MS, Kho RM. Transvaginal ultrasound for the diagnosis of adenomyosis: systematic review and meta-analysis. J Minim Invasive Gynecol. 2018;25(2):257–264. doi: 10.1016/j.jmig.2017.08.653. [DOI] [PubMed] [Google Scholar]
- 11.Sigrist RMS, Liau J, Kaffas AE, Chammas MC, Willmann JK. Ultrasound elastography: review of techniques and clinical applications. Theranostics. 2017;7(5):1303–1329. doi: 10.7150/thno.18650. [DOI] [PMC free article] [PubMed] [Google Scholar]
- 12.Shen M, Liu X, Zhang H, Guo SW. Transforming growth factor β1 signaling coincides with epithelial-mesenchymal transition and fibroblast-to-myofibroblast transdifferentiation in the development of adenomyosis in mice. Hum Reprod. 2016;31(2):355–369. doi: 10.1093/humrep/dev314. [DOI] [PubMed] [Google Scholar]
- 13.Frank ML, Schafer SD, Mollers M, Falkenberg MK, Braun J, Mollmann U, et al. Importance of transvaginal elastography in the diagnosis of uterine fibroids and adenomyosis. Ultraschall Med. 2016;37(4):373–378. doi: 10.1055/s-0035-1553266. [DOI] [PubMed] [Google Scholar]
- 14.Acar S, Millar E, Mitkova M, Mitkov V. Value of ultrasound shear wave elastography in the diagnosis of adenomyosis. Ultrasound. 2016;24(4):205–213. doi: 10.1177/1742271X16673677. [DOI] [PMC free article] [PubMed] [Google Scholar]
- 15.Liu X, Ding D, Ren Y, Guo SW. Transvaginal elastosonography as an imaging technique for diagnosing adenomyosis. Reprod Sci. 2018;25(4):498–514. doi: 10.1177/1933719117750752. [DOI] [PubMed] [Google Scholar]
- 16.Zhang M, Wasnik AP, Masch WR, Rubin JM, Carlos RC, Quint EH, et al. Transvaginal Ultrasound shear wave elastography for the evaluation of benign uterine pathologies: a prospective pilot study. J Ultrasound Med. 2019;38(1):149–155. doi: 10.1002/jum.14676. [DOI] [PubMed] [Google Scholar]
- 17.Van den Bosch T, Van Schoubroeck D. Ultrasound diagnosis of endometriosis and adenomyosis: state of the art. Best Pract Res Clin Obstet Gynaecol. 2018;51:16–24. doi: 10.1016/j.bpobgyn.2018.01.013. [DOI] [PubMed] [Google Scholar]
- 18.Kepkep K, Tuncay YA, Goynumer G, Tutal E. Transvaginal sonography in the diagnosis of adenomyosis: which findings are most accurate? Ultrasound Obstet Gynecol. 2007;30(3):341–345. doi: 10.1002/uog.3985. [DOI] [PubMed] [Google Scholar]
- 19.Van den Bosch T, de Bruijn AM, de Leeuw RA, Dueholm M, Exacoustos C, Valentin L, et al. Sonographic classification and reporting system for diagnosing adenomyosis. Ultrasound Obstet Gynecol. 2019;53(5):576–582. doi: 10.1002/uog.19096. [DOI] [PubMed] [Google Scholar]
- 20.Sun S, Bonaffini PA, Nougaret S, Fournier L, Dohan A, Chong J, et al. How to differentiate uterine leiomyosarcoma from leiomyoma with imaging. Diagn Interv Imaging. 2019;100(10):619–634. doi: 10.1016/j.diii.2019.07.007. [DOI] [PubMed] [Google Scholar]
- 21.da Silva JR, Andres MP, Leite APK, Gomes MTNA, Neto JS, Baracat EC, et al. Comparison of sensitivity and specificity of structured and narrative reports of transvaginal ultrasonogaphy for adenomyosis. J Minim Invasive Gynecol. 2021;28(6):1216–1224. doi: 10.1016/j.jmig.2020.11.001. [DOI] [PubMed] [Google Scholar]
- 22.Stoelinga B, Hehenkamp WJK, Brolmann HAM, Huirne JAF. Realtime elastography for assessment of uterine disorders. Ultrasound Obstet Gynecol. 2014;43(2):218–226. doi: 10.1002/uog.12519. [DOI] [PubMed] [Google Scholar]
- 23.Tessarolo M, Bonino L, Camanni M, Deltetto F. Elastosonography: a possible new tool for diagnosis of adenomyosis? Eur Radiol. 2011;21(7):1546–1552. doi: 10.1007/s00330-011-2064-z. [DOI] [PubMed] [Google Scholar]
- 24.Khan KN, Fujishita A, Koshiba A, Kuroboshi H, Mori T, Ogi H, et al. Biological differences between intrinsic and extrinsic adenomyosis with coexisting deep infiltrating endometriosis. Reprod Biomed Online. 2019;39(2):343–353. doi: 10.1016/j.rbmo.2019.03.210. [DOI] [PubMed] [Google Scholar]
- 25.Leppert PC, Jayes FL, Segars JH. The extracellular matrix contributes to mechanotransduction in uterine fibroids. Obstet Gynecol Int. 2014;2014:783289–783289. doi: 10.1155/2014/783289. [DOI] [PMC free article] [PubMed] [Google Scholar]
- 26.Jayes FL, Liu B, Feng L, Aviles-Espinoza N, Leikin S, Leppert PC. Evidence of biomechanical and collagen heterogeneity in uterine fibroids. PLoS One. 2019;14(4):e0215646–e0215646. doi: 10.1371/journal.pone.0215646. [DOI] [PMC free article] [PubMed] [Google Scholar]
Associated Data
This section collects any data citations, data availability statements, or supplementary materials included in this article.


