Abstract
Leukocyte immunoglobulin-like receptor B (LILRB), a family of immune checkpoint receptors, contribute to acute myeloid leukemia (AML) development, but the specific mechanisms triggered by activation or inhibition of these immune checkpoints in cancer is largely unknown. Here we demonstrated that the intracellular domain of LILRB3 is constitutively associated with the adaptor protein TRAF2. Activated LILRB3 in AML cells leads to recruitment of cFLIP and subsequent NF-κB upregulation, resulting in enhanced leukemic cell survival and inhibition of T cell-mediated anti-tumor activity. Hyperactivation of NF-κB induces a negative regulatory feedback loop mediated by A20, which disrupts the interaction of LILRB3 and TRAF2; consequently the SHP-1/2-mediated inhibitory activity of LILRB3 becomes dominant. Finally, we show that blockade of LILRB3 signaling with antagonizing antibodies hampers AML progression. LILRB3 thus exerts context-dependent activating and inhibitory functions, and targeting LILRB3 may become a potential therapeutic strategy for AML treatment.
Keywords: AML, LILRB3, TRAF2, cFLIP, ITIM, NF-κB signaling
Introduction
Immune checkpoint blockade therapies effectively treat some types of cancers. However, for most cancer patients immune evasion and resistance lead to a failure to respond to these therapies or relapse after treatment1–3. For leukemia patients, low mutational burdens and low levels of IFN-γ result in a weaker response to immune checkpoint blockade4. In particular, CTLA4 and PD-1/PD-L1 targeting monotherapies have been ineffective for treating patients with acute myeloid leukemia (AML)4. Several new immunotherapeutics have recently been approved. These include liposome-encapsulated chemodrugs, anti-CD33-drug conjugates, and inhibitors of BCL-2, IDH1, IDH2, Flt3, and hedgehog. Some of these therapeutics have significant toxicities. Further, these therapeutics are efficacious only in subpopulations of AML patients and often result in relapse5. It is critical that the molecular mechanisms of AML development and immunosuppression are identified in order to guide development of more effective treatments.
The LILRBs with intracellular immunoreceptor tyrosine-based inhibitory motifs (ITIMs) can recruit tyrosine phosphatases SHP1, SHP2, and/or the inositol-phosphatase SHIP6–13. Because of the negative roles of phosphatases in immune activation, LILRBs are considered to be immune checkpoint factors14. Numerous groups have contributed to the current understanding of the functions of LILRBs6–13. We have studied how signaling mediated by LILRBs influences cancer development. We showed that LILRB2 is a receptor for the hormone Angptl2 and that several LILRBs and a related ITIM-receptor LAIR1 support AML development15–23. Recently, we and others have demonstrated that blocking signaling mediated by LILRB1, LILRB2, or LILRB4 in human myeloid or natural killer cells promotes their pro-inflammatory activity and enhances anti-tumor responses18,19,21,24,25.
LILRB3 is a member of LILRB family that is restrictively expressed on myeloid cells, including monocytes, neutrophils, eosinophils, and basophils (as well as on in vitro differentiated mast cells and osteoclasts)12,26. LILRB3 contains four cytoplasmic ITIM motifs that may contribute to negative regulation of immune response27. Ligation of LILRB3 in human myeloid cells led to inhibition of immune activation28,29. LILRB3 may be an inhibitor of allergic inflammation and autoimmunity30. However, the ligand for LILRB3 has not been identified31, and the downstream signaling of LILRB3 is unclear. It is noteworthy that LILRBs, including LILRB3, are primate specific. The expression pattern and ligand of PirB, the mouse relative of LILRB3, differ from those of LILRB310. PirB is more broadly expressed than LILRB310.
LILRB3 is also expressed on some myeloid leukemia, B lymphoid leukemia, and myeloma cells12,32. It is reportedly co-expressed with stem cell marker CD34 and with myeloma marker CD13832. In this study, we found LILRB3 expression on monocytic AML cells enhanced the survival of these leukemia cells in the presence or absence of cytotoxic T lymphocytes (CTLs) by recruiting TRAF2 and cFLIP to stimulate NF-κB activity. We also showed that blockade of LILRB3 signaling with antagonizing antibodies increased leukemia cell death and the cytotoxic effects of CTLs.
Results
LILRB3 supports AML by enhancing leukemia cell survival
Our analysis indicated that expression of LILRB3 is negatively correlated with the overall survival of AML patients (Fig. 1a). Further, our results showed that LILRB3 is highly expressed on monocytic AML cells (FAB M4 and M5 AML subtypes; Fig. 1b). Analysis of 35 AML patient samples indicates that LILRB3 is co-expressed with LILRB4, a monocytic AML cell marker18, on AML cells (Extended Data Fig. 1a). This suggests that LILRB3 is mainly expressed on monocytic AML cells. Several AML cell lines, including THP-1, Molm13, and MV4, had cell-surface expression of LILRB3 (Fig. 1c). LILRB3 signaling was activated in AML cells by treatment with immobilized anti-LILRB3 antibody that leads to receptor clustering. The percentage of cell death was significantly lower for these AML cells treated with immobilized anti-LILRB3 antibody than in AML cells treated with a control IgG either in the presence or absence of AML drugs (Fig. 1d, Extended Data Fig. 1b).
Fig. 1 |. LILRB3 promotes monocytic AML progression.
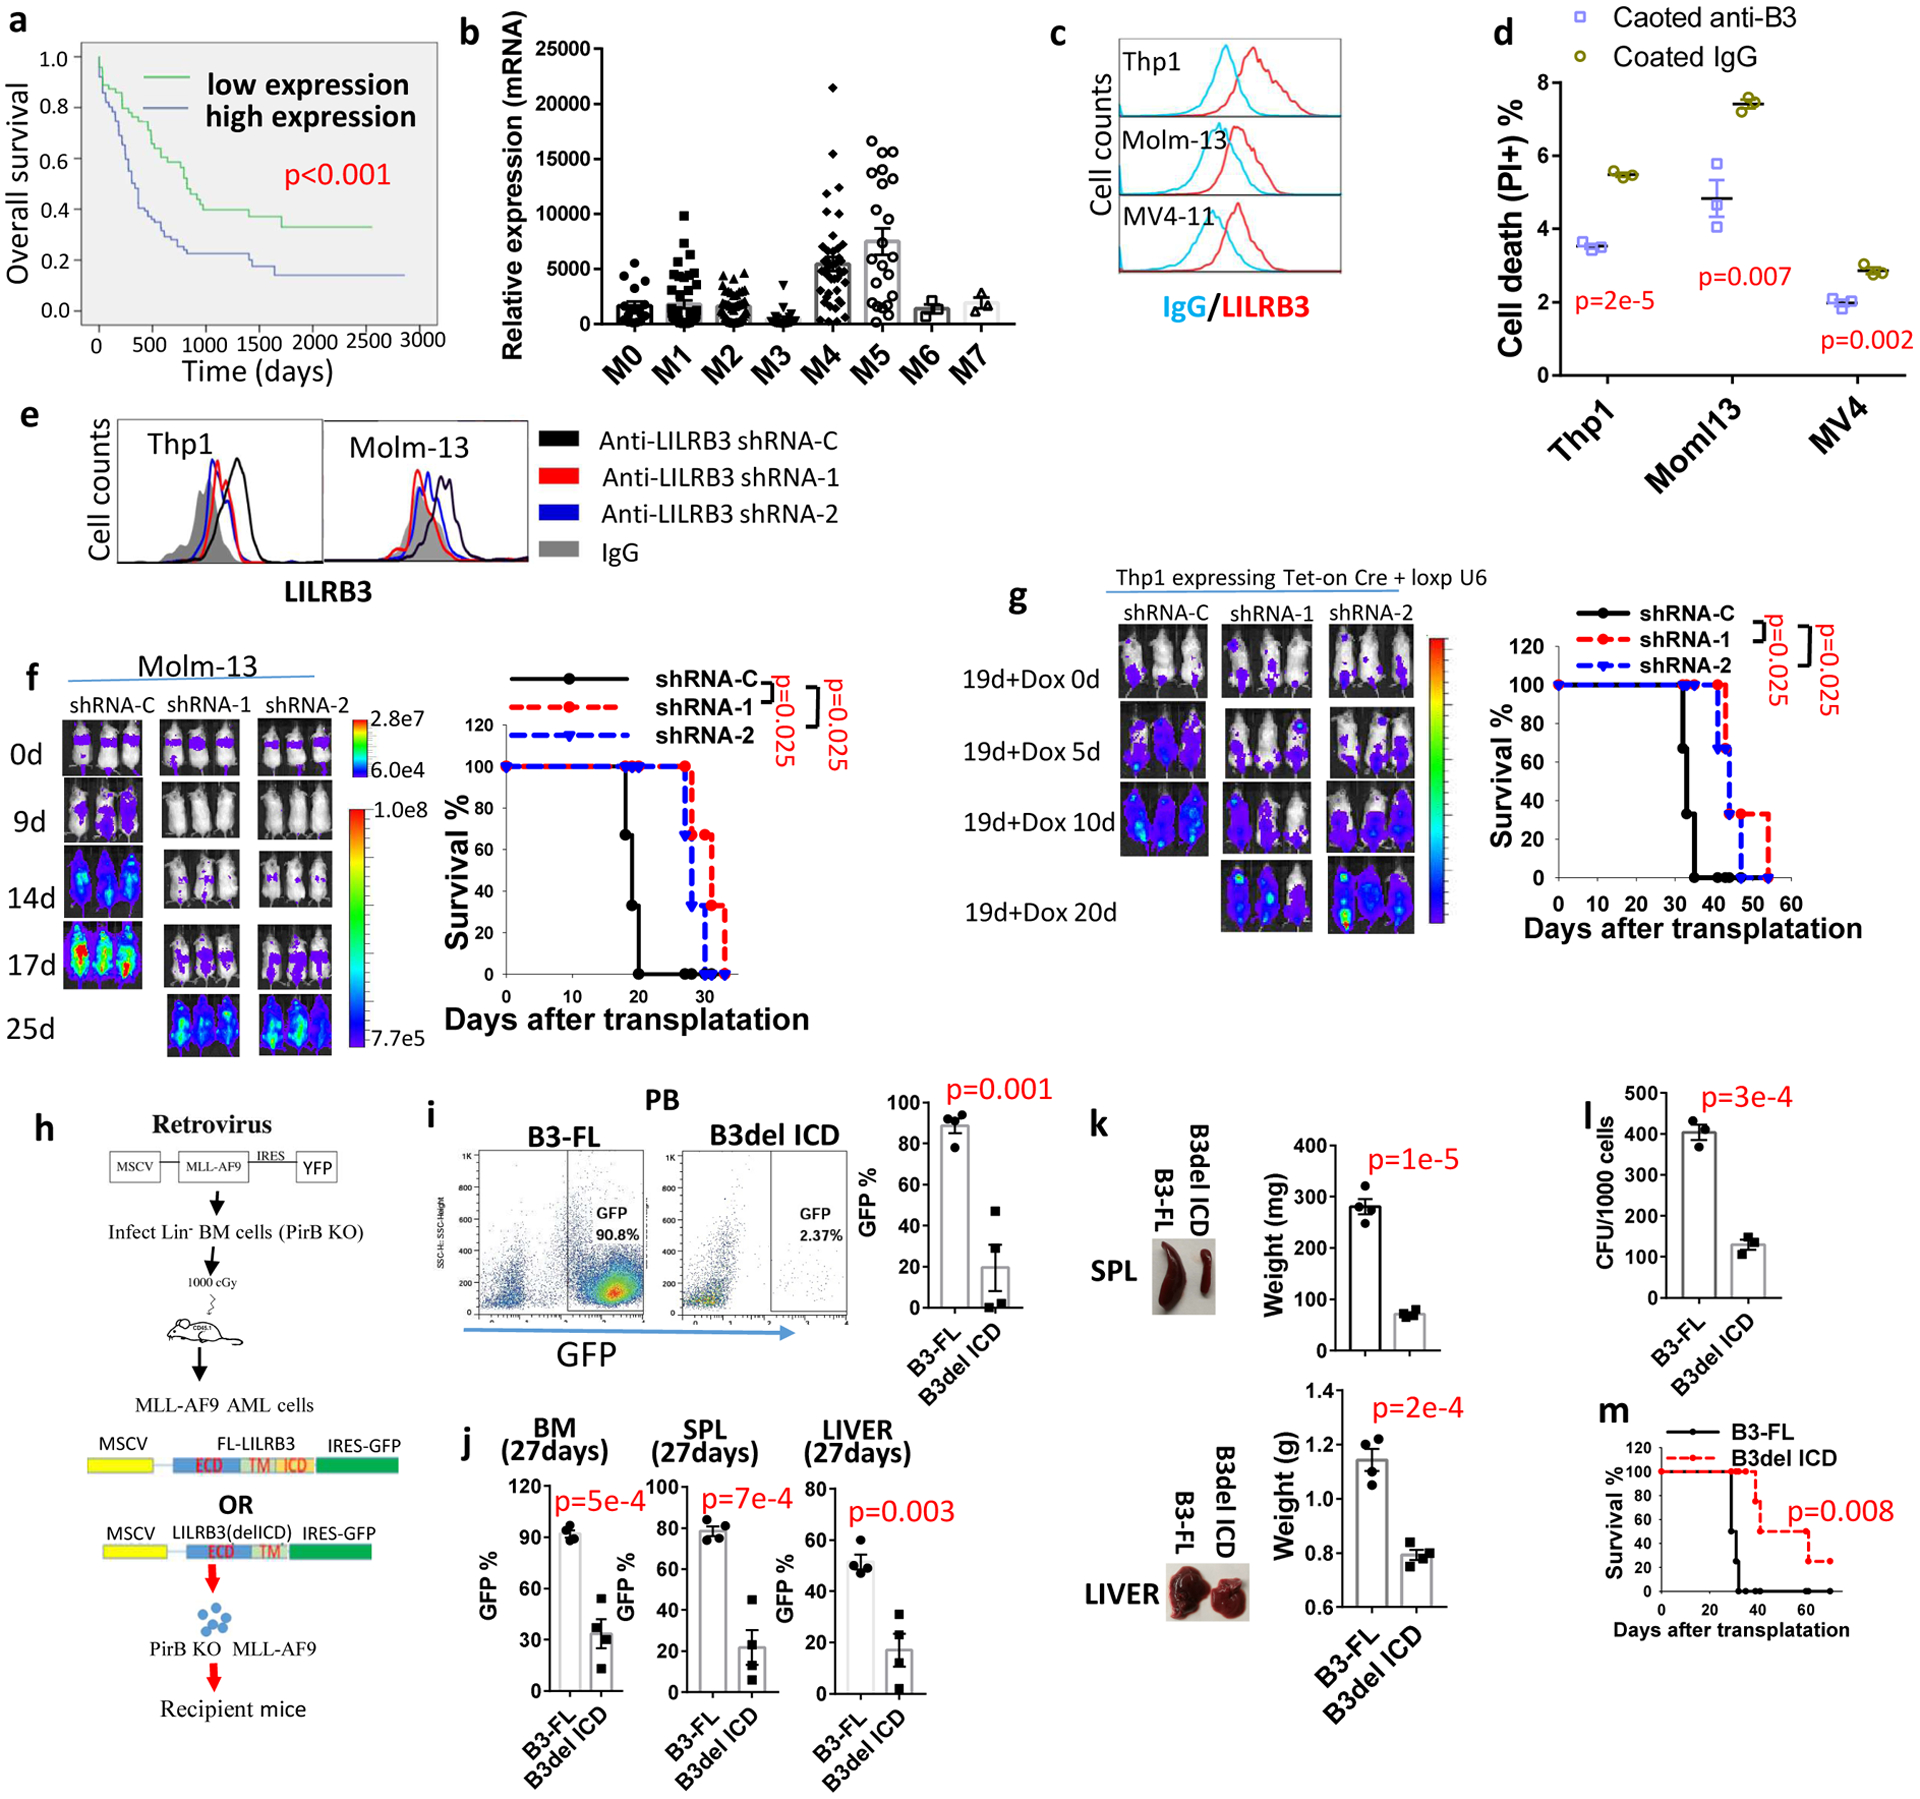
a, Overall survival of AML patients grouped based on LILRB3 expression; data from the TCGA database were analyzed. b, Relative LILRB3 expression in different AML subtypes (mRNA expression normalized to GAPDH); data from the TCGA database. c, LILRB3 expression on AML cell lines. d, Percentages of dead cells in AML cultures treated with anti-LILRB3 antibody or IgG (n=3 independent cell cultures). e, LILRB3 expression on AML cells expressing control shRNA (shRNA-C) or LILRB3-specific shRNAs (shRNA-1 or −2). f, Left: Whole-body images for luciferase of NSG mice engrafted with Molm13 cells expressing luciferase and indicated shRNAs over time. Right: Survival of mice (n=3 independent mice). g, Left: Images of NGS mice engrafted with THP-1 AML and treated with dox at 19 days (once, gavage 2 mg/mouse) post-engraftment to induce shRNA expression. Right: Survival of mice (n=3 independent mice). h, Schematic of retroviral vector used to create a mouse model to study the function of LILRB3. i, Representative FACS analyses and plot of percentages of GFP+ AML cells expressing B3-FL and B3del ICD in peripheral blood of engrafted mice (normal peripheral blood sample as a negative control for gating GFP positive population). j, Percentages of GFP+ AML cells expressing B3-FL and B3del ICD in bone marrow (BM), spleen (SPL), and liver of mice at 27 days after engraftment (n=4 independent mice). k, Representative images and average weights of spleen and liver of mice engrafted with GFP+ AML cells expressing B3-FL and B3del ICD at 27 days (n=4 independent mice). l, Clone forming assay (CFU) of GFP+ AML cells expressing B3-FL or B3del ICD isolated from bone marrow (n=3 independent cell cultures). m, Survival of the mice engrafted with AML cells expressing B3-FL and B3del ICD (n=4 independent mice). The data are presented as mean ± s.e.m, and p values were calculated by two-tailed t-test except for a, f, g and m by log-rank test.
AML cells treated with LILRB3-specific shRNAs (Fig. 1e) had normal proliferation after 3 additional weeks of culture (Extended Data Fig. 1c). In contrast, AML progression of NSG mice implanted with LILRB3-silenced Molm-13 cells was significantly delayed (Fig. 1f). Next, we implanted NSG mice with THP-1 AML cells and applied an shRNA delivery system that can be induced by tet-on CRE to silence LILRB3 in these cells33 (Extended Data Fig. 1d). When induced at 19 days after AML cell transplantation, the expression of the shRNA targeting LILRB3 slowed AML development (Fig. 1g).
Leukemia patients usually have higher TNF-α levels than healthy individuals34. We observed that LILRB3 activation significantly reduced cell death associated with increasing levels of TNF-α (Extended Data Fig. 1e). TNF-α has dual roles in apoptosis and survival35. Our results suggest that LILRB3 enhances TNF-α survival signaling and attenuates its cell death signaling. Nevertheless, activated LILRB3 enhanced cell survival with treatment of anti-TNFα neutralizing antibodies (Extended Data Fig. 1f), suggesting the function of LILRB3 does not depend on TNFα.
We implanted PirB-defective MLL-AF9 AML cells overexpressing full-length LILRB3 (B3-FL) or a mutant LILRB3 with deletion of the intracellular domain (B3del ICD) by retroviral infection36 (Fig. 1h) into syngeneic immuno-competent C57BL/6 mice. The lack of LILRB3 intracellular domain led to significantly reduced AML load, decreased sizes of spleens and livers, lower colony-forming unit (CFU) activity, and prolonged survival (Figs. 1i–m). Experiments with mouse AML C1498 cells that ectopically expressed the full-length LILRB3 or a mutant LILRB3 with the intracellular domain deletion also indicated that LILRB3 supports AML development in immuno-competent mice (Extended Data Figs. 1g–h). Immobilized anti-LILRB3 had little effect on THP-1 cell growth in culture (Extended Data Fig. 1i). MLL-AF9-expressing mouse AML cells with full-length or intracellular domain truncated LILRB3 remained the similar colony forming ability after serial replating (Extended Data Fig. 1j), suggesting that LILRB3 does not affect AML cell self-renew in vitro. Overexpression of LILRB3 in LILRB3-negative U937 AML cells increased cell survival (Extended Data Fig. 1k), confirming the survival-promoting function of LILRB3.
LILRB3+ AML cells inhibit T cell activity
Monocytic AML cells suppress T cell function18. LILRB3+ THP-1 cells activated with immobilized anti-LILRB3 antibodies significantly reduced the level of AML cell death in the presence of CTLs (Fig. 2a,b). To further evaluate whether LILRB3 expressed on AML cells has an effect on T cell function, T cells were injected 4 days after Molm13 AML cell transplantation into NSG mice. In the presence of T cells, LILRB3-silenced Molm13 AML cells developed significantly more slowly than did AML cells expressing the control shRNA (Fig. 2c,d). These results suggest that LILRB3 in AML cells inhibits T cell function.
Fig. 2|. LILRB3 increases the sensitivity of monocytic AML cells to cytotoxic T cells.
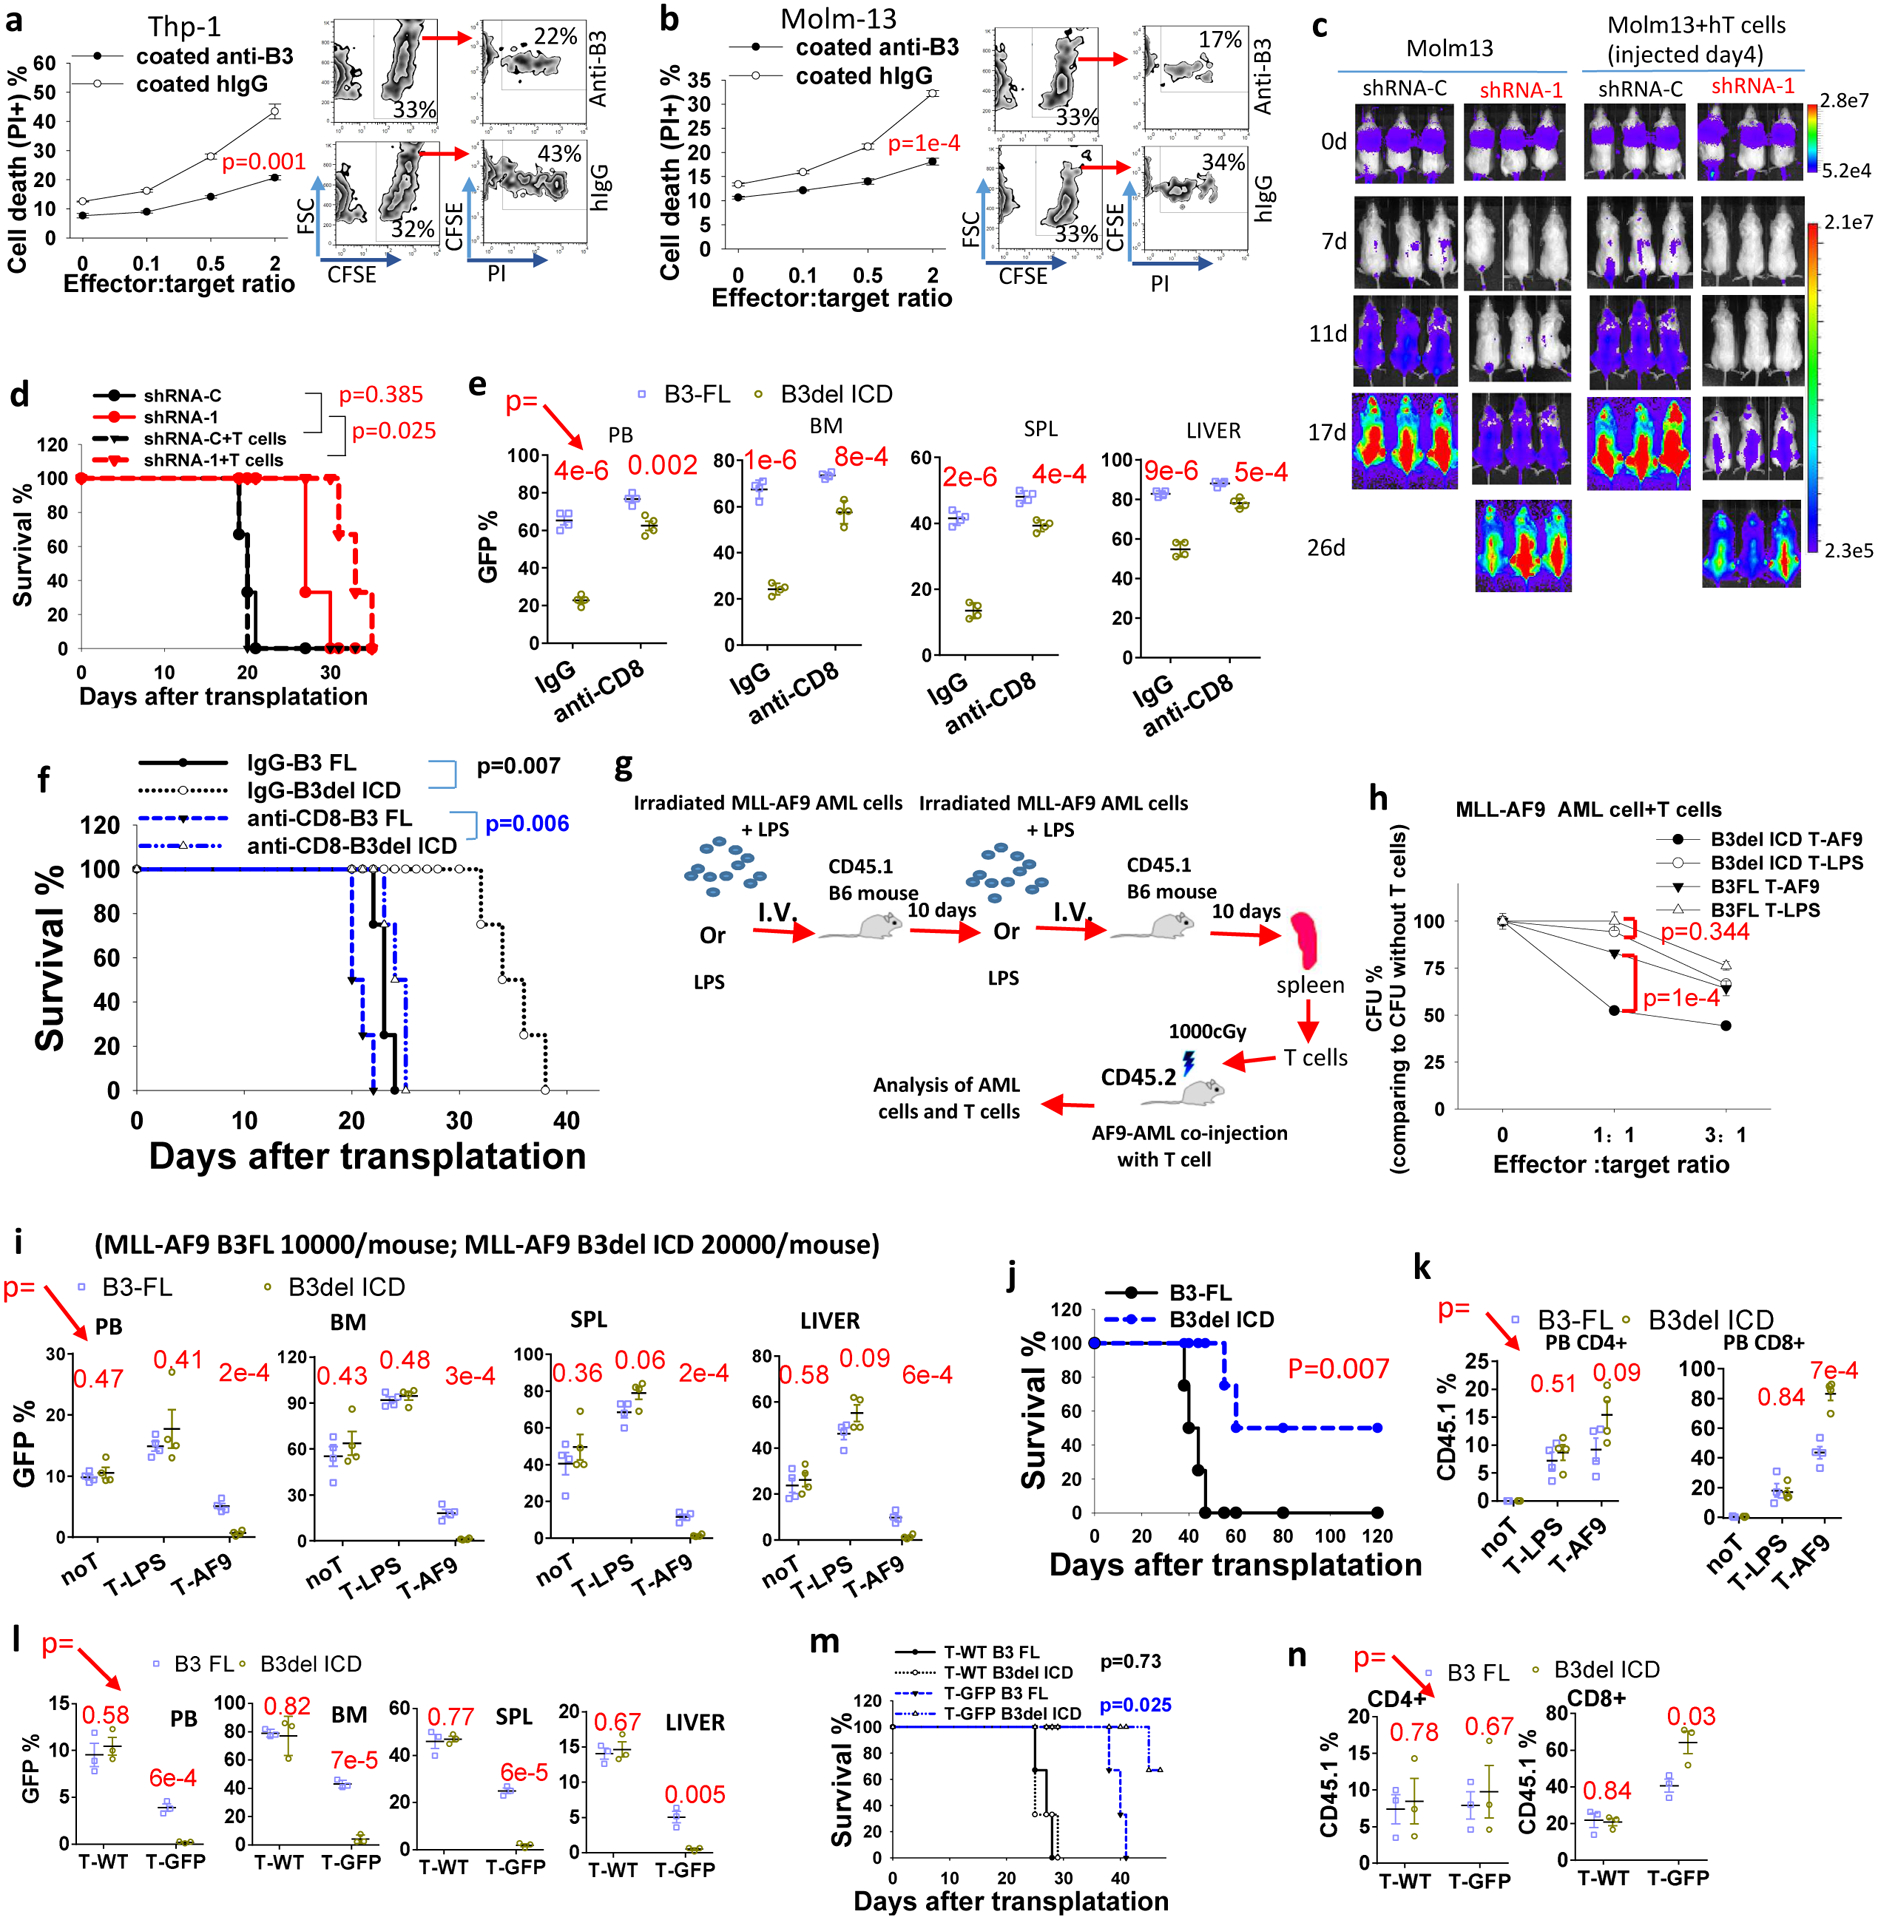
a, b, cell death of CFSE-stained (a) THP-1 or (b) Molm13 cells when co-cultured with activated T cells at different ratios. The FACS images to the right are with effector to target (E:T) ratio of 2 (n=3 independent cell cultures). c, d, NSG xongrafts with Molm13-luciferase cells introduced with shRNA-C or LILRB3-specific shRNA-1 with or without human T cell transplantation. Images of mice (c). Overall survival (d). e, The percentage of GFP+ AML cells expressing B3-FL or B3del ICD in peripheral blood (PB), bone marrow (BM), spleen (SPL), and liver in C57BL/6 mice treated with IgG or anti-mCD8 (n=4 independent mice). f, Survival of mice in e. g, Flow chart for immunizing CD45.1 B6 mice with MLL-AF9 mouse AML cells. h, CFUs of MLL-AF9 AML cells when co-cultured with AML-specific T-AF9 or non-specific T-LPS T cells for 12 hours. (n=3 independent cell cultures). i, The percentage of GFP+ AML cells expressing B3-FL or B3del ICD in peripheral blood (PB), bone marrow (BM), spleen (SPL), and liver in mice not treated with T cells (noT) or treated with T-LPS or T-AF9 (n=4 independent mice). j, Overall survival of mice engrafted with AML cells expressing B3-FL or B3del ICD and injected with CD45.1 T cells (n=4 independent mice). k, Percentages of CD45.1+/CD4+ and CD45.1+/CD8+ T cells in total CD4+ and CD8+ T cell populations, respectively, in peripheral blood of mice in I (n=4 independent mice). l, The percentage of GFP+ AML cells expressing B3-FL or B3del ICD in peripheral blood (PB), bone marrow (BM), spleen (SPL), and liver in mice treated with wild-type T cells (T-WT, CD45.1) or GFP specific T cells (T-GFP, CD45.1) (n=3 independent mice). m, Survival of mice engrafted with indicated AML cells and T cells as above (n=3 mice). n, Percentages of CD45.1+/CD4+ and CD45.1+/CD8+ T cells in total CD4+ and CD8+ T cell populations, respectively, in peripheral blood of mice in l. . The data are presented as mean ± s.e.m, and p values were calculated by two-tailed t-test except for d, f, j and m by log-rank test.
To further test the significance of T cells, we depleted CD8 T cells in C57BL/6 recipient mice with anti-mCD8 antibodies (Extended Data Fig. 2a), and evaluated the leukemia development initiated by PirB-defective MLL-AF9 AML cells with B3-FL or B3del ICD. With CD8 T cell depletion, AML cells with B3-FL still enabled faster leukemia development than those with B3del ICD, but the difference between these two groups was much smaller than their difference in control conditions (Fig. 2e,f). The results suggest that T cell play a critical role in LILRB3 function in AML development. We then developed tumor-specific mouse T cells by immunizing CD45.1 C57BL/6 mice with mouse AML cells that express MLL-AF937 twice with 10 days apart, and isolated CD3+ cells from the spleens. These T cells were co-injected with MLL-AF9 AML cells into recipient CD45.2 C57BL/6 mice (Fig. 2g). T cells from mice immunized with LPS were used as a control. T cells specific for MLL-AF9 AML cells (T-AF9 cells) showed a greater ability to kill MLL-AF9 AML cells than did T cells from LPS-treated mice (T-LPS cells) in vitro (Fig. 2h), though the T-AF9 cells did not kill the normal BM cells (Extended Data Fig. 2b). AML cells with B3-FL were more resistant to killing by T-AF9 cells than their counterparts with B3del ICD, suggesting that LILRB3 signaling in AML cells decreases T cell-mediated killing.
We then transplanted C57BL/6 mice with PirB-defective AML cells expressing B3del ICD or B3-FL (with a double number of AML cells with B3del ICD transplanted into each mouse than the AML cells with B3 FL, which made easier to compare the leukemia development in the presence of tumor-specific T cells). The two groups of mice had similar AML development in the absence of injected CD45.1 T cells or with non-specific T cells (T-LPS) (Fig. 2i). In contrast, mice co-injected with tumor-specific T cells (T-AF9) had significantly slower AML development. Importantly, B3del ICD AML developed more slowly than did B3-FL AML in the presence of the specific T cells (Fig. 2ij). There were higher percentages of tumor-specific CD45.1+ T cells in mice with B3del ICD AML. In contrast, the percentages of non-specific CD45.1+ T cells were the same in the two groups of mice (Fig. 2k).
To further investigate the function of LILRB3 in AML development using antigen-specific T cells, we injected MLL-AF9 AML C57BL/6 CD45.2 mice with GFP specific CD3+ cells isolated from the spleens of CD45.1 transgenic mice whose T cell express GFP-targeting TCRs. PirB-defective MLL-AF9 AML cells with B3del ICD progressed much slower than those with B3-FL in mice injected with GFP-specific T cells, whereas these two groups of AML had similar development in mice injected with WT naïve T cells (Fig. 2l,m). A greater number of CD8 GFP-specific T cells and higher expression of INFγ and TNFα as well as lower expression of PD1 in T cells were detected in mice with B3del ICD AML cells than in mice with B3 FL AML cells (Fig. 2n and Extended Data Figs. 2c). Together, our results indicate that LILRB3 expressed on AML cells inhibits T cell activity and that the signaling domain of LILRB3 is important in this function.
LILRB3 activates NF-κB signaling by recruiting TRAF2
RNA-seq was conducted in THP-1 cells treated with immobilized anti-LILRB3 antibody or control IgG. GO enrichment analysis indicates that LILRB3 activation is correlated with TNF signaling, Toll-like receptor signaling, and NOD-like receptor signaling (Fig. 3a). These signaling pathways are all known to stimulate NF-κB signaling35,38,39. GSEA analysis showed that immobilized anti-LILRB3 antibody activates NF-κB signaling (Fig. 3b). RNA-seq analysis of MLL-AF9 mouse AML cells ectopically expressed B3-FL or B3del ICD was conducted. Results of this analysis also suggest that LILRB3 enhanced NF-κB signaling (Extended Data Fig. 3a,b). These results were in agreement with the previous finding that NF-κB signaling in tumor cells supports cell survival and T cell inhibitory activity40.
Fig. 3|. LILRB3 enhances NF-κB signaling and monocytic AML survival via TRAF2.
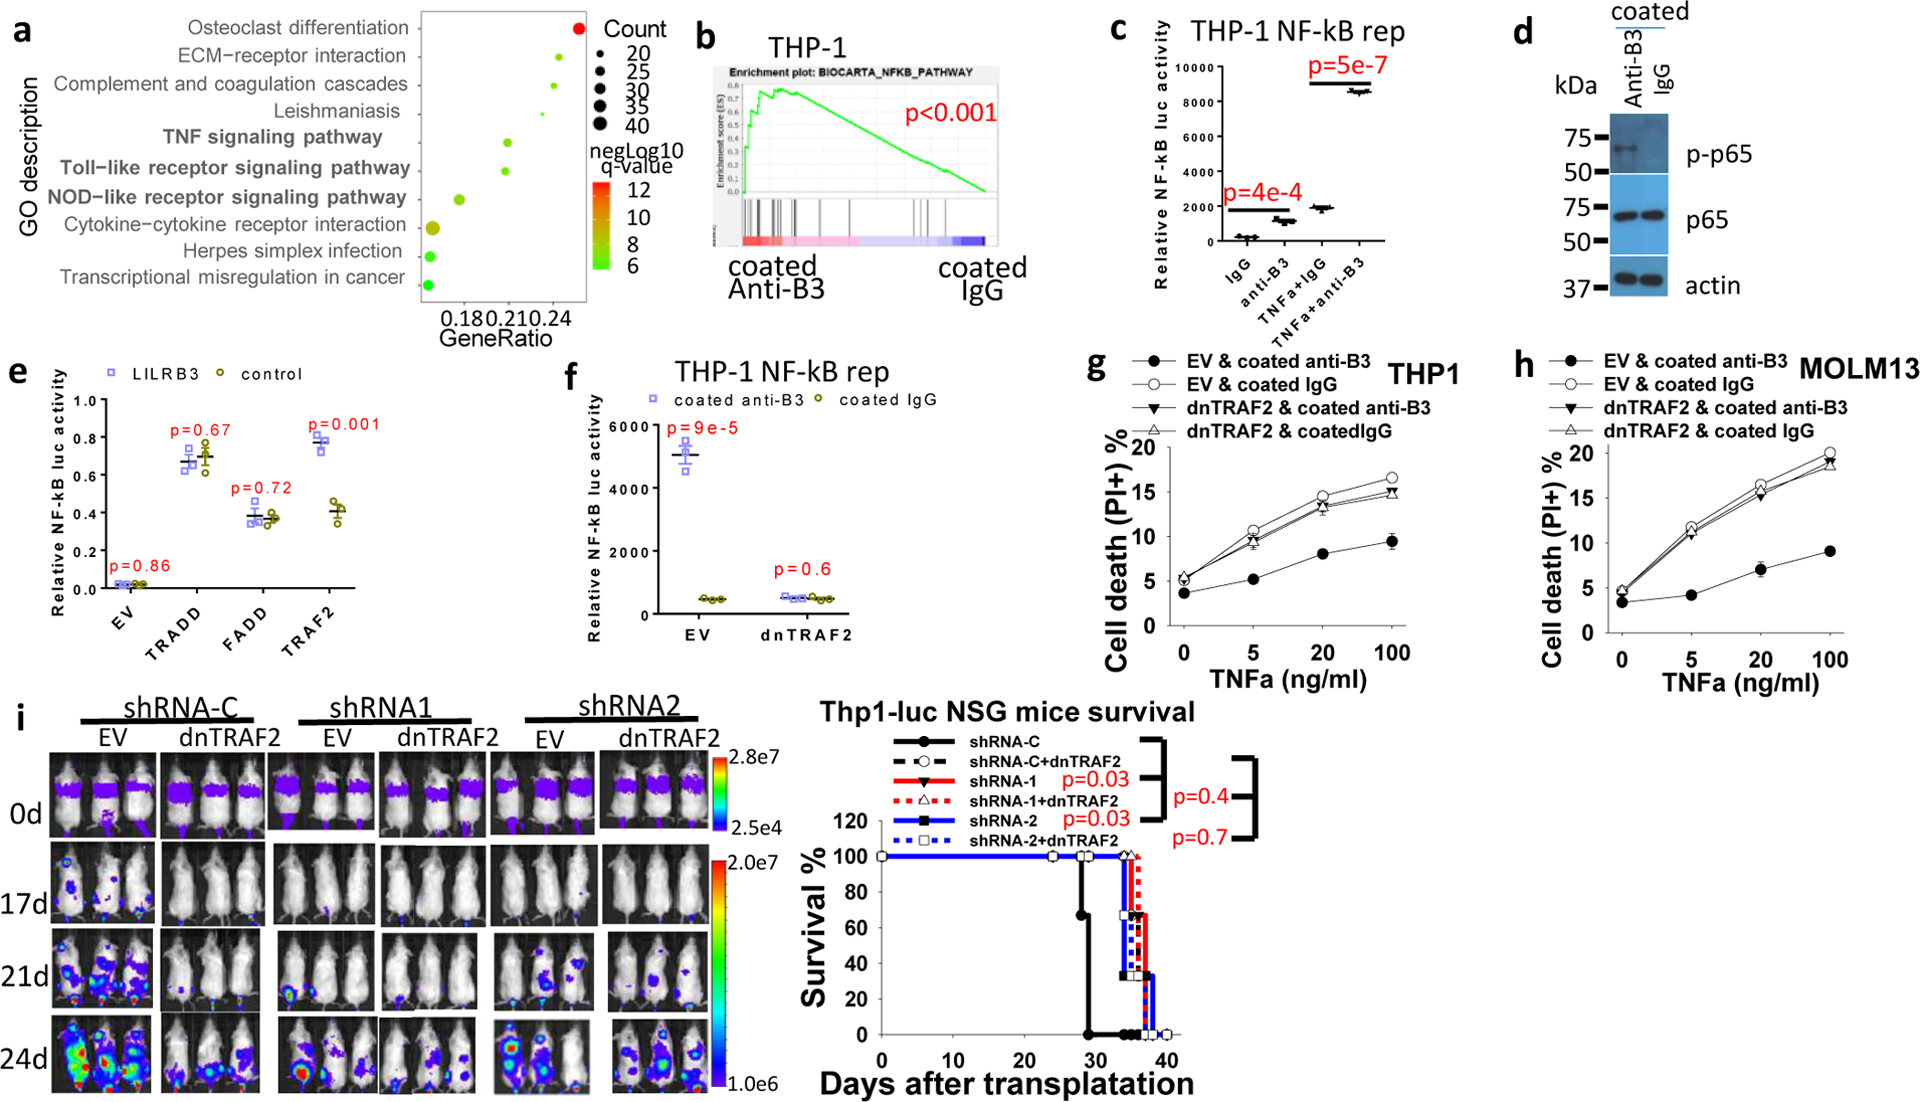
a, Gene ontology enrichment analysis of RNA-seq data from THP-1 cells cultured in plates coated with anti-LILRB3 antibody or IgG. b, GSEA of the correlation between NF-κB signaling and LILRB3 signaling (p values were calculated by Kolmogorov Smirnov (K-S) test in GSEA analysis). c, Luciferase signal from THP-1-Lucia™ cells that stably express an NF-κB-inducible luciferase reporter after culture in plates coated with anti-LILRB3 antibody or IgG in the presence of TNF-α (10 ng/ml) or not (n=3 independent cell cultures). d, Phosphorylated p65 (p-p65) and p65 levels in THP-1 cell cultured in plates coated anti-LILRB3 antibody or IgG. e, Luciferase signal in 293T cells transfected with plasmid for expression of NF-κB promoter-driven firefly luciferase and control Renilla luciferase and empty vector (EV) or TRADD, FADD, or TRAF2 expression plasmids with a vector for expression of LILRB3 or a control vector (n=3 independent cell cultures). f, Luciferase signal from THP-1-Lucia™ cells transfected with empty vector (EV) or vector for expression of dominant-negative TRAF2 (dnTRAF2) cultured in plates coated anti-LILRB3 antibody or IgG (n=3 independent cell cultures). g,h, Percentages of dead cells in cultures of THP-1 cells (g) or Molm13 cells (h) expressing dnTRAF2 or empty vector and cultured in plates coated with anti-LILRB3 antibody or IgG (n=3 independent cell cultures). i, Left: Images of NSG mice transplanted with THP-1 cells expressing luciferase and shRNA-C or LILRB3-specific shRNAs in the presence of dnTRAF2 or not. Right: Overall survival of the NSG mice (n=3 independent mice, p values were calculated by log-rank test). The data are presented as mean ± s.e.m, and p values were calculated by two-tailed t-test except for b and i.
In THP-1 cells that express a luciferase reporter regulated by NF-κB signaling, culture in the presence of immobilized anti-LILRB3 antibodies stimulated the luciferase activity (Fig. 3c) and increased levels of phosphorylated p65 protein (Fig. 3d). To investigate whether LILRB3 interacts with TNFa signaling proteins, we transfected LILRB3 together with TRADD, FADD, or TRAF2, which mediate TNFa signaling, into 293T cells. Then, we examined whether expression of the NF-κB reporter was affected. Overexpression of TRADD, FADD, or TRAF2 in 293T cells activated NF-κB signaling (Fig. 3e). LILRB3 significantly enhanced the activity of TRAF2 but did not alter the activity of TRADD or FADD (Fig. 3e). Overexpression of dominant-negative TRAF2 (dnTRAF2)41 in THP-1 cells abolished the stimulation of NF-κB reporter and the effect on survival of AML cells in the presence of immobilized anti-LILRB3 antibody (Fig. 3f–h). Xenograft experiments were conducted to evaluate disease progress in NSG mice engrafted with AML cells that overexpress dnTRAF2. Results showed this progress was similar to that in mice engrafted with cells in which LILRB3 expression was silenced (Fig. 3i). The interaction between LILRB3 and TRAF2 was detected in the primary M5 AML patient sample by co-immunoprecipitation (Fig. 4a) and confirmed in vitro by co-immunoprecipitation of purified recombinant proteins (Fig. 4b). In addition to stimulation of NF-κB signaling, TRAF2 was reported to activate JNK signaling in the TNFa pathway42. LILRB3 expression did not enhance JNK signaling (Extended Data Fig. 3c). This result suggests that TRAF2 interaction with LILRB3 activates NF-κB signaling through a path separate from TNFa signaling. This is concordant with the previous finding that TRAF2-mediated signaling does not require association with the TNF receptor-complex43.
Fig. 4|. LILRB3 interacted with TRAF2.
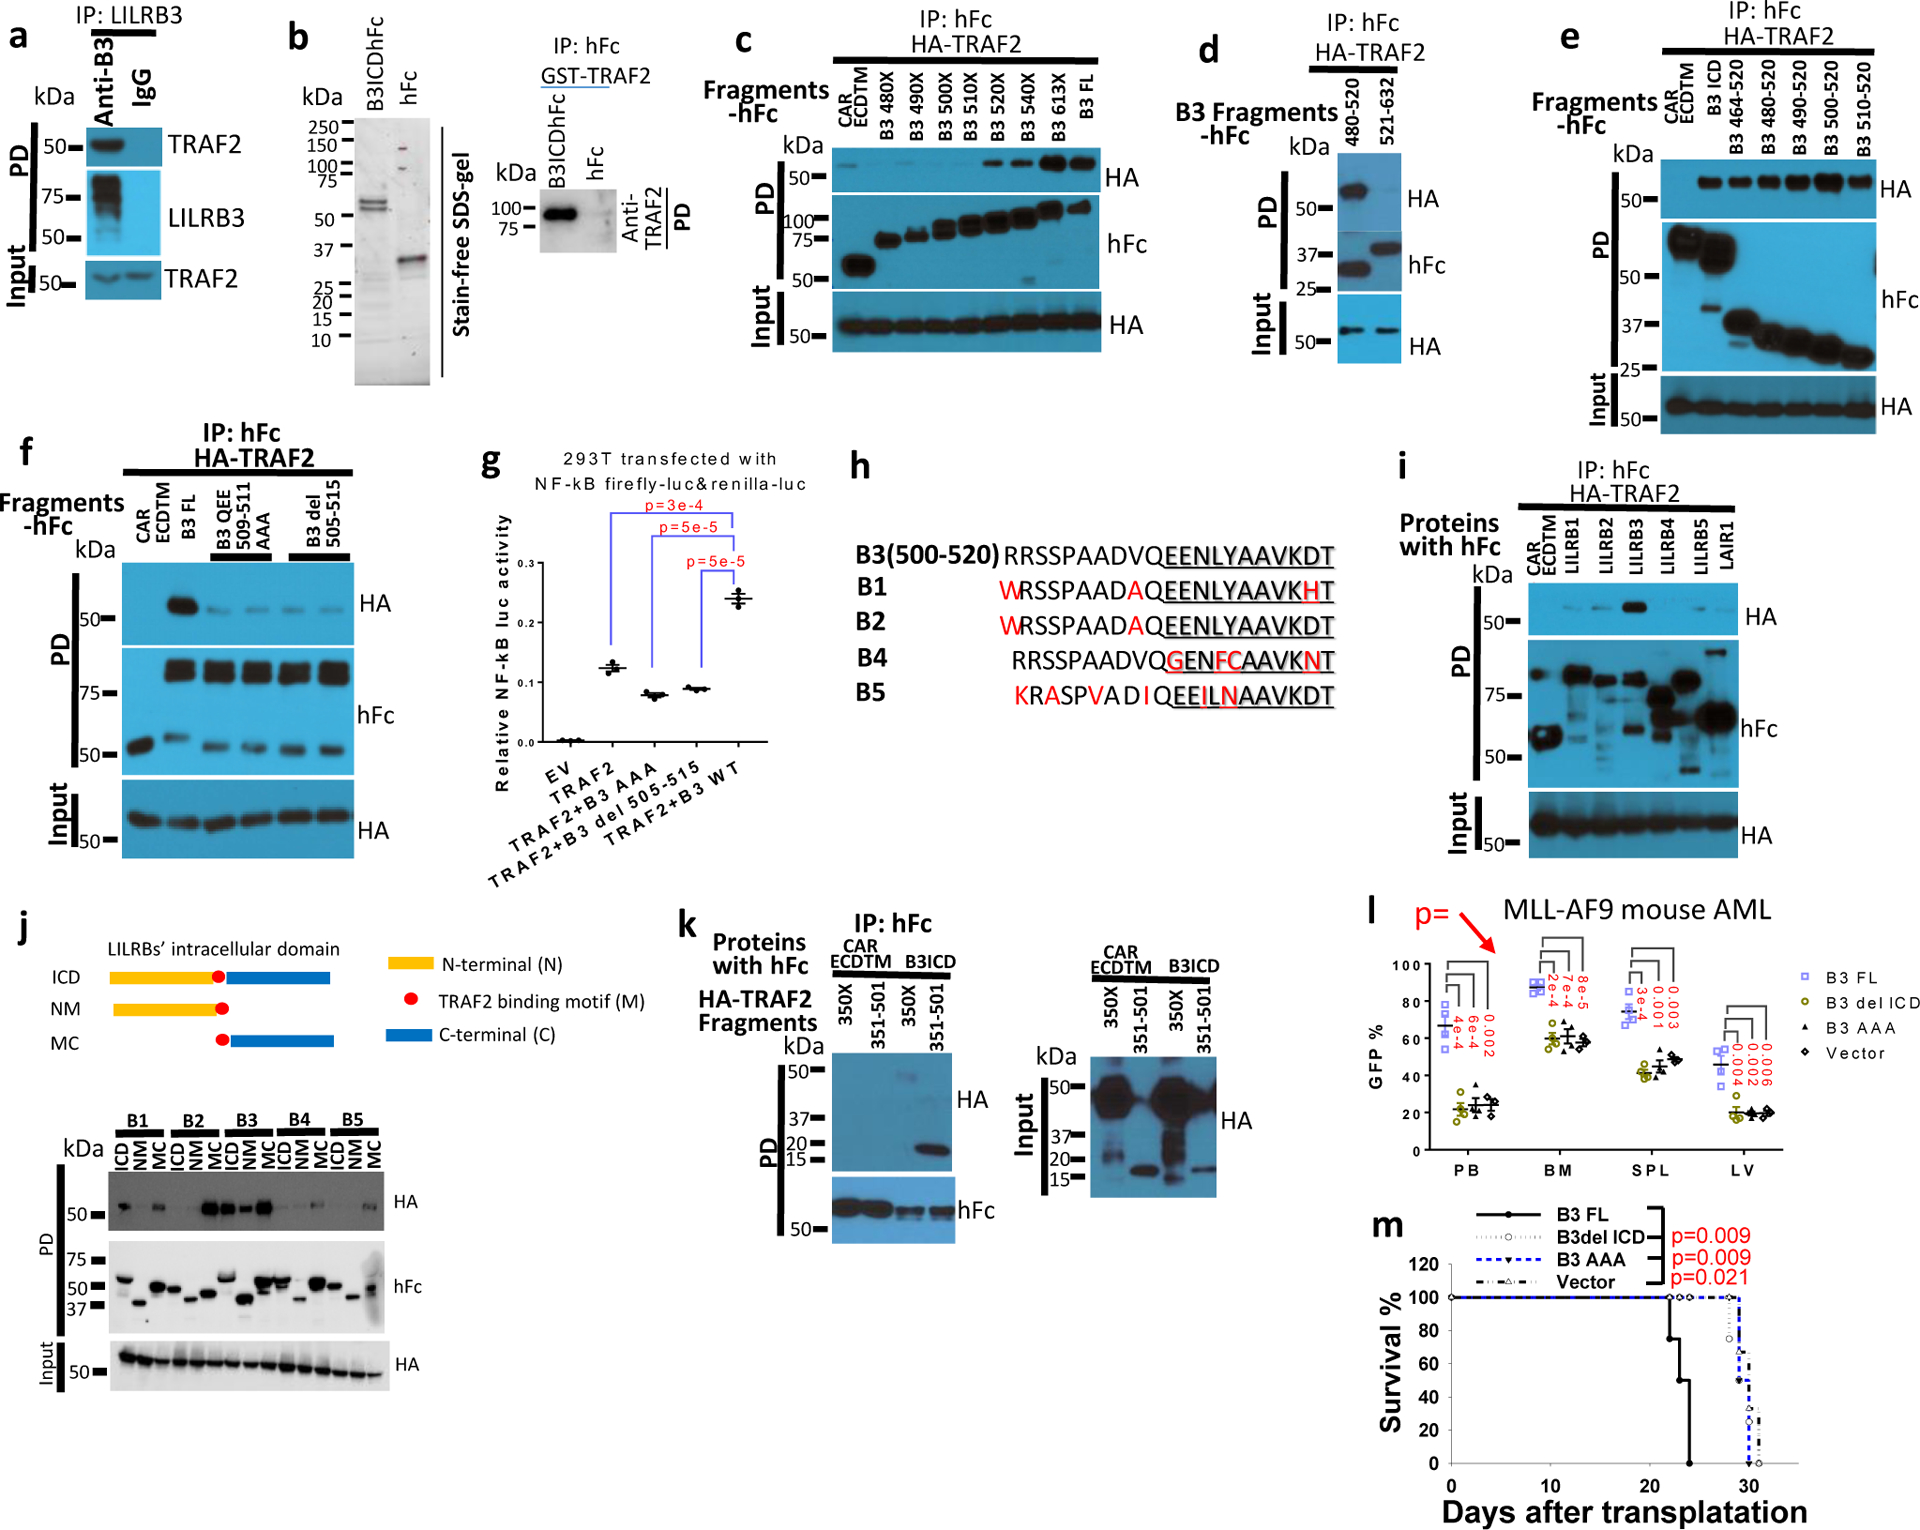
a, Interaction of TRAF2 and LILRB3 in M5 AML patient sample detected by immunoprecipitation with human anti-LILRB3 antibody. b, LILRB3 interacts with TRAF2 in vitro. Left: SDS-PAGE of purified LILRB3 intracellular domain fused to hFc at C-terminus (B3ICDhFc) or hFc alone, exogenously expressed in 293T cells. Right; purified GST-TRAF2 (0.5 M) interacts with purified B3ICDhFc or hFc c-e, Co-immunoprecipitation analysis of exogenous HA-TRAF2 with LILRB3 fragments in 293T cells. The C-terminal of LILRB3 fragments was fused to human Fc and the extracellular domain and transmembrane domain of CAR, an unrelated protein served as control. f, Co-immunoprecipitation analysis of exogenous HA-TRAF2 and LILRB3 mutants in 293T cells. g, Relative NF-κB activities in 293T cells that express TRAF2 and indicated LILRB3 mutants (n=3 independent cell cultures). h, Conservation of LILRB3 sequence critical for binding to TRAF2 in other LILRBs. i, Co-immunoprecipitation analysis of exogenous HA-TRAF2 with LILRBs fused with human in 293T cells. j, Interactions of TRAF2 with intracellular segments of different LILRBs. k, Co-immunoprecipitation analysis of exogenous HA-TRAF2 fragments and the LILRB3 intracellular domain (B3ICD) fused to human Fc in 293T cells. l, The percentage of GFP+ MLL-AF9 AML cells (with PirB knockout) expressing B3-FL, B3del ICD, B3 AAA mutant (n=4 independent mice) or empty vector (n=3 independent mice) in peripheral blood (PB), bone marrow (BM), spleen (SPL), and liver. m, Survival of mice engrafted with indicated AML cells as above (n=4 independent mice). The data are presented as mean ± s.e.m, and p values were calculated by two-tailed t-test except for m by log-rank test.
Co-immunoprecipitation experiments in 293T cells indicated that the fragment containing amino acids 500–520 of LILRB3 is essential for the interaction with TRAF2 (Fig. 4c–e). LILRB3 with amino acids 509–511 mutated from QEE to AAA or with deletion of amino acids 505–515 did not interact with TRAF2 (Fig. 4f), and neither of these mutants activated expression of the NF-κB reporter (Fig. 4g). The sequences in LILRB3 related to the binding to TRAF2 are conserved in other LILRBs (Fig. 4h). Nevertheless, of LILRBs tested, only LILRB3 bound strongly to TRAF2 (Fig. 4i). Further analysis of interactions between the intracellular domains of LILRBs and TRAF2 suggests the membrane-proximal segments of the intracellular domains of LILRBs suppress the interactions between LILRBs and TRAF2 (Fig. 4j). Analyses of TRAF2 fragments indicate that the TRAF-C domain (aa 351–501) mediates the interaction with LILRB3 (Fig. 4k). PirB-defective MLL-AF9 mouse AML cells expressing LILRB3 with amino acids 509–511 mutated from QEE to AAA (that does not bind TRAF2) had slower AML development than their counterparts with full-length LILRB3 in immuno-competent mice (Fig. 4l, m). This indicates that the ability of interaction with TRAF2 is important to the function of LILRB3 in AML cells.
LILRB3 activates NF-κB signaling via cFLIP
cFLIP inhibits apoptosis. The N-terminal fragment p22-FLIP, a product of cFLIP digestion by caspase 844, activated NF-κB signaling in 293T cells (Extended Data Fig. 4a) as previously reported45. Caspase 8 inhibitors z-VAD-FMK and z-IETD-FMK45, inhibited the NF-κB reporter activity activated by LILRB3 (Fig. 5a). This result suggests that caspase 8 is required for NF-κB signaling stimulated by LILRB3. Immobilized anti-LILRB3 treatment increased cFLIP and p22-FLIP protein levels in THP-1 cells (Fig. 5b). A low level of cFLIP stimulates whereas a high level of cFLIP inhibits caspase 8 activity46,47. When a Tet-on cFLIP construct was transfected into 293T cells, a low concentration of doxycycline (dox) stimulated NF-κB reporter activity (Extended Data Fig. 4b). LILRB3 enhanced the ability of cFLIP to activate NF-κB at a low concentration of dox (Fig. 5c). These results suggest that NF-κB activation by LILRB3 depends on a low level of cFLIP. As in THP-1 cells, z-VAD-FMK also blocked LILRB3-induced NF-κB activity in 293T cells (Fig. 5d).
Fig. 5|. LILRB3 enhancement of NF-κB signaling depends on cFLIP.
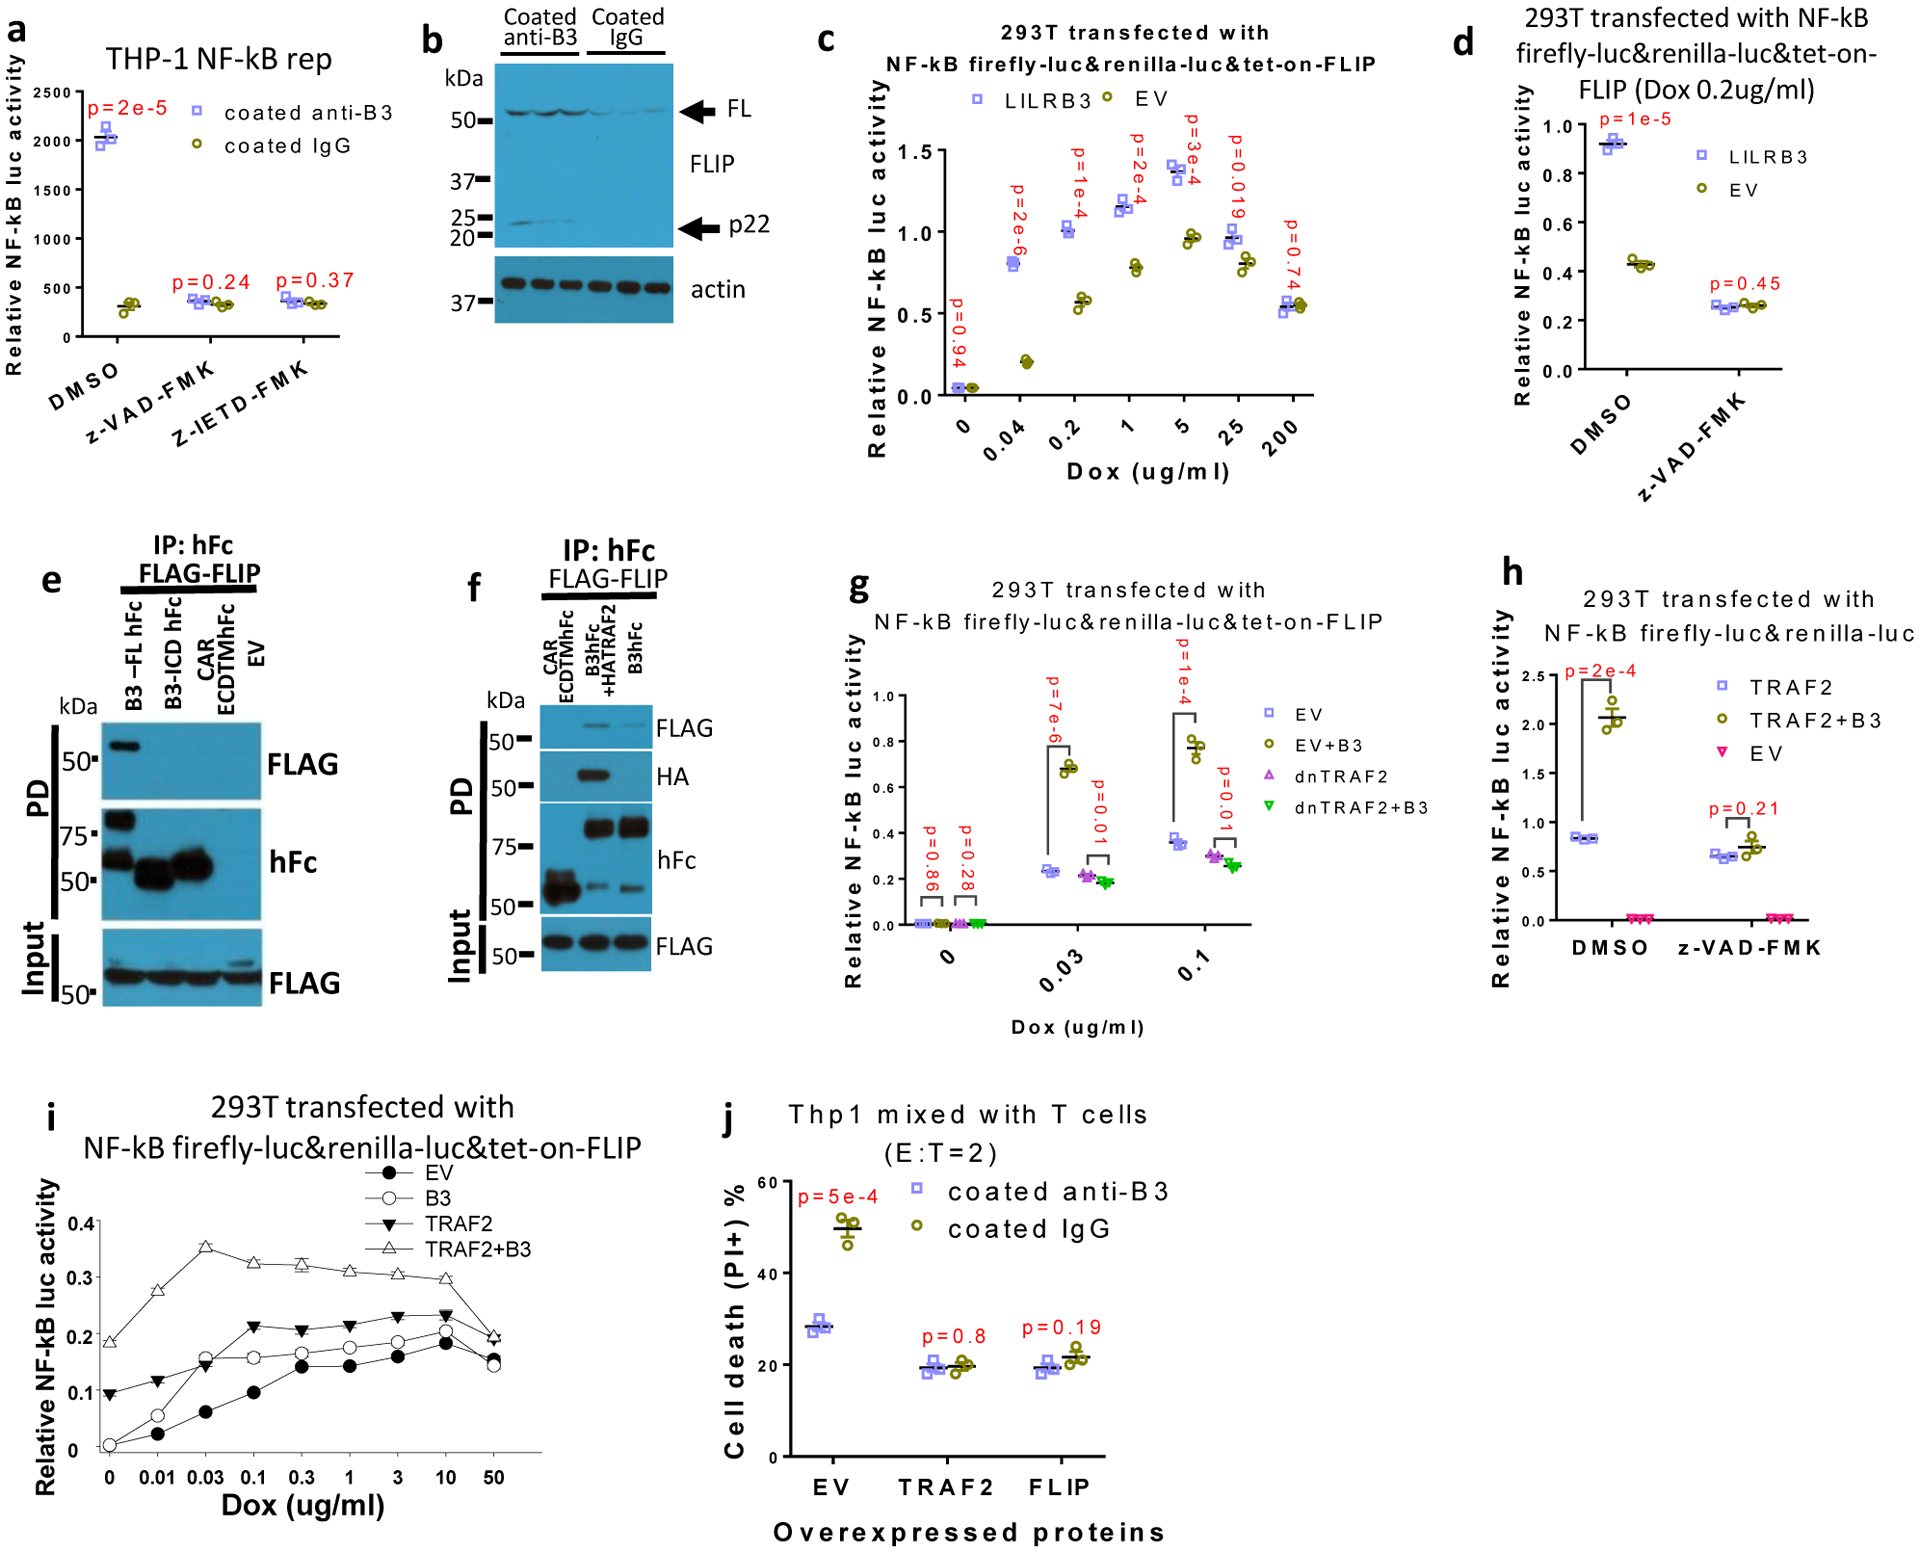
a, NF-κB reporter gene activities in THP-1-Lucia™ cells activated with anti-LILRB3 antibody or IgG in the presence of DMSO, caspase inhibitor z-VAD-FMK, or caspase 8 inhibitor z-IETD-FMK (n=3 independent cell cultures). b, Western blot analysis for cFLIP in THP-1 cells activated by anti-LILRB3 antibody or IgG. c, Relative NF-κB reporter gene activities in 293T cells co-transfected with tet-on cFLIP plus empty vector (EV) or vector for expression of LILRB3 at different concentration of dox (n=3 independent experiments). d, Relative NF-κB reporter gene activities in 293T cells co-transfected with tet-on cFLIP plus empty vector or vector for expression of LILRB3 in the presence of DMSO or z-VAD-FMK (with 0.2 ug/ml of dox) (n=3 independent experiments). e, Co-immunoprecipitation assay of exogenously expressed FLAG-cFLIP and hFc-tagged B3-FL or B3del ICD in 293T cells. f, Co-immunoprecipitation assay of exogenously expressed FLAG-cFLIP and LILRB3-hFc in the presence of HA-TRAF2 or empty vector in 293T cells. g, Relative NF-κB reporter gene activities in 293T cells co-transfected with tet-on cFLIP in the presence of LILRB3 and dnTRAF2 or empty vector at different concentrations of dox (n=3 wells). h, Relative NF-κB reporter gene activities in 293T cells co-transfected with TRAF2 or LILRB3 in the presence of DMSO or z-VAD-FMK (n=3 independent experiments). i, Relative NF-κB reporter gene activities in 293T cells co-transfected with tet-on cFLIP in the presence of LILRB3 and TRAF2 or empty vector at different concentrations of dox (n=3 independent experiments). j, CFSE-stained THP-1 cells with forced expression of TRAF2, FLIP or empty vector (EV) were co-cultured with activated T cells in plates coated with anti-LILRB3 or IgG for 12 hours before cell death analysis. The plots are of percent dead cells in CSFE positive cells (n=3 independent experiments). The data are presented as mean ± s.e.m, and p values were calculated by two-tailed t-test.
TRAF2 can bind to cFLIP (Extended Data Fig. 4c)45. Unlike TRAF2, only full-length LILRB3 could recruit cFLIP when co-expressed in 293T cells (Fig. 5e). The inability of the intracellular domain of LILRB3 alone to recruit cFLIP suggests that crosslinking of LILRB3 on the membrane is required for formation of the complex of LILRB3 with cFLIP. Co-expression of TRAF2 enhanced the interaction of LILRB3 and cFLIP (Fig. 5f), suggesting that LILRB3 simultaneously interacts with TRAF2 and cFLIP. Overexpression of dnTRAF2 blocked LILRB3-mediated enhancement of NF-κB signaling in the presence of a low level of cFLIP (Fig. 5g). z-VAD-FMK also blocked the ability of LILRB3 to stimulate NF-κB through TRAF2 (Fig. 5h). Together, these results suggest that the interaction of cFLIP and TRAF2 is critical for LILRB3 signaling. Endogenous TRAF2 does not stimulate NF-κB signaling without cFLIP in 293T cells45. In the presence and absence of exogenous TRAF2 in 293T cells, LILRB3 enhanced NF-κB signaling when a low level of cFLIP was present, but not at a high level of cFLIP (Fig. 5i), confirming the cooperation of TRAF2 and cFLIP in LILRB3 signaling.
When THP-1 cells overexpressing TRAF2 or cFLIP were co-cultured with activated T cells, the cytotoxicity of T cells was significantly decreased (Extended Data Fig. 4d,e). With overexpression of TRAF2 or FLIP in THP-1 cells, activated T cells kill the same percentages of THP-1 cells in plates with coated anti-LILRB3 and coated IgG (Fig. 5j). These results suggest that LILRB3 protects AML cells from T cell killing via TRAF2 and FLIP. Caspase 8 could induce apoptosis and inhibit necroptosis48, and apoptosis does not induce immune response and necroptosis results in immune response49. THP-1 cells treated with immobilized anti-LILRB3 decreased phospho-MLKL (a mediator of necroptosis), suggesting that LILRB3 signaling inhibits necroptosis and decreases immune response (Extended Data Fig. 4f).
Blocking NF-κB signaling with its inhibitor QNZ in THP-1 cells partially abolished the effect of LILRB3 on survival of THP-1 cells (Extended Data Fig. 4g). This result strengthens our finding that LILRB3 enhances AML cell survival at least partially by stimulating NF-κB signaling.
LILRB3 inhibits NF-κB signaling upon NF-κB hyperactivation
Next we aimed to identify the context in which LILRB3 acts as an inhibitory receptor. With a relatively high level of LPS (200 μg/L), the activation of LILRB3 signaling in THP-1 cells by the immobilized anti-LILRB3 led to inhibition of NF-κB reporter activity (Fig. 6a) and decreased levels of phosphorylated p65 (Fig. 6b).
Fig. 6|. LILRB3 negatively regulates NF-κB signaling with strong LPS stimulation.
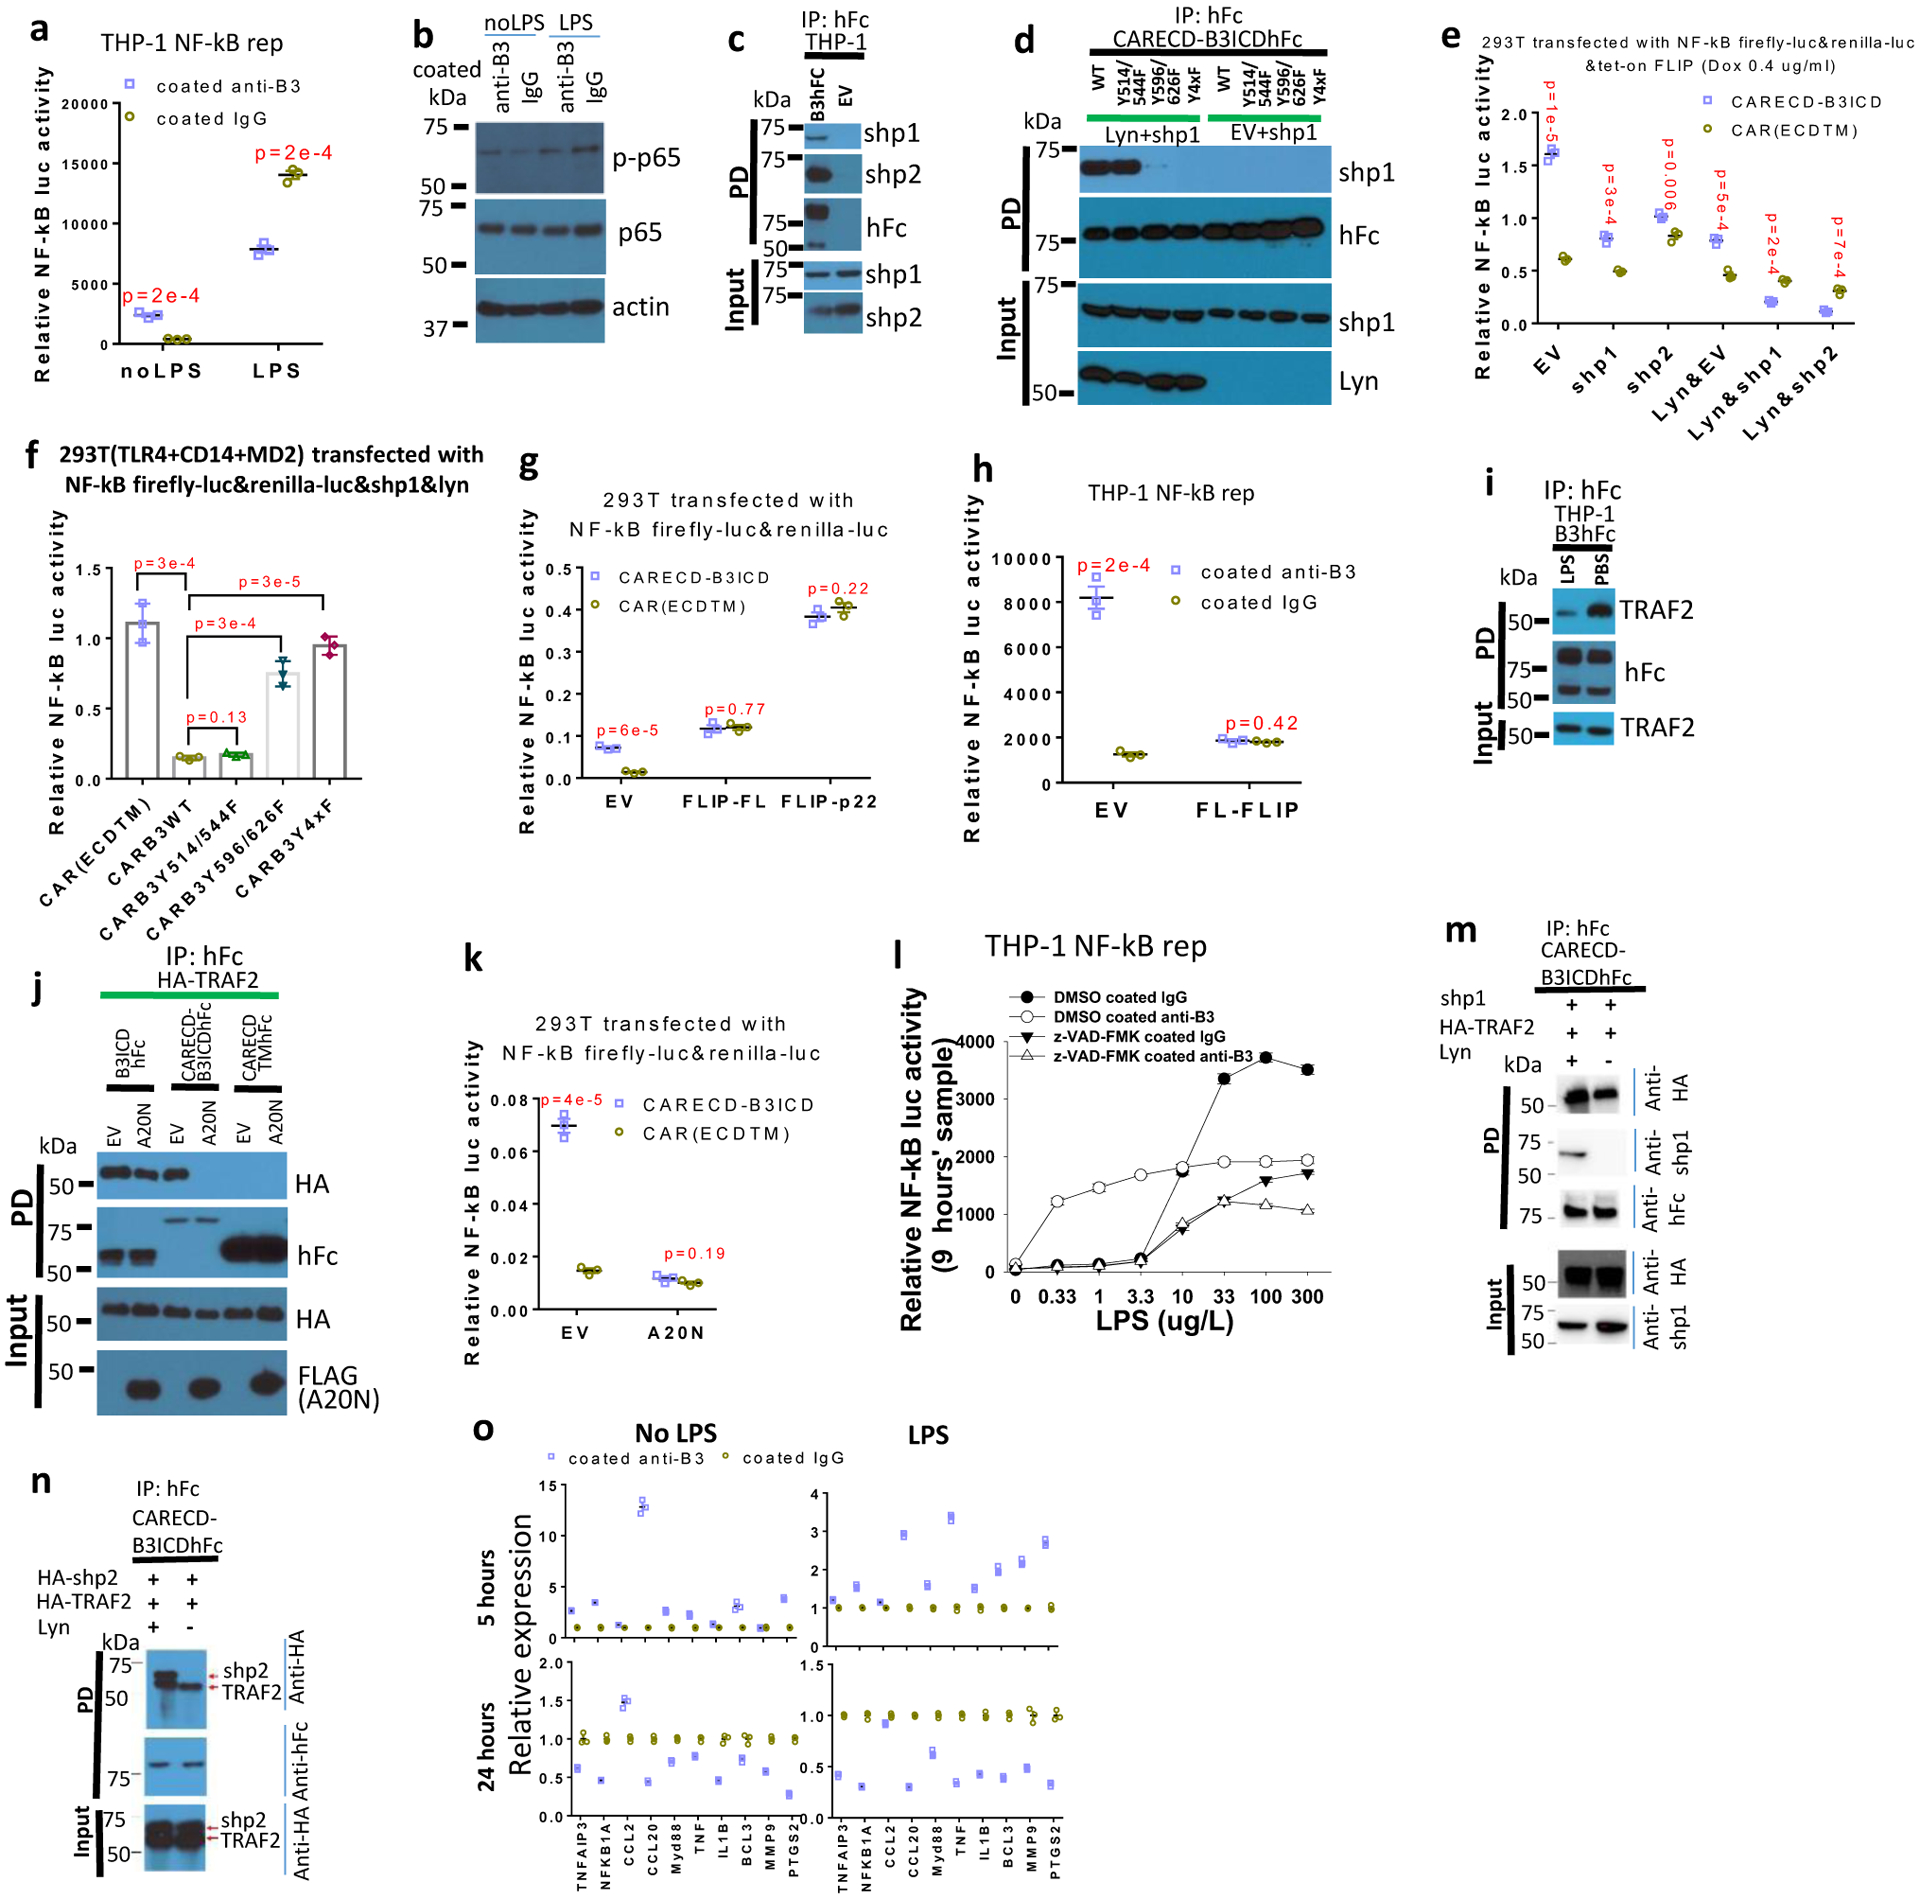
a and b, In the presence or absence of 200 μg/ L LPS, Signal from THP-1-Lucia™ cells (a) (n=3 independent cell cultures) and Levels of phosphorylated p65 (p-p65) and p65 in THP-1 cell (b) when treated with anti-LILRB3 antibody or IgG for 12 hours. c, Co-immunoprecipitation of endogenous SHP-1 and SHP-2 in THP-1 cells that stably express LILRB3-hFc (B3hFc) or empty vector (EV). d, Co-immunoprecipitation of exogenous SHP-1 and CARECD-B3ICDhFc with or without ITIM mutations in 293T cells in the presence of exogenously expressed Lyn or not (EV). Y4xF indicates protein with four ITIM mutations. e, f and g, Relative NF-κB signaling activities in 293T cells co-transfected with vectors tet-on cFLIP and CARECD-B3ICD or CARECDTM in the presence of empty vector or vectors for expressing of SHP-1 or SHP-2 with or without Lyn expression (e); expressing TLR4, CD14, MD2, SHP-1, and Lyn plus CARECDTM or CARECD-B3ICD with different ITIM mutations in the presence of 200 μg/L LPS (f);or co-transfected with CARECD-B3ICD or CARECDTM in the presence of empty vector, cFLIP-FL, or p22 (g). (n=3 wells) h, Signal from THP-1-Lucia™ cells infected with empty vector or FL-cFLIP and activated with anti-LILRB3 antibody or IgG. (n=3 independent cell cultures) i, Co-immunoprecipitation of endogenous TRAF2with LILRB3-hFc in THP-1 cells with LPS or PBS. j, Interactions of exogenous HA-TRAF2 with B3ICDhFc, CARECDTMhFc, or CARECD-B3ICDhFc in presence or absence of the FLAG-tagged N terminus of A20 (A20N). k, Relative NF-κB signaling activities in 293T cells co-transfected with CARECD-B3ICD or CARECDTM in the presence of empty vector or A20N. (n=3 independent experiments) l, Signal of THP-1-Lucia™ cells activated with anti-LILRB3 antibody or IgG in the presence of DMSO or z-VAD-FMK at different concentration of LPS. (n=3 wells) m,n, Co-immunoprecipitation of SHP-1(m) or SHP-2 (n) with TRAF2 and CARECD-B3ICDhFc with or without Lyn. o, qPCR of NF-κB target gene expression in normal monocytes (CD14+ cells) culture in the presence of anti-LILRB3 antibody or IgG with or without 200 μg/L LPS. (n=3 independent experiments). The data are presented as mean ± s.e.m, and P values were calculated by two-tailed t-test.
SHP-1 and SHP-2 mediate the inhibitory effect of LILRBs10. LILRB3 co-immunoprecipitated with endogenous SHP-1 and SHP-2 in THP-1 cells stably expressing LILRB3 (Fig. 6c). To identify the LILRB3 ITIMs that mediate the interactions, we prepared a vector for expression of the transmembrane and intracellular domains of LILRB3 fused at the N-terminus to the extracellular domain of tight junction protein CAR50 and at the C-terminus to hFc (CARECD-B3ICD-hFc). We expected that homophilic interactions of CAR extracellular domains of the chimeric proteins would enhance LILRB3 clustering to facilitate activation of the receptor. When this fusion protein was ectopically co-expressed with SHP-1 and Lyn (a Src-like kinase required for LILRB ITIM phosphorylation)51 in 293T cells, we found that LILRB3 interacted with SHP-1 mainly via the last two C terminal ITIMs (Fig. 6d).
Next we performed studies to characterize the effect of LILRB3 on NF-κB signaling with SHP-1 and SHP-2 association. CARECD-B3ICD and the control CARECDTM (CARECD-B3ICD with LILRB3 intracellular domain deletion) were co-transfected with SHP-1 or SHP-2, the NF-κB reporter, and tet-on cFLIP in the presence or absence of Lyn. With 0.4 μg/ml dox treatment, CARECD-B3ICD enhanced NF-κB reporter activity without Lyn, but inhibited NF-κB reporter activity when Lyn was expressed in the presence of SHP-1 or SHP-2 (Fig. 6e).
Vectors for expression of CARECD-B3ICD with different ITIM mutations or CARECDTM were co-transfected into 293T cells exogenously expressing TLR4, CD14, and MD252. This enables the cells to respond to LPS treatment. In the presence of SHP-1 and Lyn, wild-type CARECD-B3ICD significantly inhibited NF-κB stimulated by LPS, whereas Y596/626F with double ITIM mutations and Y4xF with four ITIM mutations restored the inhibitory effect (Fig. 6f).
The high level of full-length cFLIP observed when NF-κB signaling is highly active could inhibit caspase 8 activity46,47,53. Indeed, we found that co-expression of the full-length cFLIP or p22-FLIP with CARECD-B3ICD in 293T cells blocked the enhanced NF-κB activation by LILRB3 (Fig. 6g). Overexpression of full-length cFLIP also inhibited NF-κB activation in THP-1 cells cultured in plates coated with anti-LILRB3 antibodies (Fig. 6h).
Moreover, high LPS stimulation significantly decreased the association of TRAF2 and LILRB3 in THP-1 cells (Fig. 6i). A20 (also known as TNFAIP3), a protein that acts as a negative feedback regulator of NF-κB signaling54, mediates TRAF2 degradation55. The A20 N-terminus (amino acids 1–386), which is known to be associated with TRAF256, was ectopically expressed with HA-TRAF2, and CARECD-B3ICDhFc, B3ICDhFc, or CARECDTMhFc. The N-terminal fragment of A20 disrupted the interaction between TRAF2 and CARECD-B3ICDhFc, which is clustered through interactions of the CAR extracellular domains. However, it did not drastically affect the association of TRAF2 with B3ICDhFc, which is not crosslinked (Fig. 6j). In addition, co-expression of the A20 N-terminal fragment with CARECD-B3ICD in 293T cells disrupted the positive effect of LILRB3 on NF-κB signaling (Fig. 6k).
In THP-1 cells, LILRB3 enhanced NF-κB signaling in the presence of a low concentration of LPS but inhibited NF-κB signaling at a high level of LPS (Fig. 6l). The caspase 8 inhibitor z-VAD-FMK blocked LILRB3-induced NF-κB when the concentration of LPS was low. However, at a high concentration of LPS in the presence of z-VAD-FMK, LILRB3 activation by immobilized anti-LILRB3 inhibited NF-κB signaling (Fig. 6l). Interestingly, SHP-1/2 and TRAF2 were able to bind simultaneously to LILRB3 when they were co-overexpressed in 293T cells (Fig. 6m,n).
In normal human monocytes, NF-κB target gene expression was significantly elevated after 5 hours of treatment with immobilized anti-LILRB3 and significantly decreased at 24 hours after the treatment especially in the presence of high level of LPS (Fig. 6o). This result implies that a relatively long-term activation of LILRB3 in normal monocytes results in the inhibitory effect, possibly due to increased expression of cFLIP53 and A2054, which block LILRB3 positive signaling. However, THP-1 AML cells could sustain NF-κB signaling activated by anti-LILRB3 antibody for as long as 2 days (Extended Data Fig. 5a). One possible explanation is that AML cells express higher levels of TRAF2 than do normal monocytes (Extended Data Fig. 5b).
Concordantly, MLL-AF9-expressing mouse AML cells with full-length LILRB3 led to decreased leukemia development when the immuno-competent mice were treated with LPS, whereas the development of AML characterized with LILRB3 intracellular domain truncation was unchanged with LPS treatment (Extended Data Figs. 5c–d). Together, our results suggest that LILRB3/TRAF2/cFLIP loop maintains a balanced NF-κB signaling (Extended Data Fig. 5e).
LILRB3 blocking antibodies inhibit AML progression
In order to develop fully human anti-LILRB3 blocking antibodies, we used sequential panning rounds of a highly diverse naïve scFv phage library with increased stringency to select LILRB3-ECD bound phages (Extended Data Fig. 6a). Unique scFv sequences were converted to fully humanized IgG format (Extended Data Fig. 6a). Fifty of the 62 unique IgGs bind to LILRB3 on cells (Extended Data Fig. 6a). Thirty had high affinity for LILRB3 as confirmed by ELISA (Extended Data Fig. 6b,c). These IgGs were grouped into three LILRB3 epitope bins by an Octet-based epitope binning assay (Fig. 7a). Only IgGs in the third bin (#1 and #26) blocked colony formation by MLL-AF9 cells (Fig. 7b). The affinities of selected IgGs in each epitope bin were evaluated (Extended Data Fig. 6d, Fig. 7c). Both antibodies #1 and #26 are specific to LILBR3 (Extended Data Fig. 6e, f). Because IgG #1 had a higher affinity than #26 (Fig. 7c), this antibody was produced. This antibody, IgG#1, was further developed with an Fc glycosylation N297A mutation or LALAPG mutation, which has defective Fc-mediated effector functions57–59.
Fig. 7|. Blocking anti-LILRB3 antibody prevents monocytic AML development.
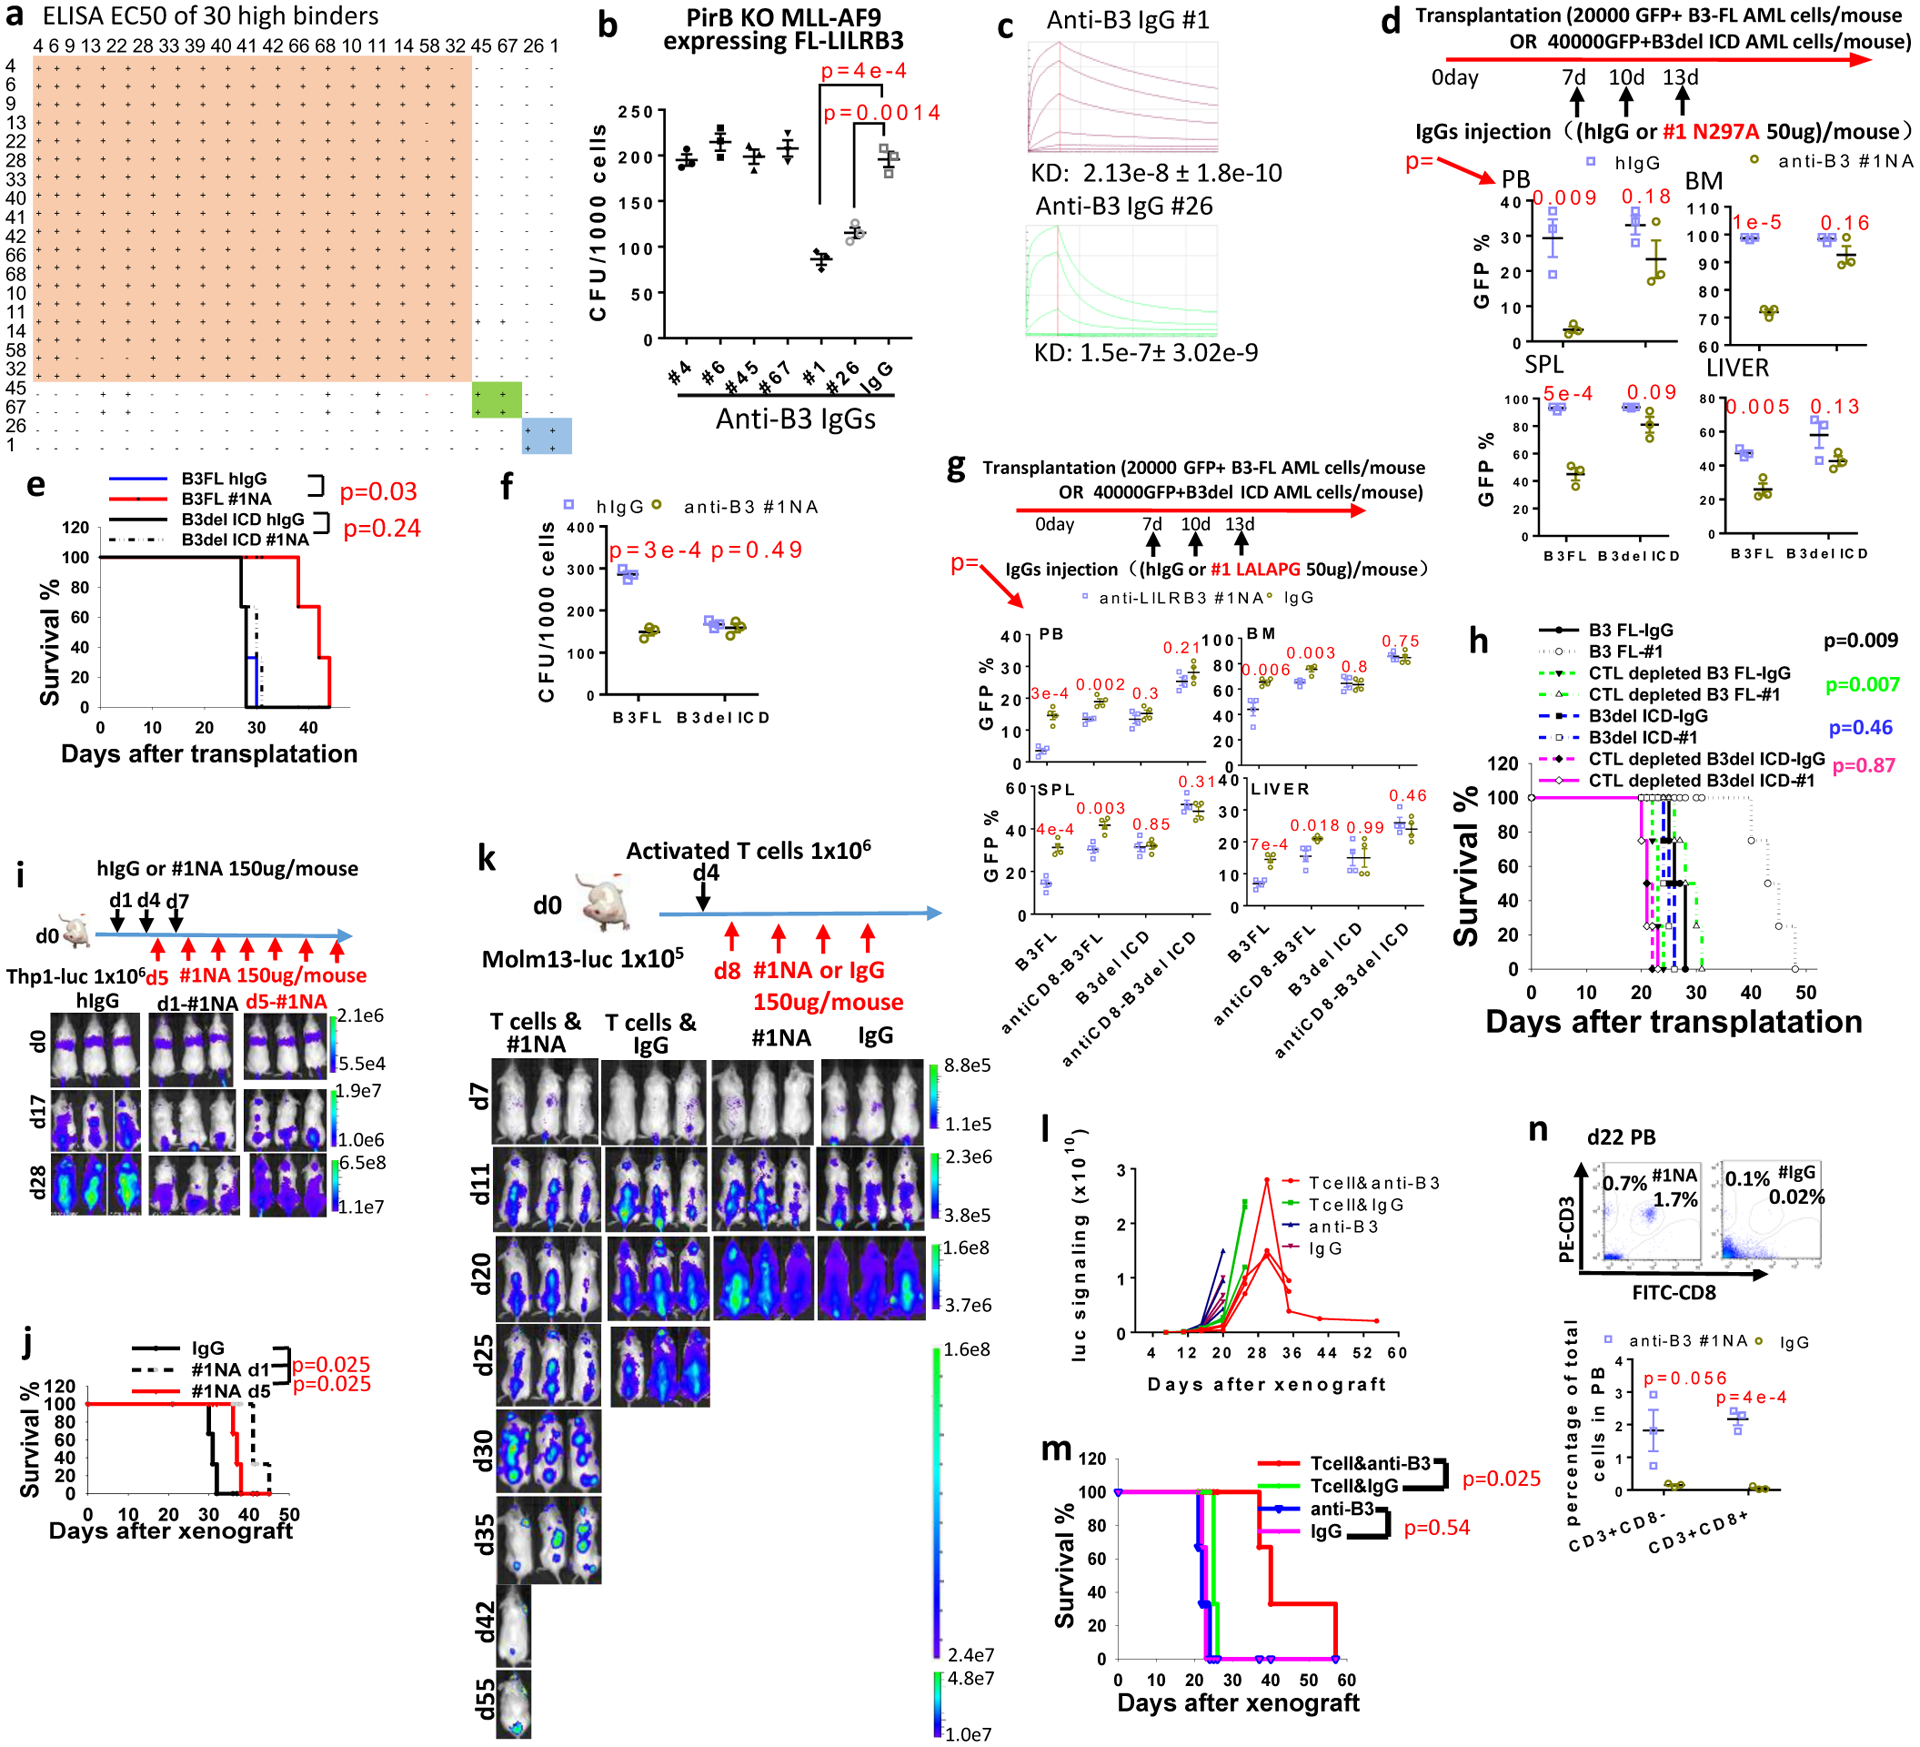
a, Epitope binning of 30 high-affinity IgGs. b, CFU assay of mouse MLL-AF9 AML cells in the presence of above IgGs (n=3 independent experiments). c, Binding affinities of the two IgGs from bin #3. d, Upper: Schematic of treatment. Lower: Percentages of GFP+ MLL-AF9 mouse AML cells in peripheral blood (PB), bone marrow (BM), spleen (SPL), and liver (LV) of mice transplanted with AML cells expressing B3-FL or B3delICD and injected with IgG or anti-LILRB3 #1 N297A (n=3 independent mice). e, Overall survival of mice transplanted with indicated AML cells as above. f, CFU assay of MLL-AF9 mouse AML cells expressing B3-FL or B3delICD in the presence of IgG or anti-LILRB3 #1 N297A (n=3 independent experiments) g, Upper: Schematic of treatment. Recipient mice were injected with mouse IgG or anti-mCD8 to deplete CD8 T cells. Lower: Percentages of GFP+ MLL-AF9 mouse AML cells in peripheral blood (PB), bone marrow (BM), spleen (SPL), and liver (LV) of mice transplanted with AML cells expressing B3-FL or B3delICD and injected with IgG or anti-LILRB3 #1 LALAPG (n=4 mice). h, Survival of mice as in panel h (n=4 independent mice). i, Upper: Schematic of treatment. Lower: Whole-body images of NSG mice transplanted with luciferase-expressing THP-1 cells and treated with IgG or anti-LILRB3 #1 N297A (#1NA). j, Overall survival of the mice shown in panel h (n=3 independent mice). k, Upper: Schematic of treatment. Lower: Whole-body images of NSG mice transplanted with luciferase-expressing Molm13 cells, injected with activated T cells, and treated with IgG or #1NA. l, Luciferase signaling as a function of time in mice treated as described in panel k. m, Overall survival of mice treated as described in panel k (n=3 independent mice). n, Analyses of T cells in peripheral blood of mice treated as described in panel l at 22 days after Molm13 AML cell transplantation. Upper: Flow cytometry analyses. Lower: Plot of T cell percentages (n=3 independent mice). The data are presented as mean ± s.e.m, and p values were calculated by two-tailed t-test except for e,h,j and m by log-rank test.
Anti-LILRB3 #1 N297A was injected into immuno-competent mice transplanted with MLL-AF9 AML cells expressing B3-FL or B3delICD. Compared to injection with control IgG, anti-LILRB3 #1 N297A significantly delayed development of LILRB3-expressing AML (Fig. 7d,e). In contrast, there was no detectable difference in B3del ICD AML development in mice treated with anti-LILRB3 #1 N297A and control IgG (Fig. 7d,e). In addition, anti-LILRB3 #1 N297A decreased CFU formation by B3-FL but not B3del ICD AML cells (Fig. 7f). Treatment with anti-LILRB3 #1 N297A did not decrease CFU formation of AML cells that express a mutant LILRB3 that cannot interact with TRAF2 (Extended Data Fig. 6g). When the recipient immuno-competent mice were injected with anti-mCD8 to deplete mouse CD8 T cells, the anti-AML effect of anti-LILRB3 #1 (with LALAPG mutant) diminished on AML with B3-FL (Fig. 7g, h). This suggests that blocking LILRB3 signaling enhances T cell killing of AML cells. We also injected AML immuno-competent mice with anti-LILRB3 #6 antibody, which cannot inhibit LILRB3 signaling (Fig. 7b). Anti-LILRB3 #6 suppresses the progresses of both AML with B3-FL and AML with B3del ICD with similar efficacies (Extended Data Fig. 6h, i). This result suggests that the Fc-mediated functions including antibody-dependent cellular cytotoxicity contribute to the anti-AML effects of anti-LILRB3 without LILRB3 signaling involved.
Anti-LILRB3 #1 N297A treatment of NSG mice xeongrafted with THP-1 cells also significantly delayed leukemia development compared to controls (Fig. 7i, j). The LILRB3 signaling in THP-1 cells decreased in NSG mice treated with anti-LILRB3 #1 N297A (Extended Data Fig. 6j).
We then injected NSG mice with activated human T cells four days after Molm13 AML cell transplantation (Fig. 7k). Anti-LILRB3 #1 N297A and control IgG were injected at day 8. Leukemia progression was significantly slower following anti-LILRB3 treatment than following IgG treatment. The leukemia in one of the anti-LILRB3-treated mice was largely eliminated (Fig. 7k, l). Under these conditions, however, the anti-LILRB3 showed little effect on mice without the injection of T cells (Fig. 7k–m), suggesting anti-LILRB3 #1 N297A enhances the anti-AML activity of T cells. There were significantly more T cells in the anti-LILRB3-treated mice than in the IgG-treated mice (Fig. 7n).
The efficacy of anti-LILRB3 antibody treatment was further tested in an M5 AML patient-derived xenograft models. LILRB3 was expressed on AML cells in the bone marrow of engrafted NSG mice as shown by flow cytometry analysis (Fig. 8a). Mice treated with anti-LILRB3 #1 N297A had significantly lower AML burden in peripheral blood, bone marrow, spleen, and liver than did mice treated with IgG (Fig. 8b). The anti-LILRB3 treatment also increased the percentages of human autologous T cells in the NSG mice (Fig. 8c). The mice treated with anti-LILRB3 had a significant survival advantage compared to mice treated with control IgG (Fig. 8d). In order to further dissect cell-autonomous and immune effects of the anti-LILRB3, NSG mice were transplanted with monocytic AML cells (derived from BM of NSG mice engrafted with monocytic AML patient peripheral blood samples) followed by treatment of IgG or anti-LILRB3 #1 LALAPG (Fig. 8e–i). The NSG mice were then injected with activated human T cells or PBS. The anti-LILRB3 #1 LALAPG significantly decreased AML development in this model, and transplantation of activated human T cells enhanced the anti-AML effect of anti-LILRB3 #1 LALAPG (Fig. 8e–i). These results indicate that the anti-AML efficacy of the anti-LILRB3 resulted from the combined effects of enhanced activity of tumor-specific T cells and direct leukemia killing.
Fig. 8|. Anti-LILRB3 blocking antibody prevents development of patient derived AML.
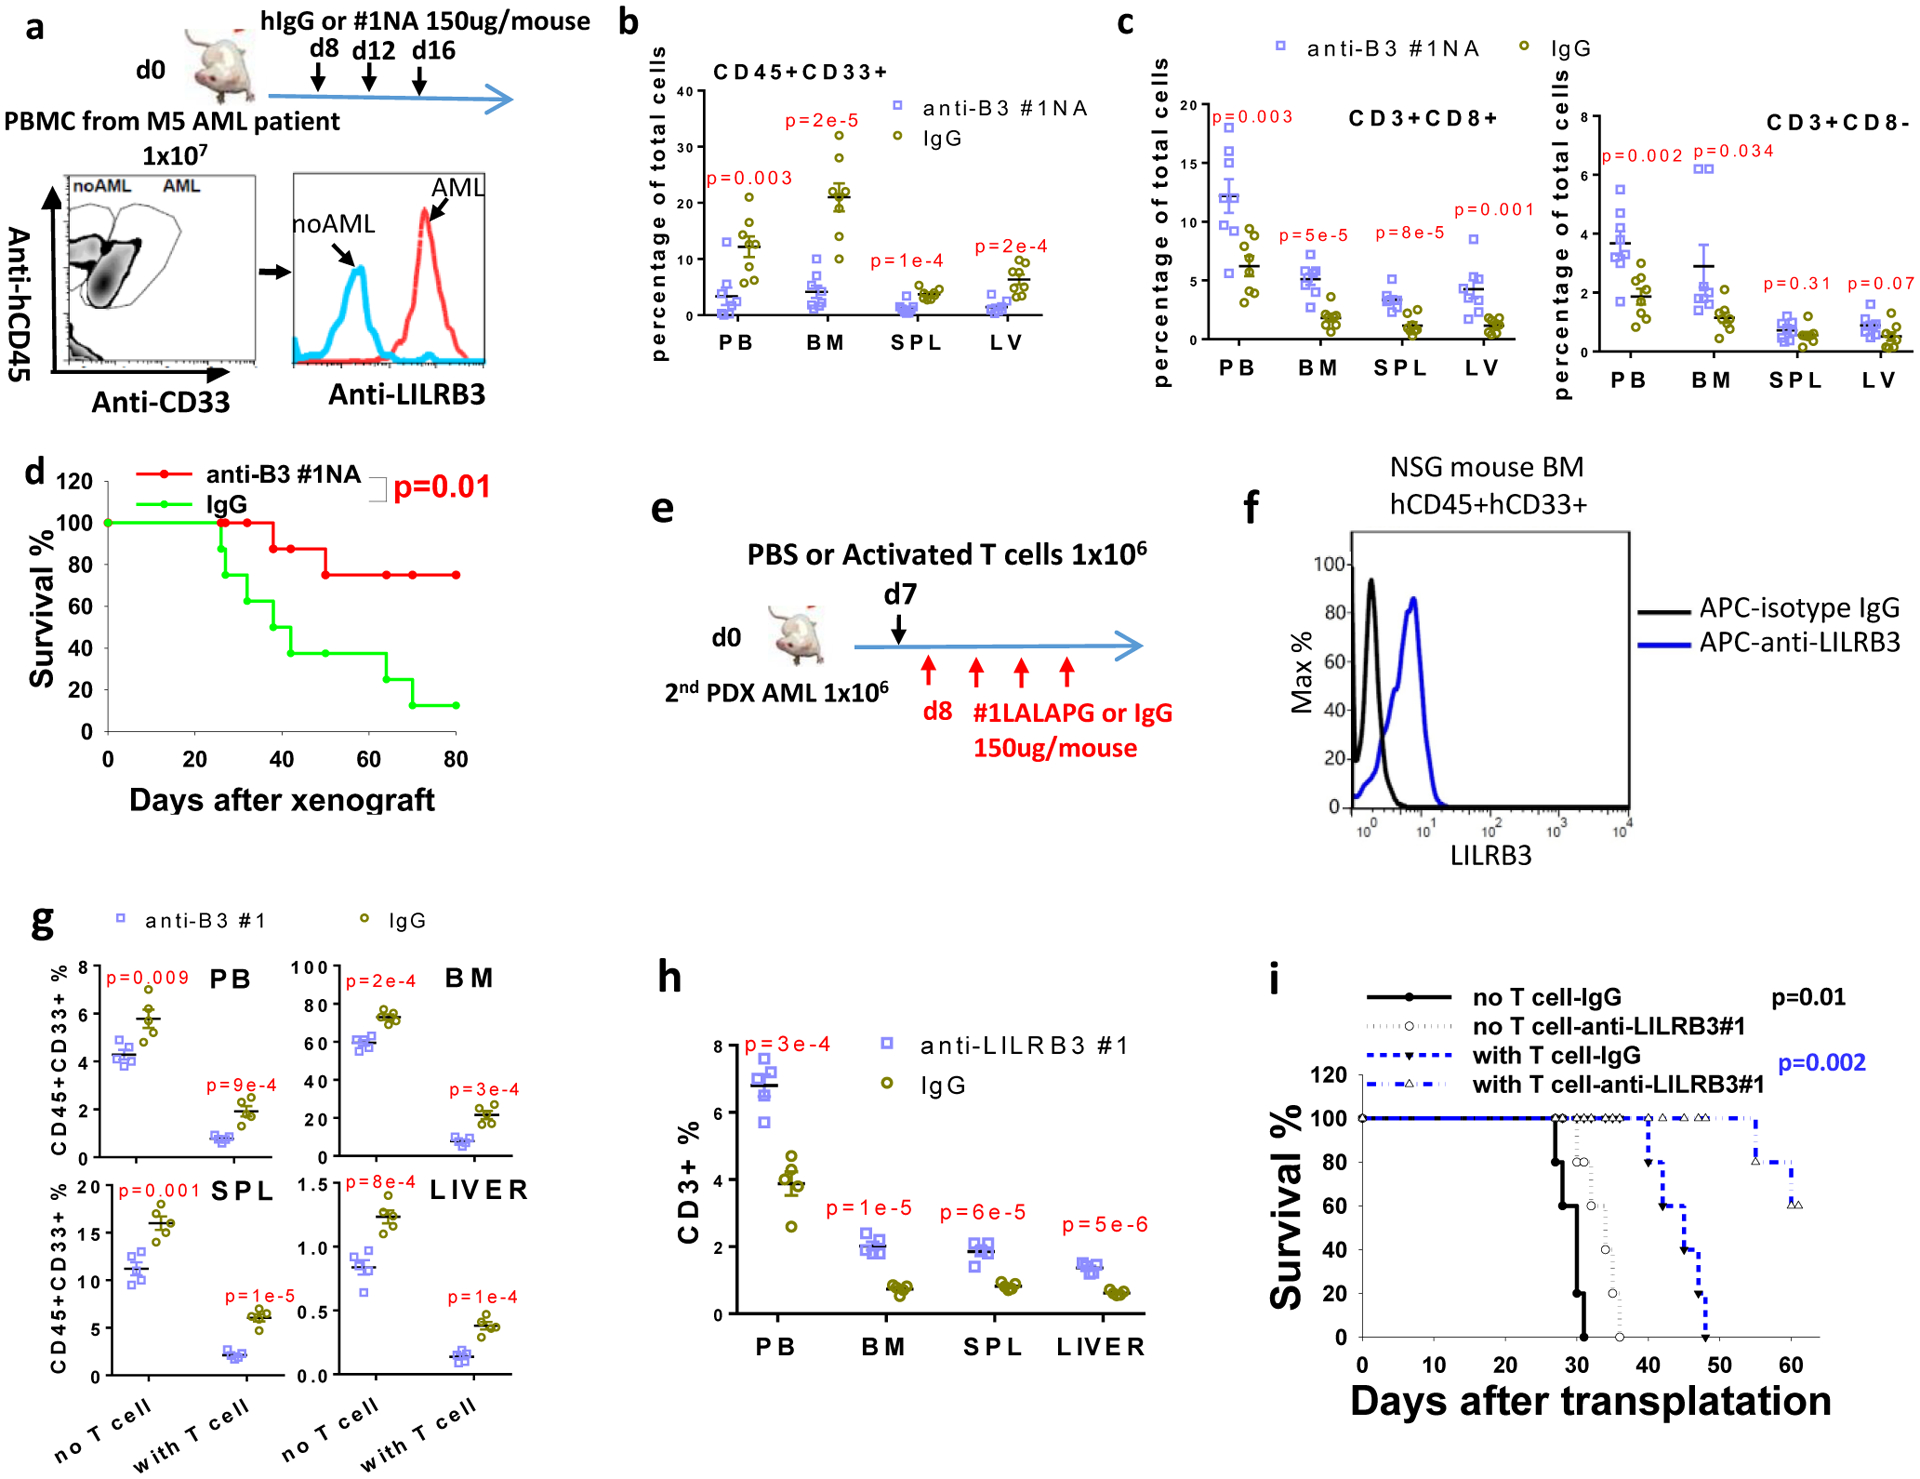
a, Upper: Schematic of treatment. NSG mice were transplanted with monocytic AML patient peripheral blood sample (depleted red blood cells) and given IgG or #1NA. Lower: FACS analyses of the mouse bone marrow cells (bone marrow samples stained with isotype IgGs were used as negative control) b, The percentages of human AML cells (CD45+/CD33+) in NSG mice after injection of IgG or #1NA treated as indicated in panel a (n=8 independent mice). c, The percentages of human T cells in NSG mice treated as indicated in panel a (n=8 independent mice). d, Overall survival of the NSG mice treated as indicated in panel a (n=8 independent mice). e, Schematic of treatment. NSG mice were transplanted with monocytic AML cells (derived from BM of NSG mice engrafted with monocytic AML patient peripheral blood samples) with treatment of IgG or anti-LILRB3 #1 LALAPG. f, Flow cytometry analyses of LILRB3 expression on human AML cells in the mouse bone marrow. g, The percentages of human AML cells (CD45+/CD33+) in NSG mice after treatment of IgG or #1NA as indicated in panel e. (n=5 independent mice). h, The percentages of human T cells in NSG mice treated as indicated in panel e (n=5 independent mice). i, Survival of NSG mice treated as indicated in panel e (n=5 independent mice). The data are presented as mean ± s.e.m, and p values were calculated by two-tailed t-test except for d and i by log-rank test.
Finally, we developed myeloid LysM-Cre driven LILRB3-transgenic C57BL/6 mice (Extended Data Fig. 7). The transgenic LILRB3 is expressed on myeloid cells. The treatment of these mice with anti-LILRB3 #1N297A antibody did not affect normal hematopoiesis and leukocytosis (Extended Data Fig. 7), suggesting low toxicity of the anti-LILRB3 #1N297A.
Discussion
Here we demonstrated that LILRB3, expressed on AML cells, stimulates NF-κB signaling by recruiting TRAF2 and cFLIP and that this upregulation of NF-κB signaling enhances survival of AML cells and inhibits the anti-leukemia activity of T cells. We also developed a blocking antibody that binds to LILRB3 and inhibits AML progression. Moreover, we showed that hyperactivation of of NF-κB signaling resulted in negative feedback and the predominance of LILRB3 inhibitory signaling.
ITIMs were the only known signaling motifs in LILRBs; recruitment of phosphatase SHP-1 or SHP-2 to the activated ITIMs leads to signaling inhibition10. Here we demonstrate that LILRB3 can also act as an activating receptor by interacting with TRAF2 and cFLIP. The unliganded LILRB3 constitutively associates with TRAF2. Once LILRB3 is activated by ligand binding, cFLIP is recruited to LILRB3/TRAF2 complex leading to NF-κB activation. The activated LILRB3 also recruits SHP-1 or SHP-2 to inhibit downstream signaling including NF-κB pathway. We showed that LILRB3, TRAF2, cFLIP, SHP-1, and SHP-2 are present in the same complex under certain conditions. However, a high level of NF-κB activation can result in multiple negative feedback signals, including upregulation of A20 that mediates TRAF2 degradation54. These, in turn destabilize the LILRB3/TRAF2 interaction; consequently, the inhibitory signaling initiated by SHP-1/2 becomes dominant.
It was suggested that the activity of the ITIM-containing inhibitory receptors requires ITAM-containing receptors60, and an ITIM-containing receptor cannot activate by itself but needs to interact with an activating receptor. When the ITAM-containing activating receptor is activated, its ITAM recruits the Src tyrosine kinase60, which phosphorylates and thus activates the ITIMs of the nearby inhibitory receptors. This model explains TCR, BCR, FcR coupled LILRB signaling in T and B cells. Nevertheless, in monocytic cells, LILRB4 clustering per se without crosslinking with an ITAM receptor can induce SHP-1 recruitment61. Here, our novel finding that LILRB3 can recruit TRAF2 and cFLIP to activate NF-κB further suggests that LILRB can mediate ITAM-independent signaling.
The balance of stimulatory and inhibitory effects of LILRB3 on NF-κB signaling may be different in different cell types. We speculate that inhibitory signaling by LILRB3 is dominant in normal monocytes. In contrast, AML cells, which have abnormally high expression of TRAF262, are biased toward more positive signaling. This supports tumor development by providing survival cues and by immune inhibition.
The LILRBs have been shown to be critical for leukemia progression10,16,18,63. The intracellular domains of different LILRBs differ64, suggesting that these receptors mediate distinct downstream signaling events. In the current study, we found that of LILRBs evaluated, only LILRB3 recruits TRAF2. TRAF2 can be specifically recruited by TNFR subfamily via the SKEE-like motif65. Interestingly, we identified the motif in the intracellular domain of LILRB3 critical for binding to TRAF2 as VQEE. TRAF2 binds with relatively low affinity to TNFR family members in the absence of activation66. LILRB3 constitutively binds to TRAF2, however.
Because LILRB3-mediated signaling in AML cells supports survival of these leukemia cells and inhibits the activity of cytotoxic T cells, it is desirable to develop anti-LILRB3 antagonizing antibodies that may block AML development. Here, we used functional assays to screen phage libraries and identified anti-LILRB3 antagonizing antibodies that demonstrated anti-AML efficacy. Mice that lack PirB, the mouse orthologue of LILRB3, have overall normal hematopoiesis36,67; therefore, targeting LILRB3 may effectively block AML development with a low toxicity. Our study may lead to development of a new strategy that combines targeted therapy and immunotherapy for treatment of AML and other types of cancer.
Methods
Mice
C57BL/6J and NOD-SCID IL2Rγ-null (NSG) mice were purchased from and maintained at the animal core facility of the University of Texas Southwestern Medical Center. GFP-specific TCR mice (Jedi mice, JAX lab stock No: 028062) were purchased from the Jackson Lab. C57BL/6J CD45.1 mice were injected intraperitoneally with 1×10⁶ irradiated MLL-AF9 mouse AML cells (3000 cGy) and LPS or LPS alone as a control. The injection was repeated 10 days later. C57BL/6J CD45.2 recipient mice were lethally irradiated (1000 cGy) and injected with mouse MLL-AF9 AML cells and 0.5×10⁶ CD45.2 bone marrow cells. NSG mice at 5–8 weeks old were engrafted with AML cells or human T cells via tail injection. Mice in each experiment were 5–8 weeks old female mice. All work in this study was approved by the UT Southwestern Institutional Animal Care and Use Committee.
LILRB3 transgenic mice
LILRB3 cDNA was constructed into pR26 CAG AsiSI/MluI. Then the plasmid was purified with high concentration in the absence of endotoxin. Cas9 RNA, gRNA targeting mouse Rosa26 locus and the LILRB3 plasmid co-injected into mouse oocytes at the transgenic core facility of UTSW. The LILRB3 positive mice were identified by LILRB3 specific primers and crossbred with LysMcre mice (JAX, 004781). The LILRB3+LysMcre+ mice were analyzed with co-expression of LILRB3 and Mac-1 or Gr-1 in peripheral blood, spleen and bone marrow.
Cell culture
THP-1, MV4–11, Molm13, U937, C1498 and 293T cells were purchased from ATCC. AML cell lines were cultured in RPMI-1640 with 10% FBS. Human anti-LILRB3 with the N297A mutation was coated onto the plate to activate LILRB3 signaling, and plates coated with human IgG (N297A) were used as controls. Cells infected with virus were cultured for at least an additional 3 weeks before analysis of LILRB3 signaling. Dead cells were identified using PI staining. Primary human T cells were isolated by autoMACS from donor PBMCs, stimulated with anti-CD3 and anti-CD28, and cultured in RPMI-1640 in the presence of IL-2. For the cytotoxic T lymphocyte assay, human AML cells were stained with CFSE and mixed at different ratios with activated T cells. After 10 hours, the percentage of PI-positive CFSE-stained AML cells was determined by FACS.
Flow cytometry
Primary antibodies including anti-mouse CD8a-PE (BioLegend, 100707, 53–6.7, 1:100), anti-mouse CD45-PE (BD Pharmingen,561087, 30-F11, 1:100), anti-mouse CD45.1-FITC (BioLegend, 110705, A20, 1:100), anti-mouse CD45.2-PE (BioLegend, 109807,104, 1:100), anti-human CD45-PE (BD Pharmingen, 555483, HI30, 1:100), anti-human CD33-APC (Biolegend,366605, P67.6, 1:100), anti-human CD3-FITC (BioLegend, 300305, HIT3a, 1:100), anti-human CD8-PE (BD Pharmingen, 555367, RPA-T8, 1:100) antibodies were used. Cells were run on Calibur for analysis or FACSAria for sorting.
Plasmids
TRAF2 and cFLIP were cloned from human cDNA. LILRB3, TRAF2, cFLIP, and dominant-negative TRAF2 (245–501) were constructed in the pLVX-IRES-ZsGreen vector. LILRBs, LAIR1, LILRB3 fragments, and chimeric protein CAR-LILRB3 were fused with hFc at C-termini in the pFLAG-CMV5.1 vector. LILRB3-specific shRNAs were constructed in pLL3.7. Tet-on cFLIP and Cre were constructed by replacing Cas9 in the plasmid pCW-Cas9 with FL-cFLIP and Cre, respectively. For infection of mouse cells, full-length LILRB3 was inserted into the MSCV-IRES-GFP vector to create B3-FL; LILRB3 with the intracellular domain deleted was inserted into the MSCV-IRES-GFP vector to create B3del ICD.
NF-κB reporter assay and LILRB3 chimeric receptor reporter assay
THP-1-Lucia™ NF-κB cells were purchased from InvivoGen. Human anti-LILRB3 antibody with the N297A mutation was coated onto the plate to activate LILRB3 signaling, and plates coated with hIgG (N297A) were used as the control. The activation of NF-κB signaling was evaluated by monitoring luciferase signal. Infected THP-1 reporter cells were cultured for an additional month before stimulation with anti-LILRB3. For the NF-κB reporter assay conducted in 293T cells, an NF-κB-driven firefly luciferase reporter plasmid co-transfected with a plasmid encoding CMV-driven Renilla luciferase along with plasmids expressing LILRB3, TRAF2, or cFLIP were transfected into cells. The luciferase activity was detected using the Dual-Luciferase® Reporter (DLR™) Assay System (Promega). LILRB3 chimeric receptor reporter cells were constructed as we described68–70, with LILRB3-ECD fused with the transmembrane and intracellular domains of paired immunoglobulin-like receptor β, which signals through the adaptor DAP-12 to activate the NFAT promoter.
Virus production and infection
For lentivirus production, plasmid pLL3.7 shRNA and pLVX-IRES-ZsGreen cFLIP, dominant-negative TRAF2, or tet-on pCW-Cre were mixed with psPAX2 and pMD2.G at a ratio of 4:3:1 and transfected into 293T cells using polyjet (SignaGen). To produce retrovirus, plasmid MSCV-IRES-GFP with B3-FL or B3del ICD were mixed with pCL-ECO (2:1) and transfected into 293T cells. The supernatant containing virus was collected 48–72 hours after transfection. Human AML cell lines were infected with virus supernatant by centrifugation at 1800 rpm at 37 °C for 2 hours following three hours’ incubation before changing to the regular culture medium. Fresh mouse MLL-AF9 AML cells were infected with virus supernatant mixed with StemSpan (StemCell) with mSCF, IL3, and IL6. After infection, the virus supernatant was replaced with StemSpan with mSCF, IL3, and IL6. Cells were cultured for an additional 2 days before isolating infected cells.
Primary human leukemia
The primary human AML samples was obtained from the University of Texas Southwestern Medical Center. The informed consent was obtained and approved by the Institutional Review Board of the University of Texas Southwestern Medical Center (IRB STU 122013–023). For primary transplantation, leukemia cells isolated from donor peripheral blood was injected into irradiated NSG mice (200 cGy), and antibody or IgG was introduced intravenously 8 days after injection. For secondary transplantation, human leukemia cells from frozen BM of NSG mice that were engrafted with patient AML cells were transplanted into sublethally-irradiated NSG recipients.
Western blotting and co-immunoprecipitation
Cells were lysed with RIPA buffer containing protease inhibitor (Roche Diagnostic). Samples were mixed with 2X SDS loading buffer and separated by SDS-PAGE. After transfer to nitrocellulose membranes, the protein was detected with specific primary antibodies and HRP-conjugated secondary antibodies. The primary antibodies were anti-cFLIP (R&D Systems, MAB8430, 1:500), anti-LILRB3 (R&D Systems, MAB1806, 1:500), anti-TRAF2 (Novus Biologicals, NB100–56715, 1:500), anti-HA (BioLegend 901513 1:2000), anti-FLAG (BioLegend, 637319, 1:2000), Anti-MLKL (phospho S358, abcam, ab187091, 1:500), Anti-MLKL (abcam, ab184718, 1:1000) and anti-actin (BioLegend, 664801, 1:10000). For immunoprecipitation, cells were lysed with Pierce IP Lysis Buffer (Thermo Fisher Scientific, 87787). A total of 1×10⁹ primary M5 AML leukemia cells were lysed for analyzing the interaction of LILRB3 and TRAF2, and the LILRB3 and TRAF2 complex was immunoprecipitated with human anti-LILRB3 N297A mutant. HA- or FLAG-tagged TRAF2 and cFLIP were co-expressed with hFc-tagged LILRB3 or LILRB3 fragments in 293T cells. Dynabeads protein A (Thermo Fisher Scientific, 10001D) was used in all co-immunoprecipitation. For evaluating the interaction of TRAF2 and LILRB3 in vitro, purified GST-TRAF2 (MyBioSource, MBS515700) was incubated with Dynabeads protein A binding with the intracellular domain of LILRB3 fused with hFc at C terminal overnight at 4 °C.
Quantitative RT-PCR
Total RNA was isolated from AML cells or primary CD14+ monocytes isolated from PBMC. First-strand cDNA was synthesized with a High-Capacity cDNA Reverse Transcription Kit (Applied Biosystems). The following primers were ordered from Sigma: 5’-GAAGAAACTCAACTGGTGTCG-3’ and 5’-CCAAGTCTGTGTCCTGAACG-3’ to detect TNFAIP3F, 5’-GAAGGCTACCAACTACAATGG-3’ and 5’-TTCAACAGGAGTGACACCAG-3’ to detect NFKB1AF, 5’-GAATCACCAGCAGCAAGTG-3’ and 5’-CTTCGGAGTTTGGGTTTG-3’ to detect CCL2, 5’-TTGTGCGTCTCCTCAGTAAA-3’ and 5’-CAAGTGAAACCTCCAACCC-3’ to detect CCL20, 5’-CATTGAGGAGGATTGCCAAA-3’ and 5’-ACAAACTGGATGTCGCTGG-3’ to detect Myd88, 5’-ACGCTCTTCTGCCTGCT-3’ and 5’-GCTTGAGGGTTTGCTACAA-3’ to detect TNFa, 5’-TGGCTTATTACAGTGGCAATG-3’ and 5’-TGGTGGTCGGAGATTCGT-3’ to detect IL1B, 5’- CTTTCTGCTGACATCGCC-3’ and 5’-GTCTGCCGTAGGTTGTTGTA-3’ to detect BCL3, 5’-ACGCAGACATCGTCATCC-3’ and 5’-CAAACCGAGTTGGAACCAC-3’ to detect MMP9, 5’-CATACTTACCCACTTCAAGGG-3’ and 5’-TTGTAGCCATAGTCAGCATTGT-3’ to detect PTGS2, and 5’-GATGGGGTCTTCATCTG-3’ and 5’-CGTAGGTGGATGCCTCC-3’ to detect TRAF2. The mRNA levels were normalized to the level of GAPDH present in the same sample.
TCGA analyses
The AML patient data were obtained from TCGA (version: August 16, 2016) and classified into AML subtypes (FAB classification). The mRNA levels were determined by RNA-seq, and LILRB3 expression of each subtype was averaged. The overall survival was analyzed based on LILRB3 expression and the corresponding patient survival data. Patients were grouped based on significant LILRB3 expression cutoff for survival analysis.
RNA-seq analysis
RNA was extracted from AML cells using the Qiagen RNeasy Mini kit according to the manufacturer’s instructions, and then reverse-transcribed with SuperScript III Reverse Transcriptase (Invitrogen). RNA-seq was performed as previously reported18.
GESA analysis
Gene set enrichment analysis was performed using GSEA v4.0 software71 (http://www.broadinstitute.org/gsea/index.jsp) with 1000 phenotype permutations.
Generation of LILRB3 antibody
Phage panning:
A complete human scFv phage library was generated in house and used for LILRB3 antibody panning. Briefly, human LILRB3 extracellular domain protein was coated onto wells of a 96-well plate, a pre-blocked phage library was added to LILRB3-coated wells, and samples were incubated for 2 hours at room temperature. Wells were washed to remove unbound phage, and bound phage were eluted and used to infect TG1 bacterial for amplification. The panning process was repeated to enrich for high-affinity binders.
VH and VL sequence evaluation:
Sequences of phage bound to LILRB3 were analyzed using GeneBank IgBLAST1.10.0 to identify germline V(D)J gene segments. Individual VH and VL genes were mapped to the germline of major IGL and IGH locus. Framework and CDR sequences were annotated according to IMGT (http://www.imgt.org/) nomenclature.
Cloning of VH and VL encoding genes into full human IgG vector:
The VH and VL encoding genes from the phage plasmids were cloned into a human IgG-expressing vector. Briefly, DNA fragments encoding VH and VL were amplified by PCR using family-leader region-specific primers. The PCR product of VH and VL genes, around 400 bp, were collected and purified for infusion PCR. Infusion PCR was carried out using the In-Fusion® HD Cloning kit (Clontech).
Expression of antibodies by HEK293F cells:
Human anti-LILRB3 antibodies were expressed in mammalian cells (HEK293F) and purified using affinity chromatography with Protein A resin. Briefly, equal molar amounts of heavy-chain and light-chain plasmids were co-transfected into HEK293F cells for transient expression of antibodies. Supernatants were harvested after 7 days in culture, and IgGs were purified with Protein A resin (GE Healthcare).
Affinity measurement and epitope binning:
Affinity measurement and epitope binning were done as described previously19. Briefly, antibody affinity was analyzed with the Octet RED96 instrument. Antibody (30 mg/mL) was loaded onto the protein A biosensors then exposed to a series of concentrations of recombinant LILRB3 (0.1–200 nmol/L), and background subtraction was used to correct for sensor drift. ForteBio’s data analysis software was used to extract association and dissociation rates assuming a 1:1 binding model. The Kd was calculated as the ratio koff/kon. Epitope binning of anti-LILRB3 rabbit antibodies was performed with an Octet RED96 instrument using a classical sandwich epitope binning assay. In these epitope binning assays, primary antibodies (40 μg/ml) were loaded onto protein A biosensors, and remaining Fc-binding sites on the sensor were blocked with a human non-targeting IgG (200 μg/ml). The sensors were then exposed to the 1 μM LILRB3 diluted in 1× kinetics buffer, followed by the secondary antibodies (40 μg/ml). Raw data were processed using ForteBio’s Data Analysis Software 7.0. Antibody pairs were assessed for competitive binding. Additional binding by the secondary antibody indicates an unoccupied epitope (the antibodies of the pair are not competitors), and no binding indicates epitope blocking (the antibodies of the pair are competitors for the same epitope).
Statistics and Reproducibility
Statistical significance of differences was assessed using the two-tailed Student’s t-test. Animal survival analysis was assessed with the log rank test. A p-value of 0.05 or less was considered significant. Values are reported as mean ± s.e.m. All replicates for in vitro data are derived from independent experiments. No statistical method was used to predetermine sample size. No data were excluded from the analyses. Experiments using cultured cells and mice were randomized. For detecting protein levels inside the cells and interactions of proteins, immune blotting was conducted and repeated twice for confirming the results.
Extended Data
Extended Data Fig. 1 |. LILRB3 enhances AML cell survival and promotes monocytic AML progression.
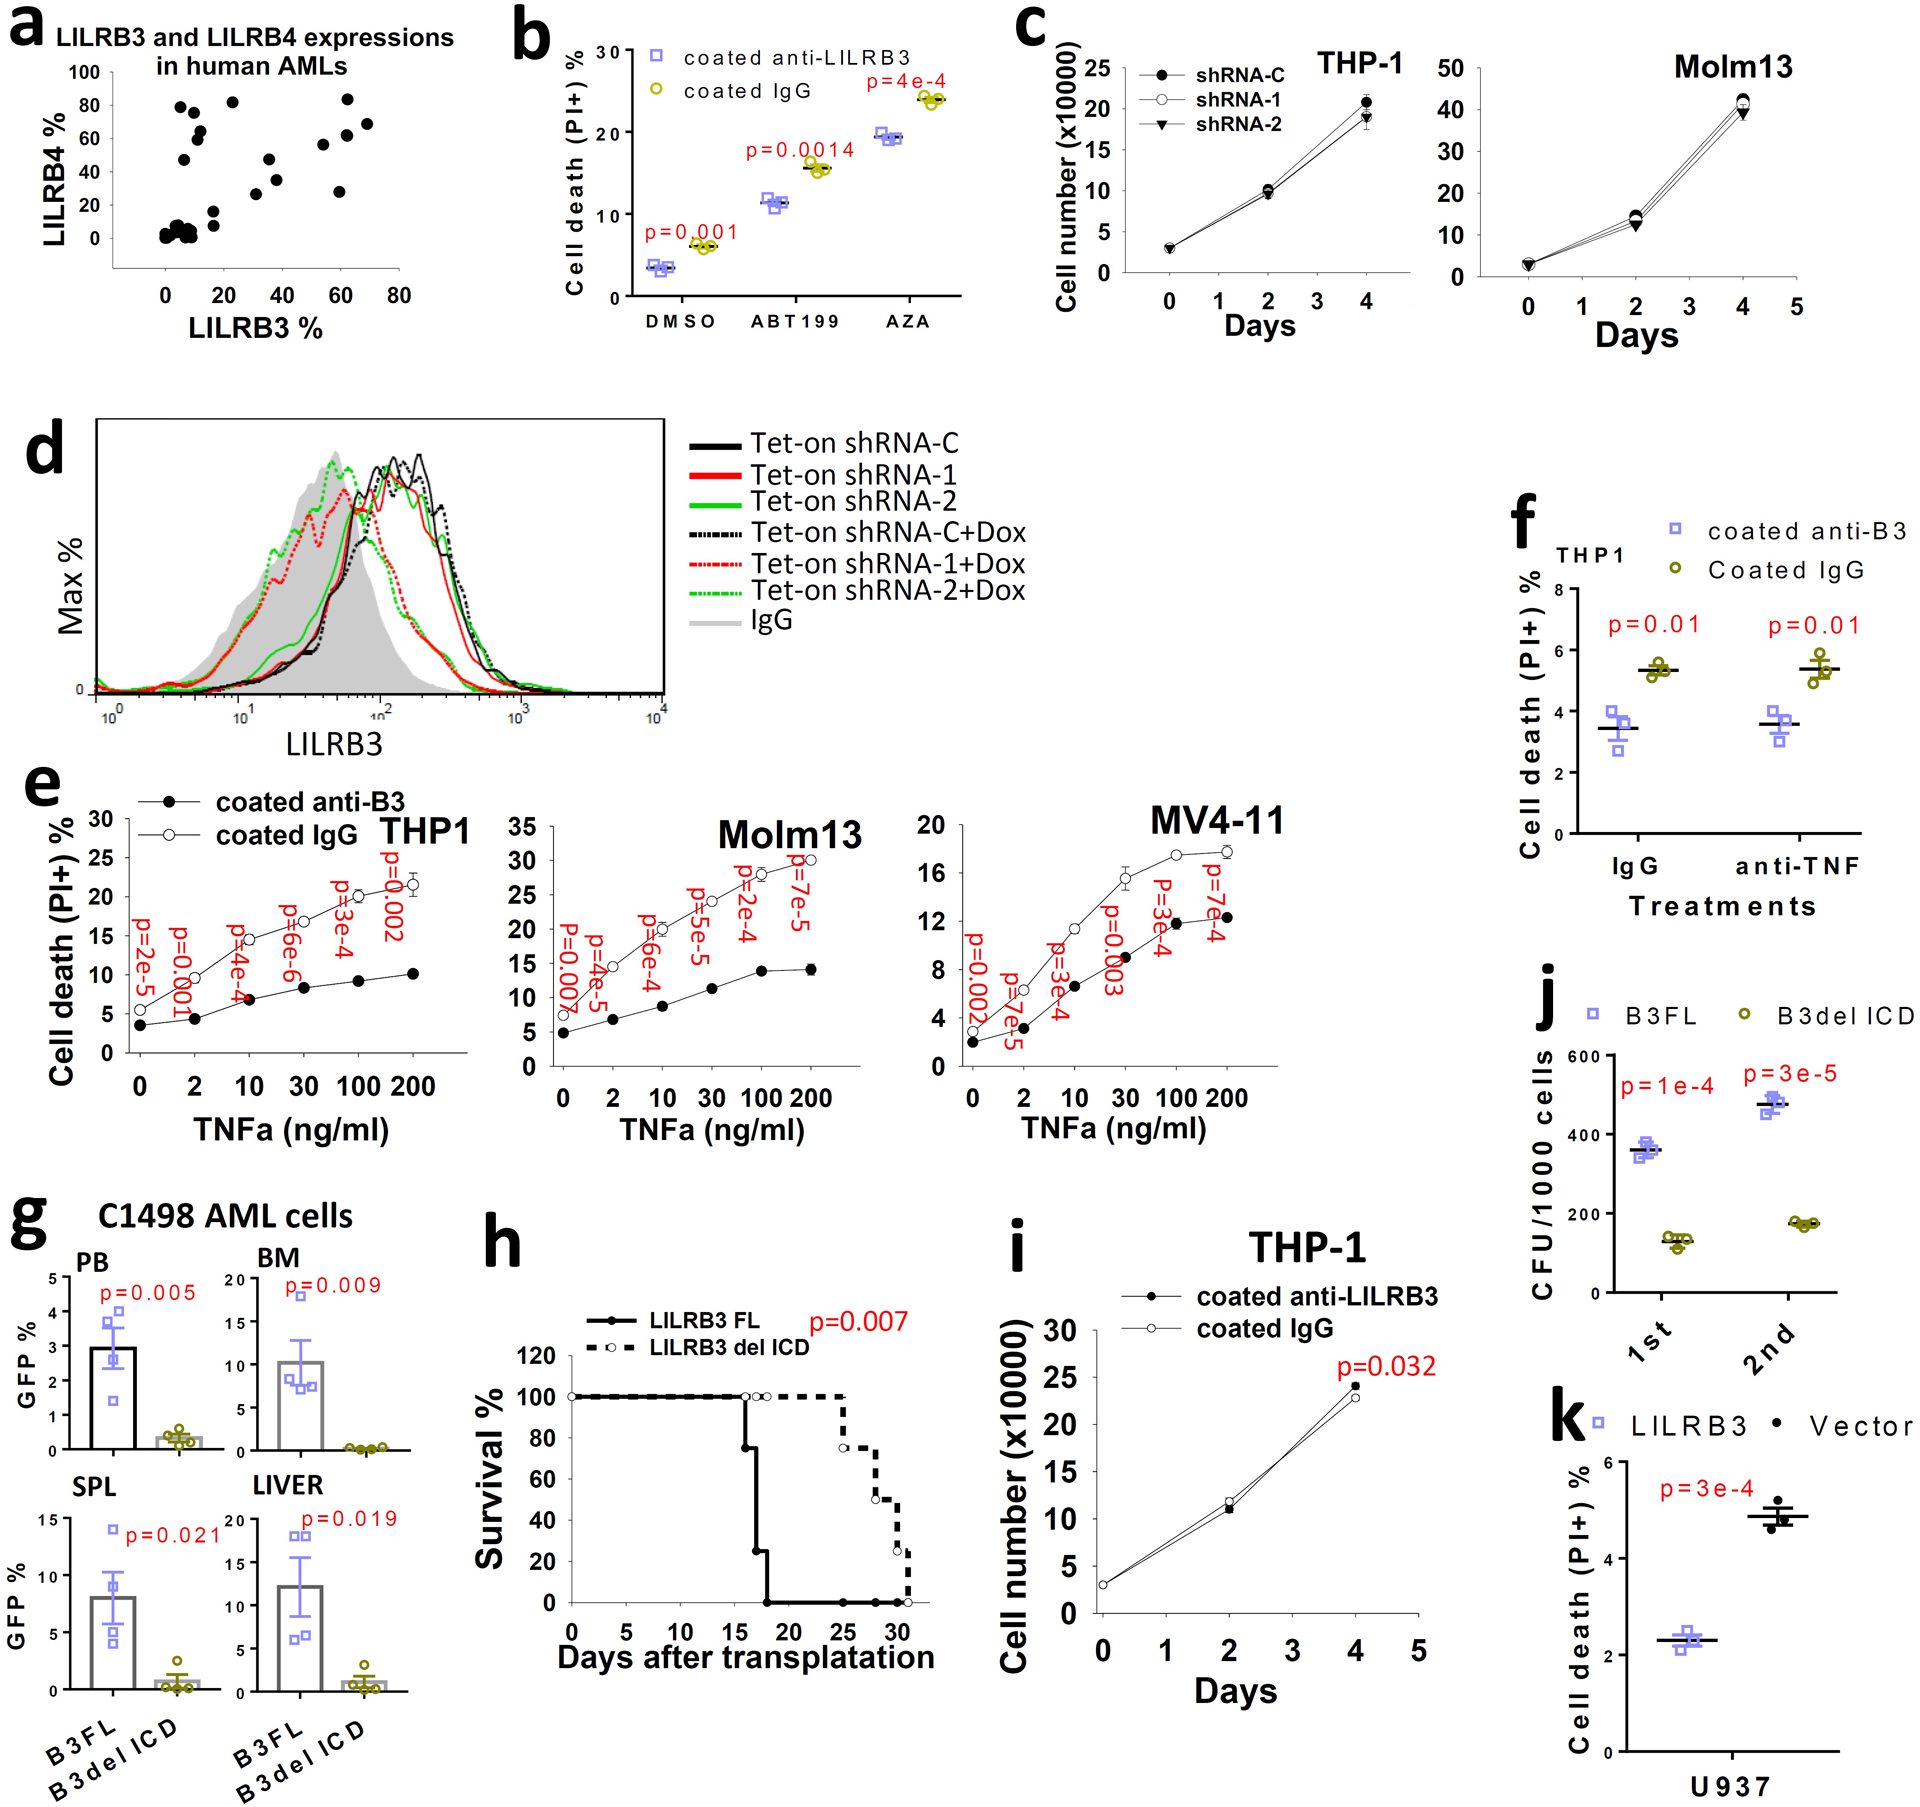
a, Analysis of LILRB3 and LILRB4 expression in patient AML samples (n=35) as determined by flow cytometry. b. The cell death of THP-1 cells cultured with coated anti-LILRB3 or IgG in presence of DMSO, ABT199 (1 μM) or AZA (10 μM). (n=3 independent cell cultures). c. Knockdown of LILRB3 in AML cell lines does not affect cell growth in culture (n=3 independent cell cultures). d. THP-1 cells expressing Tet-on Cre and loxp U6 driven shRNAs were treated with Dox (1 μg/ml) for one day, and surface LILRB3 expression was analyzed by flow cytometry one week later. e, Percentages of dead cells in AML cultures treated with anti-LILRB3 antibody or IgG in the presence of different concentrations of TNFα (n=3 independent cell cultures). f, Percentages of dead cells in THP-1 cells treated with anti-LILRB3 antibody or IgG in the presence of anti-TNFα (5 μg/ml) or control IgG (n=3 independent cell cultures). g, Percentages of GFP+ AML cells in peripheral blood (PB), bone marrow (BM), spleen (SPL), and liver of mice transplanted with C1498 AML cells expressing B3-FL or B3del ICD (n=4 mice). h, Survival curve of the mice treated as in panel e. i, THP-1 cell growth in plates coated anti-LILRB3 or IgG (n=3 independent cell cultures). j, Serial colony-forming unit (CFU) replating with MLL-AF9 mouse AML cells (n=3 independent cell cultures). k, Percentages of dead cells in U937 cells overexpressing LILRB3 or a control vector (n=3 wells). The data are presented as mean ± s.e.m, and p values were calculated by two-tailed t-test except for h by log-rank test.
Extended Data Fig. 2. |. LILRB3 increases the survival of monocytic AML cells against cytotoxic T cells.
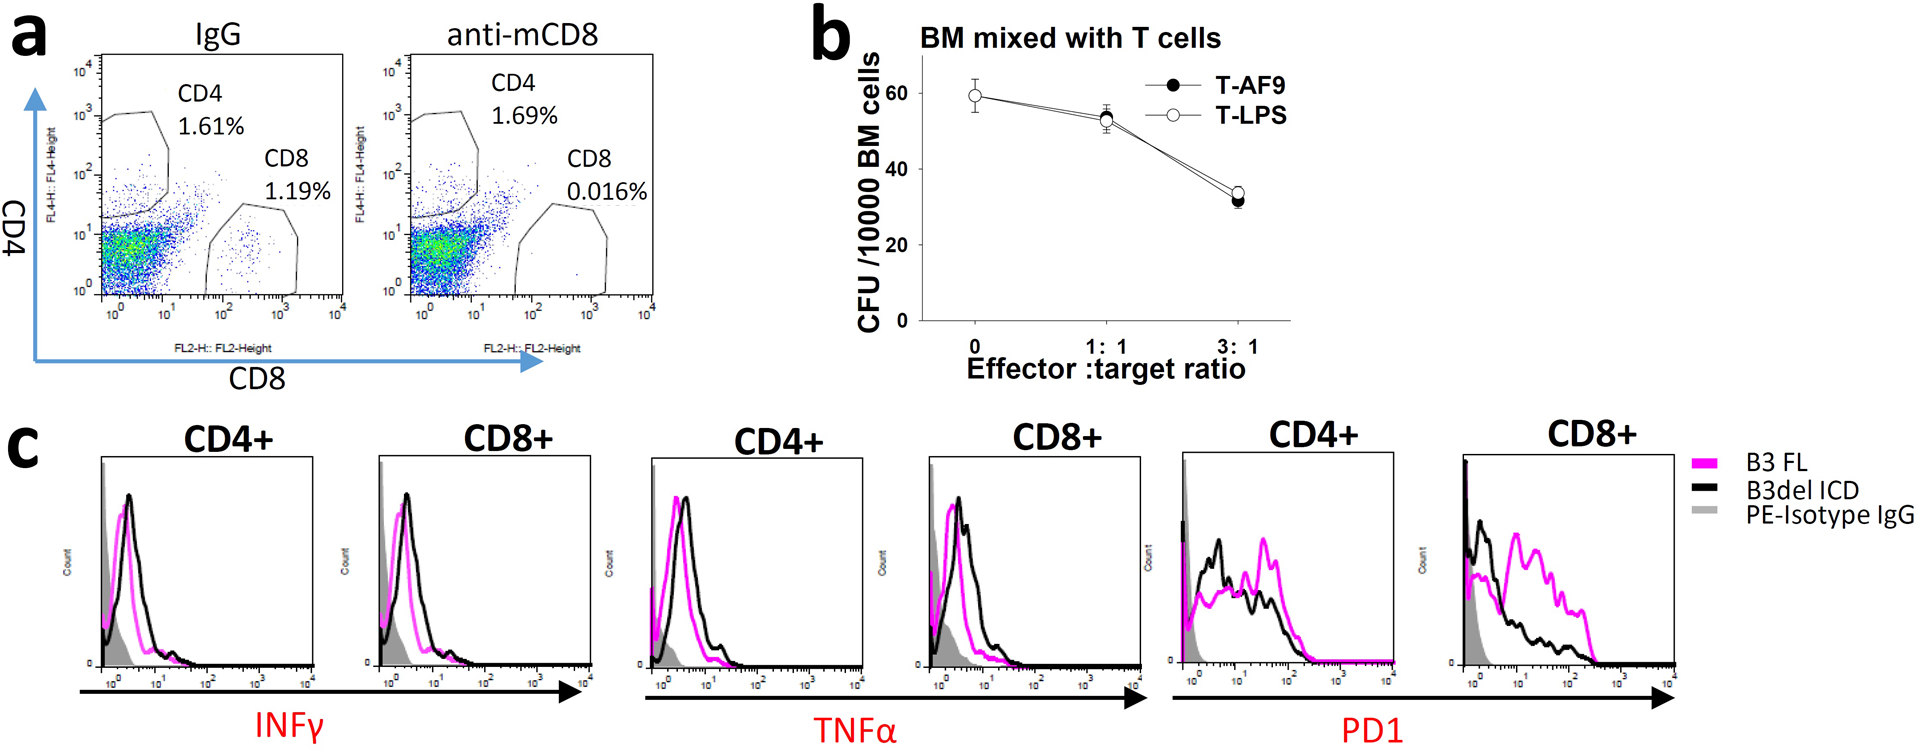
a, Percentages of CD4 and CD8 T cells in spleens of mice injected with mouse IgG or anti-mCD8 (10 mg/kg). b, CFU assays (MethoCult™ GF M3434) of regular BM cells mixed with mouse T cells specific to MLL-AF9 AML cells (T-AF9) or non-specific T cells (T-LPS) (n=3 independent cell cultures). c, Expression of INFγ,TNFα, and PD-1 on CD4 and CD8 T cells from spleens of mice engrafted with MLL-AF9 AML cells expressing LILRB3 FL or LILRB3 with intracellular domain truncation.
Extended Data Fig. 3 |. LILRB3 enhances NF-κB signaling but not JNK signaling.
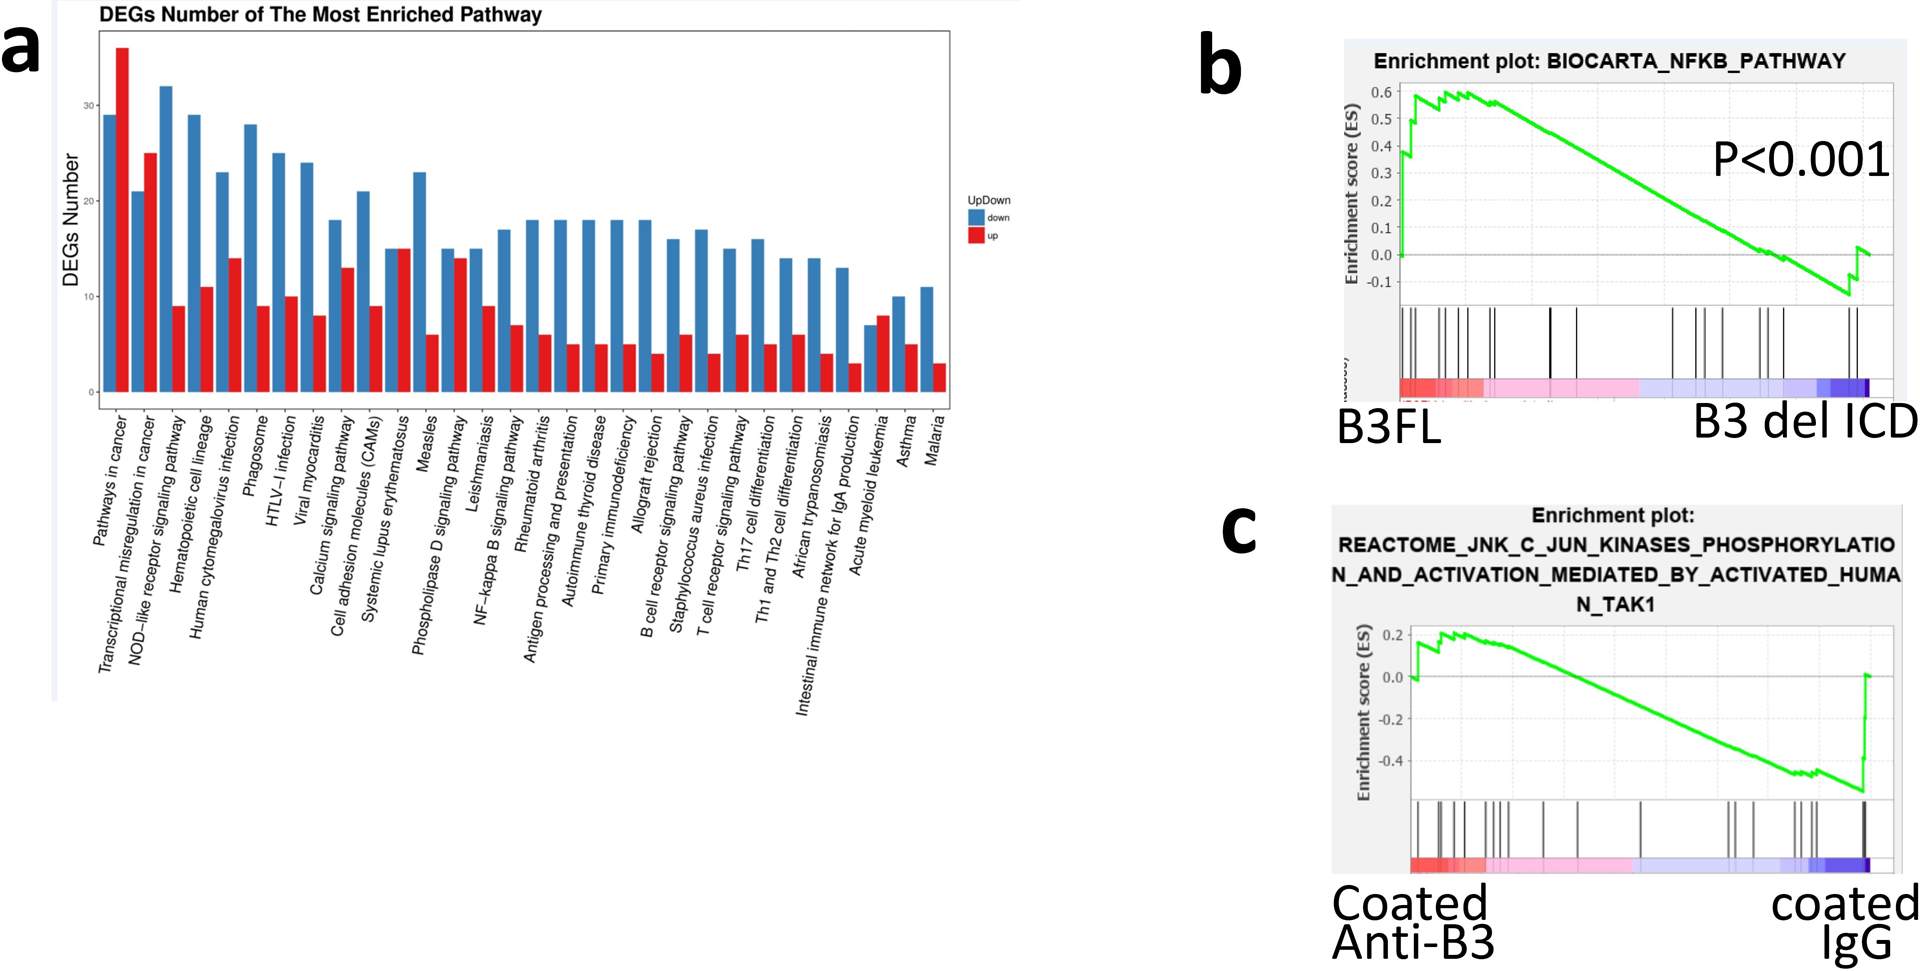
a, KEGG analysis of the top 20 processes affected by LILRB3 in mouse MLL-AF9 AML cells with whole-genome RNA-seq analysis. RNA was isolated from mouse MLL-AF9 AML cells expressing B3-FL or B3del ICD. “Down” and “Up” indicate genes expressed at lower or higher levels in AML cells that express B3del ICD versus those that express B3-FL. b, GSEA of the correlation between NF-κB signaling and LILRB3 in mouse MLL-AF9 AML cells (p values were calculated by Kolmogorov Smirnov (K-S) test in GSEA analysis). c, LILRB3 does not enhance the JNK signaling. GSEA of gene expression in THP-1 cells cultured in plates coated with anti-LILRB3 antibody or IgG.
Extended Data Fig. 4 |. TRAF2 and cFLIP interact, stimulate NF-κB signaling, and increase resistance of AML cells to the killing of cytotoxic T cells.
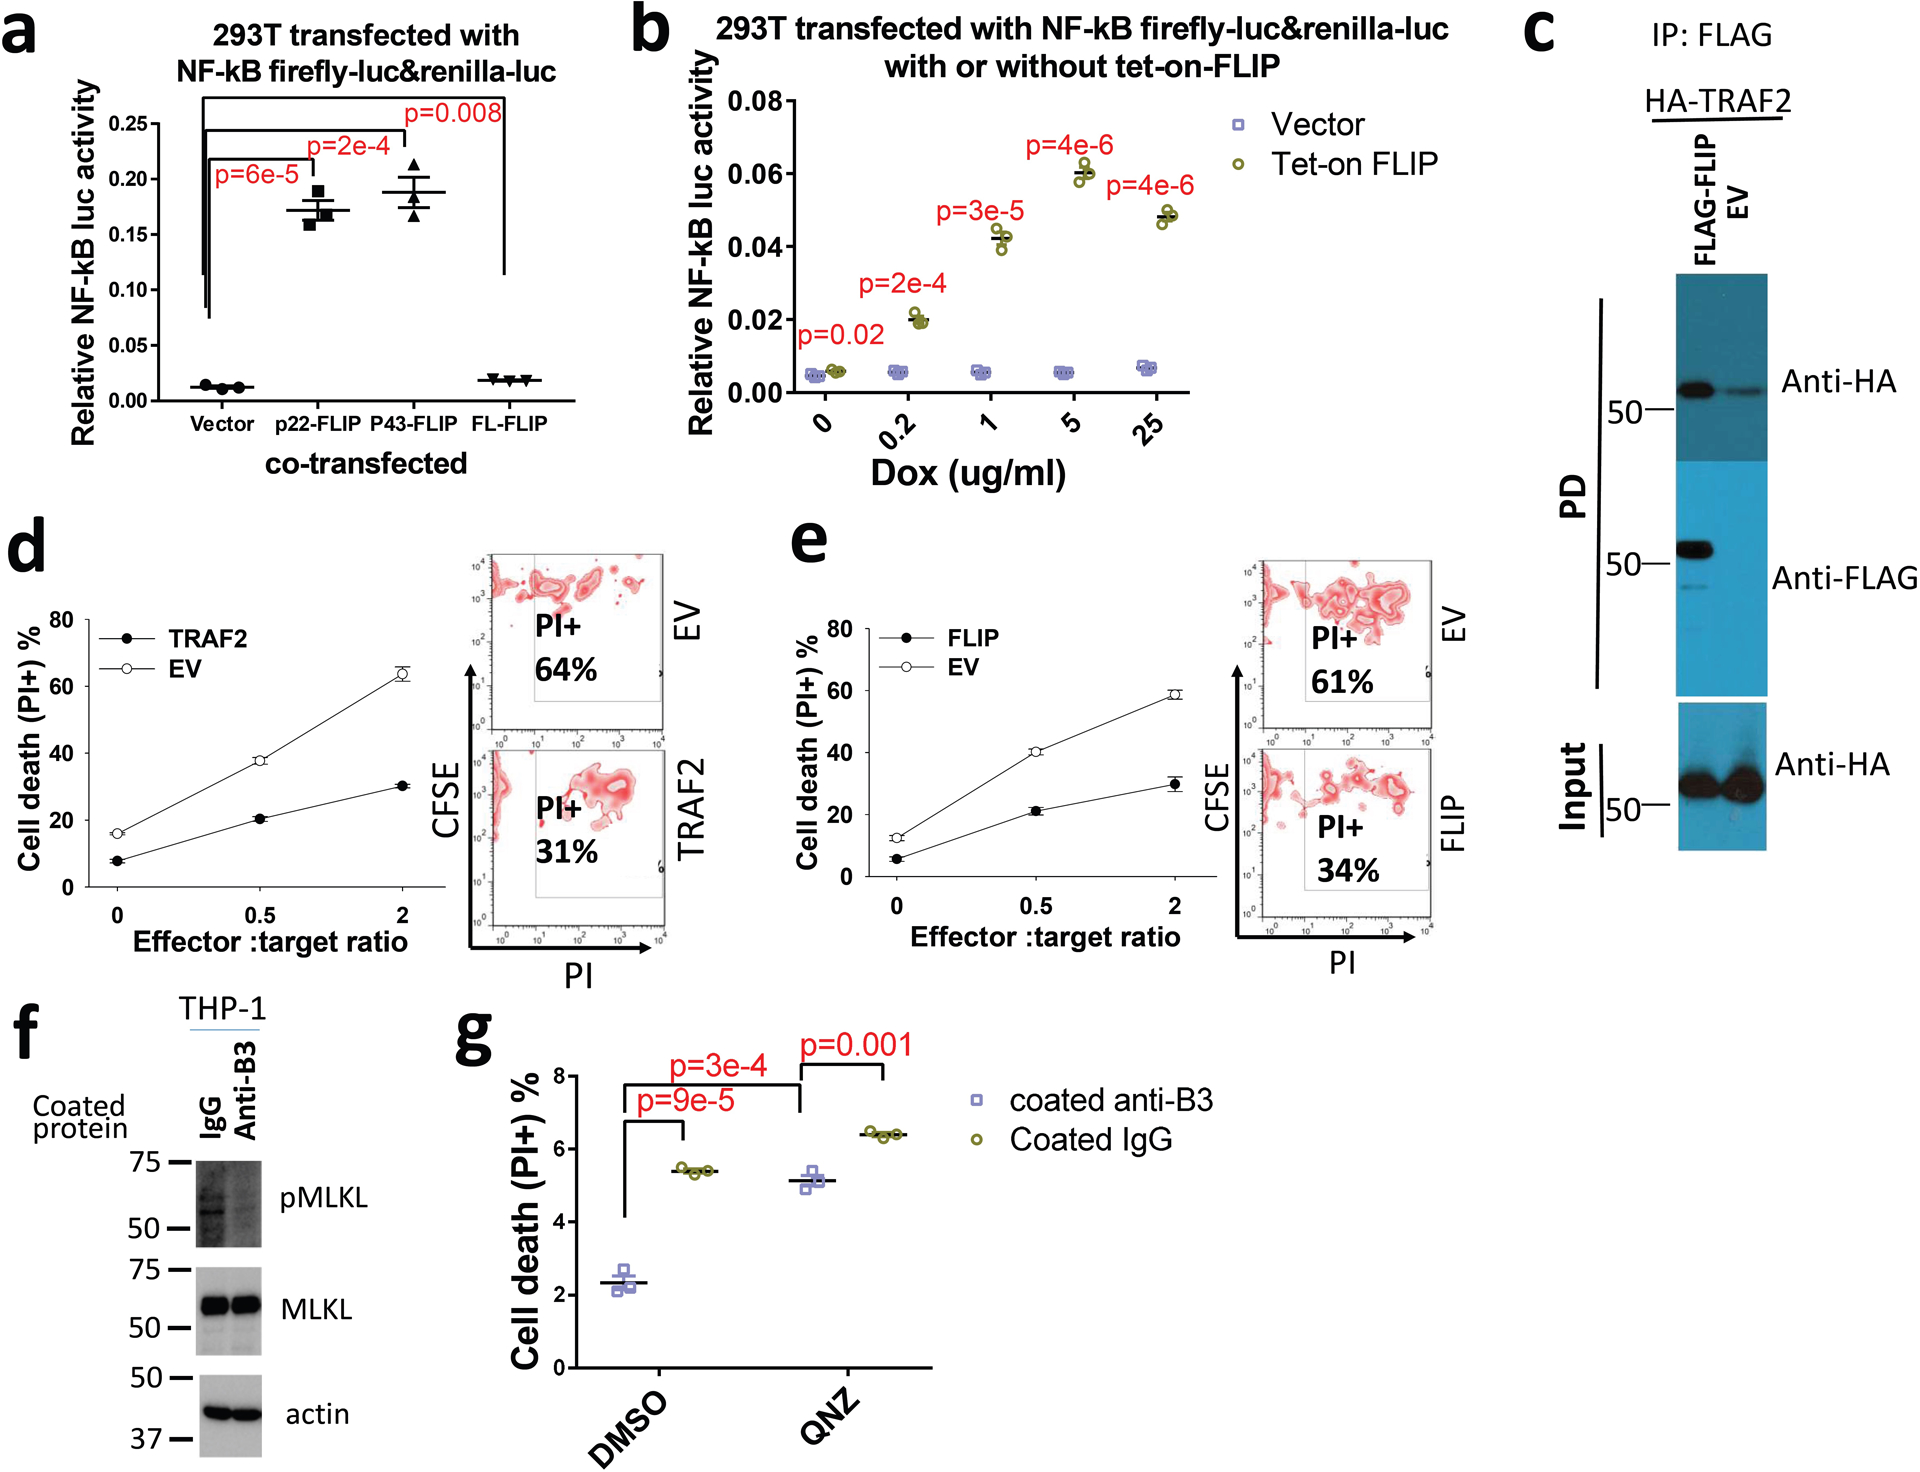
a, Relative NF-κB activities in 293T cells co-transfected with NF-κB reporter plus empty vector, p22-FLIP, p43-CFLIP, or full-length cFLIP (n=3 independent experiments). b, Relative NF-κB activities in 293T cells co-transfected with NF-κB reporter plus empty vector or tet-on cFLIP in the presence of dox (n=3 independent experiments). c, Co-immunoprecipitation assay of exogenous expressed FLAG-cFLIP and HA-TRAF2 in 293T cells. d and e, Overexpression of TRAF2 and cFLIP increase the resistance of monocytic AML cells to cytotoxic T cells. CFSE-stained THP-1 cells that overexpress TRAF2 or empty vector (EV) (d) or cFLIP or empty vector (e) were co-cultured with activated T cells at the different ratios for 12 hours and cell death was quantified. Left: Plots of percentage of dead cells versus E:T ration. Right: FACS analyses with E:T ratio of 2 (n=3 independent experiments). f, West blotting of pMLKL (pS358) and MLKL in THP-1 cells treated with coated IgG or anti-LILRB3 for 12 hours. g, Percentages of dead cells in THP-1 cells treated with anti-LILRB3 antibody or IgG in the presence of DMSO or NF-κB inhibitor QNZ (10 μM) (n=3 independent cell cultures). The data are presented as mean ± s.e.m, and p values were calculated by two-tailed t-test.
Extended Data Fig. 5 |. LILRB3 balances NF-κB signaling with TRAF2 and SHP1/2.
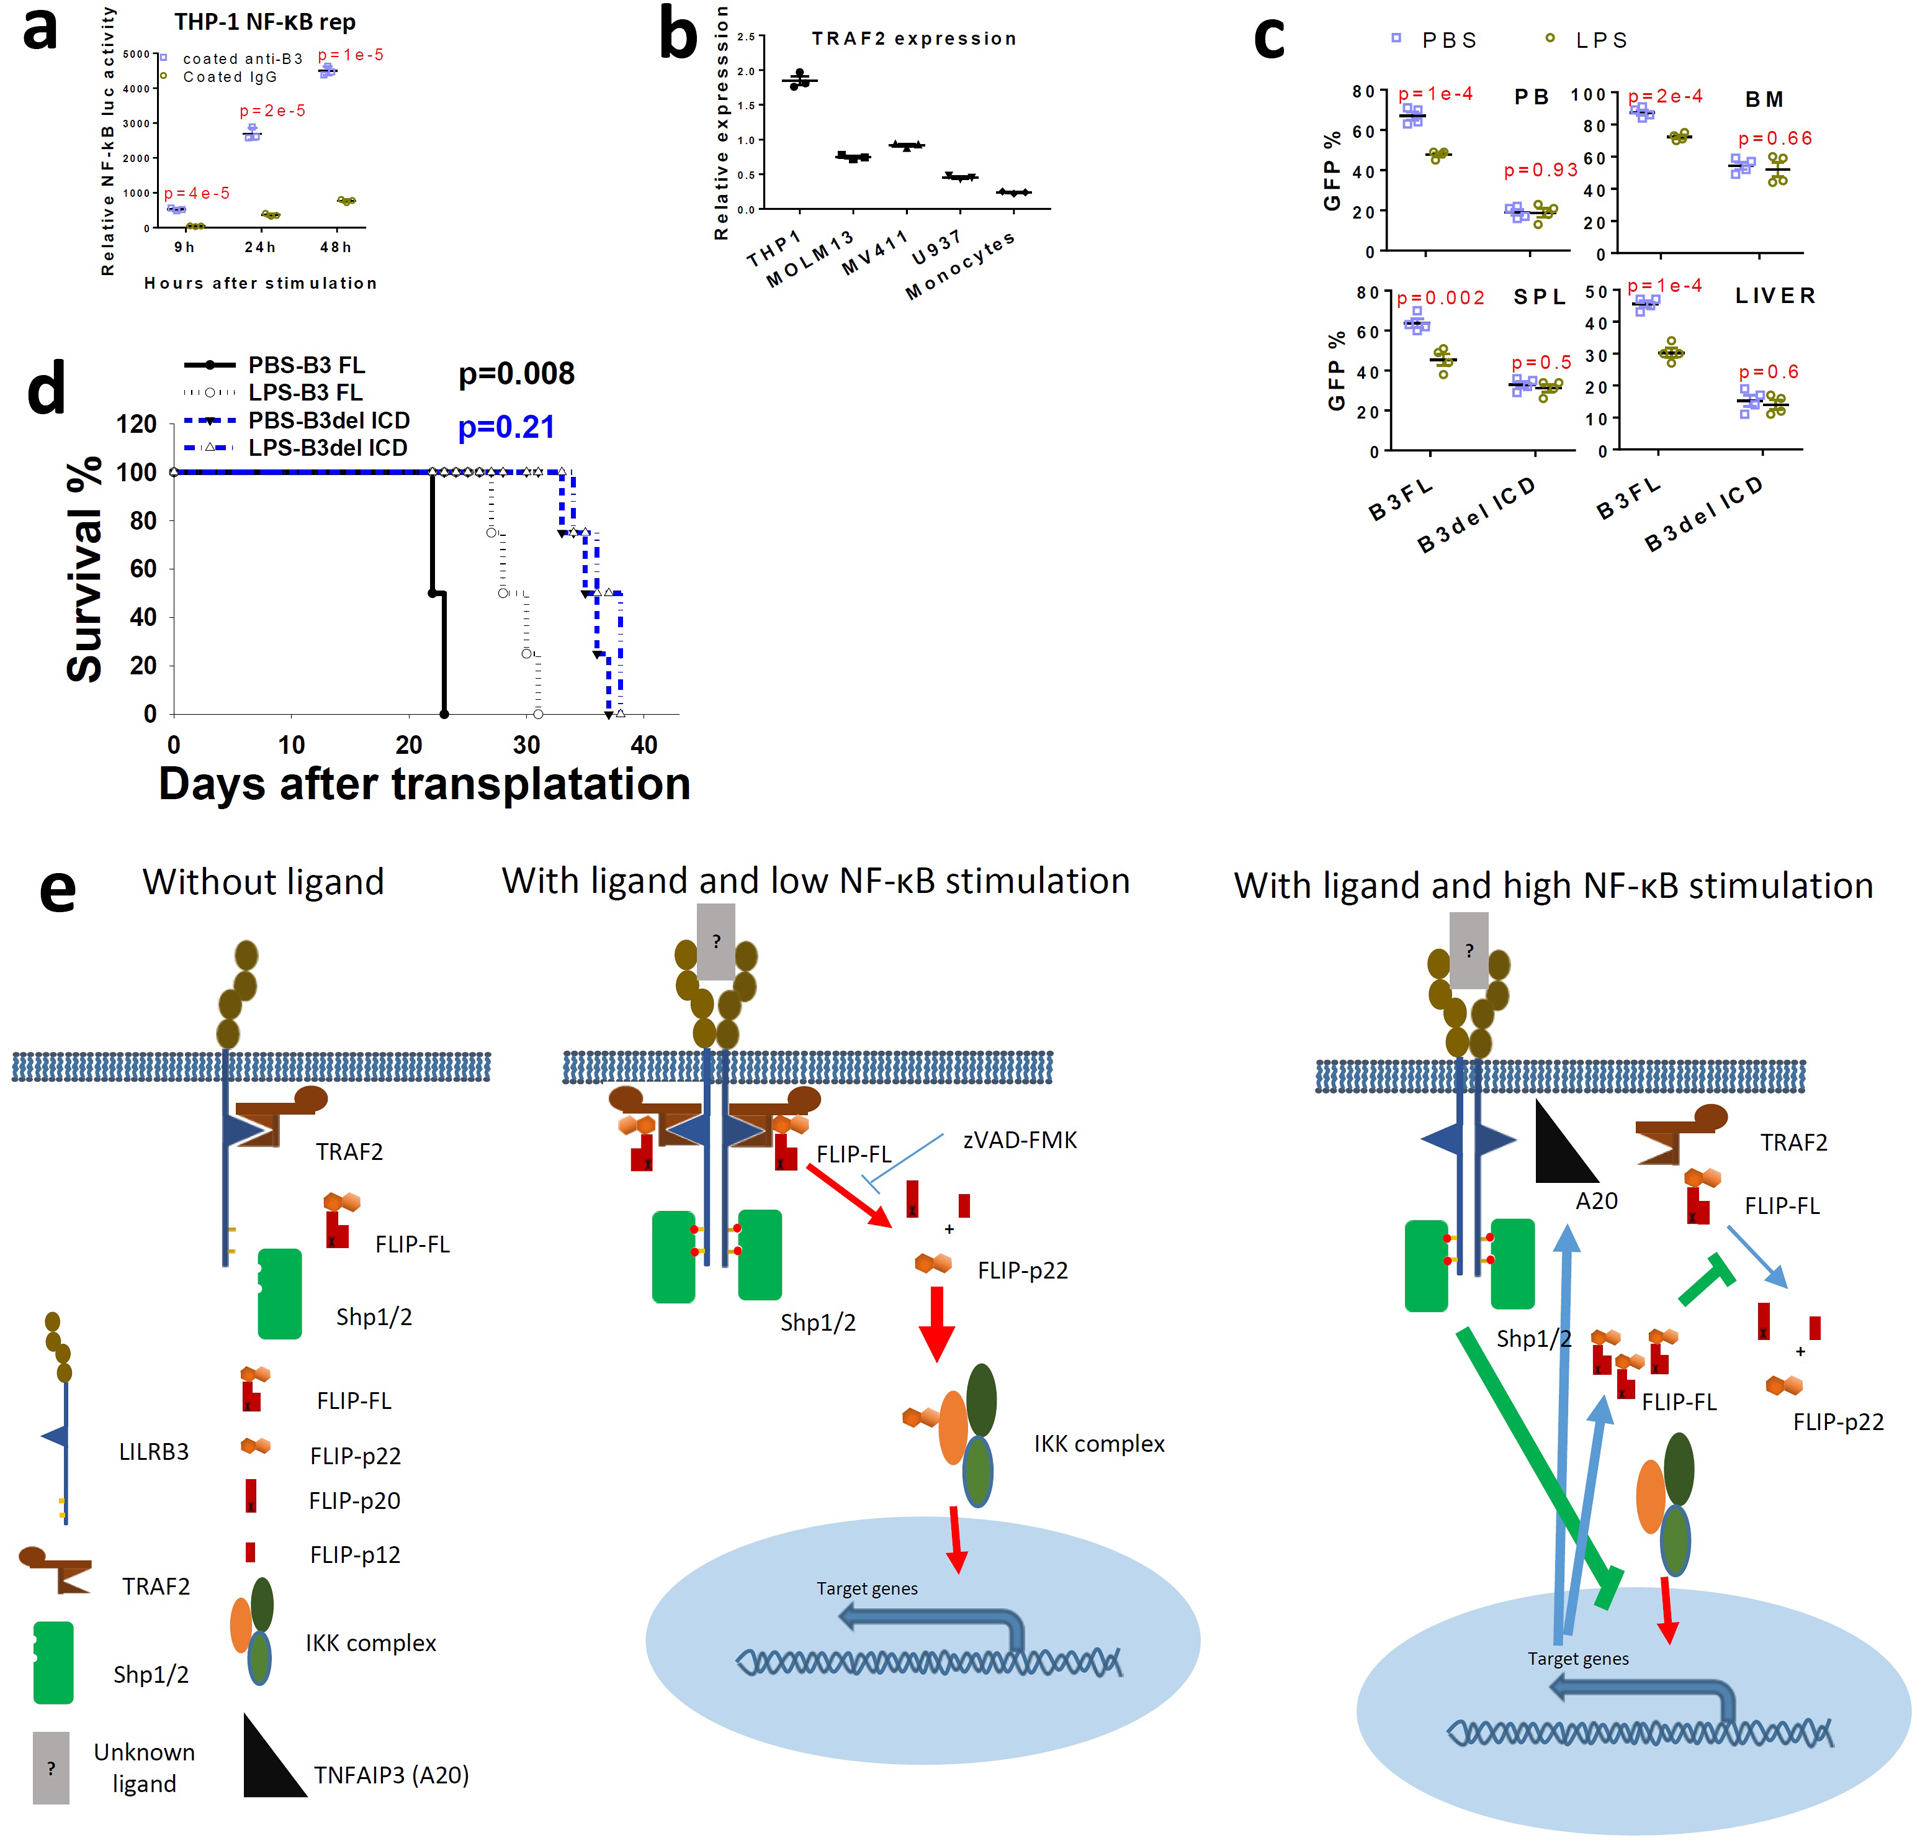
a, Relative luciferase activity from THP-1-Lucia™ cells at different times after activation with anti-LILRB3 antibody or IgG (n=3 individual samples). b, TRAF2 mRNA levels in AML cell lines and normal monocytes (n=3 independent experiments) c, The percentage of GFP+ MLL-AF9 AML cells (with PirB knockout) expressing B3-FL or B3del ICD in peripheral blood (PB), bone marrow (BM), spleen (SPL), and liver in mice treated with PBS or LPS (n=4 independent mice). d, Survival of mice engrafted with AML cells as treated in panel d (n=4 independent mice). The data are presented as mean ± s.e.m, and p values were calculated by two-tailed t-test except for e by log-rank test. e, Mechanistic scheme of LILRB3 signaling. Without ligand-induced crosslinking of LILRB3, TRAF2 remains associated with LILRB3 but does not stimulate downstream signaling. When NF-κB signaling is at a low level, upon ligand-induced crosslinking of LILRB3, TRAF2 recruits cFLIP, and cFLIP is cleaved to p22-FLIP by caspase 8 (whose activity can be inhibited by zVAD-FMK). p22-FLIP binds to the IKK complex and stimulates NF-κB signaling. Meanwhile, after ligand binding to LILRB3, the ITIMs of LILRB3 are phosphorylated, which recruits SHP-1 and SHP-2. When there is a high level of NF-κB signaling stimulated by other cues (e.g., LPS), higher expression of cFLIP and A20 (TNFAIP3) is induced. Increased cFLIP inhibits caspase 8 activity, and A20 disrupts the interaction between TRAF2 and LILRB3. Thus the inhibitory effect of LILRB3 on NF-κB signaling mediated by SHPs becomes dominant.
Extended Data Fig. 6 |. Development of anti-LILRB3 blocking antibodies for suppressing AML development.
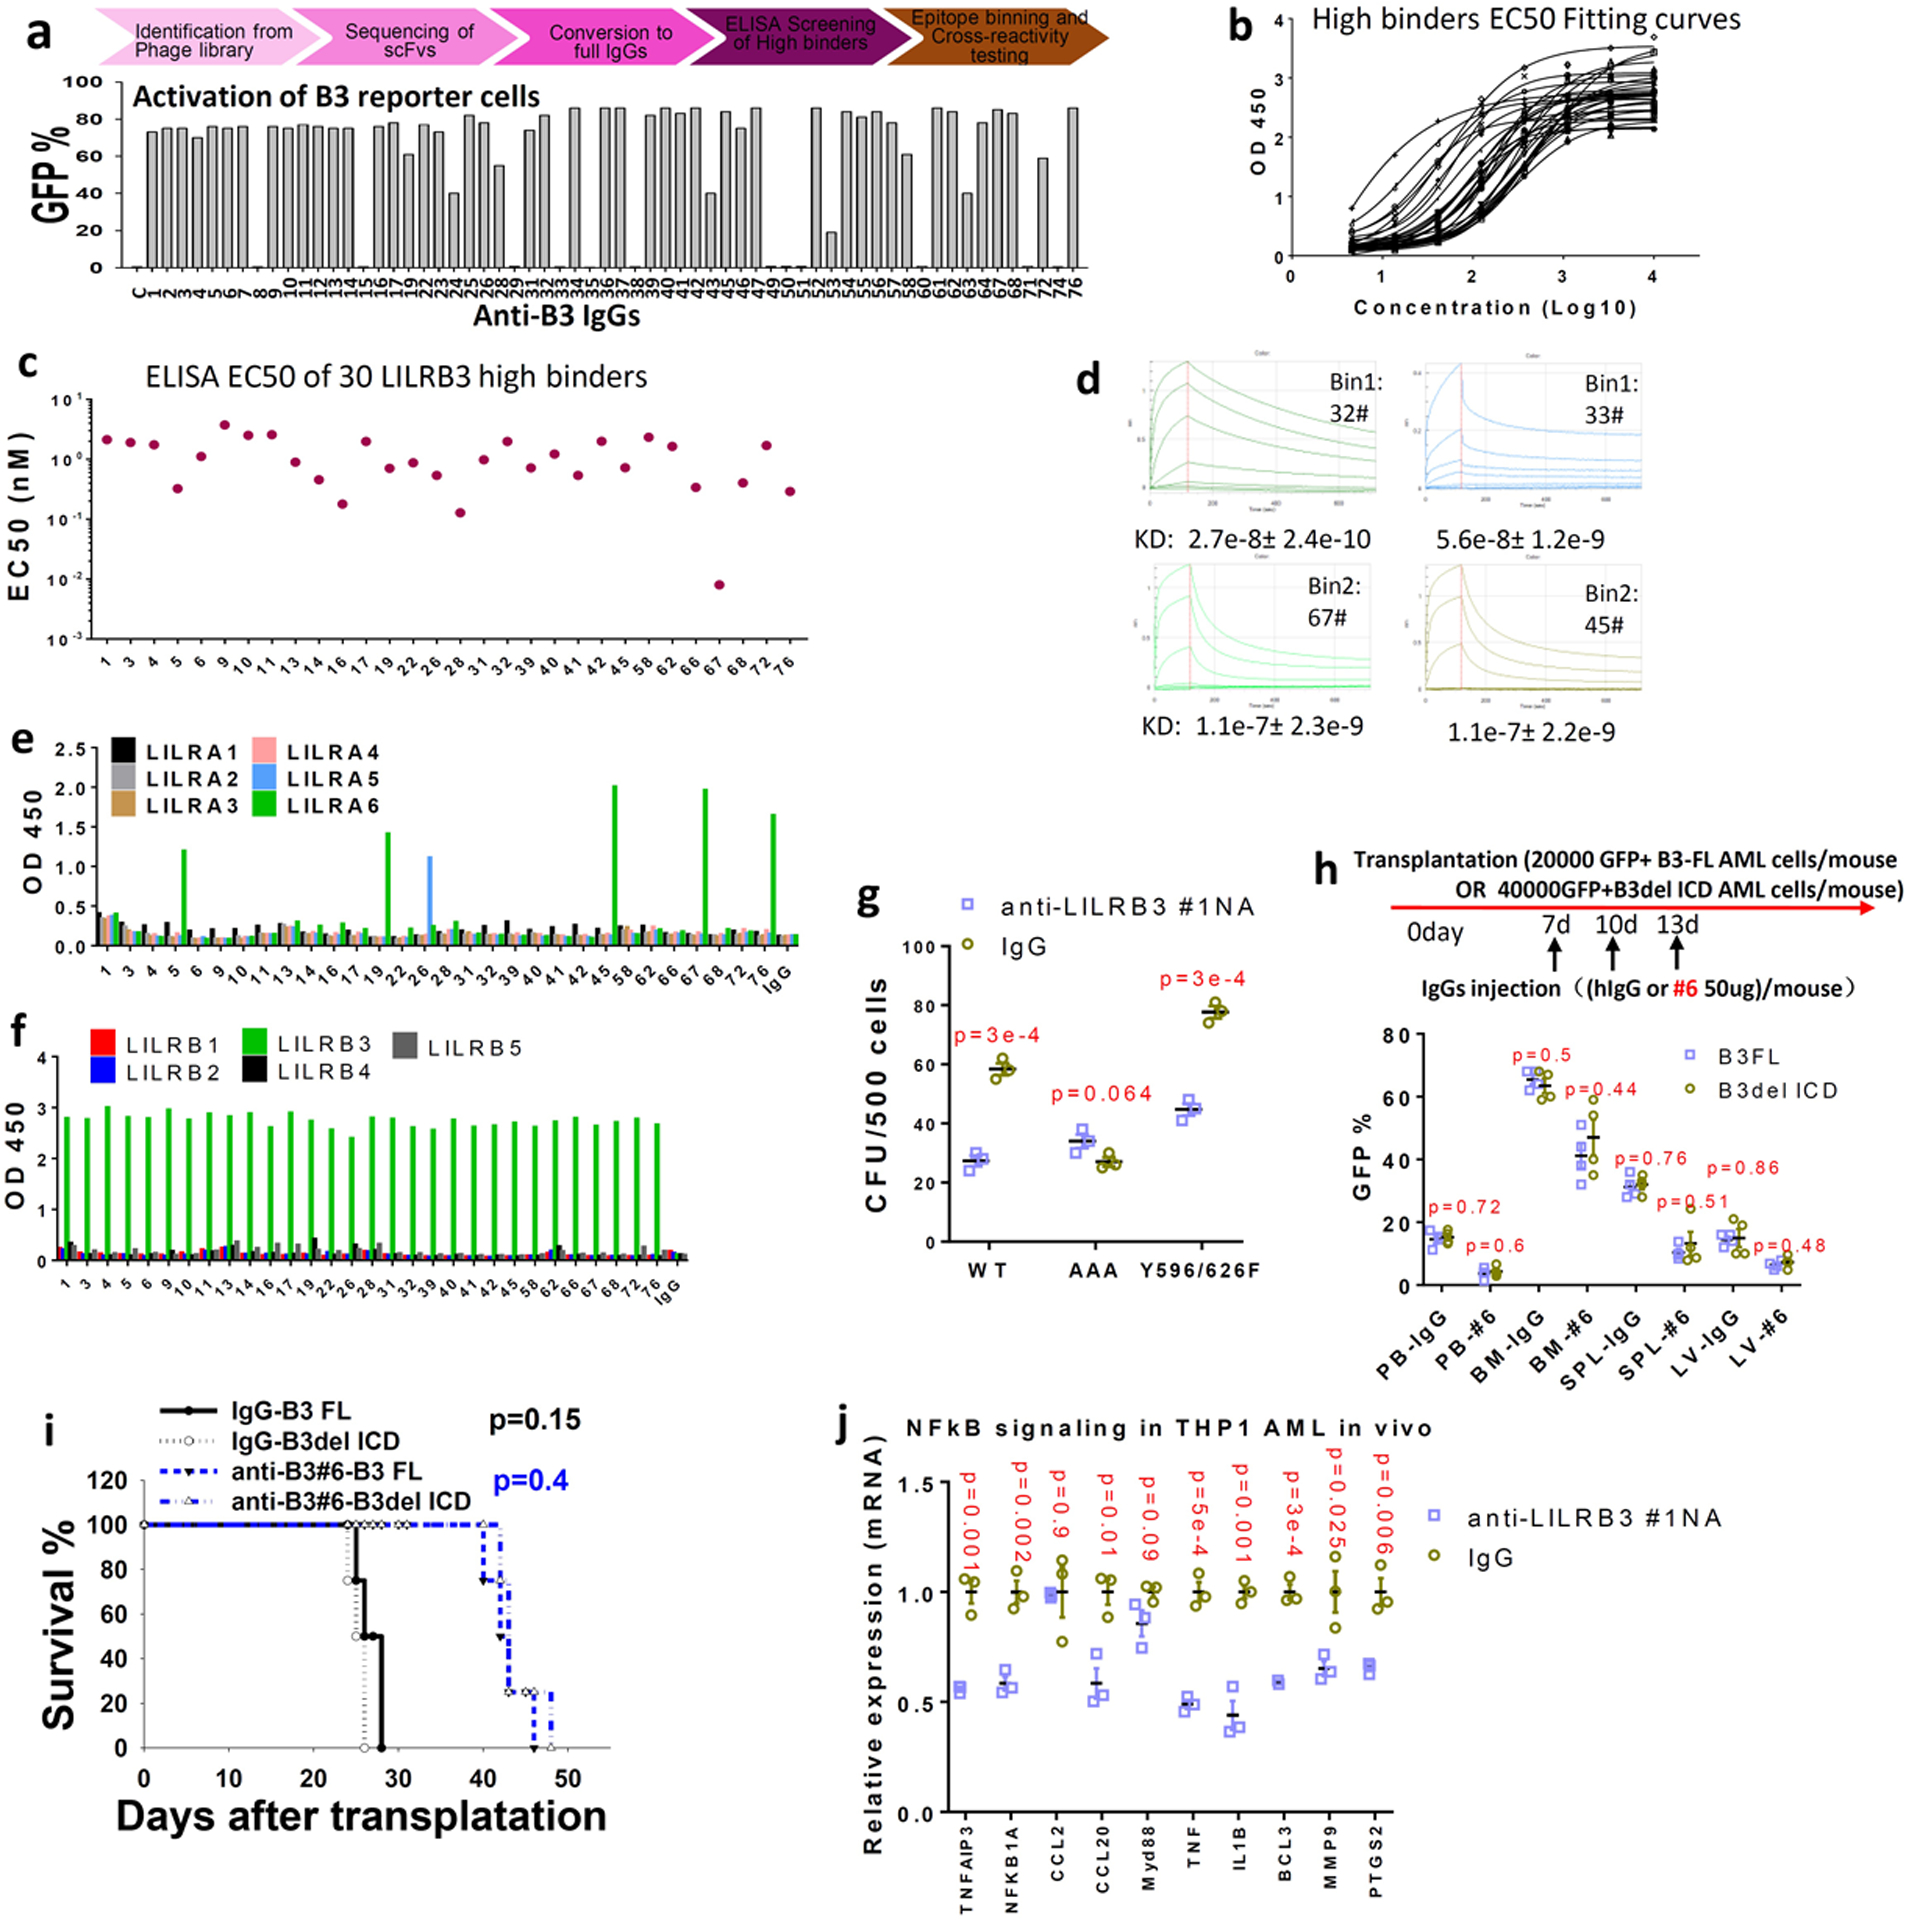
a, Upper: Flow chart of strategy for development of fully humanized antibodies against LILRB3. Lower: The identified antibodies were tested in the LILRB3 chimeric receptor reporter cell assay. b, ELISA results for LILRB3 binders. c, EC50 values of the anti-LILRB3 antibodies based on ELISA. d, Affinities of antibodies #32, #33, #67, and #45 to LILRB3 as determined by Octet. e, Cross-reactivity of the anti-LILRB3 antibodies with LILRAs evaluated with LILRA binding analyses. f, Cross-reactivity of the anti-LILRB3 antibodies with other LILRBs evaluated with LILRB binding analyses. g, Interaction with TRAF2 contributes to the effect of LILRB3 on AML development. CFU assay of MLL-AF9 AML cells expressing wild-type LILRB3 or mutant LILRB3 with mutations disrupting TRAF2 binding (AAA, QEE509–511AAA) or disrupting SHP-1/2 interactions (Y596/626F) in the presence of control or anti-LILRB3 antibodies (n=3 independent cell cultures). h, Evaluation of the effect of Fc-mediated effector functions of anti-LILRB3. Upper: Schematic of treatment. Lower: Percentages of GFP+ MLL-AF9 mouse AML cells in PB, BM, SPL and LV of mice transplanted with AML cells expressing B3-FL or B3delICD and injected with IgG or anti-LILRB3 #6 (n=4 independent mice). i, Survival of mice as treated in panel h. j, NF-κB signaling target gene expression (measured by qPCR) in THP-1 cells from BM of xenografted NSG mice treated with anti-LILRB3 #1NA or IgG (n=3 independent experiments). The data are presented as mean ± s.e.m, and p values were calculated by two-tailed t-test except for i by log-rank test.
Extended Data Fig. 7 |. Anti-LILRB3 #1N297A antibody did not affect normal hematopoiesis and leukocytosis.
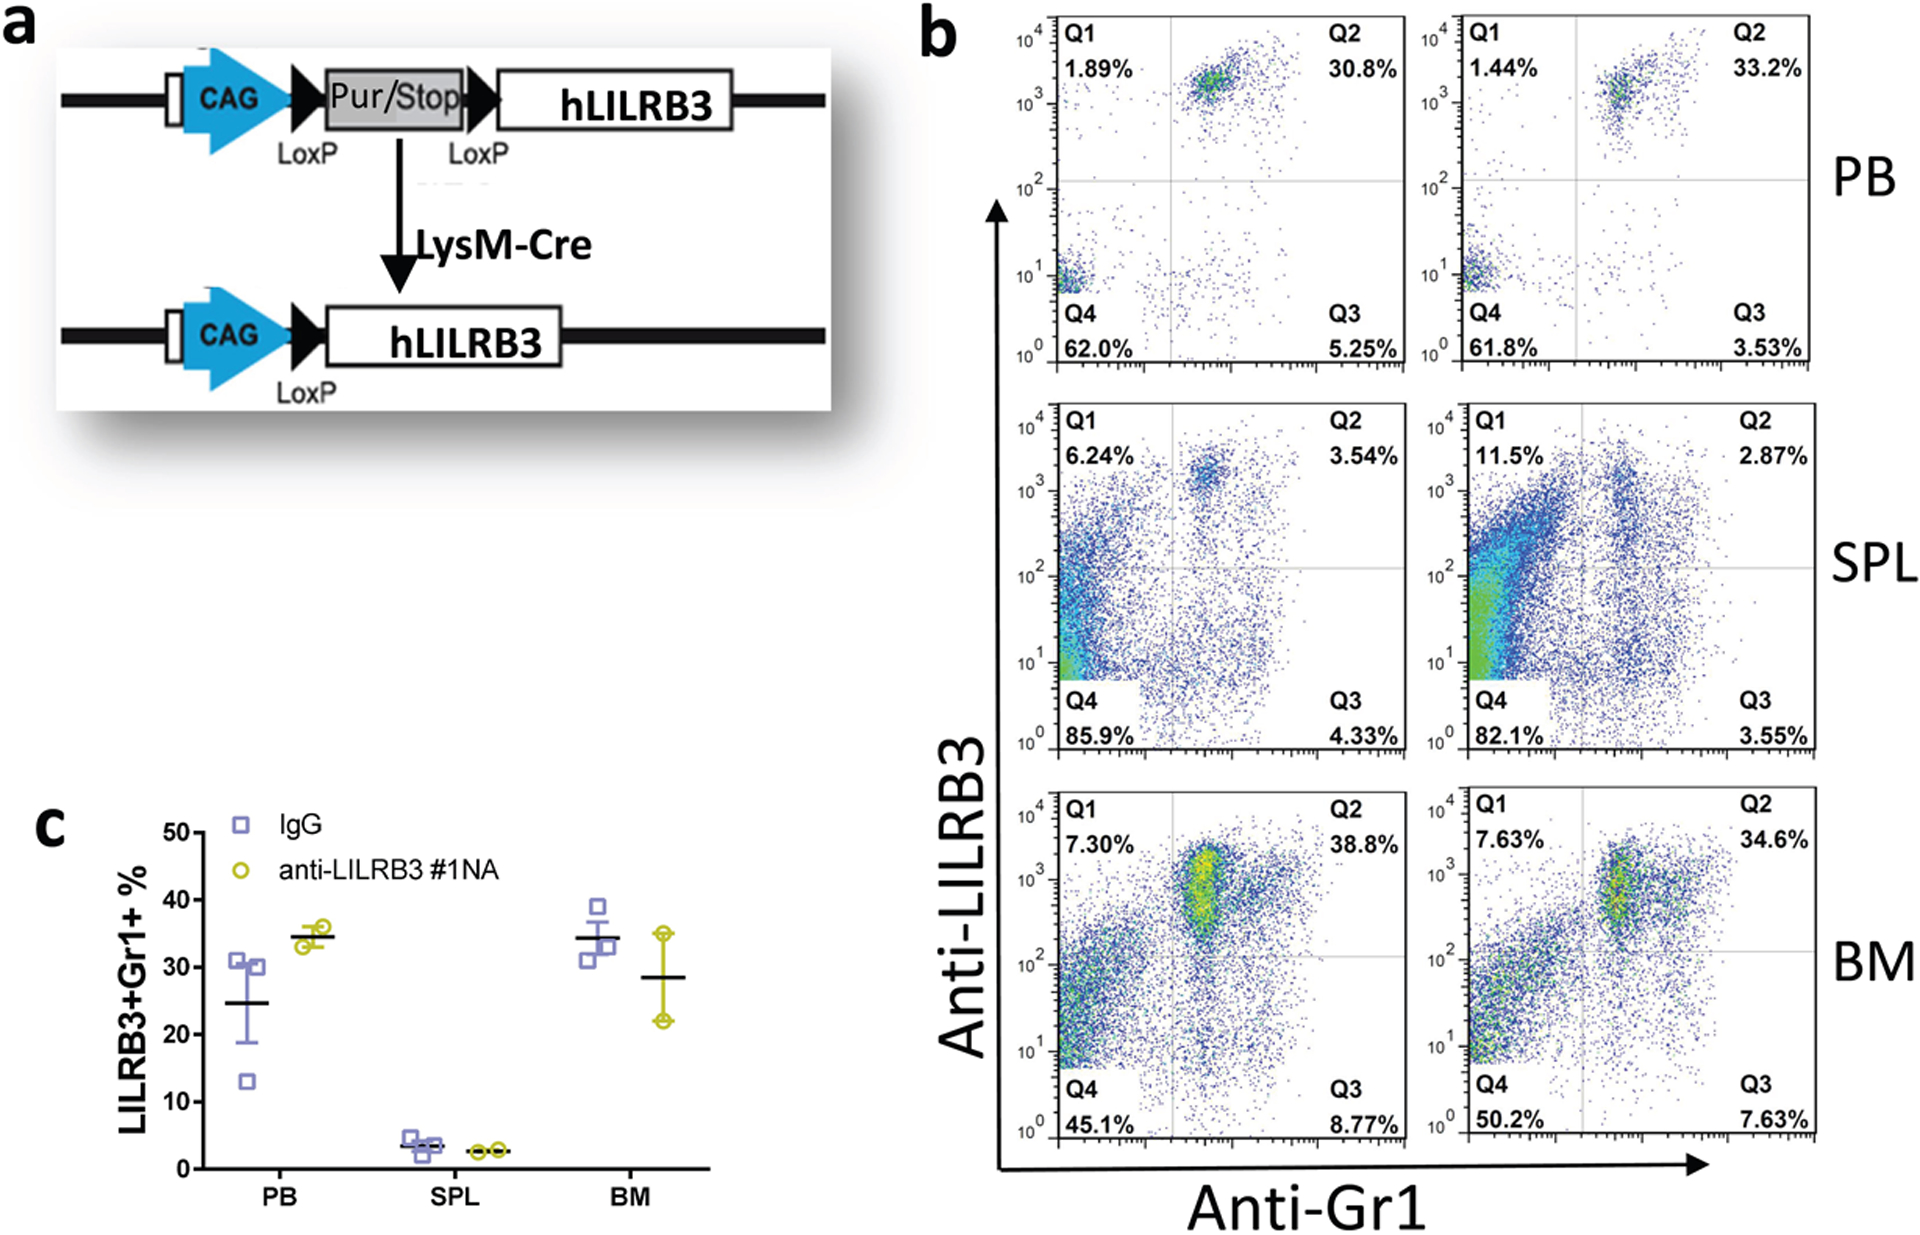
a, Schematic of generation of myeloid-specific LILRB3 transgenic mice. b-c, LILRB3 is expressed on myeloid cells in peripheral blood (PB), spleen (SPL) and bone marrow (BM) of LysM-Cre driven LILRB3 transgenic mice, which were treated by anti-LILRB3 #1 antibody (n=2 mice) or IgG (n=3 mice). Shown are representative flow cytometry plots (b) and result summary (c).
Supplementary Material
Acknowledgements
We thank Dr. Wei Xiong and Ms. Hui Deng for their technical support, and Dr. Georgina Salazar for the editing of the manuscript. This work was supported by National Cancer Institute (1R01 CA248736), the Cancer Prevention and Research Institute of Texas (RP180435, RP150551, and RP190561), the Welch Foundation (AU-0042-20030616), and Immune-Onc Therapeutics, Inc. (Sponsored Research Grant #111077).
Competing interests
The Board of Regents of the University of Texas System has filed a patent application covering METHODS FOR IDENTIFYING LILRB-BLOCKING ANTIBODIES. Authors C.C.Z., G.W., J.K., H.C., M.D., Z.A., and N.Z. are listed as inventors. The patent application has been exclusively licensed to Immune-Onc Therapeutic, Inc. by the Board of Regents of the University of Texas System. Authors Z.A., N.Z., and C.C.Z. hold equity in and have Sponsored Research Agreements with Immune-Onc Therapeutics, Inc. Author Z.A. is a Scientific Advisory Board member with Immune-Onc Therapeutics, Inc. The remaining authors declare no competing interests.
Footnotes
Reporting Summary.
Further information on research design is available in the Nature Research Reporting Summary linked to this article.
Data availability
The RNA-seq data sets generated in the current study have been deposited in NCBI SRA database with the SRA accession number SRP292554. Source data for Fig.1–8 and Extended Data Fig. 1,2,4,5,6,7 have been provided as Source Data files. All other data supporting the findings of this study are available from the corresponding author on reasonable request.
REFERENCE
- 1.Robert C et al. Nivolumab in previously untreated melanoma without BRAF mutation. New England journal of medicine 372, 320–330 (2015). [DOI] [PubMed] [Google Scholar]
- 2.Robert C et al. Pembrolizumab versus ipilimumab in advanced melanoma. New England Journal of Medicine 372, 2521–2532 (2015). [DOI] [PubMed] [Google Scholar]
- 3.Postow MA, Callahan MK & Wolchok JD Immune checkpoint blockade in cancer therapy. Journal of clinical oncology 33, 1974 (2015). [DOI] [PMC free article] [PubMed] [Google Scholar]
- 4.Curran EK, Godfrey J & Kline J Mechanisms of immune tolerance in leukemia and lymphoma. Trends in immunology 38, 513–525 (2017). [DOI] [PMC free article] [PubMed] [Google Scholar]
- 5.Click ZR, Seddon AN, Bae YR, Fisher JD & Ogunniyi A New Food and Drug Administration–approved and emerging novel treatment options for acute myeloid leukemia. Pharmacotherapy 38, 1143–1154 (2018). [DOI] [PubMed] [Google Scholar]
- 6.Trowsdale J, Jones DC, Barrow AD & Traherne JA Surveillance of cell and tissue perturbation by receptors in the LRC. Immunol Rev 267, 117–136, doi: 10.1111/imr.12314 (2015). [DOI] [PubMed] [Google Scholar]
- 7.Daeron M, Jaeger S, Du Pasquier L & Vivier E Immunoreceptor tyrosine-based inhibition motifs: a quest in the past and future. Immunol Rev 224, 11–43, doi: 10.1111/j.1600-065X.2008.00666.x (2008). [DOI] [PubMed] [Google Scholar]
- 8.Takai T, Nakamura A & Endo S Role of PIR-B in autoimmune glomerulonephritis. J Biomed Biotechnol 2011, 275302, doi: 10.1155/2011/275302 (2011). [DOI] [PMC free article] [PubMed] [Google Scholar]
- 9.Katz HR Inhibition of inflammatory responses by leukocyte Ig-like receptors. Adv Immunol 91, 251–272, doi: 10.1016/s0065-2776(06)91007-4 (2006). [DOI] [PubMed] [Google Scholar]
- 10.Kang X et al. Inhibitory leukocyte immunoglobulin-like receptors: immune checkpoint proteins and tumor sustaining factors. Cell cycle 15, 25–40 (2016). [DOI] [PMC free article] [PubMed] [Google Scholar]
- 11.Hirayasu K & Arase H Functional and genetic diversity of leukocyte immunoglobulin-like receptor and implication for disease associations. Journal of human genetics 60, 703–708 (2015). [DOI] [PubMed] [Google Scholar]
- 12.Deng M et al. Leukocyte immunoglobulin-like receptor subfamily B (LILRB): therapeutic targets in cancer Antibody Therapeutics 4, 16–33 (2021). [DOI] [PMC free article] [PubMed] [Google Scholar]
- 13.van der Touw W, Chen HM, Pan PY & Chen SH LILRB receptor-mediated regulation of myeloid cell maturation and function. Cancer Immunol Immunother 66, 1079–1087, doi: 10.1007/s00262-017-2023-x (2017). [DOI] [PMC free article] [PubMed] [Google Scholar]
- 14.Carosella ED, Rouas-Freiss N, Roux DT, Moreau P & LeMaoult J HLA-G: An Immune Checkpoint Molecule. Adv Immunol 127, 33–144, doi: 10.1016/bs.ai.2015.04.001 (2015). [DOI] [PubMed] [Google Scholar]
- 15.John S et al. A Novel Anti-LILRB4 CAR-T Cell for the Treatment of Monocytic AML. Mol Ther 26, 2487–2495, doi: 10.1016/j.ymthe.2018.08.001 (2018). [DOI] [PMC free article] [PubMed] [Google Scholar]
- 16.Zheng J et al. Inhibitory receptors bind ANGPTLs and support blood stem cells and leukaemia development. Nature 485, 656 (2012). [DOI] [PMC free article] [PubMed] [Google Scholar]
- 17.Kang X et al. The ITIM-containing receptor LAIR1 is essential for acute myeloid leukaemia development. Nature cell biology 17, 665–677 (2015). [DOI] [PMC free article] [PubMed] [Google Scholar]
- 18.Deng M et al. LILRB4 signalling in leukaemia cells mediates T cell suppression and tumour infiltration. Nature 562, 605 (2018). [DOI] [PMC free article] [PubMed] [Google Scholar]
- 19.Gui X et al. Disrupting LILRB4/APOE interaction by an efficacious humanized antibody reverses T-cell suppression and blocks AML development. Cancer immunology research 7, 1244–1257 (2019). [DOI] [PMC free article] [PubMed] [Google Scholar]
- 20.Anami Y et al. LILRB4-Targeting Antibody-Drug Conjugates for the Treatment of Acute Myeloid Leukemia. Mol Cancer Ther, doi: 10.1158/1535-7163.mct-20-0407 (2020). [DOI] [PMC free article] [PubMed] [Google Scholar]
- 21.Li Z et al. LILRB4 ITIMs mediate the T cell suppression and infiltration of acute myeloid leukemia cells. Cell Mol Immunol, doi: 10.1038/s41423-019-0321-2 (2019). [DOI] [PMC free article] [PubMed] [Google Scholar]
- 22.Churchill HRO et al. Leukocyte immunoglobulin-like receptor B1 and B4 (LILRB1 and LILRB4): Highly sensitive and specific markers of acute myeloid leukemia with monocytic differentiation. Cytometry B Clin Cytom, doi: 10.1002/cyto.b.21952 (2020). [DOI] [PubMed] [Google Scholar]
- 23.Bergstrom CP et al. The association of leukocyte immunoglobulin-like receptor subfamily B-4 expression in acute myeloid leukemia and central nervous system involvement. Leuk Res 100, 106480, doi: 10.1016/j.leukres.2020.106480 (2021). [DOI] [PubMed] [Google Scholar]
- 24.Barkal AA et al. Engagement of MHC class I by the inhibitory receptor LILRB1 suppresses macrophages and is a target of cancer immunotherapy. Nat Immunol 19, 76–84, doi: 10.1038/s41590-017-0004-z (2018). [DOI] [PMC free article] [PubMed] [Google Scholar]
- 25.Chen HM et al. Blocking immunoinhibitory receptor LILRB2 reprograms tumor-associated myeloid cells and promotes antitumor immunity. J Clin Invest 128, 5647–5662, doi: 10.1172/jci97570 (2018). [DOI] [PMC free article] [PubMed] [Google Scholar]
- 26.Tedla N et al. Activation of human eosinophils through leukocyte immunoglobulin-like receptor 7. Proc Natl Acad Sci U S A 100, 1174–1179, doi: 10.1073/pnas.0337567100 (2003). [DOI] [PMC free article] [PubMed] [Google Scholar]
- 27.Coxon CH, Geer MJ & Senis YA ITIM receptors: more than just inhibitors of platelet activation. Blood 129, 3407–3418 (2017). [DOI] [PMC free article] [PubMed] [Google Scholar]
- 28.Sloane DE et al. Leukocyte immunoglobulin-like receptors: novel innate receptors for human basophil activation and inhibition. Blood 104, 2832–2839, doi: 10.1182/blood-2004-01-0268 (2004). [DOI] [PubMed] [Google Scholar]
- 29.Yeboah M et al. LILRB3 (ILT5) is a myeloid cell checkpoint that elicits profound immunomodulation. JCI Insight 5, doi: 10.1172/jci.insight.141593 (2020). [DOI] [PMC free article] [PubMed] [Google Scholar]
- 30.Renauer P et al. Genome-wide association study identifies susceptibility loci in IL6, RPS9/LILRB3, and an intergenic locus on chromosome 21q22 in Takayasu’s arteritis. Arthritis rheumatology 67, 1361 (2015). [DOI] [PMC free article] [PubMed] [Google Scholar]
- 31.Jones DC et al. Allele-specific recognition by LILRB3 and LILRA6 of a cytokeratin 8-associated ligand on necrotic glandular epithelial cells. Oncotarget 7, 15618–15631, doi: 10.18632/oncotarget.6905 (2016). [DOI] [PMC free article] [PubMed] [Google Scholar]
- 32.Pfistershammer K et al. Allogeneic disparities in immunoglobulin-like transcript 5 induce potent antibody responses in hematopoietic stem cell transplant recipients. Blood 114, 2323–2332 (2009). [DOI] [PubMed] [Google Scholar]
- 33.Tiscornia G, Tergaonkar V, Galimi F & Verma IM CRE recombinase-inducible RNA interference mediated by lentiviral vectors. Proceedings of the National Academy of Sciences 101, 7347–7351 (2004). [DOI] [PMC free article] [PubMed] [Google Scholar]
- 34.Sanchez-Correa B et al. Cytokine profiles in acute myeloid leukemia patients at diagnosis: survival is inversely correlated with IL-6 and directly correlated with IL-10 levels. Cytokine 61, 885–891 (2013). [DOI] [PubMed] [Google Scholar]
- 35.MacEwan DJ TNF receptor subtype signalling: differences and cellular consequences. Cellular signalling 14, 477–492 (2002). [DOI] [PubMed] [Google Scholar]
- 36.Syken J, GrandPre T, Kanold PO & Shatz CJ PirB restricts ocular-dominance plasticity in visual cortex. science 313, 1795–1800 (2006). [DOI] [PubMed] [Google Scholar]
- 37.Hasegawa K et al. An immunocompetent mouse model for MLL/AF9 leukemia reveals the potential of spontaneous cytotoxic T-cell response to an antigen expressed in leukemia cells. PloS one 10, e0144594 (2015). [DOI] [PMC free article] [PubMed] [Google Scholar]
- 38.Kawasaki T & Kawai T Toll-like receptor signaling pathways. Frontiers in immunology 5, 461 (2014). [DOI] [PMC free article] [PubMed] [Google Scholar]
- 39.Shaw PJ, Lamkanfi M & Kanneganti TD NOD‐like receptor (NLR) signaling beyond the inflammasome. European journal of immunology 40, 624–627 (2010). [DOI] [PMC free article] [PubMed] [Google Scholar]
- 40.Taniguchi K & Karin M NF-κB, inflammation, immunity and cancer: coming of age. Nature Reviews Immunology 18, 309–324 (2018). [DOI] [PubMed] [Google Scholar]
- 41.Cannons JL, Bertram EM & Watts TH Cutting edge: profound defect in T cell responses in TNF receptor-associated factor 2 dominant negative mice. The Journal of Immunology 169, 2828–2831 (2002). [DOI] [PubMed] [Google Scholar]
- 42.Nishitoh H et al. ASK1 is essential for JNK/SAPK activation by TRAF2. Molecular cell 2, 389–395 (1998). [DOI] [PubMed] [Google Scholar]
- 43.Reinhard C, Shamoon B, Shyamala V & Williams LT Tumor necrosis factor alpha-induced activation of c-jun N-terminal kinase is mediated by TRAF2. EMBO J 16, 1080–1092, doi: 10.1093/emboj/16.5.1080 (1997). [DOI] [PMC free article] [PubMed] [Google Scholar]
- 44.Golks A, Brenner D, Krammer PH & Lavrik IN The c-FLIP–NH2 terminus (p22-FLIP) induces NF-κB activation. Journal of Experimental Medicine 203, 1295–1305 (2006). [DOI] [PMC free article] [PubMed] [Google Scholar]
- 45.Kataoka T & Tschopp J N-terminal fragment of c-FLIP (L) processed by caspase 8 specifically interacts with TRAF2 and induces activation of the NF-κB signaling pathway. Molecular cellular biology 24, 2627–2636 (2004). [DOI] [PMC free article] [PubMed] [Google Scholar]
- 46.Hughes MA et al. Co-operative and hierarchical binding of c-FLIP and caspase-8: a unified model defines how c-FLIP isoforms differentially control cell fate. Molecular cell 61, 834–849 (2016). [DOI] [PMC free article] [PubMed] [Google Scholar]
- 47.Chang DW et al. c‐FLIPL is a dual function regulator for caspase‐8 activation and CD95‐mediated apoptosis. The EMBO journal 21, 3704–3714 (2002). [DOI] [PMC free article] [PubMed] [Google Scholar]
- 48.Fritsch M et al. Caspase-8 is the molecular switch for apoptosis, necroptosis and pyroptosis. Nature 575, 683–687 (2019). [DOI] [PubMed] [Google Scholar]
- 49.Bertheloot D, Latz E & Franklin BS Necroptosis, pyroptosis and apoptosis: an intricate game of cell death. Cellular Molecular Immunology 18, 1106–1121 (2021). [DOI] [PMC free article] [PubMed] [Google Scholar]
- 50.Wu G & Zhang CC Membrane protein CAR promotes hematopoietic regeneration upon stress. Haematologica doi: 10.3324/haematol.2019.243998. Online ahead of print. (2020). [DOI] [PMC free article] [PubMed] [Google Scholar]
- 51.Pereira S & Lowell C The Lyn tyrosine kinase negatively regulates neutrophil integrin signaling. The Journal of Immunology 171, 1319–1327 (2003). [DOI] [PubMed] [Google Scholar]
- 52.Medvedev AE & Vogel SN Overexpression of CD14, TLR4, and MD-2 in HEK 293T cells does not prevent induction of in vitro endotoxin tolerance. Journal of endotoxin research 9, 60–64 (2003). [DOI] [PubMed] [Google Scholar]
- 53.Micheau O, Lens S, Gaide O, Alevizopoulos K & Tschopp J NF-κB signals induce the expression of c-FLIP. Molecular cellular biology 21, 5299–5305 (2001). [DOI] [PMC free article] [PubMed] [Google Scholar]
- 54.Shembade N & Harhaj EW Regulation of NF-κB signaling by the A20 deubiquitinase. Cellular molecular immunology 9, 123–130 (2012). [DOI] [PMC free article] [PubMed] [Google Scholar]
- 55.Li L, Soetandyo N, Wang Q & Ye Y The zinc finger protein A20 targets TRAF2 to the lysosomes for degradation. Biochimica et Biophysica Acta -Molecular Cell Research 1793, 346–353 (2009). [DOI] [PMC free article] [PubMed] [Google Scholar]
- 56.Song HY, Rothe M & Goeddel DV The tumor necrosis factor-inducible zinc finger protein A20 interacts with TRAF1/TRAF2 and inhibits NF-kappaB activation. Proceedings of the National Academy of Sciences 93, 6721–6725 (1996). [DOI] [PMC free article] [PubMed] [Google Scholar]
- 57.Tao M-H & Morrison SL Studies of aglycosylated chimeric mouse-human IgG. Role of carbohydrate in the structure and effector functions mediated by the human IgG constant region. The Journal of Immunology 143, 2595–2601 (1989). [PubMed] [Google Scholar]
- 58.Hristodorov D, Fischer R & Linden L With or without sugar?(A) glycosylation of therapeutic antibodies. Molecular biotechnology 54, 1056–1068 (2013). [DOI] [PubMed] [Google Scholar]
- 59.Lo M et al. Effector-attenuating substitutions that maintain antibody stability and reduce toxicity in mice. Journal of Biological Chemistry 292, 3900–3908 (2017). [DOI] [PMC free article] [PubMed] [Google Scholar]
- 60.Dietrich J, Cella M & Colonna M Ig-like transcript 2 (ILT2)/leukocyte Ig-like receptor 1 (LIR1) inhibits TCR signaling and actin cytoskeleton reorganization. J Immunol 166, 2514–2521 (2001). [DOI] [PubMed] [Google Scholar]
- 61.Cella M et al. A novel inhibitory receptor (ILT3) expressed on monocytes, macrophages, and dendritic cells involved in antigen processing. J Exp Med 185, 1743–1751 (1997). [DOI] [PMC free article] [PubMed] [Google Scholar]
- 62.Sawanobori M et al. Expression of TNF receptors and related signaling molecules in the bone marrow from patients with myelodysplastic syndromes. Leukemia research 27, 583–591 (2003). [DOI] [PubMed] [Google Scholar]
- 63.Barrow AD & Trowsdale J The extended human leukocyte receptor complex: diverse ways of modulating immune responses. Immunological reviews 224, 98–123 (2008). [DOI] [PubMed] [Google Scholar]
- 64.Li Z et al. LILRB4 ITIMs mediate the T cell suppression and infiltration of acute myeloid leukemia cells. Cellular molecular immunology 17, 272–282 (2019). [DOI] [PMC free article] [PubMed] [Google Scholar]
- 65.Rodríguez M et al. NF-κB signal triggering and termination by tumor necrosis factor receptor 2. Journal of Biological Chemistry 286, 22814–22824 (2011). [DOI] [PMC free article] [PubMed] [Google Scholar]
- 66.Ye H & Wu H Thermodynamic characterization of the interaction between TRAF2 and tumor necrosis factor receptor peptides by isothermal titration calorimetry. Proceedings of the National Academy of Sciences 97, 8961–8966 (2000). [DOI] [PMC free article] [PubMed] [Google Scholar]
- 67.Takai T, Nakamura A & Endo S Role of PIR-B in Autoimmune Glomerulonephritis. Journal of Biomedicine Biotechnology 2011 (2011). [DOI] [PMC free article] [PubMed] [Google Scholar]
- 68.Deng M et al. A motif in LILRB2 critical for Angptl2 binding and activation. Blood 124, 924–935, doi: 10.1182/blood-2014-01-549162 (2014). [DOI] [PMC free article] [PubMed] [Google Scholar]
- 69.Deng M et al. LILRB4 signalling in leukaemia cells mediates T cell suppression and tumour infiltration. Nature 562, 605–609 (2018). [DOI] [PMC free article] [PubMed] [Google Scholar]
- 70.Kang X et al. The ITIM-containing receptor LAIR1 is essential for acute myeloid leukaemia development. Nat Cell Biol 17, 665–677, doi: 10.1038/ncb3158 (2015). [DOI] [PMC free article] [PubMed] [Google Scholar]
- 71.Subramanian A et al. Gene set enrichment analysis: a knowledge-based approach for interpreting genome-wide expression profiles. Proceedings of the National Academy of Sciences 102, 15545–15550 (2005). [DOI] [PMC free article] [PubMed] [Google Scholar]
Associated Data
This section collects any data citations, data availability statements, or supplementary materials included in this article.
Supplementary Materials
Data Availability Statement
The RNA-seq data sets generated in the current study have been deposited in NCBI SRA database with the SRA accession number SRP292554. Source data for Fig.1–8 and Extended Data Fig. 1,2,4,5,6,7 have been provided as Source Data files. All other data supporting the findings of this study are available from the corresponding author on reasonable request.


