Abstract
Miniaturization of systems and processes provides numerous benefits in terms of cost, reproducibility, precision, minimized consumption of chemical reagents, and prevention of contamination. The field of microfluidics successfully finds a place in a plethora of applications, including on-chip nanoparticle synthesis. Compared with the bulk approaches, on-chip methods that are enabled by microfluidic devices offer better control of size and uniformity of fabricated nanoparticles. However, these microfluidic devices generally require complex and expensive fabrication facilities that are not readily available in low-resourced laboratories. Here, a low-cost and simple acoustic device is demonstrated by generating acoustic streaming flows inside glass capillaries through exciting different flexural modes. At distinct frequencies, the flexural modes of the capillary result in different oscillation profiles that can insert harmonic forcing into the fluid. We explored these flexural modes and identified the modes that can generate strong acoustic streaming vortices along the glass capillary. Then, we applied these modes for fluid mixing using an easy-to-fabricate acoustofluidic device architecture. This device is applied in the fabrication of poly(d,l-lactide-co-glycolide) (PLGA) nanoparticles. The acoustic device consists of a thin glass capillary and two polydimethylsiloxane adaptors that are formed using three-dimensional printed molds. By controlling the flow rates of the polymer and water solutions, PLGA nanoparticles with diameters between 65 and 96 nm are achieved with polydispersity index values ranging between 0.08 and 0.18. Owing to its simple design and minimal fabrication requirements, the proposed acoustofluidic mixer can be applied for microfluidic fluid mixing applications in limited resource settings.
I. INTRODUCTION
Nanoparticles provide unparalleled benefits in a wide spectrum of applications, including drug delivery, energy storage, plasmonics, and food packaging.1–3 For industrial applications, bulk processes have been conveniently applied to fabricate nanoparticles on a large scale. However, certain applications such as the fabrication of personalized medicine require only minute amounts of nanoparticles tailored for specific demands.4 Considering the rarity and the cost of certain chemical reagents, miniaturization of fabrication processes is a highly beneficial transition especially for therapeutic applications.5 The field of microfluidics bears favorable traits that can accurately serve the needs of on-chip nanoparticle fabrication with high precision, virtually no contamination, low cost, and reduced consumption of chemicals.6–8 Even though there are several examples of on-chip nanoparticle syntheses, the fabrication and implementation of these platforms generally involve high-end cleanroom facilities and complicated experimental setups.9,10 A simpler and more efficient microfluidic tool can be a valuable platform for on-chip nanoparticle fabrication.
Since the bulk fabrication approaches lack precision, microfluidic methods have been commonly adopted in the controlled fabrication of nanoparticles with fairly uniform size distributions, compositions, shapes, and stabilities.11,12 Flow-focusing microfluidic reactors constitute a large group of platforms that are implemented for on-chip nanoparticle synthesis.13 In these devices, hydrodynamically focused streams of chemicals react through the interfacial diffusion process between fluids. In general, the fluid flow is characterized by low Reynolds numbers within microfluidic devices. This regime dictates that the fluid flow is laminar and the main mass transport mechanism is limited to diffusion between the layers. Besides hydrodynamic focusing, droplet microfluidics and passive inertial micromixers have also been employed in fluid mixing and nanoparticle syntheses.12,14,15 In droplet-based methods,16,17 an immiscible two-phase system (e.g., water-in-oil) is frequently used, but downstream isolation of these phases generates additional inconveniences. Furthermore, the inertial microfluidic reactors rely on the control of fluid-flow ratio to tune the fluid mixing conditions, which can also affect nanoparticle syntheses.
Active microfluidic mixing methods implement external fields or mechanisms to induce fluid mixing, which has been applied for more controllable fabrication of nanoparticles compared with the passive methods.18–20 Acoustofluidics,21–27 which is a fusion of acoustics and fluid mechanics, is one of the most widely used methods in fluid manipulation at various scales.28–30 Through the implementation of these effective micromixing platforms, nanoparticles are also synthesized in microfluidic systems.31 For example, Huang et al. used an acoustic microfluidic device to fabricate an assortment of nanoparticles including polymer complexes, chitosan nanoparticles, DNA-lipid complexes, and metal–organic frameworks.10 Similarly, Zhao et al. employed acoustic streaming to fabricate high molecular weight poly(lactic-co-glycolic acid) (PLGA)-b-poly(ethylene glycol) nanoparticles.18 In these examples, the external acoustic fields were adjusted to control the mixing behavior and nanoparticle characteristics. Despite their advantages in terms of better monodispersity and shape uniformity of fabricated nanoparticles compared with bulk fabrication, these microfluidic devices require expensive and time-consuming fabrication steps.
PLGA is a Food and Drug Administration (FDA) approved copolymer that is commonly used for therapeutic applications such as controlled drug release. Currently, there are a handful of nanomedicines that are approved by FDA and have been clinically administered.32–34 In general, the amount of these nanoparticle-based nanomedicine ranges between 0.3 and 15 mg/day, with costs varying from 96 to 1646 USD for each dose.32 Considering the increasing importance of point-of-care intervention and personalized precision medicine approaches, it is becoming even more imperative to develop more accessible microfluidic tools. Thus, simpler microfluidic devices are needed to enable the widespread implementation of on-chip nanoparticle syntheses in low-resource settings. Herein, a low-cost, simple-to-fabricate, and easy-to-operate acoustofluidic microfluidic device is developed and applied for the fabrication of PLGA nanoparticles. To do this, acoustic streaming flows are induced inside glass capillaries through exciting different flexural modes. These flexural modes generate different oscillation profiles. We explored these flexural modes and identified the modes that can generate strong acoustic streaming vortices through applying harmonic forcing to the fluid medium. Nanoparticle synthesis occurs through a rapid mixing of PLGA including acetone solvent and polyvinyl alcohol (PVA) including water that forms an azeotropic liquid mixture. PLGA nanoparticle fabrication spontaneously initiates through small nucleation formations. Then, by the addition of further PLGA around these nucleation spots, agglomerations occur and increase the sizes of the nanoparticles. Finally, these PLGA nanoparticles harden through a diffusion of the acetone solvent out of the polymer matrix into the surrounding water mixture. The acoustofluidic device consists of a glass capillary, piezotransducers, and polydimethylsiloxane (PDMS) adaptors replicated from 3D printed molds. Monodispersed PLGA nanoparticles of various sizes are fabricated using this simple acoustofluidic device. Because it does not rely on complex clean-room fabrication processes, the presented acoustofluidic device carries great potential in fabricating controllable nanoparticles for various applications, including precision medicine.
II. METHOD
A. Device fabrication
Fabrication of the acoustofluidic device starts with 3D printing of master molds for the soft lithography of PDMS adaptors. The molds with the adaptor features are printed using polylactic acid (PLA) filaments of 1.75 mm diameter in a consumer-grade, fused deposition modeling–based 3D printer (i3 Mega, Anycubic, Shenzhen, China). Then, soft lithography is applied to cast PDMS adaptors with two and one inlet designs. For this, liquid PDMS and a curing agent (Sylgard 184, Dow-Corning, USA) are mixed in a 10:1 ratio and poured over the 3D printed molds. To prevent shape deformations of PLA molds at elevated temperatures, the liquid PDMS mixture is cured at 30 °C for around 15 h. Once the curing is completed, the adaptors are pealed from the mold, and inlet and outlet ports are punched by a reusable biopsy punch (Harris Uni-Core, USA). Due to the layered nature of the 3D printed molds, the bottom surface of the demolded PDMS adaptor becomes rough, which may lead to leakage in the traditional glass-PDMS bonding approach. For this reason, a flat PDMS layer is used to seal the open side of the PDMS adaptors. For this, the liquid PDMS mixture is poured in a Petri dish of about 2 mm thickness. The PDMS layer is initially only half-cured to generate a slightly deformable surface to provide a complete bonding between the two PDMS surfaces. After plasma activation and bonding, the PDMS assembly is further cured at 60 °C for 2 h. The adaptors are fabricated from PDMS rather than directly forming them in the 3D printer because the organic solvent used in nanoparticle fabrication can dissolve PLA.
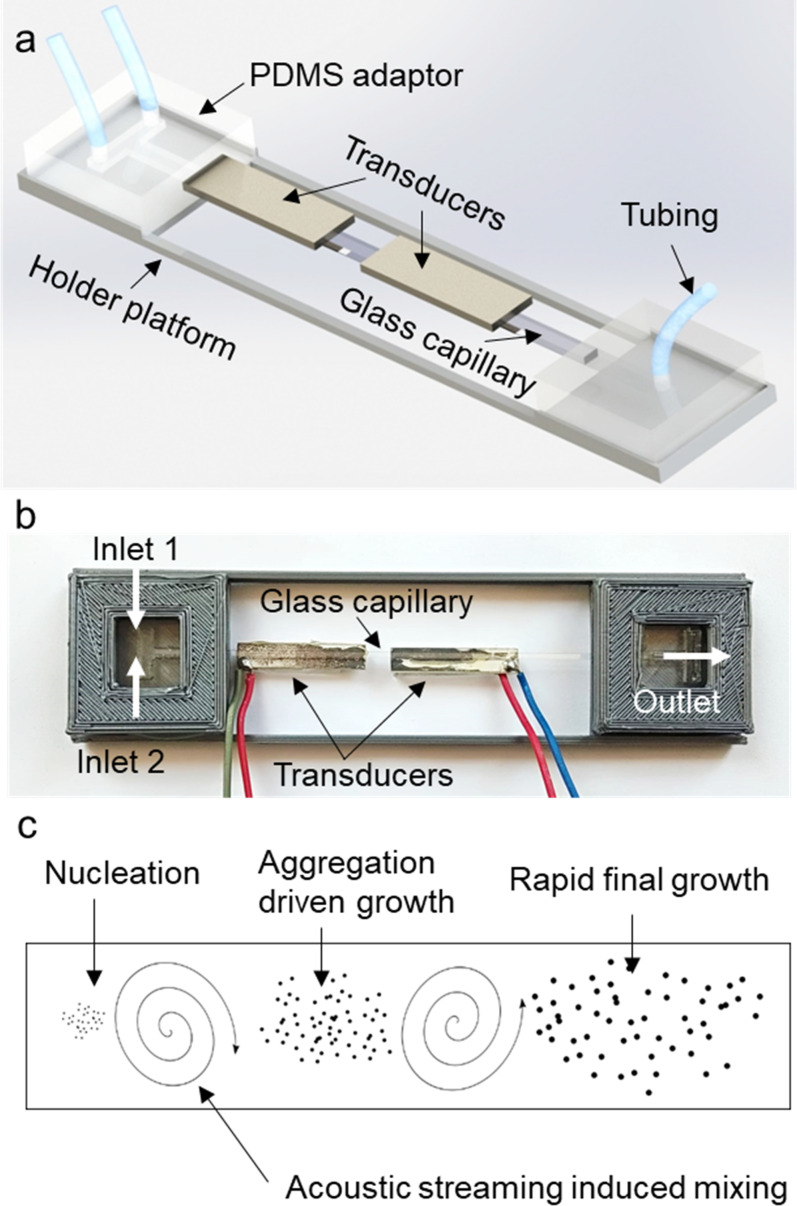
In the second step of the device fabrication, a glass capillary with a 100 × 1000 μm2 inner cross section and 100 mm length (Vitrocom, NJ, USA) is inserted into the side openings of the PDMS adaptors. A rectangular cross-sectioned capillary is chosen due to its higher flexibility compared with the square and circular cross-sectioned capillaries. Circular cross-sectioned capillaries are also difficult to evenly bond to the transducers, and they prevent clear imaging inside the fluidic medium due to their curved surfaces. Each side of the glass capillary is pushed about 5 mm through which about 90 mm of the capillary is left exposed between the two adaptors. A fast-curing epoxy (E340, Akfix, Istanbul, Turkey) is applied around the ports to provide complete sealing. A 3D printed PLA holder platform is designed to make the fluidic device more robust and prevent any potential damage to the thin glass capillary. Hot silicone is applied to fix the PDMS adaptors in place within the holder. Then, two piezo transducers (SMPL26W8T07111, Steminc, FL, USA) are attached to the glass slide using the epoxy glue. The piezo transducers with dimensions of 26 × 8 × 0.7 mm3 are found to be more suitable and efficient for this study in terms of their shape and resonance behavior ranging between 100 and 300 kHz. For the inlets and the outlet, a polyethylene tubing (10793527, Smith's Medical, USA) is inserted into the top ports of the PDMS adaptors. The schematic illustration and the picture of the acoustofluidic device are shown in Fig. 1. The positions of the piezo-transducers are chosen to be close to the ends of the capillaries to minimize the bending of the glass capillaries due to the weight of the transducers. Details of mold preparation and device assembly are given in Fig. S1 in the supplementary material.
FIG. 1.
Assembled acoustofluidic device. (a) A schematic depiction of the components of the device. (b) The actual device is shown. (c) A schematic depiction of PLGA nanoparticle formation through rapid mixing and solution diffusion.
B. Device operation
The acoustofluidic device is driven by an arbitrary waveform generator (AFG1062, Tektronix, OR, USA) by applying sinewaves to the transducers. The resonant frequencies of the transducers are measured using a vector network analyzer (NanoVNA, Huayang, Guangdong, China). A digital oscilloscope is used to measure the signal characteristics of the applied sinewaves (TBS2104, Tektronix, OR, USA). The acoustic transducers are driven at 20 VPP and between 180 and 250 kHz frequencies. Polystyrene microparticles with 1 and 5 μm diameters in de-ionized (DI) water are used to visualize the acoustic streaming flows occurring inside the glass capillary. Food dye mixed water and clear water are used in the micromixing demonstrations. The experiments are conducted under an inverted optical microscope (OX.2053-PLPH, Euromex, Arnhem, Netherlands). Videos and images of the fluid mixing and acoustic streaming visualization experiments are recorded using a CMOS digital microscope camera (HD-Ultra, Euromex, Arnhem, Netherlands). Fluids are injected into the acoustofluidic device by implementing a custom-made syringe pump.35
C. Nanoparticle fabrication and characterization
PLGA nanoparticles are fabricated through micromixing poly(d,l-lactide-co-glycolide) (P2191, Sigma-Aldrich, Germany) dissolved in acetone and polyvinyl alcohol (PVA) (360627, Sigma-Aldrich, Germany) dissolved in DI water. PVA is a water-soluble surfactant that is frequently used to stabilize nanoparticles. First, %3 (w/v) PLGA/acetone and %1 (w/v) PVA/water solutions are prepared and loaded in 1 ml syringes. In all the experiments, solvent concentrations are kept the same, and the flow rate ratio between the PLGA and the PVA solutions is controlled. For comparison, PLGA nanoparticles are also prepared via a bulk method in which 1 ml PLGA solution is mixed with 10 ml PVA solution for 1 min using a benchtop vortex mixer. The size of nanoparticles prepared with both methods is characterized based on dynamic light scattering (Zetasizer Nano ZSP, Malvern, UK). The PLGA nanoparticles are also imaged using a scanning electron microscope (Philips XL 30S FEG, Japan) to observe their shape morphologies.
III. RESULTS AND DISCUSSION
A. Fluid manipulation mechanism
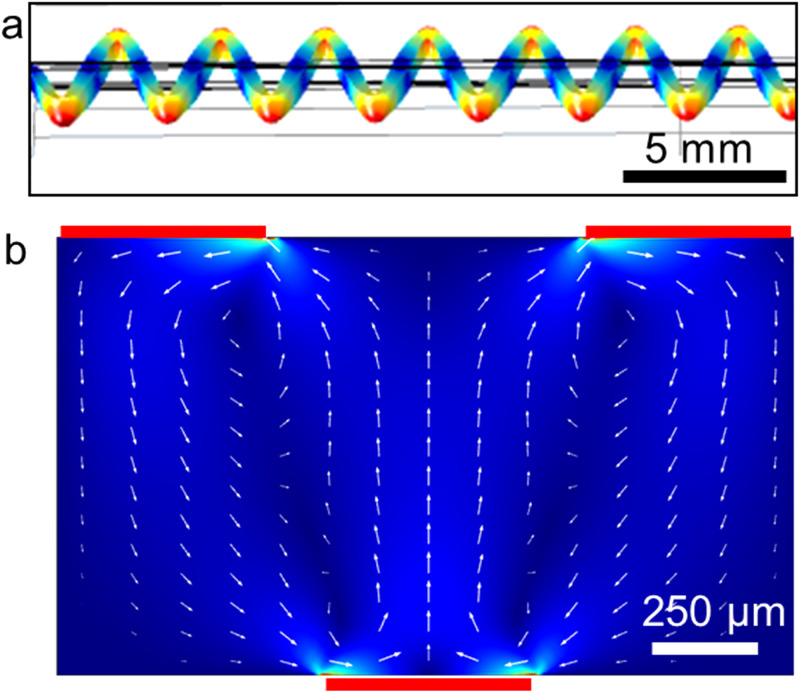
When the glass capillary is driven into oscillations, distinct flexural modes appear at certain frequencies. One of these modes that occurs at 201.4 kHz is shown in Fig. 2(a). A modal analysis of the glass capillary reveals different flexural modes appearing at distinct frequencies. Some of the modes are shown in Fig. S2 in the supplementary material. Characterization of the frequency response of a transducer that is glued to the glass capillary is also given in Fig. S3 in the supplementary material. From the return loss vs frequency plot, lowest return loss values are observed between 180 and 250 kHz. It is aimed to use the periodic displacement of the glass capillary that is shown in Fig. 2(a) as the oscillating walls inside the capillary. Localized displacements of the glass capillary can act as harmonic forcing applied to the fluid inside the capillary. Nonharmonic response of the fluid due to the viscous attenuation results in acoustic streaming vortices. Numerical simulation of the acoustic streaming inside the glass capillary is shown in Fig. 2(b). The simulations are based on the previous reports of Nama et al. in which Nyborg's perturbation approach is applied to solve Navier–Stokes equations for compressible and viscous fluids.36
FIG. 2.
Numerical simulations of (a) the glass slide vibration mode at 201.41 kHz and (b) acoustic streaming flow.
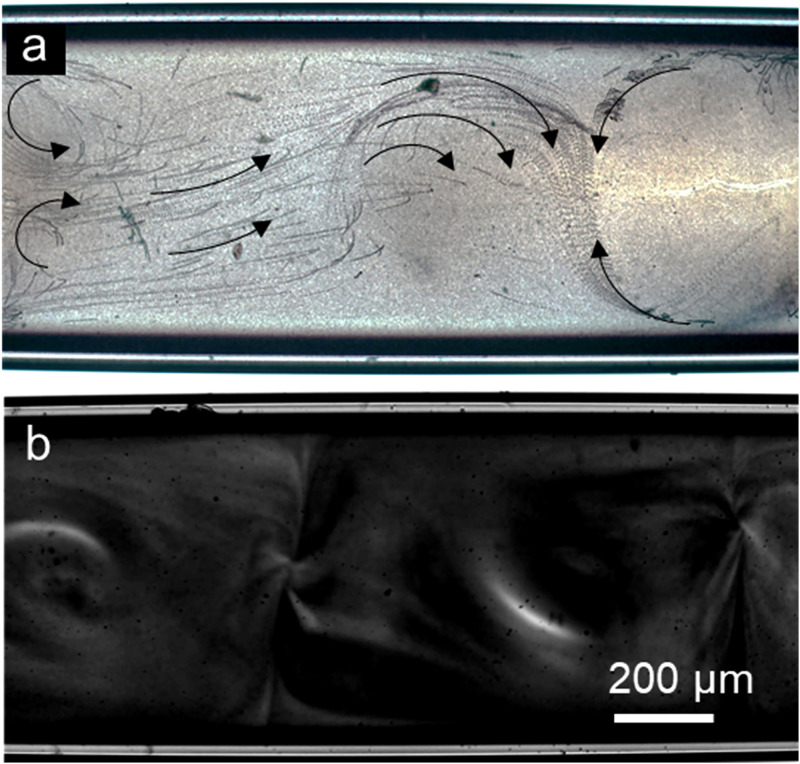
An experimental observation of the tracer particles reveals the streaming flows as shown in Fig. 3(a) (see Video 1 in the supplementary material). The counter-rotating vortices are generated inside the glass capillary, but they appear to be slightly distorted compared with the numerical simulations. Considering the sensitivity of these flexural modes to the applied frequency and possible nonlinear effects that can arise from imperfections of the device, it is a reasonable deviation from the simulated streaming flows. Application of these streaming vortices in breaking laminar flow and generating turbulent flow is shown in Fig. 3(b) (see Video 2 in the supplementary material). Here, the transducers are driven at about 202 ± 2 kHz frequency and 20 VPP applied voltages. This frequency was chosen by sweeping the frequency between 180 and 250 kHz, which is defined by the impedance analysis of the transducers. The best mixing performance was observed around 202 kHz. As shown in Fig. 3(b) and Video in the supplementary material, the laminar flows of inked and clear water streams are mixed through the generated acoustic streaming vortices.
FIG. 3.
Demonstration of acoustic streaming inside the acoustofluidic device. (a) 1 and 5 μm diameter polystyrene particles are used to visualize acoustic streaming as z-stacked images (see Video 1 in the supplementary material). (b) Food dye color DI water is mixed by the acoustic streaming vortices inside the capillary (see Video 2 in the supplementary material).
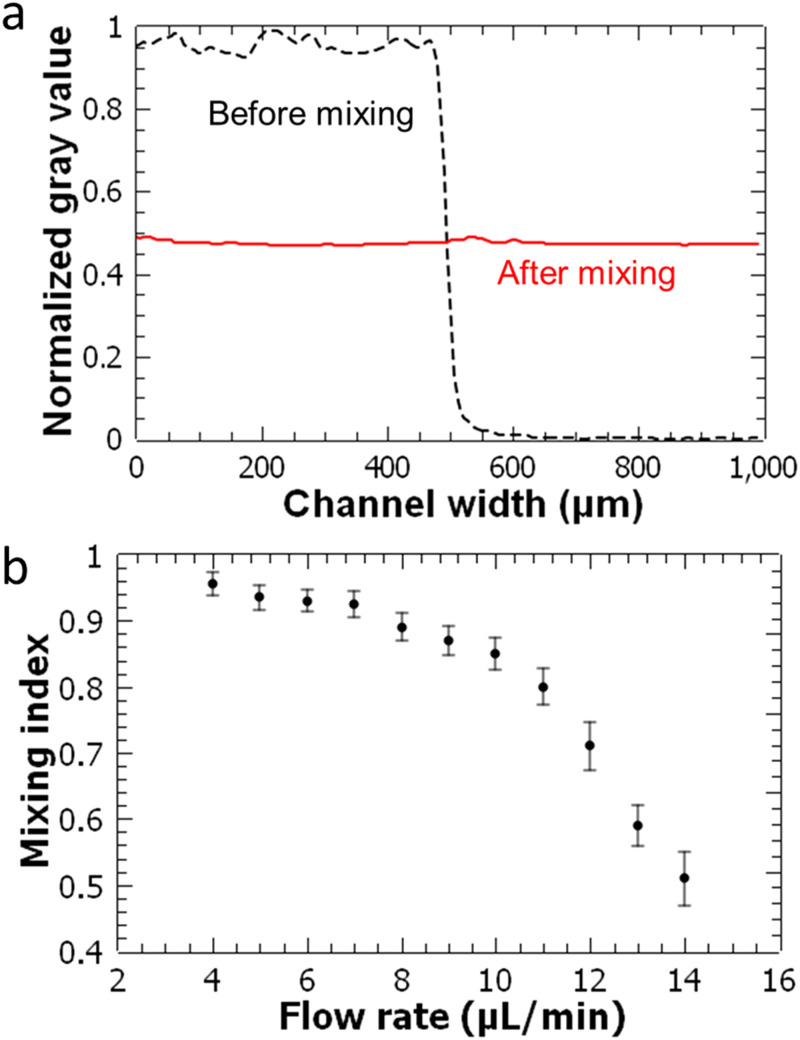
In our previous work, similar acoustic streaming vortices were generated at much lower frequencies and harnessed to provide directional fluid pumping in microfluidic channels.30 Here, the streaming vortices are generated along the glass capillary to manipulate the fluid flows and induce turbulence for actively controllable micromixing applications. It is a common practice to evaluate fluid mixing in microfluidics by analyzing grayscale variations across the channels.37,38 An example normalized grayscale profile of unmixed and mixed DI water and food dye solutions is shown in Fig. 4(a). For the quantitative characterization of the mixing, a mixing index, M, is used, which is defined as
Here, n is the number of pixels along the line of interest, Ii is the grayscale intensity at the ith pixel, and Im is the average grayscale intensity. Based on the previous reports, the mixing can be considered to be uniform for the values of M above 0.85.39
FIG. 4.
Evaluation of mixing performance of the acoustofluidic device. (a) Grayscale intensity of unmixed and mixed food dye and DI water fluids across the channel width. (b) Calculated mixing index values as a function of the total flow rate. Error bars are generated from the standard deviation of at least three measurements for each point.
Micromixing performance of the acoustofluidic device is evaluated at different total flow rates. Starting from 4 μl/min (2 μl/min for the inked and 2 μl/min for the clear flow), the total flow rate is increased up to 14 μl/min. The transducers are driven with around 202 kHz frequency and 20 VPP applied voltage values. For each flow condition, the mixing index is calculated for three different experiments [Fig. 4(b)]. For the total flow rate up to 10 μl/min, mixing index values above 0.85 are observed, which indicates that the fluids are uniformly mixed. As the total flow rate is increased beyond 10 μl/min, the mixing performance of the acoustofluidic device decreases for the given acoustic parameters. Since higher oscillation amplitudes yield stronger streaming flows, it may be possible to improve the mixing performance at these higher flow rates by applying higher voltage amplitudes. We can currently apply only up to 20 VPP with the available equipment.
The mixing time of the acoustofluidic device is also evaluated from inked and clear fluid mixing experiments by timing the entire mixing duration. For this, homogenous fluid mixing through the width of the glass capillary is considered. For the total flow rate 10 μl/min, mixing time for complete mixing across the 100-μm width of the capillary is found to be ∼103 ms (see Fig. S4 in the supplementary material). This mixing time is comparable to the performances of various reported microfluidic mixers.40,41 It is also important to note that, even without the complete mixing occurring across the entire channel, nanoparticle fabrication can still happen as long as the reagents continuously mix in the device.
The presented acoustofluidic device is shown to generate active fluid mixing inside the glass capillaries. Compared with the similar active micromixers including the existing acoustofluidic systems, this device is simpler and can be fabricated at a low cost. Off-the-shelf glass capillaries are formed into functional acoustofluidic devices by using a consumer-grade 3D printer. A similar simple-device-assembly approach has also been reported in some acoustofluidic devices that are used for particle/cell manipulation through harnessing acoustic radiation forces.42–44 The presented acoustofluidic device is simple to fabricate, but it is also important to discuss its mass producibility. Here, PDMS adaptors are used to couple fluids into glass capillaries. PDMS is a great choice for research and prototyping but not suitable for mass production. An alternative to PDMS adaptors could be simple Y junction plastic adaptors that can be fabricated in large quantities through injection molding. This way, off-the-shelf glass capillaries can be plugged into these adaptors to form the device. In addition to device fabrication simplicity, mobile driving units are needed for such devices to enable mobility and portability. Some examples of dedicated driving circuitries for acoustofluidic devices have already been demonstrated.45,46 Similar practical solutions can be developed to offer a truly mobile acoustofluidic system.
B. PLGA nanoparticle fabrication
The micromixing capability of the acoustofluidic device is implemented to fabricate PLGA nanoparticles. In this approach, first 3% PLGA and 2% PVA solutions are injected from the two inlets of the device at a total flow rate of 8 μl/min. For this flow rate, the polymer to water volumetric flow rate ratios gradually decrease from 0.9 to 0.1.
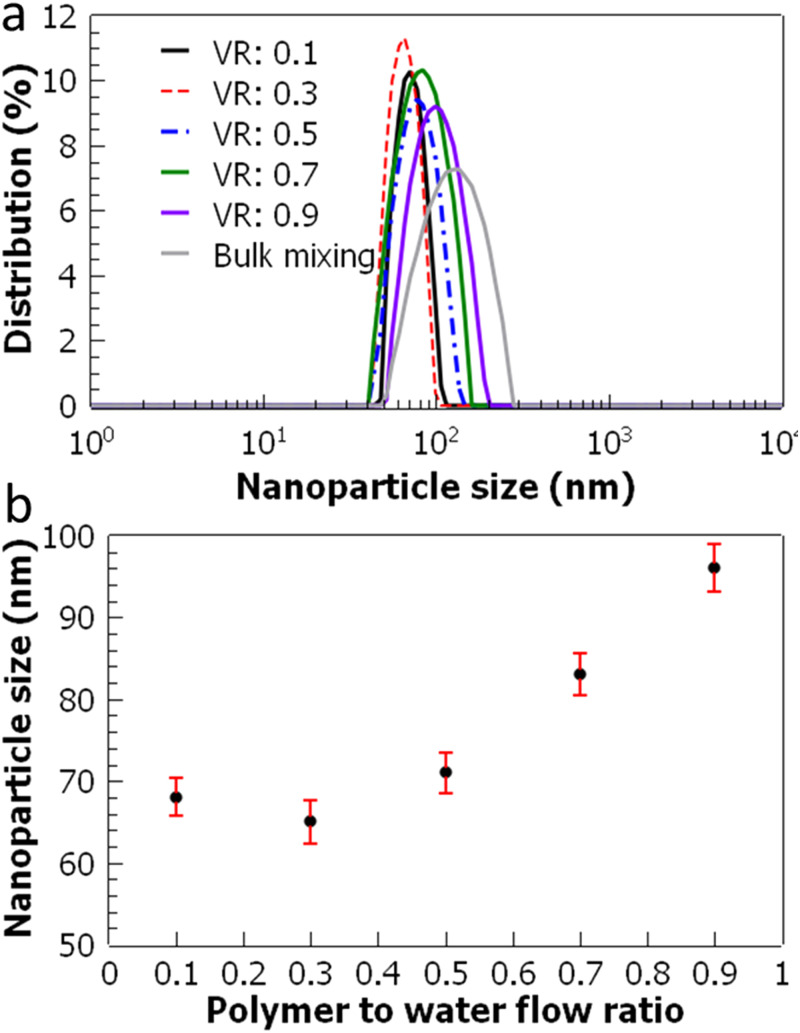
Size distribution of the nanoparticles fabricated at increasing flow ratios is measured using dynamic light scattering (Fig. 5). At the highest flow ratio of 0.9, the PLGA flow rate is almost the same as the flow rate of water, which results in the largest diameter PLGA nanoparticles fabricated in the acoustofluidic device. As the flow rate ratio is reduced, the nanoparticle sizes also decrease and approximately plateau between 0.5 and 0.1. The smallest nanoparticle size seems to occur at the polymer to water flow ratio of 0.3, which results in 65 ± 2.7 nm. The polydispersity index (PDI) of the fabricated nanoparticles is also measured and given in Table I. It is also worth noting that even though the smallest nanoparticle size is achieved at the flow ratio of 0.3, PDI values further decrease from 0.08 to 0.05 for the flow ratio of 0.1. It is likely that the further decrease of flow ratio yields more uniformly sized nanoparticles, even though the average size of the nanoparticles plateaus. To further test the reproducibility and reliability of the acoustofluidic device, each experimental condition is repeated in two additional acoustofluidic devices. For each device, the set of experiments are repeated three times, and the average values are calculated. Averaged nanoparticle sizes obtained from three different devices are found to be deviated less than 4% for each flow condition.
FIG. 5.
Characterization of PLGA nanoparticles as a function of volumetric flow ratio. (a) Nanoparticle size distributions are shown. (b) Nanoparticle size is plotted as a function of polymer to water flow ratio. The total flow rate is kept constant at 8 μl/min. The error bars represent the standard deviation of three repeated experiments.
TABLE I.
Comparison of nanoparticle size and PDI measurements of PLGA nanoparticles fabricated at different flow rate ratios in the acoustofluidic mixer and using bulk mixing.
| Flow ratio | 0.1 | 0.3 | 0.5 | 0.7 | 0.9 | Bulk mixing |
|---|---|---|---|---|---|---|
| Nanoparticle diameter | 68 nm | 65 nm | 71 nm | 83 nm | 96 nm | 124 nm |
| PDI | 0.05 | 0.08 | 0.12 | 0.16 | 0.18 | 0.25 |
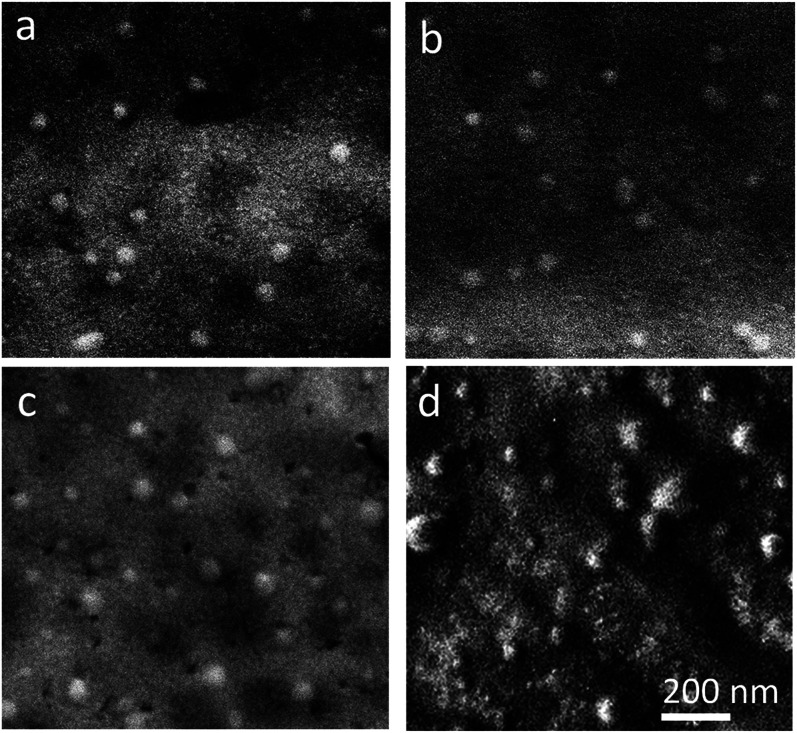
As shown in Table I, the nanoparticles fabricated in the acoustofluidic mixer yield lower PDI values compared with those of the bulk method. Scanning Electron Microscope (SEM) images of the PLGA nanoparticles fabricated with flow ratios of 0.1, 0.5, and 0.9 and bulk mixing are displayed in Fig. 6. Shapes and size distributions of the nanoparticles that are fabricated through acoustofluidic mixing are more uniform compared with those of the bulk method.
FIG. 6.
Scanning Electron Microscope (SEM) images of PLGA nanoparticles fabricated with the volumetric flow rate ratios of (a) 0.1 (b) 0.5, and (c) 0.9 and (d) bulk mixing.
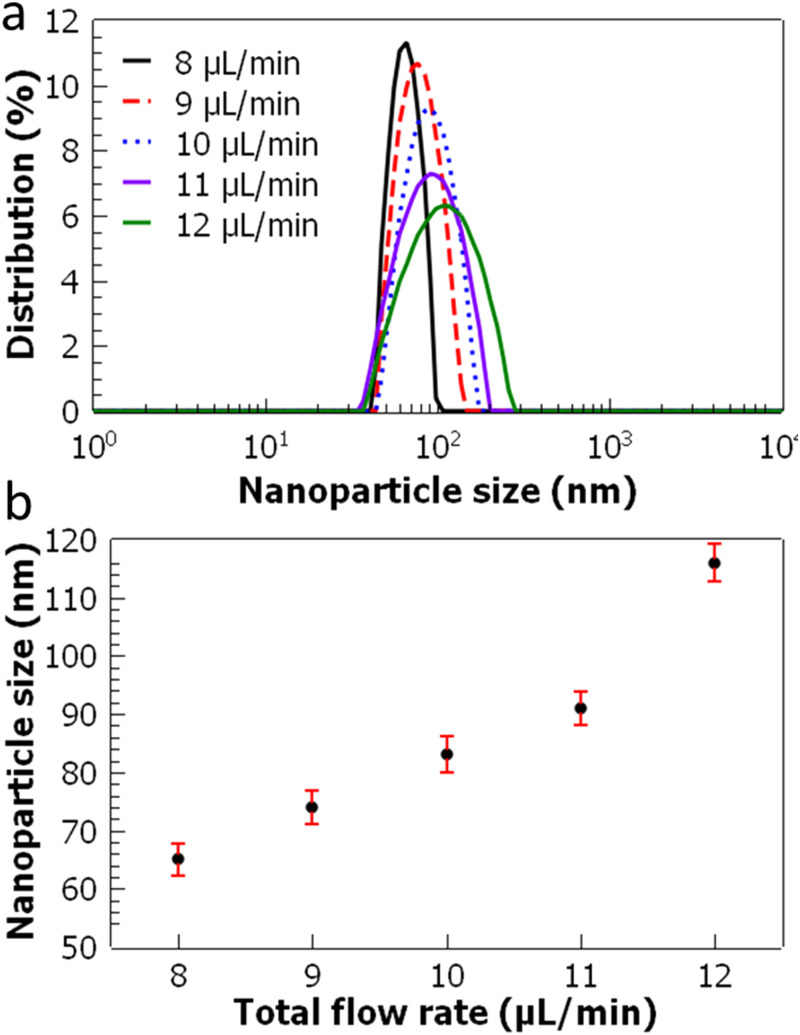
Next, the effect of the total flow rate of polymer and water streams is investigated. In this experiment, the polymer to water flow ratio is fixed at 0.3, which yields the smallest sized PLGA nanoparticles as shown in Fig. 7. The total flow rate is gradually increased from 8 to 12 μl/min, and PLGA nanoparticles are fabricated through acoustofluidic mixing. It is found that the size of the PLGA nanoparticles increases with the increasing total flow rate. This can be related to the mixing performance of the acoustofluidic mixer as a function of the total flow rate (Fig. 4). As the total flow rate is varied from 8 to 12 μl/min, the mixing index drops from 0.9 to 0.6, which indicates a decrease in mixing uniformity. It can be inferred that the mixing uniformity of the polymer and water flows affects the size of the PLGA nanoparticles. At higher flow rates, acoustic vortices generated within the glass capillary are gradually suppressed, and their mass transport capacity drops, which can influence the nanoparticle formation process.
FIG. 7.
Characterization of PLGA nanoparticles as a function of the total flow rate. (a) Nanoparticle size distributions are shown. (b) Nanoparticle size is plotted as a function of the total flow rate. The polymer to water flow rate ratio is kept constant at 0.3. The error bars represent the standard deviation of three repeated experiments.
C. Nanoparticle throughput
The target application of this work is the fabrication of nanoparticles that can be potentially used for personalized nanomedicine. As stated earlier, the amounts of nanoparticles used in nanomedicine applications are between 0.3 and 15 mg/day, with costs varying from 96 to 1646 USD for each dose.32 In this work, a 3% (w/v) poly(d,l-lactide-co-glycolide) solution is used to fabricate the nanoparticles, which corresponds to 30 mg/ml polymer content. Considering the set of parameters where the polymer to water flow rate ratio is 0.5 and the total flow rate is 10 μl/min (0.6 ml/h), we can roughly estimate the amount of the PLGA nanoparticles that can be fabricated in 1 h as ∼9 mg. Compared with the amounts of the nanomedicine administered in clinical applications, 9 mg/h can be regarded as a reasonable throughput.
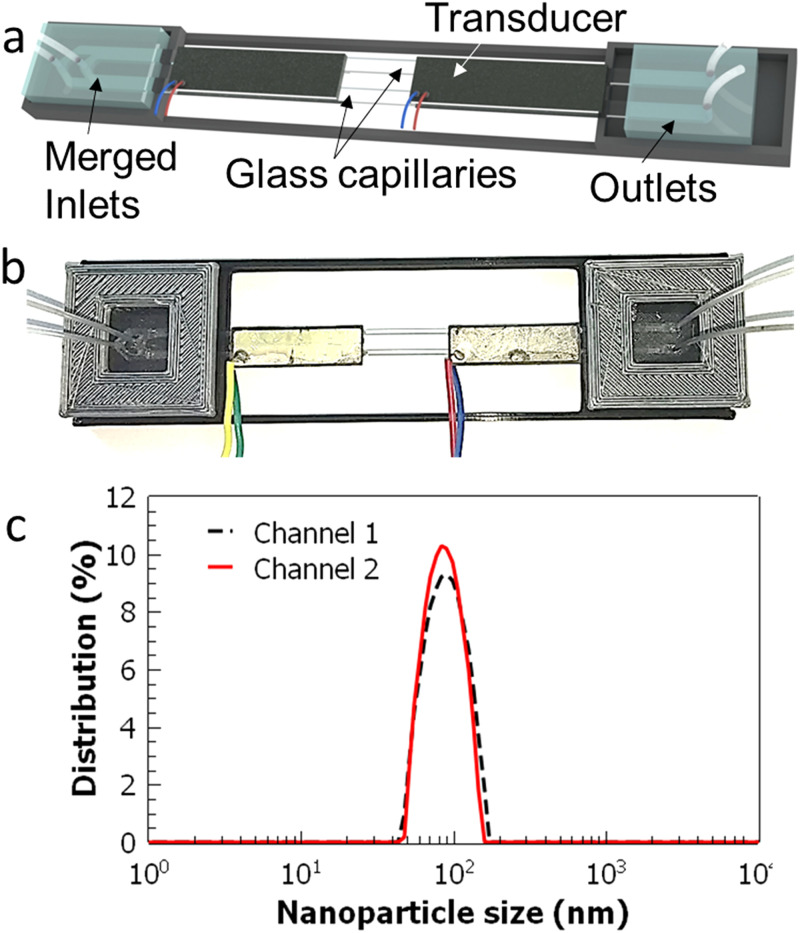
To further improve the throughput of PLGA nanoparticle fabrication, a multi-channel acoustofluidic device is designed and fabricated. As shown in Figs. 8(a) and 8(b), this new design includes two parallel glass capillaries and modified PDMS adaptors. The piezo-transducer is wide enough to accommodate the capillaries without affecting the working mechanism of the device. With the new design, PLGA nanoparticles are fabricated at the total flow rate of 20 μl/min and with the polymer to water flow rate ratio of 0.5. In the multi-channel device, the average sizes of the nanoparticles collected from two channels are calculated to be 88 ± 3.1 and 91 ± 2.9 nm (averages of five different batches) with PDI values of 0.15 and 0.12, respectively. It is found that the deviation of the nanoparticle sizes between the two channels is only about 3%. With this new approach, the throughput of the device is estimated to be ∼18 mg/h. It could potentially be possible to increase the number of the channels more by using a wider piezo-transducer, which could further improve the throughput of the device.
FIG. 8.
Demonstration of a multi-channel acoustofluidic device. (a) Schematic depiction and (b) picture of the device with two glass capillaries are shown. PDMS adaptors are modified to allow independent fluid infusion and collection from each channel. (c) PLGA nanoparticles that are fabricated in the two-channel device show very similar size distributions of 88 ± 3.1 and 91 ± 2.9 nm collected from each channel. Nanoparticle sizes are averaged from measurements of five different batches.
IV. CONCLUSION
A low-cost, simple-to-fabricate, and functional acoustofluidic mixer was developed and applied to fabricate PLGA nanoparticles. In this work, commonly available components and straightforward fabrication processes were implemented to enable a versatile acoustofluidic device. Glass capillaries were formed into microfluidic channels by using PDMS adaptors. Instead of cleanroom microfabrication, 3D printing was used to fabricate master molds for PDMS casting. Through acoustic excitation of the glass capillary, acoustic streaming vortices were generated and employed for mixing fluids. For a wide range of flow rates, uniform mixing was achieved. PLGA polymer and water solutions were mixed at different flow rate ratios and total flow rates to fabricate PLGA nanoparticles.
The size of the nanoparticles was shown to be controlled both by the polymer to water flow ratio and by the total flow rate. PLGA nanoparticles with as low as 65 nm diameters with 0.08 PDI values were obtained through acoustic mixing at a flow rate of 10 μl/min. To further improve the throughput of the acoustofluidic device, a multi-channel design was fabricated with two parallel glass capillaries and modified PDMS adaptors. While the total flow rate was doubled, the averaged nanoparticle sizes from two different capillaries showed only around 3% deviation. Compared with the bulk mixing approach, the acoustofluidic device yielded smaller and more uniform PLGA nanoparticles. Considering its low-cost and simple operation, this acoustofluidic mixing approach can be implemented for microfluidic mixing applications in laboratories with limited resources.
SUPPLEMENTARY MATERIAL
See the supplementary material for details of the PDMS adaptor fabrication, modal analysis of the glass capillaries, and characterization of the frequency response of the transducers.
ACKNOWLEDGMENTS
We thank Dr. Nitesh Nama for his support and help with the numerical simulations. This work was supported by The Scientific and Technological Research Council of Turkey (TUBITAK) 3501 grant (Project No. 218M257) and Aydın Adnan Menderes University Research Fund (BAP), Project No. MF-20002.
AUTHOR DECLARATIONS
Conflict of Interest
The authors have no conflicts to disclose.
DATA AVAILABILITY
The data that support the findings of this study are available from the corresponding author upon reasonable request.
REFERENCES
- 1.Nette J., Howes P. D., and DeMello A. J., Adv. Mater. Technol. 5, 2000060 (2020). 10.1002/admt.202000060 [DOI] [Google Scholar]
- 2.Valencia P. M., Farokhzad O. C., Karnik R., and Langer R., Nat. Nanotechnol. 7, 623 (2012). 10.1038/nnano.2012.168 [DOI] [PMC free article] [PubMed] [Google Scholar]
- 3.Hao N., Nie Y., and Zhang J. X. J., Int. Mater. Rev. 63, 461 (2018). 10.1080/09506608.2018.1434452 [DOI] [Google Scholar]
- 4.Yang J., Jia C., and Yang J., Int. J. Med. Sci. 18, 2943 (2021). 10.7150/ijms.60874 [DOI] [PMC free article] [PubMed] [Google Scholar]
- 5.Liu D., Zhang H., Fontana F., Hirvonen J. T., and Santos H. A., Lab Chip 17, 1856 (2017). 10.1039/C7LC00242D [DOI] [PubMed] [Google Scholar]
- 6.Ma J., Wang Y., and Liu J., Micromachines 8, 255 (2017). 10.3390/mi8080255 [DOI] [Google Scholar]
- 7.Shrimal P., Jadeja G., and Patel S., Chem. Eng. Res. Des. 153, 728 (2020). 10.1016/j.cherd.2019.11.031 [DOI] [Google Scholar]
- 8.Akther A., Marqus S., Rezk A. R., and Yeo L. Y., Anal. Chem. 92, 10024 (2020). 10.1021/acs.analchem.0c01757 [DOI] [PubMed] [Google Scholar]
- 9.Rezvantalab S. and Keshavarz Moraveji M., RSC Adv. 9, 2055 (2019). 10.1039/C8RA08972H [DOI] [PMC free article] [PubMed] [Google Scholar]
- 10.Huang P. H., Zhao S., Bachman H., Nama N., Li Z., Chen C., Yang S., Wu M., Zhang S. P., and Huang T. J., Adv. Sci. 6, 1900913 (2019). 10.1002/advs.201900913 [DOI] [PMC free article] [PubMed] [Google Scholar]
- 11.Marre S. and Jensen K. F., Chem. Soc. Rev. 39, 1183 (2010). 10.1039/b821324k [DOI] [PubMed] [Google Scholar]
- 12.Kim D.-Y., Jin S. H., Jeong S.-G., Lee B., Kang K.-K., and Lee C.-S., Sci. Rep. 8, 8525 (2018). 10.1038/s41598-018-26829-z [DOI] [PMC free article] [PubMed] [Google Scholar]
- 13.Lu M., Ozcelik A., Grigsby C. L. C. L., Zhao Y., Guo F., Leong K. W. K. W., and Huang T. J. T. J., Nano Today 11, 778 (2016). 10.1016/j.nantod.2016.10.006 [DOI] [PMC free article] [PubMed] [Google Scholar]
- 14.Duraiswamy S. and Khan S. A., Small 5, 2828 (2009). 10.1002/smll.200901453 [DOI] [PubMed] [Google Scholar]
- 15.Ahn J., Ko J., Lee S., Yu J., Kim Y., and Jeon N. L., Adv. Drug Delivery Rev. 128, 29 (2018). 10.1016/j.addr.2018.04.001 [DOI] [PubMed] [Google Scholar]
- 16.Destgeer G., Ouyang M., and Di Carlo D., Anal. Chem. 93, 2317 (2021). 10.1021/acs.analchem.0c04184 [DOI] [PubMed] [Google Scholar]
- 17.Destgeer G., Ouyang M., Wu C.-Y., and Di Carlo D., Lab Chip 20, 3503 (2020). 10.1039/D0LC00698J [DOI] [PubMed] [Google Scholar]
- 18.Zhao S., Huang P.-H., Zhang H., Rich J., Bachman H., Ye J., Zhang W., Chen C., Xie Z., Tian Z., Kang P., Fu H., and Huang T. J., Lab Chip 21, 2453 (2021). 10.1039/D1LC00265A [DOI] [PMC free article] [PubMed] [Google Scholar]
- 19.Niculescu A.-G., Chircov C., Bîrcă A. C., and Grumezescu A. M., Nanomaterials 11, 864 (2021). 10.3390/nano11040864 [DOI] [PMC free article] [PubMed] [Google Scholar]
- 20.Destgeer G., Hashmi A., Park J., Ahmed H., Afzal M., and Sung H. J., RSC Adv. 9, 7916 (2019). 10.1039/C8RA09859J [DOI] [PMC free article] [PubMed] [Google Scholar]
- 21.Wu Z., Cai H., Ao Z., Nunez A., Liu H., Bondesson M., Guo S., and Guo F., Anal. Chem. 91, 7097 (2019). 10.1021/acs.analchem.9b00069 [DOI] [PubMed] [Google Scholar]
- 22.Lenshof A., Magnusson C., and Laurell T., Lab Chip 12, 1210 (2012). 10.1039/c2lc21256k [DOI] [PubMed] [Google Scholar]
- 23.Ao Z., Cai H., Wu Z., Ott J., Wang H., Mackie K., and Guo F., Lab Chip 21, 688 (2021). 10.1039/D0LC01141J [DOI] [PMC free article] [PubMed] [Google Scholar]
- 24.Friend J. and Yeo L. Y., Rev. Mod. Phys. 83, 647 (2011). 10.1103/RevModPhys.83.647 [DOI] [Google Scholar]
- 25.Yeo L. Y. and Friend J. R., Annu. Rev. Fluid Mech. 46, 379 (2014). 10.1146/annurev-fluid-010313-141418 [DOI] [Google Scholar]
- 26.Dentry M. B., Friend J. R., and Yeo L. Y., Lab Chip 14, 750 (2014). 10.1039/C3LC50933H [DOI] [PubMed] [Google Scholar]
- 27.Zhang Y., Huang J., and Guo X., J. Micromech. Microeng. 31, 094001 (2021). 10.1088/1361-6439/ac1658 [DOI] [Google Scholar]
- 28.Shilton R. J., Travagliati M., Beltram F., and Cecchini M., Appl. Phys. Lett. 105, 074106 (2014). 10.1063/1.4893975 [DOI] [Google Scholar]
- 29.Huang X. Y., Wen C. Y., and Jiao Z. J., Appl. Acoust. 71, 164 (2010). 10.1016/j.apacoust.2009.08.002 [DOI] [Google Scholar]
- 30.Ozcelik A. and Aslan Z., Microfluid. Nanofluidics 25, 5 (2021). 10.1007/s10404-020-02411-w [DOI] [PMC free article] [PubMed] [Google Scholar]
- 31.Alijani H., Rezk A. R., Khosravi Farsani M. M., Ahmed H., Halim J., Reineck P., Murdoch B. J., El-Ghazaly A., Rosen J., and Yeo L. Y., ACS Nano 15, 12099 (2021). 10.1021/acsnano.1c03428 [DOI] [PubMed] [Google Scholar]
- 32.Weissig V., Pettinger T., and Murdock N., Int. J. Nanomed. 9, 4357 (2014). 10.2147/IJN.S46900 [DOI] [PMC free article] [PubMed] [Google Scholar]
- 33.Ma P., J. Nanomed. Nanotechnol. 04, 1000164 (2013). 10.4172/2157-7439.1000164 [DOI] [PMC free article] [PubMed] [Google Scholar]
- 34.Beltrán-Gracia E., López-Camacho A., Higuera-Ciapara I., Velázquez-Fernández J. B., and Vallejo-Cardona A. A., Cancer Nanotechnol. 10, 11 (2019). 10.1186/s12645-019-0055-y [DOI] [Google Scholar]
- 35.Akkoyun F. and Özçelik A., Eur. Mech. Sci. 4, 166 (2020). 10.26701/ems.769837 [DOI] [Google Scholar]
- 36.Nama N., Huang P. H., Huang T. J., and Costanzo F., Biomicrofluidics 10, 024124 (2016). 10.1063/1.4946875 [DOI] [PMC free article] [PubMed] [Google Scholar]
- 37.Luong T. D., Phan V. N., and Nguyen N. T., Microfluid. Nanofluidics 10, 619 (2011). 10.1007/s10404-010-0694-0 [DOI] [Google Scholar]
- 38.Tovar A. R. and Lee A. P., Lab Chip 9, 41 (2009). 10.1039/B812435C [DOI] [PubMed] [Google Scholar]
- 39.Ozcelik A., Ahmed D., Xie Y., Nama N., Qu Z., Nawaz A. A. A. A., and Huang T. J. T. J., Anal. Chem. 86, 5083 (2014). 10.1021/ac5007798 [DOI] [PMC free article] [PubMed] [Google Scholar]
- 40.Capretto L., Cheng W., Hill M., and Zhang X., Microfluidics 304, 27–68 (2011). 10.1007/128_2011_150 [DOI] [PubMed] [Google Scholar]
- 41.Cai G., Xue L., Zhang H., and Lin J., Micromachines 8, 274 (2017). 10.3390/mi8090274 [DOI] [PMC free article] [PubMed] [Google Scholar]
- 42.Fornell A., Baasch T., Johannesson C., Nilsson J., and Tenje M., J. Phys. D: Appl. Phys. 54, 355401 (2021). 10.1088/1361-6463/ac0841 [DOI] [Google Scholar]
- 43.Hammarström B., Evander M., Barbeau H., Bruzelius M., Larsson J., Laurell T., and Nilsson J., Lab Chip 10, 2251 (2010). 10.1039/c004504g [DOI] [PubMed] [Google Scholar]
- 44.Koo K., Lenshof A., Huong L. T., and Laurell T., Micromachines 12, 3 (2021). 10.3390/mi12010003 [DOI] [PMC free article] [PubMed] [Google Scholar]
- 45.Rajapaksa A., Qi A., Yeo L. Y., Coppel R., and Friend J. R., Lab Chip 14, 1858 (2014). 10.1039/C4LC00232F [DOI] [PubMed] [Google Scholar]
- 46.Huang A., Connacher W., Stambaugh M., Zhang N., Zhang S., Mei J., Jain A., Alluri S., Leung V., Rajapaksa A. E., and Friend J., Lab Chip 21, 1352 (2021). 10.1039/D0LC01008A [DOI] [PubMed] [Google Scholar]
Associated Data
This section collects any data citations, data availability statements, or supplementary materials included in this article.
Supplementary Materials
See the supplementary material for details of the PDMS adaptor fabrication, modal analysis of the glass capillaries, and characterization of the frequency response of the transducers.
Data Availability Statement
The data that support the findings of this study are available from the corresponding author upon reasonable request.


