

Abstract
Prion-like low complexity domains (PLCDs) have distinctive sequence grammars that determine their driving forces for phase separation. Here, we uncover the physicochemical underpinnings of how evolutionarily conserved compositional biases influence the phase behavior of PLCDs. We interpret our results in the context of the stickers-and-spacers model for phase separation of associative polymers. We find that tyrosine is a stronger sticker than phenylalanine whereas arginine is a context dependent auxiliary sticker. In contrast, lysine weakens sticker-sticker interactions. Increasing the net charge per residue destabilizes phase separation while also weakening the strong coupling between single-chain contraction in dilute phases and multi-chain interactions that give rise to phase separation. Finally, glycine and serine residues act as non-equivalent spacers, thus making glycine vs. serine contents an important determinant of the driving forces for phase separation. The totality of our results leads to a set of rules that enable comparative estimates of composition-specific driving forces for PLCD phase separation.
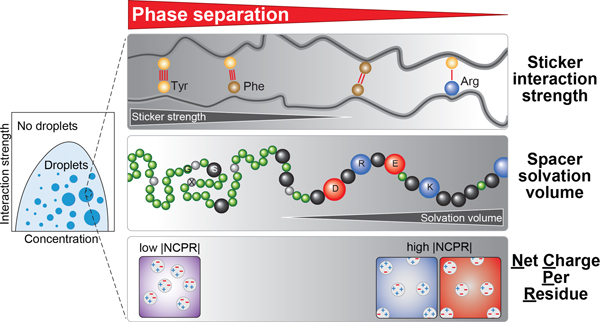
Graphical Abstract
Biomolecular condensates enable spatial and temporal organization of biochemical reactions that control key cellular processes such as division 1, signaling 2, transcriptional regulation 3, and stress response 4. In the latter, stress granule formation and dissolution are regulated by reversible phase transitions that are driven by a network of heterotypic protein-RNA interactions and homotypic protein-protein interactions 5, 6, 7. Many of the protein components of stress granules and other ribonucleoprotein bodies are RNA-binding proteins that feature tandem RNA-binding domains and intrinsically disordered prion-like low complexity domains (PLCDs) 8, 9. Mutations within PLCDs can cause neurodegenerative diseases such as Amyotrophic Lateral Sclerosis (ALS) 10, 11. The consequences of these mutations can be assessed by leveraging and building on our growing understanding of how sequence features contribute to the driving forces for phase separation in PLCDs 12, 13, 14. Here, we uncover rules and heuristics that lay the foundation for comparative assessments of phase behavior across a range of PLCDs.
PLCDs are biological instantiations of associative polymers that can be described using a stickers-and-spacers framework 13, 15, 16, 17. Stickers provide cohesive interactions for reversible, non-covalent crosslinks. Spacers provide scaffolds for stickers, and determine the effective solvation volume (ves), which is defined as the average volume per residue that is set aside for interactions with the solvent 16, 17, 18, 19, 20. Referenced against an ideal chain, for which ves is zero, the sequence-specific ves can be positive or negative. A positive value for ves points to favorable solvation of residues, on average, whereas negative values imply desolvation. Changes to spacers can alter the magnitude and sign of ves, thereby influencing the driving forces for phase separation and material properties of condensates 15, 17, 19, 20.
While the stickers-and-spacers framework is readily applicable to synthetic polymers such as ionomers where charged groups are clearly delineated from uncharged groups 21, PLCDs are finite-sized heteropolymers. This makes it difficult to know the identities of stickers vs. spacers, the strengths of different types of stickers, and the effects of spacers. In a recent study, the stickers-and-spacers framework was applied to model the phase behavior of the PLCD from isoform A of human hnRNPA1, referred to hereafter as the WT A1-LCD or A1-LCD 13. Aromatic residues, specifically Tyr and Phe, were shown to be the primary stickers that form reversible non-covalent crosslinks. The main finding was that the valence (number) of stickers and their patterning along the linear sequence determine the interplay among sticker-sticker, sticker-spacer, and spacer-spacer interactions that leads to condensates that dissolve above an upper critical solution temperature (UCST) 13. Further, the intramolecular residue-residue interactions that determine the dimensions of individual PLCD chains in dilute solutions were found to be equivalent to intermolecular interactions that drive phase separation 13, 22. This “strong coupling” between interactions that determine conformational and phase equilibria of PLCDs was attributed to the uniform distribution of aromatic stickers along the linear sequence 13. Importantly, the feature of strong coupling becomes useful for efficient computational calculations of full phase diagrams 22, 23, 24.
The previous studies raise several questions that remain unanswered: (1) Are Tyr and Phe residues equivalent to one another as stickers? (2) Are all non-aromatic residues equivalent to one another as generic spacers or do the complex compositions of PLCDs point to modulations of phase behavior by the physicochemical properties of different residues? (3) Are there sequence features that can weaken the strong coupling between interactions that determine contraction of single chains in dilute phases and multi-chain interactions? In what follows, we answer these questions through a combination of investigations that are motivated by observations we make regarding evolutionarily conserved amino acid compositions among A1-LCD homologs. We explore the differences between Tyr vs. Phe residues as stickers, the contributions of charged residues as spacers and / or auxiliary stickers, and the differences between Gly and Ser residues as spacers. We obtain a physicochemical rationalization for the conserved biases and covarying trends across A1-LCD homologs. We find that the coupling between the determinants of single-chain dimensions and the driving forces for phase separation can be disrupted by altering the net charge per residue (NCPR). PLCDs across FET family proteins have similar compositional biases; therefore, the rules that emerge from our findings can be used for quantitative predictions of how compositional biases drive phase separation across a wide range of PLCDs.
Results
If Tyr and Phe residues are equivalent as stickers and if the only requirement of a spacer is that it not be Tyr or Phe, we would expect only the valence and patterning of Tyr / Phe residues in the sequence to be conserved. To assess if this expectation is valid, we quantified the amino acid composition of A1-LCD (Fig. 1a) and analyzed the extent to which compositions are conserved across 848 PLCDs drawn from orthologs and paralogs (referred to hereafter as homologs) within the hnRNPA1 family (Extended Data Fig. 1). Sequences for PLCDs of hnRNPA1 were drawn from proteomes of unrelated organisms and include species that diverged ~750 M years ago 25. Despite this large evolutionary distance, we find that compositional biases are similar across PLCDs from homologous proteins (Extended Data Fig. 1). This suggests that there are conserved compositional preferences that contribute to the sequence grammar underlying the driving forces for phase separation of PLCDs. Accordingly, we pursued systematic investigations aimed at uncovering the physicochemical principles that underlie the conserved compositional biases across A1-LCD homologs.
Fig. 1: Compositional analysis and covariation of aromatic content of hnRNPA1.

(a) Amino acid sequence and compositional statistics for the PLCD from isoform a of hnRNPA1 – referred to in the text as A1-LCD. (b) 2D histogram quantifying covariations in fractions of Tyr versus Phe residues across PLCDs. (c) Diagram of aromatic content type and placement in variants. Numbers next to each schematic indicate the number of residues of a certain type. Vertical bars in the schematics indicate the positions of Phe (brown) and Tyr (yellow) residues. (d) Differential interference contrast (DIC) images showing dense liquid droplets. Solution conditions were 20 mM HEPES, 150 mM NaCl, pH 7.0. (e) Binodals of A1-LCD variants as a function of temperature in 20 mM HEPES, 150 mM NaCl, pH 7.0. (f) A1-LCD variant saturation concentrations measured at 4°C.
Impact of Tyr versus Phe on the driving forces for phase separation.
The fraction of aromatic residues across A1-LCD homologs is narrowly distributed around a mean value of 0.13 (Extended Data Fig. 1). Further analysis shows that the fractions of Phe and Tyr residues vary considerably across A1-LCD homologs. Interestingly, there is a negative correlation between the fractions of Phe and Tyr residues across 770 of the 848 sequences (see details in the Supplementary Methods) indicating a covariation between the fractions of Phe and Tyr (Fig. 1b). The observed anticorrelation between Tyr and Phe contents, together with the conservation of overall Tyr / Phe contents, could imply that Tyr and Phe are physicochemically interoperable. Alternatively, it could reflect a natural titration of stickers of different strengths, while keeping the valence roughly the same. To test these hypotheses, we generated variants of the A1-LCD that replaced all Tyr with Phe, or all Phe with Tyr residues (Fig. 1c, Supplementary Table 1). All variants have the same length and maintain the background of A1-LCD. The designations used in Fig. 1c reflect the numbers of Tyr / Phe residues that were added or removed.
We expressed and purified the variants (Supplementary Fig. 1) and characterized their temperature-dependent phase behaviors in vitro. Just like A1-LCD 17, the two variants form condensates giving rise to dense droplets at pH 7.0 and 20°C in the presence of 150 mM NaCl (Fig. 1d). Sedimentation assays 13, 26 were used to measure coexisting dilute and dense phase concentrations as a function of temperature and cloud point measurements were used to estimate the locations of critical points 27. Fig. 1e shows the measured coexistence curves and cloud points for the aromatic variants. The WT A1-LCD has 12 Phe and 7 Tyr residues distributed uniformly along the sequence (Fig. 1c). In the −12F+12Y variant, all Phe residues of the WT are replaced with Tyr residues. This increases the width of the two-phase regime, although the apparent critical point and the dense phase concentration stay roughly the same as those of the WT (Fig. 1e). The two-phase regime widens due to a shifting of the left arm of the binodal to lower concentrations. This indicates that substituting Phe with Tyr residues enhances the driving forces for phase separation without causing discernible changes to the concentrations of dense phases. In the variant +7F−7Y, all Tyr residues were replaced with Phe. In contrast to the −12F+12Y variant, the width of the two-phase regime narrows for +7F−7Y, indicating that Phe stickers weaken the driving forces for phase separation of A1-LCD when compared to Tyr stickers (Fig. 1e, 1f).
Extracting thermodynamic parameters from the temperature dependence of saturation concentrations.
To test whether we could systematically alter the phase behavior of A1-LCD by modulating Tyr vs. Phe contents, we created variants that contain Tyr and Phe residues at different ratios (Fig. 2a). Additions or deletions of Tyr / Phe residues were achieved either by replacing Gly / Ser spacers with the residues of interest or substituting deleted residues with Gly / Ser residues while preserving the overall balance of Gly and Ser. We measured coexistence curves for variants designated as −9F+6Y, −8F+4Y, and −9F+3Y. We quantified the driving forces for phase separation in terms of saturation concentrations (csat) at individual temperatures (Fig. 2b) and the relative positions of the low concentration arms of binodals with respect to one another (Supplementary Fig. 2a). For a given construct and temperature, csat is the threshold concentration above which the system separates into coexisting dense and dilute phases.
Fig. 2: Aromatic residue type and content influences balance of entropic and enthalpic contributions to phase separation.

(a) Diagram of aromatic content type and placement in variants. (b) A1-LCD variant saturation concentrations measured at 4°C. Solution conditions were 20 mM HEPES, 150 mM NaCl, pH 7.0. (c) Results from van’t Hoff analysis of select A1-LCD aromatic variants. Each data point is an average saturation concentration taken from at least 3 measurements at the given temperature. (d) Inferred values of Δh° plotted against σYF for all A1-LCD aromatic variants used in this study. Solid lines are linear fits to the data. Estimates for Δh°(d) and –Δs°/R (e) extracted from the van’t Hoff analysis. Red dashed lines are the linear fits to the data. Here, R= 0.00199 kcal/mol*K.
Overall, our measurements indicate that Tyr is a stronger sticker than Phe. This was previously observed in the context of cation-π interactions 15 but is also valid for PLCDs where π-π interactions are the primary drivers for phase separation. We used a van’t Hoff analysis method 28 to extract apparent enthalpies (slopes) and entropies (intercepts) from plots of ln(csat) versus (RT)−1 (see details in the Methods). The inferred parameters quantify the changes in standard state molar enthalpies (Δh°) and molar entropies (Δs°) associated with the transfer of PLCD molecules from the dilute to the dense phase (Fig. 2c). Replacing all Phe residues with Tyr (−12F+12Y) resulted in larger negative (favorable) Δh° values compared to the A1-LCD. Conversely, replacing all Tyr residues with Phe (+7F-7Y) reduced the enthalpic driving forces for phase separation (Fig. 2d). Shifting the balance between Tyr and Phe resulted in intermediate Δh° and Δs° values with a linear dependence on the Tyr versus Phe contents (Fig. 2d, 2e). In this analysis, we use a parameter defined as where fY and fF are the fractions of Tyr and Phe, respectively. Note that σYF takes values of −1 for fY = 0, 0 for fF = fY, and +1 for fF = 0.
The entropy changes (Δs°) associated with the transfer of PLCD molecules from the dilute to dense phase are always unfavorable (Fig. 2e) in UCST phase behavior. The values of Δs° combine contributions from the gain / loss of solvent entropy, conformational entropy, the entropy of mixing, and the overall translational and rotational entropies. Overall, results from the van’t Hoff analysis highlight the interplay between enthalpy and entropy whereby variants defined by large, favorable changes in enthalpy are opposed by entropic penalties. This result suggests that stronger sticker-sticker interactions will restrict the degrees of freedom for molecules in the dense phase.
Comparative assessments of the role of charged residues on phase behavior.
Analysis of the overall compositional biases across A1-LCD homologs showed that the NCPR values are narrowly distributed around a mean value of +0.04 (Fig. 3a). Further, there is a clear preference for Arg over Lys, with their contents being narrowly distributed around mean values of 0.06 and 0.02, respectively (Fig. 3b). Similarly, the Asp and Glu contents are narrowly distributed around mean values of 0.03 and 0.01, suggesting a slight preference for Asp over Glu (Extended Data Fig. 1). These compositional analyses become relevant in light of previous findings that highlight the role of Arg as a sticker 15, the relative weakness of Lys as a sticker 15, 29, 30, 31, 32, and the contributions of charged residues as destabilizers of phase separation because they can act as solvation-promoting spacers19, 20 that repel one another if the NCPR is high 33. Based on the observed compositional biases and resulting hypotheses, we designed several variants to probe the roles of different types of charged residues on A1-LCD phase separation, keeping their patterning in the sequence uniform. Titrations of charge content and asymmetry do not cause significant changes to the intrinsic disordered nature of the A1-LCD (Supplementary Fig. 3).
Fig. 3: Role of charged residues in PLCD phase separation.

(a) Distribution of NCPR values and (b) distributions of fractions of Arg and Lys residues across A1-LCD homologs. Numerical values are mean values of the respective distribution ± the standard deviations. (c) Diagram of Arg/Lys content and placement across variants that test the role of Arg residues. Numbers next to each schematic indicate the number of Arg residues. Vertical bars in the schematics indicate the position of Arg residues (light blue). (d) Saturation concentrations of variants from (c) measured at 4°C. Solution conditions were 20 mM HEPES, 150 mM NaCl, pH 7.0. For binodals of variants see Supplementary Fig. 2. (e) Tyr and Phe sidechain planes of 13C-resolved 1Haromatic-1Haliphatic NOESY spectrum show NOEs between sidechain protons of Tyr/Phe and Hδ protons of Arg. Degenerate Arg Hδ proton resonances are shown as strips of (H)CC(CO)NH spectrum. A single (H)CC(CO)NH strip (corresponding to G63/N62) corresponds to the upfield carbon NOE resonance frequency. The other NOEs could not be unambiguously assigned. NMR spectra of A1-LCD Δhexa were recorded at 40°C to enable high enough concentrations without phase separation.
Three variants that removed (−10R, −6R) or added (+7R) Arg residues were used to assess whether Arg residues contribute as auxiliary stickers (Fig. 3c). The −10R construct showed a substantial reduction in the driving force for phase separation, with an increased csat at 4°C and a corresponding shift in the binodal (Fig. 3d, Supplementary Fig. 2b). This observation is in line with previous work that identified Arg residues as drivers of phase separation 15, 31. Surprisingly, the −6R variant shows a slight increase in the width of the two-phase regime compared to WT, whereas phase separation is significantly destabilized for +7R (Fig. 3d). Together, these data suggest that Arg residues contribute as auxiliary stickers within PLCDs, but these contributions are context-dependent resulting in non-trivial relationships between Arg content, context, and the driving forces for phase separation.
Sticker-sticker interactions are detectable as nuclear Overhauser enhancements (NOEs) in nuclear magnetic resonance (NMR) spectra even in the absence of phase separation 13. NOEs are the result of magnetization transfer between nuclei through space and imply that physical distances between the nuclei are, at least transiently, within 5 Å of one another. Based on the established equivalence between cohesive interactions within single chains and the driving forces for multi-chain phase behavior of A1-LCD variants 13, we assessed the presence of Arg-Phe / Tyr NOEs in NMR spectra in the dilute phase. At 40°C, with the system in a single homogenous phase, we used a concentration of 800 μM in the NMR sample, which was high enough to observe NOEs between aromatic sidechain protons of Phe / Tyr and arginine Hδ protons (Fig. 3e). This supports the expectation that Arg residues interact with Phe / Tyr acting as auxiliary stickers within PLCDs.
Next, we quantified the implications of the observed preference for Arg over Lys by titrating the Arg vs. Lys contents using A1-LCD variants designated as −3R+3K, −6R+6K, and −10R+10K (Fig. 4a). While Arg possesses a delocalized pi system around its guanidinium functional group, Lys contains a more chemically simple primary amine. As a result, despite Arg and Lys being positively charged, they are different, both in terms of the types of non-covalent bonds they form and in terms of their free energies of solvation 34, 35 36. Accordingly, we expect there to be differences in phase behavior across the variants 15, 30, 31, 32, 37, 38. As expected, substituting Arg with Lys weakens the driving forces for phase separation (Fig. 4b). Replacement of all Arg residues with Lys (−10R+10K) resulted in the abrogation of phase separation in the concentration range up to 2.3 mM. Taken together with results for the −10R variant, our data suggest that Lys residues in the A1-LCD context appear to destabilize phase separation by increasing ves of spacers and removing the contributions of Arg as auxiliary stickers.
Fig. 4: Role of charged residues in PLCD phase separation.

(a) Diagram of Arg / Lys content and placement across variants that test the role of Lys residues. (b) Saturation concentrations of variants from (a) measured at 4°C. (c) Diagram of Asp/Glu content and placement in variants that test the role of negatively charged residues. (d) Saturation concentrations of variants from (c) measured at 4°C. (e) Diagram of Arg, Lys, Asp, and Glu content and placement in variants that test the role of oppositely charged residues. (f) Saturation concentrations of variants from (e) measured at 4°C. (g) DIC images showing dense droplets for select variants from Fig. 3 and 4. Solution conditions were 20 mM HEPES, 150 mM NaCl, pH 7.0. For binodals of variants see Supplementary Fig. 2.
To assess the impact of acidic residues on phase separation, we added 8 or 12 Asp residues to generate variants +8D and +12D, or 12 Glu residues to generate +12E (Fig. 4c). Increasing the Asp or Glu contents beyond that of the WT sequence leads to substantial weakening of the driving forces for phase separation (Fig. 4d). Based on these results, we hypothesized that increasing the charge content, without compensatory electrostatic attractions, destabilizes phase separation through increased effective solvation volumes and electrostatic repulsions. Unlike the divergent effects of Arg and Lys, Asp and Glu affect phase behavior in a similar manner. Specifically, the +12D and +12E variants have similar phase behaviors, though the +12E variant has a slightly higher csat, which we attribute to the higher steric bulk of Glu over Asp. Interestingly, substitution of the four native Asp residues with Gly / Ser, as in variant −4D, also weakened the driving forces for phase separation (Fig. 4d). This points to a buffering role of the native Asp residues whereby they partially compensate for the excess positive charge in the system.
To test the hypothesis that electrostatic attractions offset the destabilizing effects of high ves, we characterized the phase behavior for variants +7R+12D and +7K+12D (Fig. 4e). Indeed, the destabilizing effects seen in +7R and +12D are offset and overcome in the +7R+12D variant, which is close to being electroneutral (Fig. 4f). This effect also prevails for the +7K+12D variant. NMR experiments for the +7K+12D variant (Extended Data Fig. 2, 3) support our assessment that Lys and Asp residues do not act as stickers. Instead, they modulate the driving forces for phase separation through a combination of high ves, electrostatic interactions, and weakening of attractive interactions among primary and auxiliary stickers. Finally, comparison of the phase behavior for +7R+12D and +7K+12D shows that a combination of near electroneutrality and the presence of context dependent auxiliary sticker effects of Arg contribute to the enhanced driving forces for phase separation in +7R+12D when compared to the A1-LCD (Fig. 4f). In summary, all variants (except −10R+10K) were able to undergo phase separation (Fig. 4g). However, the sequence variations in this set of A1-LCD variants modulated the saturation concentration by more than three orders of magnitude (Fig. 3d, 4b, 4d and 4f). Accordingly, we sought a framework to understand the molecular underpinnings of these sequence-dependent changes to the driving forces for phase separation.
Application of a mean-field model explains the data for charge variants.
Based on the preceding analysis we hypothesized that electroneutrality might be important for enhancing the driving forces for phase separation (Fig. 5a). According to this hypothesis, the WT sequence with a net charge of +8 should have an unfavorable balance of charged residues. We assessed the impact of net charge by plotting the measured log10(csat) values against the NCPR for a series of variants with identical numbers and linear patterning of Tyr / Phe stickers but changes to charged residues (Fig. 5b). We performed this analysis using data collected at 4°C. The plot of log10(csat) versus NCPR at 4°C has a putative V-shaped profile (Fig. 5a, 5b) indicating the possibility that csat is at its lowest value for electroneutral systems (NCPR ≈ 0). However, differences between Arg and Lys variants lead to significant deviations from the putative V-shaped profile (Fig. 5b). Specifically, for equivalent NCPR values, we find that increasing the number of Arg residues lowers csat below the apparent V-shape whereas decreasing the number of Arg residues increases csat. In contrast, increasing the number of Lys residues increases csat (+7K+12D, −3R+3K, and −6R+6K) to extents that cannot be explained by deviations from electroneutrality.
Fig. 5: NCPR modulates A1-LCD phase separation.

(a) Diagram illustrating the expected effect of net charge on driving force for phase separation. (b) csat values from data measured at 4 °C, plotted against NCPR for a subset of the sequence variants. Each data point is an average saturation concentration taken from at least 3 measurements at the given temperature. (c) Results of rescaling csat to account for the effects of Arg stickers. (d) Results of rescaling that accounts for the destabilizing effects of Lys in addition to accounting for the effects of Arg stickers. (e) Results of rescaling data using the approaches that lead to panels (b) and (c) combined with an accounting for the temperature-dependent variations to csat. The result is a master curve onto which all csat data for all measured temperatures collapse. The legends show the Pearson r-values that quantify the negative and positive linear correlations of the left and right arms, respectively. Variants not used for parameterization of the mean-field model were generated and their data shown as diamonds. (f) Histogram of calculated csat values for 770 PLCDs from the set of 848 sequences derived from hnRNPA1 homologs. These csat values were calculated using the mean-field model that yields csc,3 in (e).
We reasoned that Arg residues are context-dependent auxiliary stickers, whereas Lys residues weaken attractive interactions 15, 39. To test this hypothesis, we used a generalized mean-field stickers-and-spacers model 39 that considers the types, valence, and strengths of stickers. Using this model, we rescaled the csat values at 4°C using where na and nR are the numbers of Tyr / Phe and Arg residues, respectively. We used this mean-field model in a regression analysis where we fix λaa = 1 and obtained λaR. The resultant value of λaR = +1.69 reflects the positive cooperativity 39 of Arg and its role as an enhancer of the driving forces for phase separation. The choice of λaa = 1 was made because the Tyr / Phe ratio and positioning of these residues do not change in the variants studied here.
To account for outliers in the plot of csc,1 against NCPR (Fig. 5c), we modeled the destabilizing effects of Lys using a further rescaling . Here, nK is the number of Lys residues in the sequence. Regression analysis, performed by setting λaa = 1 and λaR = +1.69, yields λK = −0.0479. Here, the minus sign points to unfavorable contributions of Lys due to negative cooperativity 39. With this rescaling, all data points at 4°C collapse onto two arms of a single V-shaped plot (Fig. 5d). Finally, we accounted for the changes to csat with temperature using . This yields a master curve for csc,3 versus NCPR (Fig. 5e) where we set T0 = 277 K and directly obtained the value of m to be 8.26 K from the dilute arms of the binodals of the relevant variants (see SI for a detailed description of the mean-field stickers-and-spacers model).
To test predictions made by the master curve, we generated six additional variants (marked as diamonds in Fig. 5e) whose NCPR values fill in gaps along the V-shaped master curve. Binodals for these new variants are shown in Supplementary Fig. 4. Importantly, without any further reparameterization, we find that the measured csat values for the new variants are readily rescaled to coincide with predictions from the V-shaped master curve (Fig. 5e). The V-shape results from the destabilizing effects of increased net charge. However, we find that the minimum in the V-shaped profile is located at a small positive value of NCPR as opposed to zero. To test for the possibility that the theoretical and actual NCPR values might be different due to shifted pKa values of ionizable residues, we measured the pH dependence of phase separation for the +7K+12D variant. All data points collapse onto the V-shaped master plot when we rescale the measured csat values by estimating the expected numbers of protonated Lys residues as the entities that weaken sticker-sticker interactions (Extended Data Fig. 5). These observations suggest that the minimum of the V-shaped plot coincides with truly positive NCPR values.
Overall, our analysis, captured in the master curve for csc,3, highlights the role of mean-field electrostatic interactions in modulating the driving force for phase separation for fixed valence and patterning of Tyr / Phe residues. The model, specifically the expression for csc,3 and the values obtained for the λ coefficients, allow us to predict values for csat at 4°C for PLCD sequences derived from homologs of hnRNPA1 (Fig. 5f; see details in Methods). We restricted the analysis to PLCDs that were 100–200 residues long to ensure that changes to chain length do not confound the application of our mean-field model. Our model predicts values for csat that span up to three orders of magnitude, demonstrating how subtle changes to amino acid compositions are likely to impact the driving forces for PLCD phase separation.
Assessing the correlation between single-chain dimensions and csat.
Previous work on A1-LCD showed that increasing the number of aromatic residues while maintaining the uniform linear distribution of these stickers leads to increased chain contraction in the dilute phase and lowering of csat 13. The converse is true when the number of aromatic stickers is reduced 13. We asked if the correlation between single-chain dimensions and csat is preserved across the range of variants studied here.
We collected size exclusion chromatography-coupled small-angle X-ray scattering data for dilute solutions of most of the variants (Fig. 6a, Extended Data Fig. 5, Supplementary Fig. 5). We extracted apparent scaling exponents νapp (Supplementary Table 2) from the scattering data using an empirical molecular form factor 40. We obtain a strong positive correlation between log10(csat) and νapp for the aromatic variants (Fig. 6b) with a Pearson r-value of 0.96. However, this correlation is abolished for the variants that alter net charge or the overall charge content (Fig. 6c). Instead, the data show that csat can be lowered or increased by up to two orders of magnitude without altering νapp. Based on the results in Fig. 5e, which show that mean-field electrostatic effects can alter the driving forces for phase separation, we undertook the following analysis: First, we used linear regression to extract parameters from Fig. 6b that quantify the correlation between log10(csat) at 4°C and νapp for the aromatic variants. We used these parameters to assess the correlation between log10(csat) and νapp for the charge variants. Residuals from this linear regression analysis are shown in Fig. 6d. This analysis reveals a V-shaped profile when the residuals are plotted against the NCPR (Fig. 6e). The implication is that mean-field, intermolecular electrostatic interactions can enable a decoupling of the driving forces for single-chain contraction and the driving forces for phase separation. Specifically, increases to the NCPR can impact the collective interactions among PLCDs without having a significant impact on single-chain dimensions as quantified by νapp (Fig. 6f).
Fig. 6: Mean-field electrostatic effects can disrupt the strong coupling between driving forces for single-chain contraction and phase separation.

(a) Normalized Kratky plot of SEC-SAXS data for aromatic variants of A1-LCD. Solid lines are fits to an empirical molecular form factor (MFF). Dashed lines show the predicted behavior at larger q values, where the experimental data are noisy. (b) Correlation between log10(csat) and inferred values of νapp for the aromatic variants. Red dashed line is the linear fit to the data. (c) Correlation between log10(csat) and inferred νapp values for the charge variants. The dashed line is the linear fit of the aromatic variants from (b). (d) Residuals from the correlation in (b) for all variants. Data for charge variants are shown using unmodified and shifted csat values as in (c) and (e), respectively. Red dashed lines indicate the bounds of the aromatic residuals. (e) Residuals from the correlation in (b) versus NCPR for the charge variants. Red dashed lines show two linear fits, i.e., for the variants whose NCPR is less than or equal to that of the +7K+12D variant and greater than or equal to that of the +7K+12D variant on the left and right, respectively. (f) Residuals from the linear correlation of log10(csat, shift) vs. νapp for charge variants. Here, csat, shift refers to the csat values that are shifted based on the linear fits in (e). Red dashed lines indicate the bounds of the aromatic residuals. (g) Schematic showing strong coupling of single-chain dimensions and driving force for phase separation across variants titrating sticker strength and valence, but the potential for decoupling for variants with small changes to NCPR. Error bars associated with νapp values in (b) and (c) represent uncertainty from fitting SAXS data to MFFs. Saturation concentrations were measured independently at least 3 times for each variant.
We accounted for the effects of mean-field electrostatic repulsions by rescaling the measured csat values according to the NCPR of each variant and parameters obtained from the pair of linear fits in Fig. 6e. Specifically, we shifted csat using log10(csat,shift) = log10(csat) – (aQ + b). Here, Q is the NCPR of the variant of interest, and a and b are fitting parameters. If the NCPR is less than +0.0214, the parameters are a = −19.7 and b = −0.0273, whereas when the NCPR is greater than +0.0214, a = 21.1 and b = −0.989. The NCPR-based rescaling of csat values leads to a recovery of the one-to-one correspondence between νapp and csat (Fig. 6e, 6g). These results imply that the interactions that disrupt strong coupling must have the duality of being weak enough to have negligible influence on single-chain dimensions 41, 42, and yet be collectively strong enough to impact multichain interactions and hence the driving forces for phase separation. Our quantitative understanding of the origins of the decoupling and our ability to account for it in terms of the NCPR values will allow us to continue using parameters derived from analysis of single-chain dimensions 23, 24, with suitable NCPR-based corrections, to infer interaction potentials for sequence- or architecture-specific simulations of phase behavior 13, 16.
Spacers contribute to phase behavior through their effective solvation volumes.
In the stickers-and-spacers formalism, spacers contribute to the driving forces for phase separation through their impact on the ves of polymers 18. For a given sequence, the value of ves will be influenced by a combination of the steric bulk and the intrinsic free energy of solvation of spacer residues 17, 19. While increasing the charge content provides a direct route to increasing ves through increased favorability of solvation 19, 20, changing Gly to Ser, Asn to Gln or Ser to Thr should increase ves through increased steric bulk 43. Conversely, changing Ser / Asn / Gln to Gly should decrease ves. If the polar residues Gly, Ser, Thr, Asn, and Gln contribute mainly as spacers, then substitutions that increase ves should have a destabilizing effect on phase separation, whereas substitutions that decrease ves should stabilize phase separation. Gly and Ser residues are by far the most abundant residue types in the A1-LCD, its homologs, and PLCDs in general. Interestingly, the broad distribution of σYF values for A1-LCD homologs reflects covariations between Tyr / Phe and Gly / Ser contents. Indeed, analysis of PLCDs derived from 770 of the 848 homologs (see details in the SI) of hnRNPA1 shows interesting covariation patterns (Fig. 7a–c). Specifically, we observe positive correlations between the fractions of Gly and Tyr as well as the fractions of Ser and Phe, respectively (Fig. 7a, 7b). We also observe a negative correlation between the fractions of Gly and Ser (Fig. 7c) and these derive from the negative correlations between the fractions of Tyr and Ser as well as Phe and Gly, respectively (Extended Data Fig. 6).
Fig. 7: Gly and Ser are spacers with different effective solvation volume.

(a-c) 2D histograms quantifying covariations in fractions of Tyr versus Gly (a), Phe versus Ser (b), and Ser versus Gly (c) residues across A1-LCD homologs. (d) A1-LCD variant saturation concentrations measured at 20°C. Gly vs. Ser content is titrated in the WT A1-LCD (left), in the background of the variant in which all aromatic residues are Tyr (middle), or in the background of the variant in which all aromatic residues are Phe (right). (e) Cartoon highlighting the hierarchy of physicochemical effects underlying the driving force of phase separation encoded in the evolutionarily conserved composition of PLCDs. Cohesive interactions between disordered chains made up of sticker and spacer residues (beads of grey shades) result in condensates (green droplets). Tyr-Tyr, Tyr-Phe and Phe-Phe interactions have, in order, decreasing pairwise interaction strengths. Arg residues act as auxiliary stickers with aromatic residues if the NCPR is favorable. Lys residues weaken sticker-sticker interactions via 3-body effects. Glycine, serine and charged residues are spacer residues that modulate the driving forces for phase separation through their effects on the ves of spacers. The higher the ves, the weaker is the driving force for phase separation. The NCPR of PLCDs affects phase separation via mean-field electrostatic effects, modulating the saturation concentration by up to three orders of magnitude. NCPR values close to electroneutrality favor phase separation whereas unbalanced charges increase solubility and weaken phase separation.
To make sense of trends observed in the compositional and covariation analyses, we generated A1-LCD variants in which we assessed whether Gly and Ser are equivalent spacers by replacing all Ser residues with Gly (+23G−23S) or replacing increasing numbers of Gly with Ser residues (−10G+10S, −20G+20S, −30G+30S) (Supplementary Fig. 6). We attempted to purify a variant in which all Gly residues were replaced with Ser, but this variant was not stable. We also performed Gly vs. Ser titrations in the background of −12F+12Y, which replaces all Phe with Tyr, and in the background of +7F−7Y, which replaces all Tyr with Phe, to address potential effects of Tyr / Gly and Phe / Ser covariation.
Increasing the Ser content beyond that of the WT sequence (−10G+10S, −20G+20S, −30G+30S) weakens the driving forces for phase separation (Fig. 7d, Supplementary Fig. 6). This is consistent with the prediction 16, 17, 19, 20 that increasing ves through changes to spacer residues weakens the driving forces for phase separation. Conversely, replacing all Ser residues with Gly (+23G−23S) enhances the driving forces for phase separation. This observation is consistent with the expectation that Ser to Gly substitutions lower the ves of A1-LCD, thereby enhancing the driving forces for phase separation. Our titrations suggest that Gly and Ser residues therefore act as true spacers, and their different effects on phase behavior are consistent with changes that modulate ves. Interestingly, replacement of Ser residues with Gly in the context of a variant in which all aromatic residues were Tyr (+23G−23S−12F+12Y) strengthened phase separation strongly while the effect was smaller in the context of the variant in which all aromatic residues were Phe (+23G−23S+7F−7Y; Fig. 7d). Further, the effects from replacement of Gly with Ser residues in these contexts tended to be saturable, in that replacing additional Gly with Ser residues did not have further effects on phase behavior.
We also investigated the effects of other polar residues specifically Asn, Gln, and Thr (Extended Data Fig. 7). This was achieved using the following variants: −14N-4Q+18G where we replaced all 14 Asn and 4 Gln residues with Gly, −14N+14Q where we replaced all 14 Asn residues with Gln, and −23S+23T where we replaced all 23 Ser residues with Thr (Extended Data Fig. 7). The expectation was that ves should decrease for −14N-4Q+18G vis-à-vis A1-LCD, whereas ves should increase for the variants −14N+14Q and −23S+23T, respectively. Accordingly, when compared to WT A1-LCD, phase separation should be destabilized for variants −14N+14Q and −23S+23T and stabilized for variant −14N-4Q+18G. These expectations were borne out in measurements of the temperature dependence of the binodals and csat (Extended Data Fig. 7). Notice that replacing Asn / Gln with Gly leads to higher critical temperatures, and this is one of the hallmarks of reducing ves 19 (Extended Data Fig. 7). We conclude that Gly, Ser, Asn, Gln and Thr residues contribute as bona fide spacers and differences in their effects on phase separation can be attributed to differences they engender for ves of A1-LCDs.
Discussion
Intrinsically disordered PLCDs are prominent drivers of biomolecular condensates 10, 44, 45. Given their abundance in RNA-binding proteins 46, there is considerable interest in understanding the roles of PLCDs in protein function and assembly 47. Here, we used a combination of experiments and novel analyses to uncover a set of readily deployable rules that underlie the driving forces for phase separation of PLCDs.
We find that Tyr and Phe are energetically non-equivalent stickers, with Tyr-Tyr interactions being measurably stronger than Tyr-Phe and Phe-Phe interactions. The measured saturation concentrations of A1-LCD variants increase as the magnitude of the NCPR increases. Analysis of compositional biases across homologs of A1-LCDs also reveals a clear preference for Arg over Lys. Through systematic titrations, we find that Arg plays the role of a context-dependent auxiliary sticker whereas Lys has a destabilizing effect on A1-LCD phase separation. Further, we find that negatively charged residues destabilize phase separation due to their large and positive effective solvation volumes.
We developed and deployed a mean-field model to generate a master curve that explains how the combination of the numbers of Tyr / Phe stickers, the numbers of Arg / Lys residues, the NCPR, and the solution temperature contribute to the driving forces for phase separation of PLCDs (Fig. 5e,f). Interestingly, the optimum NCPR that maximizes the driving forces for phase separation of A1-LCD and designed variants thereof is ≈+0.02. The preference for excess positive charge combined with the preference for Arg over Lys, points to the importance of networks of Arg-π interactions 48. It could also be a reflection of the preferential condensation of solution anions around cationic residues 49. The mean-field model cannot be used for assessing differences such as the changes from Tyr to Phe or vice versa while keeping the rest of the sequence fixed. This is because the sticker-sticker interactions are treated in an averaged sense. However, the rules inferred here can be captured and deployed in a model for LASSI 16 or PIMMS 13 based simulations of PLCDs. These simulations reproduce the entire spectrum of measured phase behaviors for A1-LCD variants and the results are to be presented elsewhere 50.
We also investigated the effects of changes to proposed spacer residues on the driving forces for phase separation. If the identities, valence, and patterning of stickers remain unchanged, then changes to spacer residues will impact phase separation by altering ves through their contributions to steric bulk and intrinsic free energies of solvation. Increased charge contents titrate the effect of increasing ves by making the free energy of solvation more favorable. Increasing the steric bulk of spacers destabilizes phase separation whereas decreasing the steric bulk results in stabilization. Changes to stickers have stronger effects than changes to spacers as previously reported 51, but given the high spacer content of PLCDs, changing their identity and thus ves can have considerable effects. Interestingly, the effects of increasing Ser over Gly contents are saturable in variants with only one type of aromatic residue. This indicates that a heterogeneous composition of Tyr / Phe stickers is important for achieving tunability of phase behavior through changes to ves achieved by making changes to spacers 19.
Our bioinformatics analysis reveals positive correlations between Tyr and Gly as well as Phe and Ser content (Fig. 7a, 7b). We also observe concomitant negative correlations between Tyr and Phe (Fig. 1b), Gly and Ser (Fig. 7c), Tyr and Ser, and Phe and Gly (Extended Data Fig. 6), respectively. Taken together with the rules that emerge from our measurements of the driving forces for phase separation of PLCDs, we surmise that the driving forces for phase separation may be evolutionarily modulated through compositional covariations. One possible explanation for why these covariations exist comes from the observation that a particularly high Gly content seems to mimic polyglycine-like behavior 52, 53 within certain A1-LCD backgrounds. Specifically, increasing the Gly-to-Ser ratio in a construct where all the Tyr residues were replaced with Phe unexpectedly caused an increase in csat at lower temperatures and a steeper dilute arm of the binodal. In comparison, similar substitutions in the WT construct or in a construct where all Phe were replaced with Tyr resulted in decreased csat at all temperatures and relatively unchanged slopes. We hypothesize that the decreased sticker-strength of the Phe-dominated construct allows the relatively long Gly tracts to function as competing stickers that can generate dynamically arrested phases 54, a feature that derives from the tendency of uninterrupted polyglycine molecules to self-associate with one another 52, 53. This effect appears to be avoided in naturally occurring sequences by replacing Gly with Ser in sequences that are rich in Phe.
Previous observations regarding the correlation between single-chain dimensions in dilute phases and measured saturation concentrations, which we have referred to as strong coupling, have proven to be an important tool for computing and analyzing phase diagrams from single-chain simulations of coil-to-globule transitions 22, 23, 24, 55, 56, 57, 58. This is because the assumption of strong coupling enables one to infer properties of the dense phase from simpler measurements of chain dimensions in the dilute phase. Here, we show that the driving forces for single-chain contraction and multi-chain phase separation can be decoupled if the magnitude of the NCPR increase is just enough to impact multi-chain interactions and not the dimensions of single chains (Fig. 6f).
Natural PLCDs are finite-sized heteropolymers with hidden complexities. These systems are distinct from effective homopolymeric systems such as resilin-like polypeptides that have been used to query the impact of specific types of stickers using host-guest systems 59. Recent work 59 used linear regression models to assess how the transition temperature at a fixed protein concentration changes in response to different amino acid substitutions. The insights, which parallel some of our findings, are useful for guiding engineering efforts of artificial, homopolymer IDPs with desired properties.
Are the rules extracted from our studies of A1-LCD variants transferable to PLCDs from other RNA-binding proteins, of the FET family (where FET stands for FUS, EWS and TAF15)? We begin to answer this question by generating a curated database of ~3,000 PLCDs from homologs of FUS / FET family proteins 60, 61. The pairwise compositional similarities between these sequences and A1-LCD were on par with those observed for A1-LCD homologs. This suggests that the compositional biases uncovered for PLCDs across homologs of hnRNPA1 are preserved across PLCDs from homologs of FUS family proteins (Extended Data Fig. 8). Intriguingly, unlike the PLCDs from homologs of hnRNPA1, the PLCDs from homologs of FUS / FET family proteins show a stronger bias toward Tyr over Phe (Extended Data Fig. 8). This suggests that the driving forces for condensate formation might be evolutionarily tuned by titrating σYF in PLCDs from homologs of hnRNPA1, whereas the tuning in PLCDs across homologs of other FET family proteins is achieved by titrating the Tyr content. The tuning of sticker valence is also achievable through alternative splicing whereby splice variants feature different numbers of Gly-Tyr motifs 62. It is likely that the material properties of condensates such as stress granules that feature a diversity of PLCDs might be influenced by networks of heterotypic interactions where the PLCD-specific variations in σYF and Tyr content might enable the tuning of relative strengths of sticker-sticker interactions.
Methods
Details regarding the amino acid sequences of each designed variant, protein expression and purification, sample preparations for and collection of NMR, SAXS, and microscopy data are described in the Supplementary Information. Details of the bioinformatics analyses and mean-field stickers-and-spacers model are also provided in the Supplementary Information.
Measurements to construct binodals:
Phase separation was induced by adding NaCl to a final concentration of 150 mM. Dilute and dense phase concentrations were determined as a function of temperature using a centrifugation method 13, 26. Briefly, phase separation of the sample was induced, and the dilute and dense phase were separated via centrifugation. Protein concentrations were determined by suitable dilutions of the samples and measurements of their absorbance at 280 nm. Points on the binodal above 30°C were determined via cloud point measurements using static light scattering as previously described 13, 27. Briefly, phase separation of the sample was induced, and the dilute and dense phase were separated via centrifugation. Most of the dilute phase was removed and the remaining sample was heated above the critical point to enter the one-phase regime. 2 μL were removed with a positive displacement pipette and diluted to determine the protein concentration. 18 μL of the sample was transferred to a temperature equilibrated quartz DLS cuvette and the static light scattering was monitored as a function of temperature (temperature ramp 0.4°C/min) using a Wyatt NanoStar DLS instrument. The temperature at which the light scattering signal increases marks the transition of the one-phase regime into the two-phase regime. Cloud points at relatively lower temperatures/concentrations showed good agreement with coexistence points determined by centrifugation.
van’t Hoff analysis:
The chemical potentials of the dilute and dense phases can be written as μdilute=μ°dilute + RTln(cdilute/cref) and μdense=μ°dense + RTln(cdense/cref), respectively. Here, μ°dilute and μ°dense are the standard state chemical potentials of the PLCD molecules in the dilute and dense phases, respectively. Our measurements reveal that the concentrations of PLCD molecules in the dense phase show a weak dependence on temperature and on the sequence / compositions of the different variants. Accordingly, we set the reference concentration to be 0.03 M, which is also the approximate value of cdense irrespective of temperature or the variant. This assumption is valid away from the critical point. At equilibrium, μdilute= μdense. Rearranging the equations for chemical potentials using the assumptions summarized thus far, we obtain the expression Δμ° = RTln(cdilute/cref), where Δμ° = μ°dense – μ°dilute. The difference in standard state chemical potentials Δμ° quantifies the change in standard state free energies associated with transferring PLCD molecules from the dilute to dense phase. Assuming temperature independent values for standard state enthalpies (Δh°) and entropies (Δs°), we obtain the van’t Hoff equation 63 according to which:
| (1) |
Here, R = 0.001987 kcal/mol*K is the ideal gas constant. According to Equation (1), the slope of a plot of ln(csat/cref) versus (RT)−1, providing it is linear, will yield an estimate of the change in standard state enthalpy (Δh°) and the intercept quantifies the standard state entropy (Δs°) associated with transferring PLCD molecules across the phase boundary between coexisting dilute and dense phases. Supplementary Fig. 7 shows the linear fits and associated parameters for all variants.
Data and Code availability
NMR assignments of A1-LCD +7K+12D are available from the BMRB at accession code ID 50739. All expression plasmids are available from T.M. under a material transfer agreement with St. Jude Children’s Hospital. Code needed to reproduce the results, SAXS data, CD data, experimental binodals, pH-dependent measurements, sequences used in the bioinformatics analysis, and estimated saturation concentrations of PLCD homologs are available at https://github.com/Pappulab/ PLCD-Data-Repository-and-Analysis-Routines.
Extended Data
Extended Data Figure 1: Compositional analysis of PLCDs from homologs of hnRNPA1.

(a) 2D histogram quantifying the joint distribution of lengths of PLCDs derived from homologs of hnRNPA1 and the compositional similarities, in terms of cosine values, to A1-LCD. (b) Distribution of fractions of aromatic residues (Tyr, Phe, and Trp). (c) Distributions of fractions of Glu and Asp residues. Numerical values are mean values of the respective distribution ± the standard deviations.
Extended Data Figure 2: 1H,15N HSQC spectrum of the A1-LCD variant +7K+12D.

The plot on the right is an expansion of a crowded area of the spectrum (indicated by a box on the left). Spectra were collected in homogenous samples in the absence of phase separation. The lack of chemical shift dispersion indicates that the protein remains primarily disordered. Despite the significant overlap, 80% of the amide chemical shifts were assigned to their respective amino acid residues (i.e., 110 of the 135 non-proline residues).
Extended Data Figure 3: Aromatic residues are the main stickers in A1-LCD variant +7K+12D.

Panel on the left shows an overlay of 1H,15N HSQC spectra of WT A1-LCD Δhexa variant (missing residues 259–264, red) as reported in (Martin et al. 13) and of A1-LCD variant +7K+12D (blue). The amino acid substitutions result in large-scale changes in resonance frequencies across the spectrum compared to the A1-LCD Δhexa. This may be expected due to the high number of charged amino acid substitutions and their widespread distribution. The panel on the right shows 15N R2 relaxation profiles for WT A1-LCD Δhexa (top) and the +7K+12D variant (bottom). The R2 relaxation rates are sensitive to differences in local dynamics due to intramolecular interactions. The solid black profile represents a pure Gaussian fit, whereas the black dashed fit represents multiple regions of enhanced relaxation centered at aromatic residues (yellow) with the blue line representing the underlying Gaussian profile from this fit with a persistence length of 7.8 amino acid residues. R2 rates for +7K+12D show clusters of enhanced rates in similar sequence positions as the WT, with an additional cluster found in the hexapeptide region that is deleted in the WT and where two aromatic residues are located. This is consistent with the aromatic residues remaining stickers. These data support our prediction that Lys and Asp residues do not act as stickers. Instead, they modulate the driving forces for phase separation through a combination of increased effective solvation volume, electrostatic repulsions, and weakening attractive interactions among primary and auxiliary stickers.
Extended Data Figure 4: Measured pH-dependence of csat validates the prediction that the minimum value for csat is realized at positive values of NCPR.

(a) Saturation concentration of A1-LCD +7K+12D was measured at 4°C as a function of pH. Individual data points are shown as black crosses, the mean as green symbols, vertical lines represent the standard deviation. (b) Table summarizing the theoretical net charge of A1-LCD +7K+12D and the number of Lys residues that are calculated to be protonated at each pH. (c) Measured csat values for +7K+12D were rescaled using the equation for csc,2. Here, we compare the csc,2 values when we account for all nine Lys residues (red diamonds) or only the number of protonated Lys residues (green diamonds). The latter conform to the master curve, whereas the former deviate significantly from the master curve.
Extended Data Figure 5: Kratky plot of the raw SEC-SAXS of A1-LCD variants.

Data are shown for variants testing the roles of (a) negatively charged residues, (b) positively charged residues, (c) arginines, and (d) oppositely charged residues. Data were logarithmically smoothed into 40 bins. Solid lines are fits to system-specific empirical molecular form factors (MFF).
Extended Data Figure 6: Compositional analysis of aromatic stickers and Gly/Ser spacers.

(a) 2D histogram quantifying the joint distribution of the fractions of Tyr and Ser across PLCDs from 770 homologs of hnRNPA1. (b) 2D histogram quantifying the joint distribution of the fractions of Phe and Ser across PLCDs from 770 homologs of hnRNPA1. The solution conditions for all experiments were 20 mM HEPES, 150 mM NaCl, pH 7.0.
Extended Data Figure 7: Examining the effects of other spacer residues on A1-LCD phase behavior.

(a) Diagram of variants to understand the contributions of Asn, Gln and Thr to effective solvation volumes of A1-LCD. In variant −14N-4Q+18G, the role of Asn and Gln residues in comparison to Gly spacers is assessed. In variants −14N+14Q and −23S+23T, residues with similar intrinsic free energies of solvation but different steric bulk are substituted. Vertical bars in the schematics indicate the position of residue types, namely Asn (red), Gln (yellow), Gly (green), Ser (black) and Thr (purple). (b) Measured binodals of A1-LCD variants from (a) as a function of temperature. (c) A focused view on the dilute arms (saturation concentrations) of the binodals in (b). The solution conditions for all experiments were 20 mM HEPES, 150 mM NaCl, pH 7.0.
Extended Data Figure 8: Compositional biases in PLCDs drawn from homologs of the FUS / FET family of proteins.

(a) 2D histogram quantifying the distributions of lengths of PLCDs from FUS / FET family homologs and their compositional similarities to WT A1-LCD. (b) Histogram of the distribution of NCPR values; (c) Histogram of fraction of aromatic residues (Tyr, Phe, and Trp); (d) distribution of Tyr versus Phe asymmetries for LCDs from FUS / FET family homologs; numerical values are mean values of the respective distribution ± the standard deviation. (e) 2D histogram quantifying covariations in fractions of Tyr versus Phe residues across PLCDs.
Supplementary Material
Acknowledgments
We thank Youlin Xia for help with NMR experiments. We are grateful to Furqan Dar, Alex Holehouse, Matthew King, Kiersten Ruff, J. Paul Taylor, and Xiangze Zeng for helpful discussions. Microscopy images were acquired at the Cell & Tissue Imaging Center at SJCRH, which is supported by SJCRH and NCI (grant P30 CA021765). This work was supported by the US National Institutes of Health (grant 5R01NS056114 to R.V.P. and grant R01NS121114 to R.V.P. and T.M.), the Air Force Office of Scientific Research (grant FA9550-20-1-0241 to R.V.P.), the St. Jude Collaborative Research Consortium on Membraneless Organelles in Health and Disease (to T.M. and R.V.P.), and the American Lebanese Syrian Associated Charities (to T.M.). Use of the Advanced Photon Source was supported by the U.S. Department of Energy under contract DE-AC02-06CH11357. This project was supported by grant P30 GM138395 from the National Institute of General Medical Sciences of the National Institutes of Health. Use of the Pilatus3 1M detector was provided by grant 1S10OD018090 from NIGMS.
Footnotes
Competing Interests Statement
R.V.P is a member of the scientific advisory board of Dewpoint Therapeutics Inc and T.M. is a consultant of Faze Medicines, Inc. The work reported here has not been influenced by either of these affiliations. All other authors declare no competing interests.
Additional information
Supplementary Information is available with the online version of the paper. Correspondence and request for materials should be addressed to R.V.P. and T.M.
References
- 1.Brangwynne CP, Eckmann CR, Courson DS, Rybarska A, Hoege C, Gharakhani J, et al. Germline P granules are liquid droplets that localize by controlled dissolution/condensation. Science 2009, 324(5935): 1729–1732. [DOI] [PubMed] [Google Scholar]
- 2.Li P, Banjade S, Cheng H-C, Kim S, Chen B, Guo L, et al. Phase transitions in the assembly of multivalent signalling proteins. Nature 2012, 483(7389): 336–340. [DOI] [PMC free article] [PubMed] [Google Scholar]
- 3.Sabari BR, Dall’Agnese A, Boija A, Klein IA, Coffey EL, Shrinivas K, et al. Coactivator condensation at super-enhancers links phase separation and gene control. Science 2018, 361(6400): eaar3958. [DOI] [PMC free article] [PubMed] [Google Scholar]
- 4.Riggs CL, Kedersha N, Ivanov P, Anderson P. Mammalian stress granules and P bodies at a glance. Journal of Cell Science 2020, 133(16): jcs242487. [DOI] [PMC free article] [PubMed] [Google Scholar]
- 5.Yang P, Mathieu C, Kolaitis RM, Zhang P, Messing J, Yurtsever U, et al. G3BP1 Is a Tunable Switch that Triggers Phase Separation to Assemble Stress Granules. Cell 2020, 181(2): 325–345 e328. [DOI] [PMC free article] [PubMed] [Google Scholar]
- 6.Sanders DW, Kedersha N, Lee DSW, Strom AR, Drake V, Riback JA, et al. Competing Protein-RNA Interaction Networks Control Multiphase Intracellular Organization. Cell 2020, 181(2): 306–324.e328. [DOI] [PMC free article] [PubMed] [Google Scholar]
- 7.Guillen-Boixet J, Kopach A, Holehouse AS, Wittmann S, Jahnel M, Schlussler R, et al. RNA-Induced Conformational Switching and Clustering of G3BP Drive Stress Granule Assembly by Condensation. Cell 2020, 181(2): 346–361 e317. [DOI] [PMC free article] [PubMed] [Google Scholar]
- 8.Mitchell SF, Jain S, She M, Parker R. Global analysis of yeast mRNPs. Nature Structural & Molecular Biology 2013, 20(1): 127–133. [DOI] [PMC free article] [PubMed] [Google Scholar]
- 9.Cascarina SM, Elder MR, Ross ED. Atypical structural tendencies among low-complexity domains in the Protein Data Bank proteome. PLOS Computational Biology 2020, 16(1): e1007487. [DOI] [PMC free article] [PubMed] [Google Scholar]
- 10.Kim HJ, Kim NC, Wang Y-D, Scarborough EA, Moore J, Diaz Z, et al. Mutations in prion-like domains in hnRNPA2B1 and hnRNPA1 cause multisystem proteinopathy and ALS. Nature 2013, 495(7442): 467–473. [DOI] [PMC free article] [PubMed] [Google Scholar]
- 11.Mackenzie IR, Nicholson AM, Sarkar M, Messing J, Purice MD, Pottier C, et al. TIA1 Mutations in Amyotrophic Lateral Sclerosis and Frontotemporal Dementia Promote Phase Separation and Alter Stress Granule Dynamics. Neuron 2017, 95(4): 808–816 e809. [DOI] [PMC free article] [PubMed] [Google Scholar]
- 12.Molliex A, Temirov J, Lee J, Coughlin M, Kanagaraj AP, Kim HJ, et al. Phase separation by low complexity domains promotes stress granule assembly and drives pathological fibrillization. Cell 2015, 163(1): 123–133. [DOI] [PMC free article] [PubMed] [Google Scholar]
- 13.Martin EW, Holehouse AS, Peran I, Farag M, Incicco JJ, Bremer A, et al. Valence and patterning of aromatic residues determine the phase behavior of prion-like domains. Science 2020, 367(6478): 694–699. [DOI] [PMC free article] [PubMed] [Google Scholar]
- 14.Zheng W, Dignon GL, Jovic N, Xu X, Regy RM, Fawzi NL, et al. Molecular Details of Protein Condensates Probed by Microsecond Long Atomistic Simulations. The Journal of Physical Chemistry B 2020. [DOI] [PMC free article] [PubMed] [Google Scholar]
- 15.Wang J, Choi JM, Holehouse AS, Lee HO, Zhang X, Jahnel M, et al. A Molecular Grammar Governing the Driving Forces for Phase Separation of Prion-like RNA Binding Proteins. Cell 2018, 174(3): 688–699 e616. [DOI] [PMC free article] [PubMed] [Google Scholar]
- 16.Choi J-M, Dar F, Pappu RV. LASSI: A lattice model for simulating phase transitions of multivalent proteins. PLoS computational biology 2019, 15(10). [DOI] [PMC free article] [PubMed] [Google Scholar]
- 17.Choi J-M, Holehouse AS, Pappu RV. Physical Principles Underlying the Complex Biology of Intracellular Phase Transitions. Annual Review of Biophysics 2020, 49: 107–133. [DOI] [PMC free article] [PubMed] [Google Scholar]
- 18.Semenov AN, Rubinstein M. Thermoreversible Gelation in Solutions of Associative Polymers. 1. Statics. Macromolecules 1998, 31(4): 1373–1385. [Google Scholar]
- 19.Harmon TS, Holehouse AS, Rosen MK, Pappu RV. Intrinsically disordered linkers determine the interplay between phase separation and gelation in multivalent proteins. eLife 2017, 6: e30294. [DOI] [PMC free article] [PubMed] [Google Scholar]
- 20.Harmon TS, Holehouse AS, Pappu RV. Differential solvation of intrinsically disordered linkers drives the formation of spatially organized droplets in ternary systems of linear multivalent proteins. New Journal of Physics 2018, 20(4): 045002. [Google Scholar]
- 21.Lantman CW, MacKnighta WJ, Lundberg RD. Structural Properties of Ionomers. Annual Review of Materials Science 1989, 19(1): 295–317. [Google Scholar]
- 22.Dignon GL, Zheng W, Best RB, Kim YC, Mittal J. Relation between single-molecule properties and phase behavior of intrinsically disordered proteins. Proc Natl Acad Sci U S A 2018, 115(40): 9929–9934. [DOI] [PMC free article] [PubMed] [Google Scholar]
- 23.Zeng X, Holehouse AS, Chilkoti A, Mittag T, Pappu RV. Connecting Coil-to-Globule Transitions to Full Phase Diagrams for Intrinsically Disordered Proteins. Biophysical Journal 2020, 119(2): 402–418. [DOI] [PMC free article] [PubMed] [Google Scholar]
- 24.Zeng X, Liu C, Fossat MJ, Ren P, Chilkoti A, Pappu RV. Design of intrinsically disordered proteins that undergo phase transitions with lower critical solution temperatures. APL Materials 2021, 9(2): 021119. [DOI] [PMC free article] [PubMed] [Google Scholar]
- 25.Kumar S, Stecher G, Suleski M, Hedges SB. TimeTree: A Resource for Timelines, Timetrees, and Divergence Times. Molecular Biology and Evolution 2017, 34(7): 1812–1819. [DOI] [PubMed] [Google Scholar]
- 26.Milkovic NM, Mittag T. Determination of Protein Phase Diagrams by Centrifugation. Methods Mol Biol 2020, 2141: 685–702. [DOI] [PubMed] [Google Scholar]
- 27.Peran I, Martin EW, Mittag T. Walking Along a Protein Phase Diagram to Determine Coexistence Points by Static Light Scattering. Methods Mol Biol 2020, 2141: 715–730. [DOI] [PubMed] [Google Scholar]
- 28.Crick SL, Ruff KM, Garai K, Frieden C, Pappu RV. Unmasking the roles of N- and C-terminal flanking sequences from exon 1 of huntingtin as modulators of polyglutamine aggregation. Proceedings of the National Academy of Sciences 2013, 110(50): 20075. [DOI] [PMC free article] [PubMed] [Google Scholar]
- 29.Greig JA, Nguyen TA, Lee M, Holehouse AS, Posey AE, Pappu RV, et al. Arginine-Enriched Mixed-Charge Domains Provide Cohesion for Nuclear Speckle Condensation. Molecular Cell 2020, 77(6): 1237–1250.e1234. [DOI] [PMC free article] [PubMed] [Google Scholar]
- 30.Fisher RS, Elbaum-Garfinkle S. Tunable multiphase dynamics of arginine and lysine liquid condensates. Nature Communications 2020, 11(1): 4628. [DOI] [PMC free article] [PubMed] [Google Scholar]
- 31.Nott Timothy J, Petsalaki E, Farber P, Jervis D, Fussner E, Plochowietz A, et al. Phase Transition of a Disordered Nuage Protein Generates Environmentally Responsive Membraneless Organelles. Molecular Cell 2015, 57(5): 936–947. [DOI] [PMC free article] [PubMed] [Google Scholar]
- 32.Brady JP, Farber PJ, Sekhar A, Lin Y-H, Huang R, Bah A, et al. Structural and hydrodynamic properties of an intrinsically disordered region of a germ cell-specific protein on phase separation. Proceedings of the National Academy of Sciences 2017, 114(39): E8194. [DOI] [PMC free article] [PubMed] [Google Scholar]
- 33.Crabtree MD, Holland J, Kompella P, Babl L, Turner N, Baldwin AJ, et al. Repulsive electrostatic interactions modulate dense and dilute phase properties of biomolecular condensates. bioRxiv 2020: 2020.2010.2029.357863. [Google Scholar]
- 34.Martin EW, Holehouse AS. Intrinsically disordered protein regions and phase separation: sequence determinants of assembly or lack thereof. Emerging Topics in Life Sciences 2020, 4(3): 307–329. [DOI] [PubMed] [Google Scholar]
- 35.Dignon GL, Best RB, Mittal J. Biomolecular Phase Separation: From Molecular Driving Forces to Macroscopic Properties. Annu Rev Phys Chem 2020, 71: 53–75. [DOI] [PMC free article] [PubMed] [Google Scholar]
- 36.Fossat MJ, Zeng X, Pappu RV. Uncovering Differences in Hydration Free Energies and Structures for Model Compound Mimics of Charged Side Chains of Amino Acids. The Journal of Physical Chemistry B 2021, 125(16): 4148–4161. [DOI] [PMC free article] [PubMed] [Google Scholar]
- 37.Boeynaems S, Holehouse AS, Weinhardt V, Kovacs D, Van Lindt J, Larabell C, et al. Spontaneous driving forces give rise to protein−RNA condensates with coexisting phases and complex material properties. Proceedings of the National Academy of Sciences 2019, 116(16): 7889. [DOI] [PMC free article] [PubMed] [Google Scholar]
- 38.Schuster BS, Dignon GL, Tang WS, Kelley FM, Ranganath AK, Jahnke CN, et al. Identifying sequence perturbations to an intrinsically disordered protein that determine its phase-separation behavior. Proceedings of the National Academy of Sciences 2020, 117(21): 11421. [DOI] [PMC free article] [PubMed] [Google Scholar]
- 39.Choi J-M, Hyman AA, Pappu RV. Generalized models for bond percolation transitions of associative polymers. Physical Review E 2020, 102: 042403. [DOI] [PMC free article] [PubMed] [Google Scholar]
- 40.Riback JA, Bowman MA, Zmyslowski AM, Knoverek CR, Jumper JM, Hinshaw JR, et al. Innovative scattering analysis shows that hydrophobic disordered proteins are expanded in water. Science 2017, 358(6360): 238–241. [DOI] [PMC free article] [PubMed] [Google Scholar]
- 41.Mao AH, Crick SL, Vitalis A, Chicoine CL, Pappu RV. Net charge per residue modulates conformational ensembles of intrinsically disordered proteins. Proceedings of the National Academy of Sciences 2010, 107(18): 8183. [DOI] [PMC free article] [PubMed] [Google Scholar]
- 42.Müller-Späth S, Soranno A, Hirschfeld V, Hofmann H, Rüegger S, Reymond L, et al. Charge interactions can dominate the dimensions of intrinsically disordered proteins. Proceedings of the National Academy of Sciences 2010, 107(33): 14609. [DOI] [PMC free article] [PubMed] [Google Scholar]
- 43.Choi J-M, Pappu RV. Improvements to the ABSINTH Force Field for Proteins Based on Experimentally Derived Amino Acid Specific Backbone Conformational Statistics. Journal of Chemical Theory and Computation 2019, 15(2): 1367–1382. [DOI] [PMC free article] [PubMed] [Google Scholar]
- 44.Toombs JA, Petri M, Paul KR, Kan GY, Ben-Hur A, Ross ED. De novo design of synthetic prion domains. Proceedings of the National Academy of Sciences 2012, 109(17): 6519. [DOI] [PMC free article] [PubMed] [Google Scholar]
- 45.Banani SF, Lee HO, Hyman AA, Rosen MK. Biomolecular condensates: organizers of cellular biochemistry. Nature Reviews Molecular Cell Biology 2017, 18(5): 285–298. [DOI] [PMC free article] [PubMed] [Google Scholar]
- 46.Harrison AF, Shorter J. RNA-binding proteins with prion-like domains in health and disease. Biochemical Journal 2017, 474(8): 1417–1438. [DOI] [PMC free article] [PubMed] [Google Scholar]
- 47.Fomicheva A, Ross ED. From Prions to Stress Granules: Defining the Compositional Features of Prion-Like Domains That Promote Different Types of Assemblies. International Journal of Molecular Sciences 2021, 22(3): 1251. [DOI] [PMC free article] [PubMed] [Google Scholar]
- 48.Mahadevi AS, Sastry GN. Cation−π Interaction: Its Role and Relevance in Chemistry, Biology, and Material Science. Chemical Reviews 2013, 113(3): 2100–2138. [DOI] [PubMed] [Google Scholar]
- 49.Dahal YR, Schmit JD. Ion Specificity and Nonmonotonic Protein Solubility from Salt Entropy. Biophysical Journal 2018, 114(1): 76–87. [DOI] [PMC free article] [PubMed] [Google Scholar]
- 50.Farag M, Bremer A, Borcherds WM, Mittag T, Pappu RV. Experimentally derived stickers-and-spacers model predicts sequence-specific and collective phase behaviors of prion-like low complexity domains. In preparation 2021.
- 51.Yang Y, Jones HB, Dao TP, Castaneda CA. Single Amino Acid Substitutions in Stickers, but Not Spacers, Substantially Alter UBQLN2 Phase Transitions and Dense Phase Material Properties. J Phys Chem B 2019, 123(17): 3618–3629. [DOI] [PubMed] [Google Scholar]
- 52.Tran HT, Mao A, Pappu RV. Role of Backbone−Solvent Interactions in Determining Conformational Equilibria of Intrinsically Disordered Proteins. Journal of the American Chemical Society 2008, 130(23): 7380–7392. [DOI] [PubMed] [Google Scholar]
- 53.Holehouse AS, Garai K, Lyle N, Vitalis A, Pappu RV. Quantitative Assessments of the Distinct Contributions of Polypeptide Backbone Amides versus Side Chain Groups to Chain Expansion via Chemical Denaturation. Journal of the American Chemical Society 2015, 137(8): 2984–2995. [DOI] [PMC free article] [PubMed] [Google Scholar]
- 54.Mathieu C, Pappu RV, Taylor JP. Beyond aggregation: Pathological phase transitions in neurodegenerative disease. Science 2020, 370(6512): 56. [DOI] [PMC free article] [PubMed] [Google Scholar]
- 55.Chou H-Y, Aksimentiev A. Single-Protein Collapse Determines Phase Equilibria of a Biological Condensate. The Journal of Physical Chemistry Letters 2020, 11(12): 4923–4929. [DOI] [PubMed] [Google Scholar]
- 56.Dignon GL, Zheng W, Kim YC, Best RB, Mittal J. Sequence determinants of protein phase behavior from a coarse-grained model. PLoS Comput Biol 2018, 14(1): e1005941. [DOI] [PMC free article] [PubMed] [Google Scholar]
- 57.Dignon GL, Zheng W, Kim YC, Mittal J. Temperature-Controlled Liquid-Liquid Phase Separation of Disordered Proteins. ACS Cent Sci 2019, 5(5): 821–830. [DOI] [PMC free article] [PubMed] [Google Scholar]
- 58.Dannenhoffer-Lafage T, Best RB. A Data-Driven Hydrophobicity Scale for Predicting Liquid-Liquid Phase Separation of Proteins. J Phys Chem B 2021, 125(16): 4046–4056. [DOI] [PubMed] [Google Scholar]
- 59.Dzuricky M, Rogers BA, Shahid A, Cremer PS, Chilkoti A. De novo engineering of intracellular condensates using artificial disordered proteins. Nature Chemistry 2020, 12(9): 814–825. [DOI] [PMC free article] [PubMed] [Google Scholar]
- 60.King OD, Gitler AD, Shorter J. The tip of the iceberg: RNA-binding proteins with prion-like domains in neurodegenerative disease. Brain Research 2012, 1462: 61–80. [DOI] [PMC free article] [PubMed] [Google Scholar]
- 61.Dasmeh P, Wagner A. Natural Selection on the Phase-Separation Properties of FUS during 160 My of Mammalian Evolution. Molecular Biology and Evolution 2020. [DOI] [PMC free article] [PubMed] [Google Scholar]
- 62.Gueroussov S, Weatheritt RJ, O’Hanlon D, Lin Z-Y, Narula A, Gingras A-C, et al. Regulatory Expansion in Mammals of Multivalent hnRNP Assemblies that Globally Control Alternative Splicing. Cell 2017, 170(2): 324–339.e323. [DOI] [PubMed] [Google Scholar]
- 63.Holtzer A, Holtzer MF. Use of the van’t Hoff relation in determination of the enthalpy of micelle formation. The Journal of Physical Chemistry 1974, 78(14): 1442–1443. [Google Scholar]
Associated Data
This section collects any data citations, data availability statements, or supplementary materials included in this article.
Supplementary Materials
Data Availability Statement
NMR assignments of A1-LCD +7K+12D are available from the BMRB at accession code ID 50739. All expression plasmids are available from T.M. under a material transfer agreement with St. Jude Children’s Hospital. Code needed to reproduce the results, SAXS data, CD data, experimental binodals, pH-dependent measurements, sequences used in the bioinformatics analysis, and estimated saturation concentrations of PLCD homologs are available at https://github.com/Pappulab/ PLCD-Data-Repository-and-Analysis-Routines.