Abstract
A growing body of experimental evidence suggests that sirtuins (SIRTs) are associated with tumorigenesis in differentiated thyroid cancer (DTC). Nevertheless, the involvement of SIRTs in the pathogenesis of DTC and their clinical value remain ill-defined and should be thoroughly examined. We explored the transcription of SIRTs and survival data of patients with DTC by the systematic utilization of bioinformatics to analyze data of publicly accessible databases including Oncomine, cBioPortal, Kaplan-Meier Plotter, Gene Expression Profiling Interactive Analysis (GEPIA), Protein Atlas, LinkedOmics, and GSCALite. The examination of gene expression profiles showed that SIRT2, SIRT3, SIRT4, SIRT5, and SIRT6 were downregulated in DTC tissues compared with the normal thyroid tissues. The decreased expression levels of SIRT2, SIRT4, and SIRT5 were correlated with advanced tumor stages. The survival results showed that the increased SIRT4 mRNA expression level was associated with improved overall survival (OS) in the DTC patients. In addition, patients with DTC with high SIRT2, SIRT3, SIRT4, and SIRT5 mRNA levels had higher disease-free survival (DFS). These results showed that SIRT2, SIRT3, SIRT4, SIRT5, and SIRT6 are potential targets for precise treatment of DTC patients and that SIRT2, SIRT3, SIRT4, and SIRT5 are novel potential biomarkers for the prognosis of DTC.
1. Introduction
Thyroid cancer is classified among the most widespread malignant tumors that occur in the endocrine system. The global incidence of thyroid cancer, especially differentiated thyroid cancer (DTC), has been steadily amplified in recent years. DTC is the major type of thyroid cancer and encompasses papillary thyroid cancer (PTC) and follicular thyroid cancer (FTC) [1]. PTC accounts for about 80% of thyroid cancer, while FTC accounts for about 15% within the total of 95% DTC patients [2]. Currently, the main treatments for DTC include surgery, postoperative assisted ablation, thyroid stimulating hormone (TSH) inhibition therapy, and targeted molecular therapy [3]. Targeted molecular therapy has become a new approach for the treatment of advanced thyroid cancer [4, 5]. Studies have shown that RET, RAS, BRAF, and VEGF are closely related to the pathogenesis of thyroid cancer, which lay a foundation for targeted molecular therapy [6–8]. About 70% of PTC is caused by BRAF mutations, RAS mutations and RET/PTC gene rearrangements [9]. In FTC, RAS point mutations, and PPARγ/PAX8 gene rearrangements produce the PPFP fusion gene, the most common oncogene alteration, and PTEN deletion/mutation; PIK3CA mutation and IDH1 mutation are also responsible for FTC [10–13]. Small molecule inhibitors targeting these signaling kinases have become a hot spot for targeted therapies. Due to the heterogeneity of tumors, the use of biomarkers for predicting targeted therapies has some limitations. Therefore, new biomarkers are needed in this field to effectively enhance prognosis and individualized treatment.
Sirtuins (SIRTs) are deacetylases that are highly conserved from bacteria to humans. To date, there are seven recognized members of the human SIRT family which are numbered in order of their discovery into SIRT1-7. X-ray crystal diffraction revealed that multiple members of the SIRT family contain one small domain made of approximately 270 amino acids and a large domain [14]. The large domain is mainly constituted of the Rossmann folds while the small domain encompasses a zinc finger structure [15]. The SIRT family has a deacetylase activity and ADP-nuclease transferase activity, and the deacetylation mediated by SIRTs is characterized by the transfer of the acetyl group to the ADP-ribosyl of NAD [16]. SIRTs mediate both catalytic activities of deacetylation and NAD cleavage. The ADP-ribosyltransferase activity of SIRTs is the transfer of ADP-ribose from NAD to acetylated proteins [16]. SIRTs are of great importance in clinical medicine and basic research. SIRTs are significantly dysregulated in many malignancies challenging human health, in particular colorectal cancer, prostate cancer, ovarian cancer, lung cancer, breast cancer, and thyroid cancer [16–19]. The interactions between mammalian SIRTs and FOXO/PGC-1α, Ku70, NF-κB, p53, and other proteins modulate cellular metabolism, cellular stress response, aging, and apoptosis [20, 21]. SIRTs are thought to have complex and unique features in human DTC [10, 11]. SIRT1 was shown to participate in the regulation of p21 and Bax-related molecular events via the SIRT1-Foxp3 pathway in PTC cells [22]. Other research groups have found that by inhibiting ERK and Mcl-1, SIRT6 silencing can downregulate the invasiveness of PTC cells in vitro. Compared with normal thyroid cancer cells, the expression of SIRT7 was significantly increased in DTC, and the overexpression of SIRT7 and SIRT1 conferred resistance to DTC cells [23, 24]. In addition, some researchers have found that the SIRT family plays a pivotal role by downregulating the expression pattern of the tumor-suppressor gene ARHI in thyroid cancer cells [25]. But so far, which SIRT family is activated or inhibited and the unique function of SIRTs in thyroid cancer remain to be absolutely deciphered [16]. Dysregulation of the SIRTs and its relationship with clinical and pathological traits and the predictive value have been conveyed in human thyroid cancer. With the advent of microarray and next-generation sequencing technology, revolutionary advances have become an important part of biological and biomedical research [26, 27] and have allowed data mining using bioinformatical approaches. Nevertheless, to the best of our knowledge, bioinformatical approaches have not been used to figure out the link between the SIRTs and DTC [28].
Herein, based on publicly available databases, we analyzed in detail different SIRTs in patients with DTC to examine their expression changes, probable function, and prognostic value of SIRT family in DTC.
2. Materials and Methods
2.1. Patients
This study was performed based on bioinformatics analysis of The Cancer Genome Atlas (TCGA) data stored in different databases, namely Oncomine, cBioPortal, Kaplan-Meier Plotter, The Gene Expression Profiling Interactive Analysis (GEPIA), Protein Atlas, LinkedOmics, and GSCALite. No particular approval was needed, and the study followed TCGA policies.
2.2. Oncomine
Oncomine is a database containing microarray expression data for cancers and integrated data-mining platform (http://www.oncomine.org/). Oncomine was employed for analyzing and visualizing the expression levels of genes in the SIRT family members in diverse cancers following the online instructions. The mRNA levels of SIRTs in normal and cancer tissues were compared, and Student's t test was used for assessing the difference between both groups. The significant differences were declared at p < 0.05.
2.3. GEPIA
GEPIA is an interactive online platform for mining the RNA sequencing data from the Genotype-Tissue Expression (GTEx) and TCGA projects (http://gepia.cancer-pku.cn/). GEPIA was used for analyzing the expression profiles of SIRTs in DTC and its pathological stages following the default settings online. GEPIA was also used for survival analysis based on the SIRTs.
2.4. The Kaplan-Meier Plotter
The Kaplan-Meier Plotter (http://www.kmplot.com/) was used to analyze the OS and DFS of patients with DTC. The samples were grouped into high expression and low expression groups relatively to the median expression. The Kaplan-Meier Plotter was used for generating the survival plot containing the log rank p value and the hazard ratio (HR) with 95% confidence intervals (CIs).
2.5. cBioPortal
TCGA database contains genomic and clinical data on more than 30 cancer types. Samples from TCGA-THCA dataset were chosen and used for the analysis of SIRTs using cBioPortal (http://www.cbioportal.org). Genetic variations were analyzed by selecting copy number alterations (CNAs) and mutations as selected molecular profiles.
2.6. Human Protein Atlas
Immunostaining images of SIRTs in human DTC tissues compared to nontumorous thyroid tissues were obtained from the Protein Atlas database (https://www.proteinatlas.org).
2.7. LinkedOmics
The LinkedOmics database is a multiomics tool for the interpretation of attribute associations between the existing cancer databases [29]. It was used for association analysis between the SIRTs and other genes in the DTC RNA-Seq data. The analysis was performed online following the instructions displayed on the platform (http://www.linkedomics.org).
2.8. Functional Enrichment Analysis
GO and KEGG functional enrichment analyses were performed to uncover the functions prominently associated with the SIRTs and their coregulated genes using the ClusterProfiler package in the R software.
3. Results
3.1. Genomic Profiles of SIRTs
The genomic profiles of SIRT family members in patients with DTC were assessed utilizing the Oncomine, GEPA, and Human Protein Atlas databases. The transcriptional expression of SIRTs between various normal and cancer tissues was explored by data analysis in the Oncomine database (Figure 1). The results indicated that SIRTs were diversely expressed in different cancer types. Here, DTC was classified to head and neck cancer. Six unique analyses showed significant differences for SIRT1 in head and neck cancer, of which two were upregulated and four were downregulated. Similar results were observed for SIRT3 and SIRT4. The same expression trends were also observed in the other cancer types. The expression levels of SIRT2 in head and neck cancer were upregulated in five unique analyses and downregulated in one unique analysis. Similar results were observed for SIRT5, including 7 upregulations and 4 downregulations. Compared with normal tissues, SIRT6 mRNA expression levels in head and neck cancer were significantly decreased in five unique analyses. The expression levels of SIRT7 were elevated in the majority of analyses across all types of cancer. For head and neck cancer, however, SIRT7 was upregulated in two unique analyses and downregulated in two unique analyses.
Figure 1.
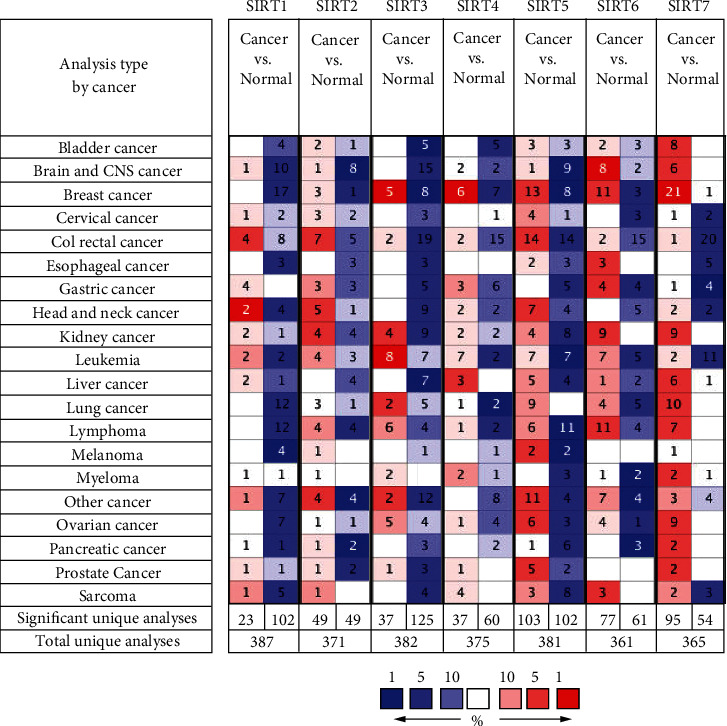
The transcription levels of SIRTs in different types of cancers (Oncomine). Red color represents elevated expression, and blue color represents reduced expression. The depth of the color represents the best gene rank percentile.
Next, the GEPIA database was exploited for examining the expression of the SIRTs in DTC samples in comparison with the normal tissues at mRNA level. The scatter diagram and the box plot of the expression levels of SIRTs are reported in Figures 2(a) and 2(b), respectively. 512 DTC samples and 337 normal tissues were selected. The results displayed that the expression levels of SIRT2, SIRT3, SIRT4, SIRT6, and SIRT7 in DTC tissues were lower than those in normal tissues (Figures 2(a) and 2(b)). Immunohistochemistry (IHC) analysis from the Protein Atlas database was done to assess the protein expression of SIRT proteins in DTC tissues. There was moderate or weak immunoreactivity of SIRTs 1, 3, 4, 5, 6, and 7 in DTC tissues while their corresponding immunoreactivity was relatively weaker in normal tissues (Figure 2(c)). SIRT2 was not detected in both DTC and normal tissues. We also analyzed the expression of the SIRT family in different tumor stages in DTC. The decreased expression of SIRT2, SIRT4, and SIRT5 was significantly associated with advanced stages of DTC, while the expression levels of SIRT1, SIRT3, SIRT6, and SIRT7 groups did not differ significantly between the DTC stages (Figure 3(a)). Pearson's correlation was also performed to evaluate whether there was a relationship between SIRTs in DTC. The results showed that there were significantly positive correlations observed between SIRT1 and SIRT2/3/5/7, SIRT2 and SIRT3/4/5/6/7, SIRT3 and SIRT4/5/6/7, SIRT4 and SIRT5/7, SIRT5 and SIRT7, and SIRT6 and SIRT7 (Figure 3(b), shown in blue). SIRT1 had a negative correlation with SIRT6 (p = 0.028). No significant correlations were found between SIRT1 and SIRT4, SIRT4 and SIRT6, or SIRT5 and SIRT6. 32 (2%) of selected patients (1503) had altered genes, including missense mutation (SIRT4 and SIRT6), truncating mutation (SIRT2), amplification (SIRT2, SIRT4, and SIRT7), and deep deletion (SIRT1, SIRT3, and SIRT6, Figure 3(c)). No alteration was recorded for SIRT5.
Figure 2.
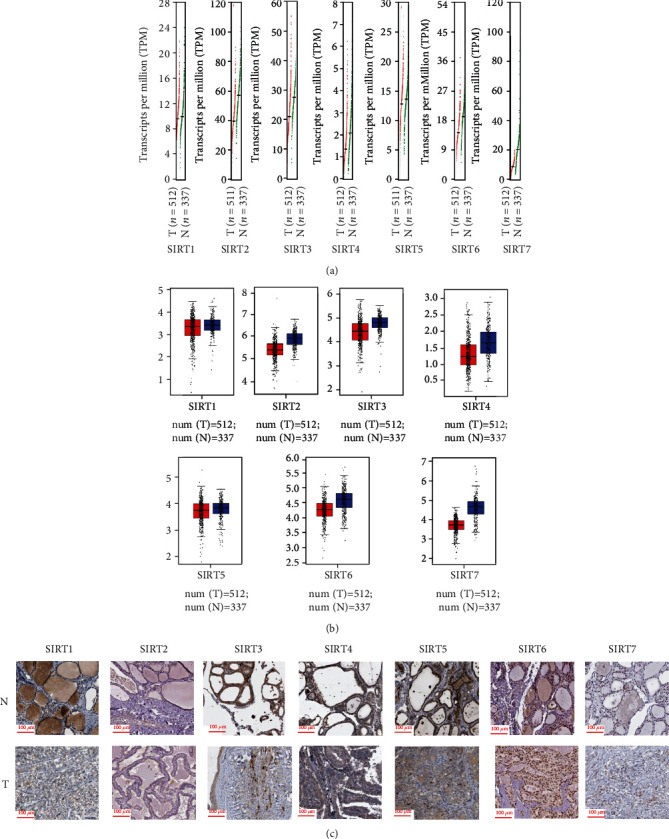
The expression of SIRT family members in DTC using GEPIA. (a) Scatter diagram showing the expression profile of SIRTs in DTC and normal samples. Red color represents the SIRT expression level in tumor samples, and green color represents the SIRT expression level in normal samples. (b) Box plot showing the expression of SIRTs in DTC and normal samples. Red color represents the SIRT expression level in tumor samples, and blue color represents the SIRT expression level in normal samples. (c) Representative IHC images of SIRTs in DTC. T represents tumor tissues and N represents normal tissues. Positive staining was mainly concentrated at the nucleus.
Figure 3.
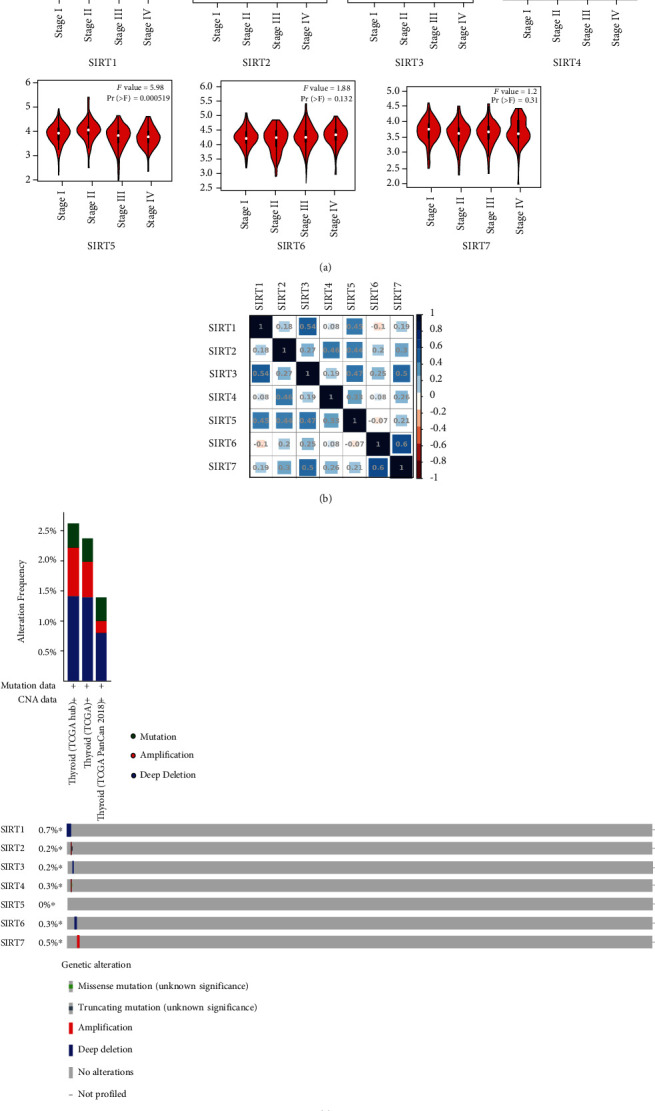
Correlation between SIRT expression and tumor stage in DTC (GEPIA) and genetic variation. (a) Association between the expression level of SIRTs and tumor stages. (b) Correlation analysis between SIRTs in DTC. Darker colors represent the higher correlation. (c) Genetic variation of SIRTs in DTC. Genetic variation included mutation, amplification, and deep deletion.
3.2. Prognosis Evaluation of SIRTs in DTC Patients
To explore the possible involvement of the SIRT family in the survival outcomes of DTC patients, the Kaplan-Meier Plotter tool was utilized to assess their survival rates by using the openly accessible DTC datasets. A positive correlation between the increased SIRT4 mRNA expression level with improved overall survival (OS) was recorded (Figure 4, p < 0.05). The increased SIRT7 mRNA expression had a trend toward better OS (p = 0.052). DTC patients with high SIRT2, SIRT3, SIRT4, and SIRT5 mRNA levels had longer disease-free survival (DFS) time (Figure 4, p < 0.001).
Figure 4.
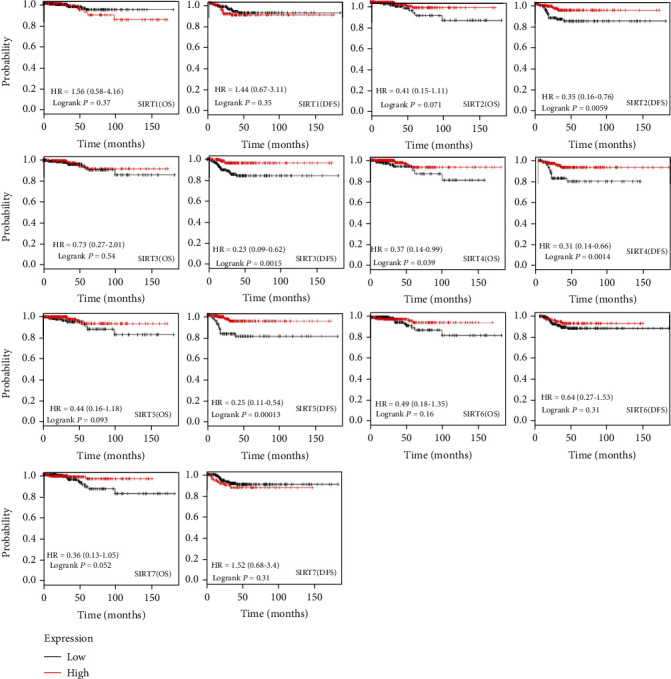
The prognostic value of mRNA level of SIRT factors in DTC (Kaplan-Meier Plotter), including OS and DFS analysis. HR > 1.0 represents a risky gene, and HR < 1.0 represents a protective gene.
3.3. Identification of Genes Correlated with SIRTs
With the aim of identifying the genes that were correlated with the expression of SIRTs, the Pearson correlation analysis was performed using the LinkedOmics database. The results indicated the expression of SIRTs was significantly correlated with a multitude of genes (Figures 5 and 6). We found that TNKS2, PHF3, MORC3, SMC3, and SPOPL were genes most positively correlated with SIRT1 while AP2S1, EXOSC4, GPS1, NDUFS8, and POLR2L were the genes most negatively associated with SIRT1 (Figures 5 and 6). Genes such as NAPA, BCAT2, and GNAS were the most positively correlated with SIRT2 while NOTCH2, AHNAK, ASAP2, and SGMS2 were genes most negatively associated with SIRT2 (Figures 5 and 6). Genes positively associated with SIRT3 were represented by DMAP1, TCEA2, MYST1, and SNRPA whereas the most negatively correlated genes were HEATR5A and YME1L1 (Figures 5 and 6). SLC25A42, ZNF346, and LOH12CR2 were genes most positively associated with SIRT5 while KCNQ3, FLNA, RUNX1, and FN1 were those most significantly and negatively associated with SIRT4 (Figures 5 and 6). The genes most positively correlated with SIRT5 were OXSM, SFXN4, COQ9, and NDUFA5 while those most negatively regulated with this gene were B4GALT5 and GALNT5 (Figures 5 and 6). SIRT6 was most positively associated with LSM7 and FKBP8 but most negatively associated with STT3B and CLCN3 while genes most positively associated with SIRT7 were SPSB3, ZGPAT, PUS1, and TSEN54 but PRKAR2A and PDZD8 were the most negatively associated with SIRT7 (Figures 5 and 6). Specially, BRAF mutation is the most common gene alteration in DTC [30]. We examined the correlation between SIRTs and BRAF and found that BRAF was positively associated with SIRT1, SIRT2, SIRT3, SIRT4, SIRT5, and 7 but negatively associated with SIRT6 (p < 0.05).
Figure 5.
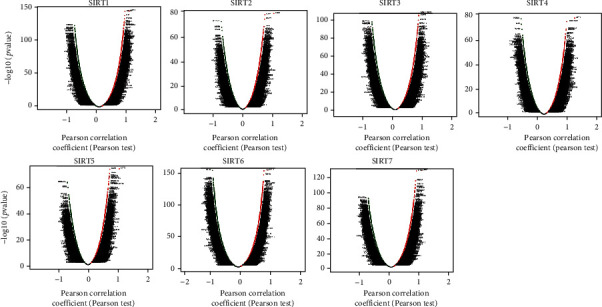
Volcano plot of association results showing the correlation of different SIRTs with gene expression in DTC (LinkedOmics). Red dots represent positive correlation, and green dots represent negative correlation.
Figure 6.
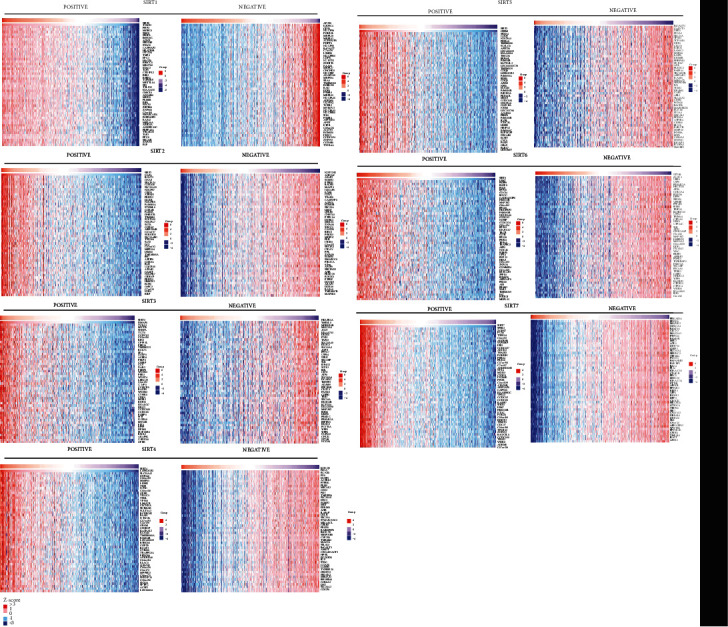
Heatmap plot of association results showing the correlation of different SIRTs with gene expression in DTC (LinkedOmics). Top 50 genes with the greatest correlation were presented.
3.4. Functional Analysis of SIRTs
In order to uncover the functions prominently associated with the SIRTs and their coregulated genes, functional enrichment analysis was performed on a set of genes containing SIRTs and genes correlated with SIRTs with r greater than 0.8 and p < 0.05. The results indicated that SIRTs and coregulated genes were involved in biological processes (BP) of protein deacetylation, peptidyl-lysine modification, protein ADP-ribosylation, and protein diacylation (Figure 7(a)). In the category of cellular component (CC), cohesin complex, chromatin, and mitotic spindle pole were the most represented gene ontology (GO) terms while in the category of molecular function (MF), NAD+ binding, NAD-dependent protein deacetylase activity, and protein deacetylase activity were the predominant GO terms (Figures 7(b) and 7(c)). The KEGG pathway enrichment analysis showed that nicotinamide and nicotinamide metabolism, basal transcription factors, central carbon metabolism in cancer, Huntington's disease, and FOXO signaling pathway were the most significantly enriched signaling pathways associated with SIRTs and their correlated genes in DTC (Figure 7(d)). In the pathway of central carbon metabolism in cancer, SIRT6 could directly inhibit hypoxia-inducible factor 1α (HIF-1α), and SIRT3 could inhibit HIF-1α by repressing HIF-1 signaling, which then affected metabolic process such as glycolysis and tricarboxylic acid (TCA) cycle (Figure 8). The Ras/Raf/ERK/MAPK pathway was also regulated by SIRT6, thus contributing to c-Myc deregulated expression. In addition, SIRT1, together with BARF, could modulate the FOXO signaling pathway (Figure 9).
Figure 7.
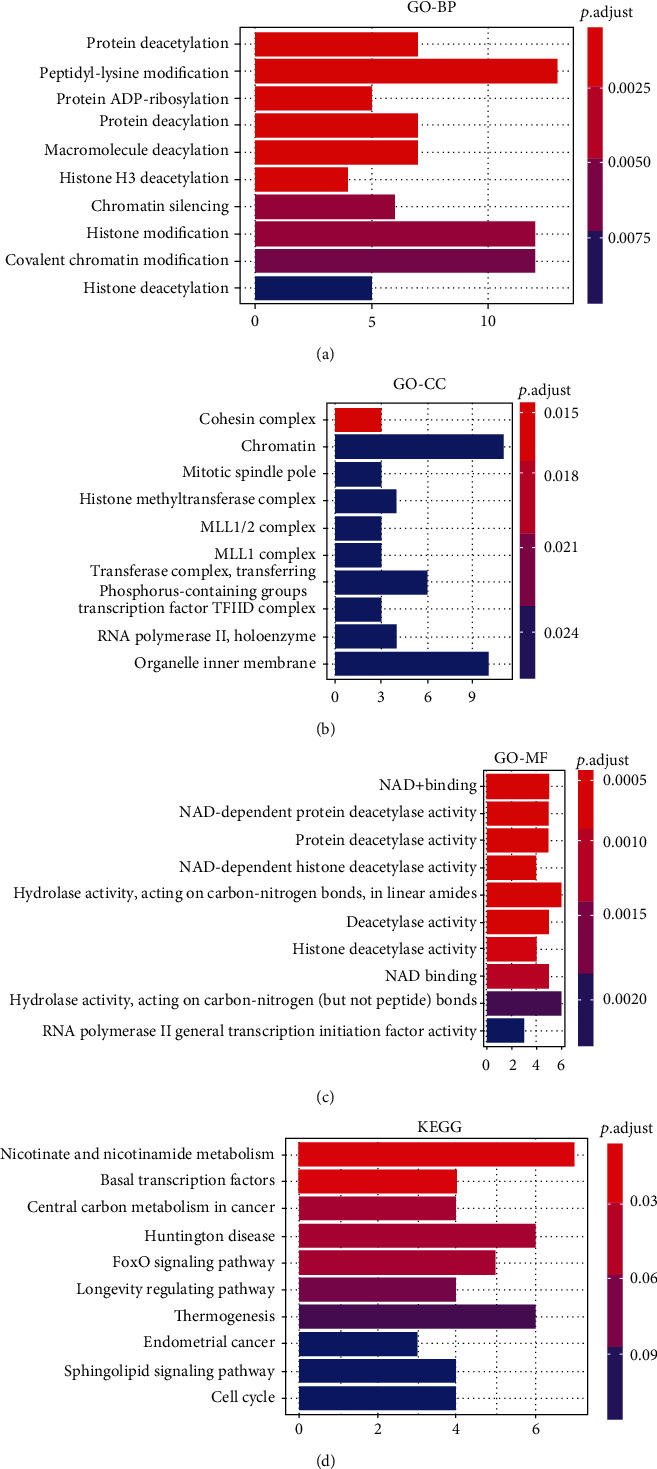
Functional enrichment analysis of SIRTs and coregulated genes in DTC. (a) Biological process. (b) Cellular component. (c) Molecular function. (d) KEGG pathways. The intensity of the colors represents the p value (the redder the color, the lower p value). Top 10 significant terms were presented.
Figure 8.
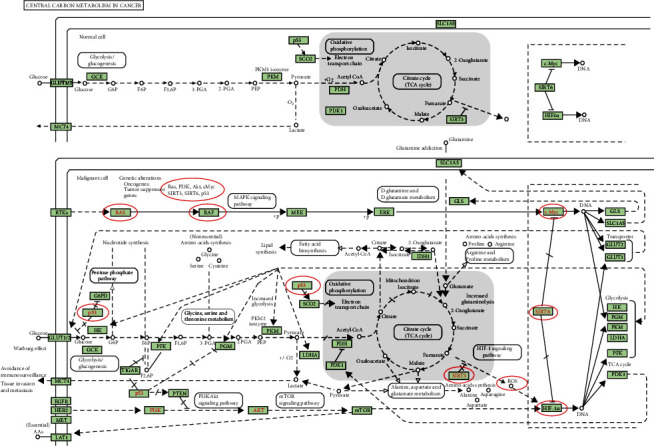
Carbon metabolism in cancer pathway. SIRTs and coregulated genes are noted in a red circle. Solid arrow represents epicardial activation; dashed arrow represents septal activation; T-shaped arrow represents inhibition.
Figure 9.
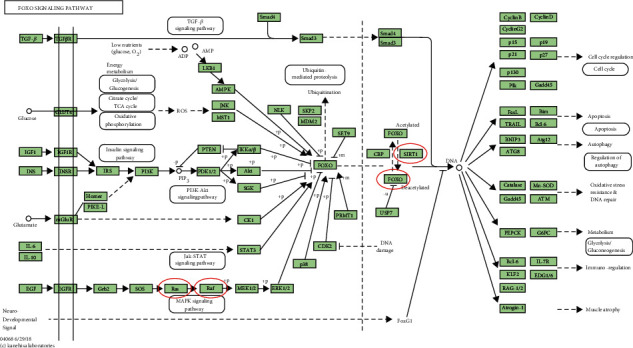
The FOXO signaling pathway. SIRTs and coregulated genes are noted in a red circle. Solid arrow represents epicardial activation; dashed arrow represents septal activation; T-shaped arrow represents inhibition.
4. Discussion
Dysregulation of SIRTs has been investigated in diverse cancers [24]. Although the function and prognostic values of SIRTs had been partly validated in various cancers, no bioinformatics analysis of SIRTs has been performed in DTC [31, 32]. This study reported for the first time the mRNA expression profiles and clinical value of SIRTs in DTC. Our findings will help leverage existing knowledge to improve treatment design and improve the prognosis of patients with DTC.
SIRT1 was generally known as an oncogene and involved in multiple cellular processes including cell cycle, apoptosis, and cancer metastasis [33]. SIRT1 was acknowledged as a direct downstream target of miR-212, which hindered the proliferation and promoted the apoptosis of thyroid cancer cells by negatively regulating SIRT1 [34]. It has also been reported that SIRT1-Foxp3 signaling-mediated regulation of Bax and p21 mRNA expression is a hallmark molecular event in DTC and shows significant resistance to genotoxic stress induced by the chemotherapeutic agent etoposide [22]. Li et al. [35] discovered that SIRT7 could promote tumorigenesis by acting on the DBC1/SIRT1 axis in PTC cells. The result was consistent with our findings that SIRT1 and SIRT7 were correlated significantly (r = 0.19, p < 0.001). Roehlen et al. [36] demonstrated that the vitamin D-SIRT1-FOXO3a axis played a pivotal role in DTC and Hashimoto thyroiditis. Our KEGG results also showed SIRT1 affected the FOXO signaling pathway along with BRAF. In the study, however, no significant associations were found between SIRT1 and clinical characteristics.
So far, our knowledge on the expression and regulation of SIRT2 in DTC is limited. In contrast to previous results suggesting a broad tumor-promoting effect for SIRT2 [37], our study indicated that SIRT2 expression was decreased in DTC tissues compared to the nontumorous tissues. Its expression pattern was significantly associated with tumor stage. Higher expression of SIRT2 was not significantly associated with OS but was correlated with improved DFS in all patients with DTC, which suggested SIRT2 as a possible target of treatment.
SIRT3, a nicotinamide adenine dinucleotide- (NAD-) dependent deacetylase, was often recognized as a tumor-suppressor gene [38]. However, SIRT3 was reported to be highly expressed in DTC compared to benign thyroid tumor and might involve mitochondrial alterations [39]. Wang et al. showed that miR-1225-5p could promote DTC cell proliferation and metastasis via targeting SIRT3 directly [40]. These results and ours were not in accordance. Our findings indicated that the mRNA expression level of SIRT3 was slightly lower in DTC tissue than in normal tissue, and patients with high DTC expression had better DFS. Additionally, there have been a few studies on SIRT3/HIF-1α pathway in cervical cancer and hepatocellular cancer but not in DTC [41–43]. More validation studies need to be performed to further investigate the role of SIRT3 in DTC.
SIRT4 displayed deacetylase activity and were involved in regulating cellular energy metabolism [44]. Studies showed that SIRT4 was also reported to significantly decrease in thyroid cancer and inhibit glutamine metabolism and thus inhibit cell proliferation and invasion [45]. This is consistent with our predictions. In our study, we demonstrated that the expression of SIRT4 in DTC tissues was downregulated, and its expression was associated with tumor progression. Moreover, low expression of SIRT4 was markedly correlated with poor OS and DFS, which corroborated with the findings that SIRT4 is an antitumor gene [46]. This suggests that SIRT4 may be considered a potential biomarker of poor prognosis and an effective molecular target of treatment for DTC.
SIRT5 played a very important role in fatty acid oxidation, glycolysis, TCA cycle, apoptosis, and antioxidant defense [47]. Some researchers also found that SIRT5 was upregulated in cisplatin-resistant ovarian cancer cells compared with cisplatin-sensitive cells [48]. In addition, SIRT5 was found to promote cisplatin resistance (HO-1) pathway in ovarian cancer by modulating Nrf2/heme oxygenase 1 axis [48]. However, no study has reported the role of SIRT5 in DTC. In the present study, low expression of SIRT5 was observed in DTC patients with advanced diseases and significantly correlated with improved DFS, suggesting SIRT5 may function as a tumor-suppressor gene.
Previous works indicated that SIRT6 plays a relevant role in aging biochemical functions involved in tumor progression and could constitute an antitumor therapeutic target [49]. Qu et al. [50] demonstrated that SIRT6 enhanced their malignant behavior through the BRAF/ERK/Mcl-1 pathway. Our studies also found the significant relationship between SIRT6 and BRAF (Figures 3(b) and 8). Nevertheless, SIRT6 seemed to have no effect on tumor stage or clinical outcomes.
SIRT7 was upregulated in multiple cancers including DTC and could promote the tumorigenesis of DTC cells in vitro and in vivo [35, 51–53]. SIRT7 is reported to be correlated with active rRNA genes (rDNA) and actively increases outgrowth and proliferation of U2OS cells [54]. Compared to the SIRT7-wildtype hepatoma cell line, the SIRT7-deficient cell line exhibited exquisite sensitivity to doxorubicin via the SIRT7-P53-NOXA axis [55]. Inhibition of SIRT7 using small interfering RNAs inhibits tumor resistance to radiation [56, 57]. In the present study, SIRT7 expression was not associated with tumor stage and prognosis in DTC.
Functional enrichment of SIRTs and their coregulated genes in DTC indicated that these genes were involved in protein deacetylation, peptidyl-lysine modification, protein ADP-ribosylation, and protein diacylation. The most significant pathways were nicotinamide and nicotinamide metabolism pathways and basal transcription factors. These results indicated that SIRTs may participate in the pathogenesis of DTC by regulating these pathways and biological processes. In NIH3T3 cells, SIRT1 causes ubiquitination and degradation of FOXO3, a FOXO transcription factor family member that can play a crucial role in tumor suppression and metabolism and may act as oncogene [58]. Previous studies reported that SIRT2 mediates the acetylation of pyruvate kinase to regulate tumor growth [59]. SIRT3, downregulated in cholangiocarcinoma (CCA) patients, can prevent tumor progression by inhibiting the HIF1α/PDK1/PDHA1 pathway [60]. SIRT5 was also found to modulate the deacetylation of LDHB and induce the autophagy in colorectal cancer [61]. Previous study showed that SIRT6 might act as antioncogenesis factor by inhibiting HIF-1α, an angiogenesis-promoting molecule, in lung cancer [62], and by inhibiting c-Myc gene and ribosome biosynthesis [63]. Since our results showed decreased expression levels of SIRT3 and SIRT6 in DTC tissues, we estimate that SIRT3 and SIRT6 take effect through metabolic processes such as glycolysis and TCA cycle. Similarly, SIRT7 was found to counteract cancer development by the deacetylation of WDR77 [64]. These studies support our finding that the SIRTs and coregulated genes were involved in deacetylation in DTC. Moreover, our study corroborated with previous studies demonstrating that nicotinamide metabolism regulates cancer processes [65, 66].
5. Conclusion
In summary, we performed a systematic exploration to examine the expression profiles and clinical value of the SIRT family proteins in DTC and have provided an overview of these SIRTs in DTC. Our findings suggest that high expression of SIRT2, SIRT3, SIRT4, SIRT5, and SIRT6 in DTC may indicate that they have significant regulatory functions in thyroid carcinogenesis. Therefore, SIRT2, SIRT3, SIRT4, SIRT5, and SIRT6 may be relevant therapeutic targets for DTC. Moreover, the expression of SIRT2, SIRT3, SIRT4, and SIRT5 may have potential as prognostic markers for determining the survival and prognosis of DTC.
Data Availability
The datasets used in the present study can be obtained in The Cancer Genome Atlas (https://portal.gdc.cancer.gov/).
Conflicts of Interest
The authors declare that there is no conflict of interest regarding the publication of this paper.
Authors' Contributions
YW designed the study, analyzed the data, and wrote the manuscript. LY performed the experiments, revised the manuscript, and assisted in the study design. All the authors read and approved the final manuscript.
References
- 1.Xing M. Molecular pathogenesis and mechanisms of thyroid cancer. Nature Reviews Cancer . 2013;13(3):184–199. doi: 10.1038/nrc3431. [DOI] [PMC free article] [PubMed] [Google Scholar]
- 2.Abdullah M. I., Junit S. M., Ng K. L., Jayapalan J. J., Karikalan B., Hashim O. H. Papillary thyroid cancer: genetic alterations and molecular biomarker investigations. International Journal of Medical Sciences . 2019;16(3):450–460. doi: 10.7150/ijms.29935. [DOI] [PMC free article] [PubMed] [Google Scholar]
- 3.Rusinek D., Chmielik E., Krajewska J., et al. Current advances in thyroid cancer management. Are we ready for the epidemic rise of diagnoses? International Journal of Molecular Sciences . 2017;18(8, article 1817) doi: 10.3390/ijms18081817. [DOI] [PMC free article] [PubMed] [Google Scholar]
- 4.Valerio L., Pieruzzi L., Giani C., et al. Targeted therapy in thyroid cancer: state of the art. Clinical Oncology (Royal College of Radiologists) . 2017;29(5):316–324. doi: 10.1016/j.clon.2017.02.009. [DOI] [PubMed] [Google Scholar]
- 5.Viola D., Valerio L., Molinaro E., et al. Treatment of advanced thyroid cancer with targeted therapies: ten years of experience. Endocrine-Related Cancer . 2016;23(4):R185–R205. doi: 10.1530/ERC-15-0555. [DOI] [PubMed] [Google Scholar]
- 6.Schneider D. F., Chen H. New developments in the diagnosis and treatment of thyroid cancer. CA: a Cancer Journal for Clinicians . 2013;63(6):373–394. doi: 10.3322/caac.21195. [DOI] [PMC free article] [PubMed] [Google Scholar]
- 7.Tiedje V., Zwanziger D., Ting S., Schmid K. W., Fuhrer D. Molecular pathogenesis of thyroid tumors. Deutsche Medizinische Wochenschrift . 2015;140(8):578–582. doi: 10.1055/s-0041-101491. [DOI] [PubMed] [Google Scholar]
- 8.Melo M., Gaspar da Rocha A., Batista R., et al. TERT, BRAF, and NRAS in primary thyroid cancer and metastatic disease. The Journal of Clinical Endocrinology and Metabolism . 2017;102(6):1898–1907. doi: 10.1210/jc.2016-2785. [DOI] [PubMed] [Google Scholar]
- 9.Zou M., Baitei E. Y., Alzahrani A. S., et al. Concomitant RAS, RET/PTC, or BRAF mutations in advanced stage of papillary thyroid carcinoma. Thyroid . 2014;24(8):1256–1266. doi: 10.1089/thy.2013.0610. [DOI] [PMC free article] [PubMed] [Google Scholar]
- 10.Vuong H. G., Kondo T., Oishi N., et al. Paediatric follicular thyroid carcinoma - indolent cancer with low prevalence of RAS mutations and absence of PAX8-PPARG fusion in a Japanese population. Histopathology . 2017;71(5):760–768. doi: 10.1111/his.13285. [DOI] [PubMed] [Google Scholar]
- 11.Nagy R., Ganapathi S., Comeras I., et al. Frequency of germline PTEN mutations in differentiated thyroid cancer. Thyroid :Official Journal of the American Thyroid Association . 2011;21(5):505–510. doi: 10.1089/thy.2010.0365. [DOI] [PMC free article] [PubMed] [Google Scholar]
- 12.Alzahrani A. S., Murugan A. K., Qasem E., Alswailem M., Al-Hindi H., Shi Y. Single point mutations in pediatric pifferentiated thyroid cancer. Thyroid . 2017;27(2):189–196. doi: 10.1089/thy.2016.0339. [DOI] [PubMed] [Google Scholar]
- 13.Yoo S. K., Lee S., Kim S. J., et al. Comprehensive analysis of the transcriptional and mutational landscape of follicular and papillary thyroid cancers. PLoS Genetics . 2016;12(8, article e1006239) doi: 10.1371/journal.pgen.1006239. [DOI] [PMC free article] [PubMed] [Google Scholar]
- 14.Vassilopoulos A., Fritz K. S., Petersen D. R., Gius D. The human sirtuin family: evolutionary divergences and functions. Human Genomics . 2011;5(5):485–496. doi: 10.1186/1479-7364-5-5-485. [DOI] [PMC free article] [PubMed] [Google Scholar]
- 15.Beauharnois J. M., Bolivar B. E., Welch J. T. Sirtuin 6: a review of biological effects and potential therapeutic properties. Molecular BioSystems . 2013;9(7):1789–1806. doi: 10.1039/c3mb00001j. [DOI] [PubMed] [Google Scholar]
- 16.Cantó C., Sauve A. A., Bai P. Crosstalk between poly(ADP-ribose) polymerase and sirtuin enzymes. Molecular Aspects of Medicine . 2013;34(6):1168–1201. doi: 10.1016/j.mam.2013.01.004. [DOI] [PMC free article] [PubMed] [Google Scholar]
- 17.Sag A. A., Selcukbiricik F., Mandel N. M. Evidence-based medical oncology and interventional radiology paradigms for liver-dominant colorectal cancer metastases. World Journal of Gastroenterology . 2016;22(11):3127–3149. doi: 10.3748/wjg.v22.i11.3127. [DOI] [PMC free article] [PubMed] [Google Scholar]
- 18.Lovaas J. D., Zhu L., Chiao C. Y., Byles V., Faller D. V., Dai Y. SIRT1 enhances matrix metalloproteinase-2 expression and tumor cell invasion in prostate cancer cells. The Prostate . 2013;73(5):522–530. doi: 10.1002/pros.22592. [DOI] [PMC free article] [PubMed] [Google Scholar]
- 19.Shin D. H., Choi Y.-J., Jin P., et al. Distinct effects of SIRT1 in cancer and stromal cells on tumor promotion. Oncotarget . 2016;7(17):23975–23987. doi: 10.18632/oncotarget.8073. [DOI] [PMC free article] [PubMed] [Google Scholar]
- 20.Singh C. K., Chhabra G., Ndiaye M. A., Garcia-Peterson L. M., Mack N. J., Ahmad N. The role of sirtuins in antioxidant and redox signaling. Antioxidants & Redox Signaling . 2018;28(8):643–661. doi: 10.1089/ars.2017.7290. [DOI] [PMC free article] [PubMed] [Google Scholar]
- 21.Wyman A. E., Atamas S. P. Sirtuins and accelerated aging in scleroderma. Current Rheumatology Reports . 2018;20(4):16–16. doi: 10.1007/s11926-018-0724-6. [DOI] [PMC free article] [PubMed] [Google Scholar]
- 22.Kweon K. H., Lee C. R., Jung S. J., et al. Sirt1 induction confers resistance to etoposide-induced genotoxic apoptosis in thyroid cancers. International Journal of Oncology . 2014;45(5):2065–2075. doi: 10.3892/ijo.2014.2585. [DOI] [PubMed] [Google Scholar]
- 23.Paredes S., Villanova L., Chua K. F. Molecular pathways: emerging roles of mammalian sirtuin SIRT7 in cancer. Clinical Cancer Research : An Official Journal of The American Association for Cancer Research . 2014;20(7):1741–1746. doi: 10.1158/1078-0432.CCR-13-1547. [DOI] [PMC free article] [PubMed] [Google Scholar]
- 24.Roth M., Chen W. Y. Sorting out functions of sirtuins in cancer. Oncogene . 2014;33(13):1609–1620. doi: 10.1038/onc.2013.120. [DOI] [PMC free article] [PubMed] [Google Scholar]
- 25.Feng W., Zhen L., Luo R. Z., et al. The ARHI tumor suppressor gene is repressed by multiple histone deacetylases (HDACs) in breast cancer cells. Cancer Research . 2005;65:643–643. [Google Scholar]
- 26.Behzadi P., Behzadi E., Alavian S. M. DNA microarray technology in HBV genotyping. Minerva Medica . 2017;108(5):473–476. doi: 10.23736/S0026-4806.17.05059-5. [DOI] [PubMed] [Google Scholar]
- 27.Li T., Mo C., Qin X., Li S., Liu Y., Liu Z. Glycoprofiling of early gastric cancer using lectin microarray technology. Clinical Laboratory . 2018;64(1):153–161. doi: 10.7754/Clin.Lab.2017.170814. [DOI] [PubMed] [Google Scholar]
- 28.Lamartina L., Grani G., Durante C., Filetti S. Recent advances in managing differentiated thyroid cancer. F1000Research . 2018;7:86–86. doi: 10.12688/f1000research.12811.1. [DOI] [PMC free article] [PubMed] [Google Scholar]
- 29.Vasaikar S. V., Straub P., Wang J., Zhang B. LinkedOmics: analyzing multi-omics data within and across 32 cancer types. Nucleic Acids Research . 2018;46(D1):D956–D963. doi: 10.1093/nar/gkx1090. [DOI] [PMC free article] [PubMed] [Google Scholar]
- 30.Li Y., Zhang Y., Xiao S., et al. Mps1 is associated with the BRAF(V600E) mutation but does not rely on the classic RAS/RAF/MEK/ERK signaling pathway in thyroid carcinoma. Oncology Letters . 2018;15(6):9978–9986. doi: 10.3892/ol.2018.8561. [DOI] [PMC free article] [PubMed] [Google Scholar]
- 31.Jeong S. M., Haigis M. C. Sirtuins in cancer: a balancing act between genome sability and metabolism. Molecules and Cells . 2015;38(9):750–758. doi: 10.14348/molcells.2015.0167. [DOI] [PMC free article] [PubMed] [Google Scholar]
- 32.Cha Y. I., Kim H. S. Emerging role of sirtuins on tumorigenesis: possible link between aging and cancer. BMB Reports . 2013;46(9):429–438. doi: 10.5483/BMBRep.2013.46.9.180. [DOI] [PMC free article] [PubMed] [Google Scholar]
- 33.Deng C. X. SIRT1, is it a tumor promoter or tumor suppressor? International Journal of Biological Sciences . 2009;5(2):147–152. doi: 10.7150/ijbs.5.147. [DOI] [PMC free article] [PubMed] [Google Scholar]
- 34.Li D., Bai L., Wang T., et al. Function of miR-212 as a tumor suppressor in thyroid cancer by targeting SIRT1. Oncology Reports . 2018;39(2):695–702. doi: 10.3892/or.2017.6119. [DOI] [PubMed] [Google Scholar]
- 35.Li H., Tian Z., Qu Y., et al. SIRT7 promotes thyroid tumorigenesis through phosphorylation and activation of Akt and p70S6K1 via DBC1/SIRT1 axis. Oncogene . 2019;38(3):345–359. doi: 10.1038/s41388-018-0434-6. [DOI] [PubMed] [Google Scholar]
- 36.Roehlen N., Doering C., Hansmann M. L., et al. Vitamin D, FOXO3a, and sirtuin1 in Hashimoto’s thyroiditis and differentiated thyroid cancer. Front Endocrinol (Lausanne) . 2018;9:p. 527. doi: 10.3389/fendo.2018.00527. [DOI] [PMC free article] [PubMed] [Google Scholar]
- 37.Spiegelman N. A., Hong J. Y., Hu J., et al. A small-molecule SIRT2 inhibitor that promotes K-Ras4a lsine ftty-acylation. ChemMedChem . 2019;14(7):744–748. doi: 10.1002/cmdc.201800715. [DOI] [PMC free article] [PubMed] [Google Scholar]
- 38.Alhazzazi T. Y., Kamarajan P., Verdin E., Kapila Y. L. SIRT3 and cancer: tumor promoter or suppressor? Biochimica et Biophysica Acta . 2011;1816(1):80–88. doi: 10.1016/j.bbcan.2011.04.004. [DOI] [PMC free article] [PubMed] [Google Scholar]
- 39.Shackelford R., Hirsh S., Henry K., Abdel-Mageed A., Kandil E., Coppola D. Nicotinamide phosphoribosyltransferase and SIRT3 expression are increased in well-differentiated thyroid carcinomas. Anticancer Research . 2013;33(8):3047–3052. doi: 10.1093/ajcp/140.suppl1.011. [DOI] [PubMed] [Google Scholar]
- 40.Wang S., Chen X., Zhang Z., Wu Z. MicroRNA-1225-5p inhibits the development and progression of thyroid cancer via targeting sirtuin 3. Pharmazie . 2019;74(7):423–427. doi: 10.1691/ph.2019.9411. [DOI] [PubMed] [Google Scholar]
- 41.Zhao X. L., Yu C. Z. Vosaroxin induces mitochondrial dysfunction and apoptosis in cervical cancer HeLa cells: involvement of AMPK/Sirt3/HIF-1 pathway. Chemico-Biological Interactions . 2018;290:57–63. doi: 10.1016/j.cbi.2018.05.011. [DOI] [PubMed] [Google Scholar]
- 42.de Matteis S., Scarpi E., Granato A. M., et al. Role of SIRT-3, p-mTOR and HIF-1α in hepatocellular carcinoma patients affected by metabolic dysfunctions and in chronic treatment with metformin. International Journal of Molecular Sciences . 2019;20(6):p. 1503. doi: 10.3390/ijms20061503. [DOI] [PMC free article] [PubMed] [Google Scholar]
- 43.Schumacker P. T. SIRT3 controls cancer metabolic reprogramming by regulating ROS and HIF. Cancer Cell . 2011;19(3):299–300. doi: 10.1016/j.ccr.2011.03.001. [DOI] [PMC free article] [PubMed] [Google Scholar]
- 44.Jeong S. M., Xiao C., Finley L. W., et al. SIRT4 has tumor-suppressive activity and regulates the cellular metabolic response to DNA damage by inhibiting mitochondrial glutamine metabolism. Cancer Cell . 2013;23(4):450–463. doi: 10.1016/j.ccr.2013.02.024. [DOI] [PMC free article] [PubMed] [Google Scholar]
- 45.Chen Z., Lin J., Feng S., et al. SIRT4 inhibits the proliferation, migration, and invasion abilities of thyroid cancer cells by inhibiting glutamine metabolism. Oncotargets and Therapy . 2019;12:2397–2408. doi: 10.2147/OTT.S189536. [DOI] [PMC free article] [PubMed] [Google Scholar]
- 46.Tao Y., Yu S., Chao M., Wang Y., Xiong J., Lai H. SIRT4 suppresses the PI3K/Akt/NFkappaB signaling pathway and attenuates HUVEC injury induced by oxLDL. Molecular Medicine Reports . 2019;19(6):4973–4979. doi: 10.3892/mmr.2019.10161. [DOI] [PubMed] [Google Scholar]
- 47.Bringman-Rodenbarger L. R., Guo A. H., Lyssiotis C. A., Lombard D. B. Emerging roles for SIRT5 in metabolism and cancer. Antioxidants & Redox Signaling . 2018;28(8):677–690. doi: 10.1089/ars.2017.7264. [DOI] [PMC free article] [PubMed] [Google Scholar]
- 48.Sun X., Wang S., Gai J., et al. SIRT5 promotes cisplatin resistance in ovarian cancer by suppressing DNA damage in a ROS-dependent manner via regulation of the Nrf2/HO-1 pathway. Frontiers in Oncology . 2019;9:754–754. doi: 10.3389/fonc.2019.00754. [DOI] [PMC free article] [PubMed] [Google Scholar]
- 49.Tasselli L., Zheng W., Chua K. F. SIRT6: novel mechanisms and links to aging and disease. Trends in Endocrinology and Metabolism . 2017;28(3):168–185. doi: 10.1016/j.tem.2016.10.002. [DOI] [PMC free article] [PubMed] [Google Scholar]
- 50.Qu N., Hu J. Q., Liu L., et al. SIRT6 is upregulated and associated with cancer aggressiveness in papillary thyroid cancer via BRAF/ERK/Mcl1 pathway. International Journal of Oncology . 2017;50(5):1683–1692. doi: 10.3892/ijo.2017.3951. [DOI] [PubMed] [Google Scholar]
- 51.Zhang S., Chen P., Huang Z., et al. Sirt7 promotes gastric cancer growth and inhibits apoptosis by epigenetically inhibiting miR-34a. Scientific Report . 2015;5(1, article 9787):1-–19. doi: 10.1038/srep09787. [DOI] [PMC free article] [PubMed] [Google Scholar] [Retracted]
- 52.Ashraf N., Zino S., Macintyre A., et al. Altered sirtuin expression is associated with node-positive breast cancer. British Journal of Cancer . 2006;95(8):1056–1061. doi: 10.1038/sj.bjc.6603384. [DOI] [PMC free article] [PubMed] [Google Scholar]
- 53.Kim J. K., Noh J. H., Jung K. H., et al. Sirtuin7 oncogenic potential in human hepatocellular carcinoma and its regulation by the tumor suppressors MiR-125a-5p and MiR-125b. Hepatology . 2013;57(3):1055–1067. doi: 10.1002/hep.26101. [DOI] [PubMed] [Google Scholar]
- 54.Ford E., Voit R., Liszt G., Magin C., Grummt I., Guarente L. Mammalian Sir2 homolog SIRT7 is an activator of RNA polymerase I transcription. Genes & Development . 2006;20(9):1075–1080. doi: 10.1101/gad.1399706. [DOI] [PMC free article] [PubMed] [Google Scholar]
- 55.Zhao J., Wozniak A., Adams A., et al. SIRT7 regulates hepatocellular carcinoma response to therapy by altering the p53-dependent cell death pathway. Journal of Experimental & Clinical Cancer Research . 2019;38(1):p. 252. doi: 10.1186/s13046-019-1246-4. [DOI] [PMC free article] [PubMed] [Google Scholar]
- 56.Tong Z., Wang M., Wang Y., et al. SIRT7 is an RNA-activated protein lysine deacylase. ACS Chemical Biology . 2017;12(1):300–310. doi: 10.1021/acschembio.6b00954. [DOI] [PMC free article] [PubMed] [Google Scholar]
- 57.Shi H., Ji Y., Zhang D., Liu Y., Fang P. MicroRNA-3666-induced suppression of SIRT7 inhibits the growth of non-small cell lung cancer cells. Oncology Reports . 2016;36(5):3051–3057. doi: 10.3892/or.2016.5063. [DOI] [PubMed] [Google Scholar]
- 58.Wang F., Chan C. H., Chen K., Guan X., Lin H. K., Tong Q. Deacetylation of FOXO3 by SIRT1 or SIRT2 leads to Skp2-mediated FOXO3 ubiquitination and degradation. Oncogene . 2012;31(12):1546–1557. doi: 10.1038/onc.2011.347. [DOI] [PubMed] [Google Scholar]
- 59.Park S. H., Ozden O., Liu G., et al. SIRT2-mediated deacetylation and tetramerization of pyruvate kinase directs glycolysis and tumor growth. Cancer Research . 2016;76(13):3802–3812. doi: 10.1158/0008-5472.CAN-15-2498. [DOI] [PMC free article] [PubMed] [Google Scholar]
- 60.Xu L., Li Y., Zhou L., et al. SIRT3 elicited an anti-Warburg effect through HIF1α/PDK1/PDHA1 to inhibit cholangiocarcinoma tumorigenesis. Cancer Medicine . 2019;8(5):2380–2391. doi: 10.1002/cam4.2089. [DOI] [PMC free article] [PubMed] [Google Scholar]
- 61.Shi L., Yan H., An S., et al. SIRT5-mediated deacetylation of LDHB promotes autophagy and tumorigenesis in colorectal cancer. Molecular Oncology . 2019;13(2):358–375. doi: 10.1002/1878-0261.12408. [DOI] [PMC free article] [PubMed] [Google Scholar]
- 62.Wang J., Sheng Z., Cai Y. SIRT6 overexpression inhibits HIF1alpha expression and its impact on tumor angiogenesis in lung cancer. International Journal of Clinical and Experimental Pathology . 2018;11(6):2940–2947. [PMC free article] [PubMed] [Google Scholar]
- 63.Cai J., Zuo Y., Wang T., et al. A crucial role of SUMOylation in modulating Sirt6 deacetylation of H3 at lysine 56 and its tumor suppressive activity. Oncogene . 2016;35(37):4949–4956. doi: 10.1038/onc.2016.24. [DOI] [PubMed] [Google Scholar]
- 64.Qi H., Shi X., Yu M., et al. Sirtuin 7-mediated deacetylation of WD repeat domain 77 (WDR77) suppresses cancer cell growth by reducing WDR77/PRMT5 transmethylase complex activity. The Journal of Biological Chemistry . 2018;293(46):17769–17779. doi: 10.1074/jbc.RA118.003629. [DOI] [PMC free article] [PubMed] [Google Scholar]
- 65.Jung J., Kim L. J., Wang X., et al. Nicotinamide metabolism regulates glioblastoma stem cell maintenance. JCI Insight. 2017;2(10):p. 2. doi: 10.1172/jci.insight.90019. [DOI] [PMC free article] [PubMed] [Google Scholar]
- 66.Mierzejewska P., Gawlik-Jakubczak T., Jablonska P., et al. Nicotinamide metabolism alterations in bladder cancer: preliminary studies. Nucleosides, Nucleotides & Nucleic Acids . 2018;37(12):687–695. doi: 10.1080/15257770.2018.1535124. [DOI] [PubMed] [Google Scholar]
Associated Data
This section collects any data citations, data availability statements, or supplementary materials included in this article.
Data Availability Statement
The datasets used in the present study can be obtained in The Cancer Genome Atlas (https://portal.gdc.cancer.gov/).


