Abstract
Horizontal gene transfer (HGT) and mutation are the two major drivers of microbial evolution that enable bacteria to adapt to fluctuating environmental stressors1. Clustered, regularly interspaced, short palindromic repeats (CRISPR) systems use RNA-guided nucleases to direct sequence-specific destruction of the genomes of mobile genetic elements that mediate HGT, such as conjugative plasmids2 and bacteriophages3, limiting bacterial evolvability by this mechanism. A subset of CRISPR systems also display non-specific degradation of DNA4,5; however, whether and how this feature impacts the host has not been explored. Here we show that the non-specific DNase activity of the staphylococcal type III-A CRISPR-Cas system increases mutation of the host and accelerates the generation of antibiotic resistance in Staphylococcus aureus and Staphylococcus epidermidis. These mutations require the induction of the SOS response to DNA damage and display a distinct pattern. Our results demonstrate that by differentially affecting both mechanisms that generate genetic diversity, type III-A CRISPR systems can modulate the evolution of the bacterial host.
CRISPR loci and their associated genes (cas) provide immunity to bacteria and archaea through the acquisition of a short DNA sequence, known as spacer, from the genomes of conjugative plasmids and bacteriophages that infect the cell3. Spacers are then transcribed and processed into small CRISPR RNAs (crRNAs)6,7 that are used by crRNA-guided nucleases to recognize and destroy complementary targets (also known as protospacers) within the invading nucleic acids8,9. Depending on their cas gene content, CRISPR-Cas systems can be classified into six different types (I-VI)10. The most elaborate mechanism is observed during type III CRISPR-Cas immunity, which requires the transcription of the target sequence for effective defense11 (Extended Data Fig. 1a, b). These systems use the crRNA-guided Cas10 complex to identify complementary targets in the invader’s transcripts9, a recognition that triggers the activities of two domains within Cas10. The HD domain degrades ssDNA of any sequence5 and results in the destruction of the invader’s genome12. In addition, the Palm domain converts ATP into cyclic tetra- or hexa-adenylates (cyclic oligoadenylates, cOA), a second messenger that activates the Csm6/Csx1 non-specific RNase13,14. Finally, the Csm3/Cmr4 subunit of the Cas10 complex cleaves the target transcript9, turning off both enzymatic activities of Cas105,13,14. It is believed that this last step in the type III immune response limits the damage to the host that would otherwise be caused by the prolonged non-specific ssDNase and RNase activities of Cas10 and Csm6, respectively.
Whether and how non-specific degradation of ssDNA during the type III CRISPR-Cas immune response affects the infected cell is not known. In vitro, in some conditions the Cas10 complex can cleave the ssDNA at or near the transcription bubble that emerges during target transcription16; in other conditions, cleavage can also be detected within R-loops17 such as those formed during transcription elongation by RNA polymerase. While both types of cleavage within the invader’s genome will contribute to immunity, an attack on the host genome could produce chromosomal lesions that, if not correctly repaired, would result in the generation of mutations in the host cell. We explored the consequences of non-specific ssDNA degradation during the type III CRISPR-Cas immune response of the clinical isolate S. epidermidis RP62a (Extended Data Fig. 1a, b).
First, we tested whether immunity against plasmid conjugation can induce mutagenesis. To do this, we determined the frequency of rifampicin resistance of strain RP62a (recipient), or a ΔCRISPR control, after mating with S. aureus RN4220 cells (donor) harboring the pG0400 mupirocin-resistant plasmid (or a non-target pG0400 control, pG0(mut)) and plating bacteria onto BHI plates with or without selective levels of rifampicin. In most bacteria, including staphylococci18, resistance to this drug can be acquired by single base changes in the gene encoding the β-subunit of the RNA polymerase, rpoB, and has been used to infer the mutation frequencies and mutation rates of these organisms19. We calculated both the conjugation efficiency (Fig. 1a) and the mutation frequency, the ratio of rifampicin-resistant colonies to the total colony forming units (Fig. 1b). Due to so-called “jackpot” resistance mutations that are either pre-existing or arise early during the experiment and that are amplified during cell division, we analyzed the results using the Mann-Whitney test, which does not assume a normal distribution of the data20. When the type III-A CRISPR-Cas immune response was triggered against pG0400 conjugation, but not in the control experiments, the mutation frequency was significantly increased (Fig. 1b and Supplementary Data File 1, which contains the numeric values obtained for all the experiments in this study). Even after removing the outliers, there is still a significant difference (Extended Data Fig. 1c). We next wanted to determine if the type III-A response against phage infection also resulted in elevated mutation. We infected S. aureus TB4, a derivative of the clinical isolate Newman strain that lacks prophages, with the staphylococcal lytic phage ϕNM1γ611. This strain lacks CRISPR loci; therefore we introduced the S. epidermidis RP62a type III-A system, containing a spacer that targets the ϕNM1γ6 early-expressed gene gp1415 (gene product 14), on the pC194 plasmid (pCRISPR). We also cloned into pC194 the type II-A CRISPR locus of the clinical isolate S. aureus M06/171 and programmed it to target the early-expressed gene gp12 of ϕNM1γ6. Both plasmids provided effective defense against ϕNM1γ6 infection (Fig. 1c and Extended Data Fig. 2a). After infecting ~109 cells at a multiplicity of infection (MOI) of 10 and outgrowth for 16 hours (stationary phase), we measured rifampicin resistance. Infected cultures carrying the type III-A, but not the II-A, CRISPR-Cas system displayed a significant increase in mutation frequency, relative to uninfected cultures (Fig. 1d). A similar increase was obtained after only 2 hours of outgrowth (exponential growth, Extended Data Fig. 1d). Mirroring the conjugation experiments in S. epidermidis, some of the data points were outliers. In order to reduce the probability of the presence of pre-existing resistant mutants that could generate “jackpots”, we performed fluctuation tests21 in which we infected a very low number of cells (<1,000) at an MOI ~ 10,000. Similar to infection of a large number of cells, the mutation frequency was significantly higher after the activation of the type III-A, but not II-A, CRISPR-Cas immune response (Extended Data Fig. 1e). Due to the small initial inoculum, the infected cells will go through many rounds of replication before being plated to enumerate colonies; therefore, we also calculated the mutation rate as the frequency of rifampicin-resistant mutations per generation using the MutRateCalc software developed for this type of fluctuation test22. We observed a greater increase of the mutation rate in cells where ϕNM1γ6 infection triggered type III-A CRISPR-Cas immunity than in cells with an active type II-A CRISPR-Cas response (Extended Data Fig. 1f). Finally, type III-A immunity triggered by recognition of a late-expressed gene, gp43, after infection of <1,000 cells with ϕNM1γ6, also resulted in an increase in the frequency (Extended Data Fig. 1g) and rate (Extended Data Fig. 1h) of rifampicin resistance. Altogether these results demonstrate that the type III-A CRISPR-Cas immune response increases mutation levels.
Figure 1. Type III-A CRISPR-Cas immunity increases mutagenesis in staphylococci.
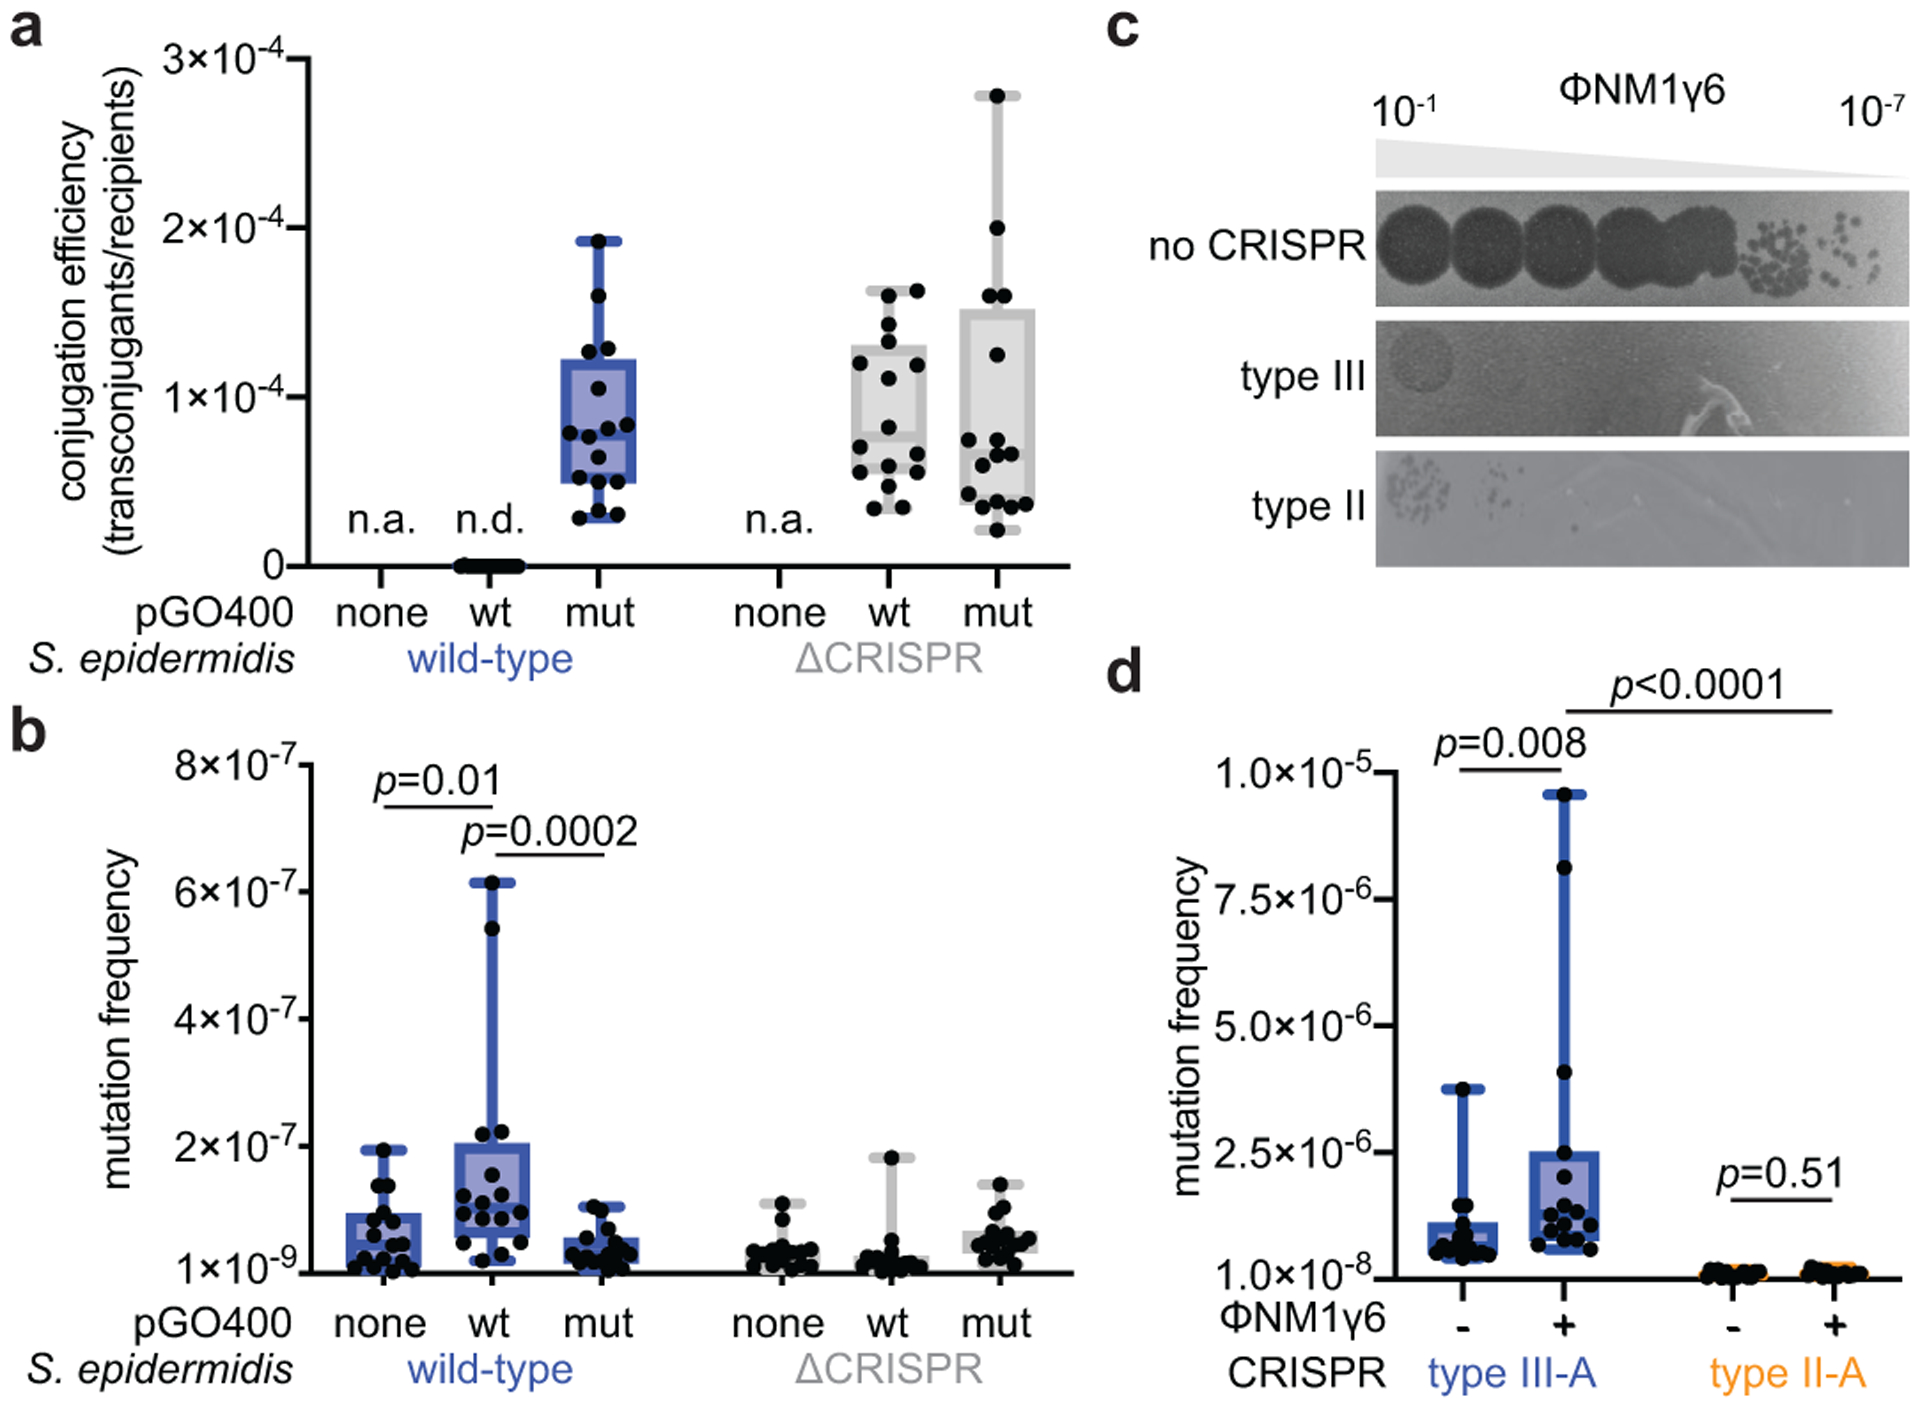
(a) Conjugation efficiency of wild-type or mutant pG0400 into S. epidermidis RP62a or ΔCRISPR. (b) Mating cultures were seeded on plates with or without rifampicin to calculate their mutation frequency. (c) Serial ten-fold dilutions of ϕNM1γ6 phage on plates seeded with staphylococci harboring type II-A or III-A CRISPR-Cas systems. (d) S. aureus cells (~109) that were treated with ϕNM1γ6 phage and survived infection through the targeting of an early-expressed gene (gp12 or gp14) by the staphylococcal type II-A or type III-A CRISPR-Cas systems were seeded on plates with or without rifampicin to calculate their mutation frequency. (a, b, d) Box limits, interquartile range; whiskers, minimum to maximum; centre line, median; dots, individual data points; n=16,16,15, respectively, biologically independent experiments; p-values obtained with two-sided Mann-Whitney test.
To determine whether the ssDNase activity of Cas10 is responsible for this elevated mutagenesis, we studied staphylococci engineered to have loss-of-function or gain-of-function mutations in its ability to degrade DNA. First, we measured rifampicin resistance 16 hours after infection with ϕNM1γ6 of hosts (~109 cells) carrying pCRISPR plasmids programmed to target the early-expressed gp14 gene and harboring the dcsm3/dcsm6 mutations (Extended Data Fig. 1b). In this double mutant, the elimination of Csm3 function leads to the constitutive activation of Cas10’s HD domain, which supports immunity (Extended Data Fig. 2a), and the lack of Csm6 activity prevents the growth arrest of the culture and therefore increases the number of viable cells that can form colonies12. The net result is the amplification of the ssDNase activity during type III-A immunity against ϕNM1γ6. Compared to wild-type staphylococci, cells with this genetic background displayed a statistically significant boost in the mutation frequency (Fig. 2a). We also infected <1,000 cells to reduce the number of pre-existing rifampicin resistant mutants and calculated both the mutation frequency (Extended Data Fig. 2b) and rates (Extended Data Fig. 2c). In this condition, however, the double mutant did not survive infection, potentially due to the genotoxicity of an overactive Cas10 nuclease activity and/or a requirement for Csm6-mediated immunity in these conditions. Next, we analyzed mutagenesis in cells expressing a nuclease-deficient Cas10 (dcas10, Extended Data Fig. 1b), in which anti-phage immunity is provided by Csm6 (Extended Data Fig. 2a) and found that resistance to rifampicin did not increase in the presence of phage infection (Fig. 2a). Similarly, the dcas10 mutation significantly decreased the mutation frequency and rate in experiments where <1,000 cells were infected (Extended Data Fig. 2b,c). Finally, the dcas10 mutation also eliminated the increase in the mutation frequency observed when the late-expressed gene gp43 is targeted after infection of ~109 cells with ϕNM1γ6 (Extended Data Fig. 2d).
Figure 2. Mutagenesis requires induction of Cas10 ssDNase activity and the SOS response.
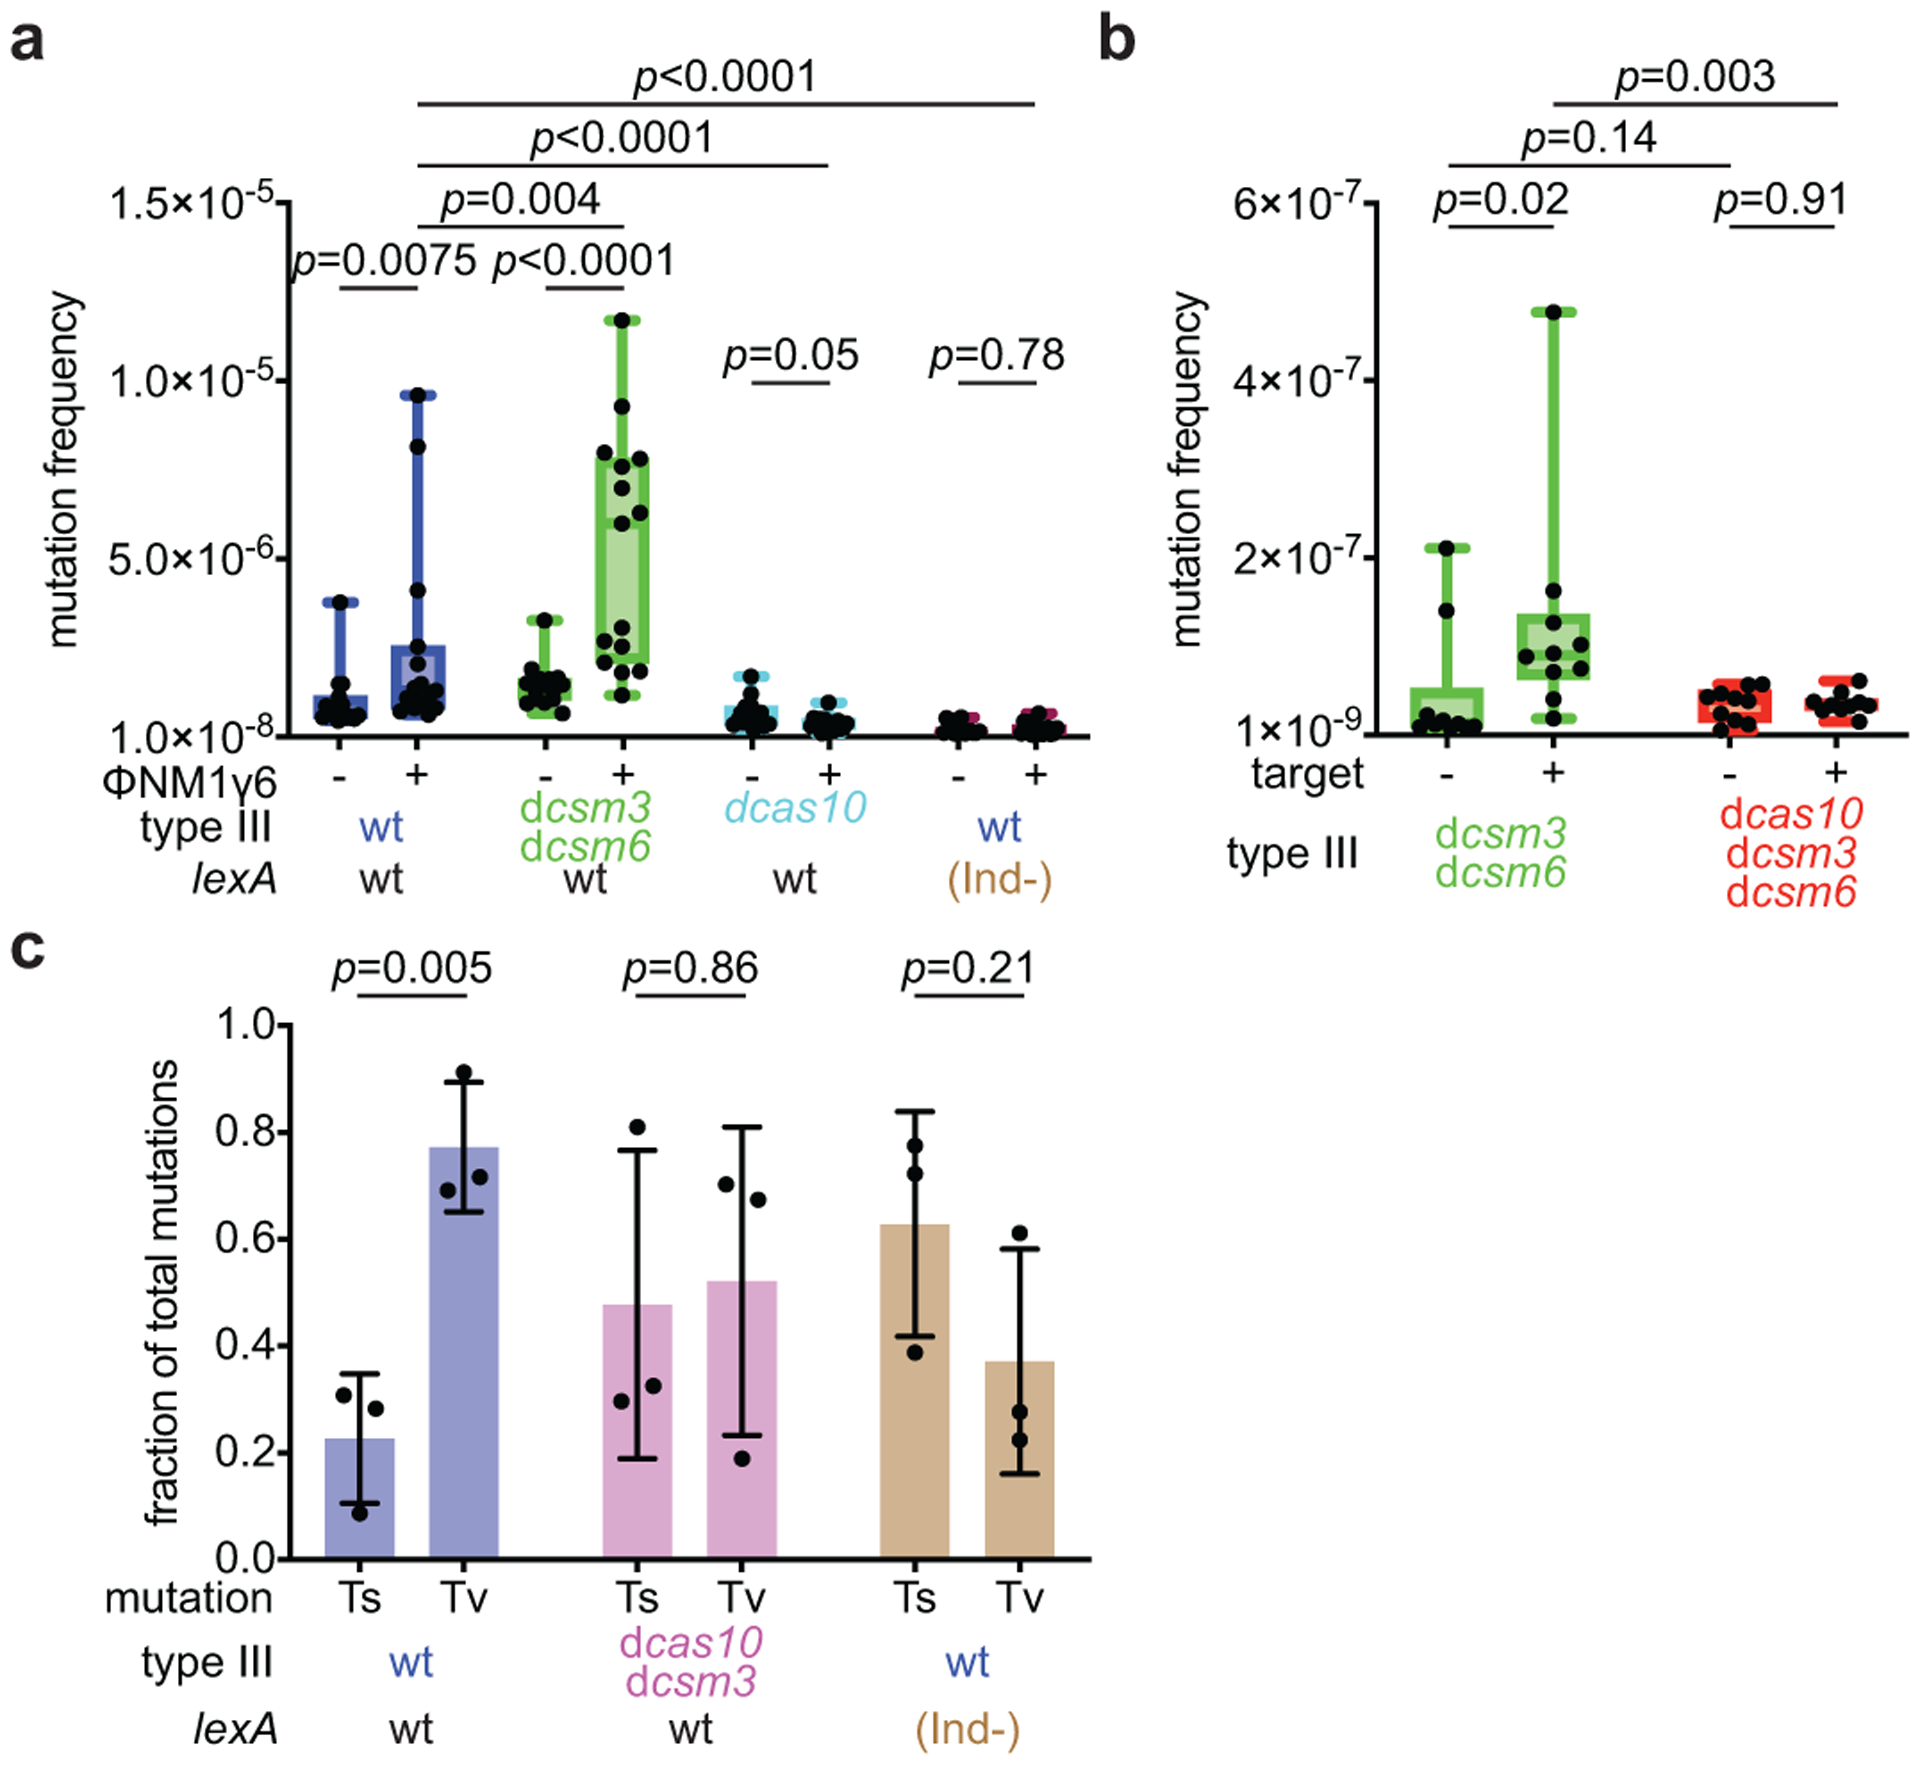
(a) S. aureus cells (~109) that were treated with ϕNM1γ6 phage and survived infection through the targeting of an early-expressed gene (gp14) by different mutant versions of the type III-A CRISPR-Cas system, in the presence of an active (wild-type, wt) or inactive (lexA(Ind-)) SOS response, were seeded on plates with or without rifampicin to calculate their mutation frequency. (b) S. aureus cells (<1,000) carrying a plasmid with or without an inducible target for the type III-A CRISPR-Cas system were treated with aTc for 48 hours and then seeded on plates with or without rifampicin to calculate their mutation frequency. (a, b) Box limits, interquartile range; whiskers, minimum to maximum; centre line, median; dots, individual data points; n=15,10, respectively, biologically independent experiments; p-values obtained with two-sided Mann-Whitney test. (c) Quantification of transversion and transition mutations in the rpoB gene of rifampicin-resistant staphylococci obtained in (a). Mean ±s.e.m.; n=3 biologically independent experiments; p-values obtained with two-sided t-test.
A potential caveat in the interpretation of this experiment is the exacerbated growth arrest produced by Csm6 in the dcas10 mutant, which is absent in staphylococci carrying the dcsm3/dcsm6 variants. This will increase cell division in dcsm3/dcsm6 hosts, which could lead to the generation of more rifampicin resistance mutations. Therefore, we decided to test the triple mutant dcas10/dcsm3/dcsm6. In this mutant, however, both Cas10- and Csm6-mediated immune response is abrogated, and staphylococci succumb to ϕNM1γ6 infection (data not shown), preventing the recovery of rifampicin-resistant colonies. Instead, we triggered type III-A immunity using a plasmid, pTarget, that harbors a protospacer sequence under the control of an anhydrotetracycline (aTc)-inducible promoter12. S. aureus RN4220 cells carrying the different mutant versions of pCRISPR were transformed with pTarget or pControl (the same plasmid without a target sequence) and cultures of less than 1,000 staphylococci were supplemented with aTc to produce the target or control transcripts. As is the case for phage infection, pTarget is destroyed by the dcsm3/dcsm6 but not by the dcas10/dcsm3/dcsm6 mutant CRISPR system (Extended Data Fig. 3a). However, in the absence of antibiotic selection for the plasmid, both hosts survive after the induction of the type III-A immune response, allowing for the counting of rifampicin-resistant colonies after 48 hours of targeting. The dcsm3/dcsm6 mutation significantly increased the median mutation frequency (Fig. 2b) by approximately 7-fold and the mutation rate by approximately 3-fold (Extended Data Fig. 3b) in the presence of type III-A targeting. On the other hand, the introduction of the dcas10 mutation led to a decrease to control levels. Altogether, these results demonstrate that the ssDNase activity of the HD domain present in the Cas10 enzyme is necessary and sufficient for the generation of host chromosomal mutations.
Interestingly, when we carried out experiments with <1,000 cells (Extended Data Figs. 1e,f and 2b,c), we detected an increase in the mutation rates of cultures carrying a wild-type type III-A CRISPR-cas locus, even in the absence of phage activation. The presence of the dcas10 caused a minimal, if any, decrease of the mutation frequency (Extended Data Fig. 2b) and rate (Extended Data Fig. 2c), while the dcsm3/dcsm6 variant with exacerbated Cas10 nuclease activity significantly augmented the mutation rate in the absence of infection (Extended Data Figs. 2b,c). We further explored this in S. epidermidis and found that the mutation rate of the wild-type strain RP62a is higher than the isogenic ΔCRISPR mutant (Extended Data Fig. 3c). These results suggest that the sole presence of a type III-A CRISPR-cas locus is mildly mutagenic for the host.
A major mutagenic pathway in bacteria is the SOS response, which, upon the presence of DNA damage, leads to self-proteolysis of the LexA repressor and the de-repression of the SOS response genes controlled by this transcription factor, which include the error-prone polymerases that participate in the repair of genomic damage23,24. To test whether the induction of mutations during type III-A immunity requires the activation of the SOS response, we infected S. aureus JAV6 cultures, carrying a K168A mutation that generates an uncleavable repressor known as LexA(Ind-)25, with ϕNM1γ6 (Extended Data Fig. 4). Infection of this mutant with ϕNM1γ6 (~109 cells, Fig. 2a; <1,000 cells, Extended Data Figs. 2b,c) abolished the increase in rifampicin resistance mutation. A hallmark of SOS-mediated mutagenesis is the preference for transversion over transition mutations26. To investigate if this is the case for the Cas10-induced mutations, we PCR-amplified the rpoB gene and subjected the amplicons to next-generation sequencing. We found a significant preference for transversions in the presence of wild-type cas10, which was eliminated in staphylococci carrying the dcas10/dcsm3 or the lexA(Ind-) alleles (Fig. 2c). In the dcas10 or the lexA(Ind-) genetic backgrounds, one of the most abundant mutations was a C>T transition that generates the His481/Tyr resistance mutation, commonly found in rifampicin-resistant staphylococci18. However, in experiments with wild-type Cas10, the most prevalent mutation was an A>T transversion, which generated the much rarer His481/Leu resistance mutation18 (Extended Data Fig. 5 and Supplementary Data File 2). Collectively, these data indicate that the SOS response is required to generate mutations in staphylococci where the type III-A CRISPR-Cas immune response is activated.
Next, we investigated if the mutagenesis induced by type III-A CRISPR-Cas immunity can result in adaptation to different types of selective pressures. We examined resistance frequencies to three distinct classes of antibiotics: gentamicin, (Fig. 3a); vancomycin, (Fig. 3b) and levofloxacin (Fig. 3c). We found that relative to non-treated cultures, S. aureus that survived ϕNM1γ6 infection (~109 cells infected at MOI 10) through the activation of the Cas10 complex increased the resistance frequency to all three agents. Importantly, resistant colonies displayed a substantial increase in the minimal inhibitory concentration (MIC) for all three antibiotics (Extended Data Table 1). For gentamicin, the mutation frequency (Extended Data Fig. 6a) and mutation rate (Extended Data Fig. 6b) after infection of a low number of staphylococci (<1,000 at MOI 10,000) showed a comparable increase to that obtained under rifampicin selection. We also tested if the induction of type III-A immunity by ϕNM1γ6 could increase resistance to the unrelated and non-targeted staphylococcal phage ϕStaph1N27 (Extended Data Fig. 7a). After calculation of the fraction of resistant colonies that emerge in top agar, we found an approximately 2-fold increase compared to uninfected cells, from 8.8×10⁻⁷ to 19.0×10⁻⁷, (p=0.008, Fig. 3e), which was not a consequence of the acquisition of new spacers against this phage (Extended Data Fig. 7b). In line with our previous results, this surge in resistance was amplified in the presence of the dcsm3/dcsm6 alleles and absent in the dcas10 mutant, cells that relied on type II-A immunity to survive ϕNM1γ6 infection, or that were unable to trigger the SOS response (Fig. 3e). Altogether, these results show that type III-A-induced mutagenesis allows adaptation of staphylococci to diverse selective environments.
Figure 3. Mutagenesis increases resistance to different classes of antibiotics and phages.
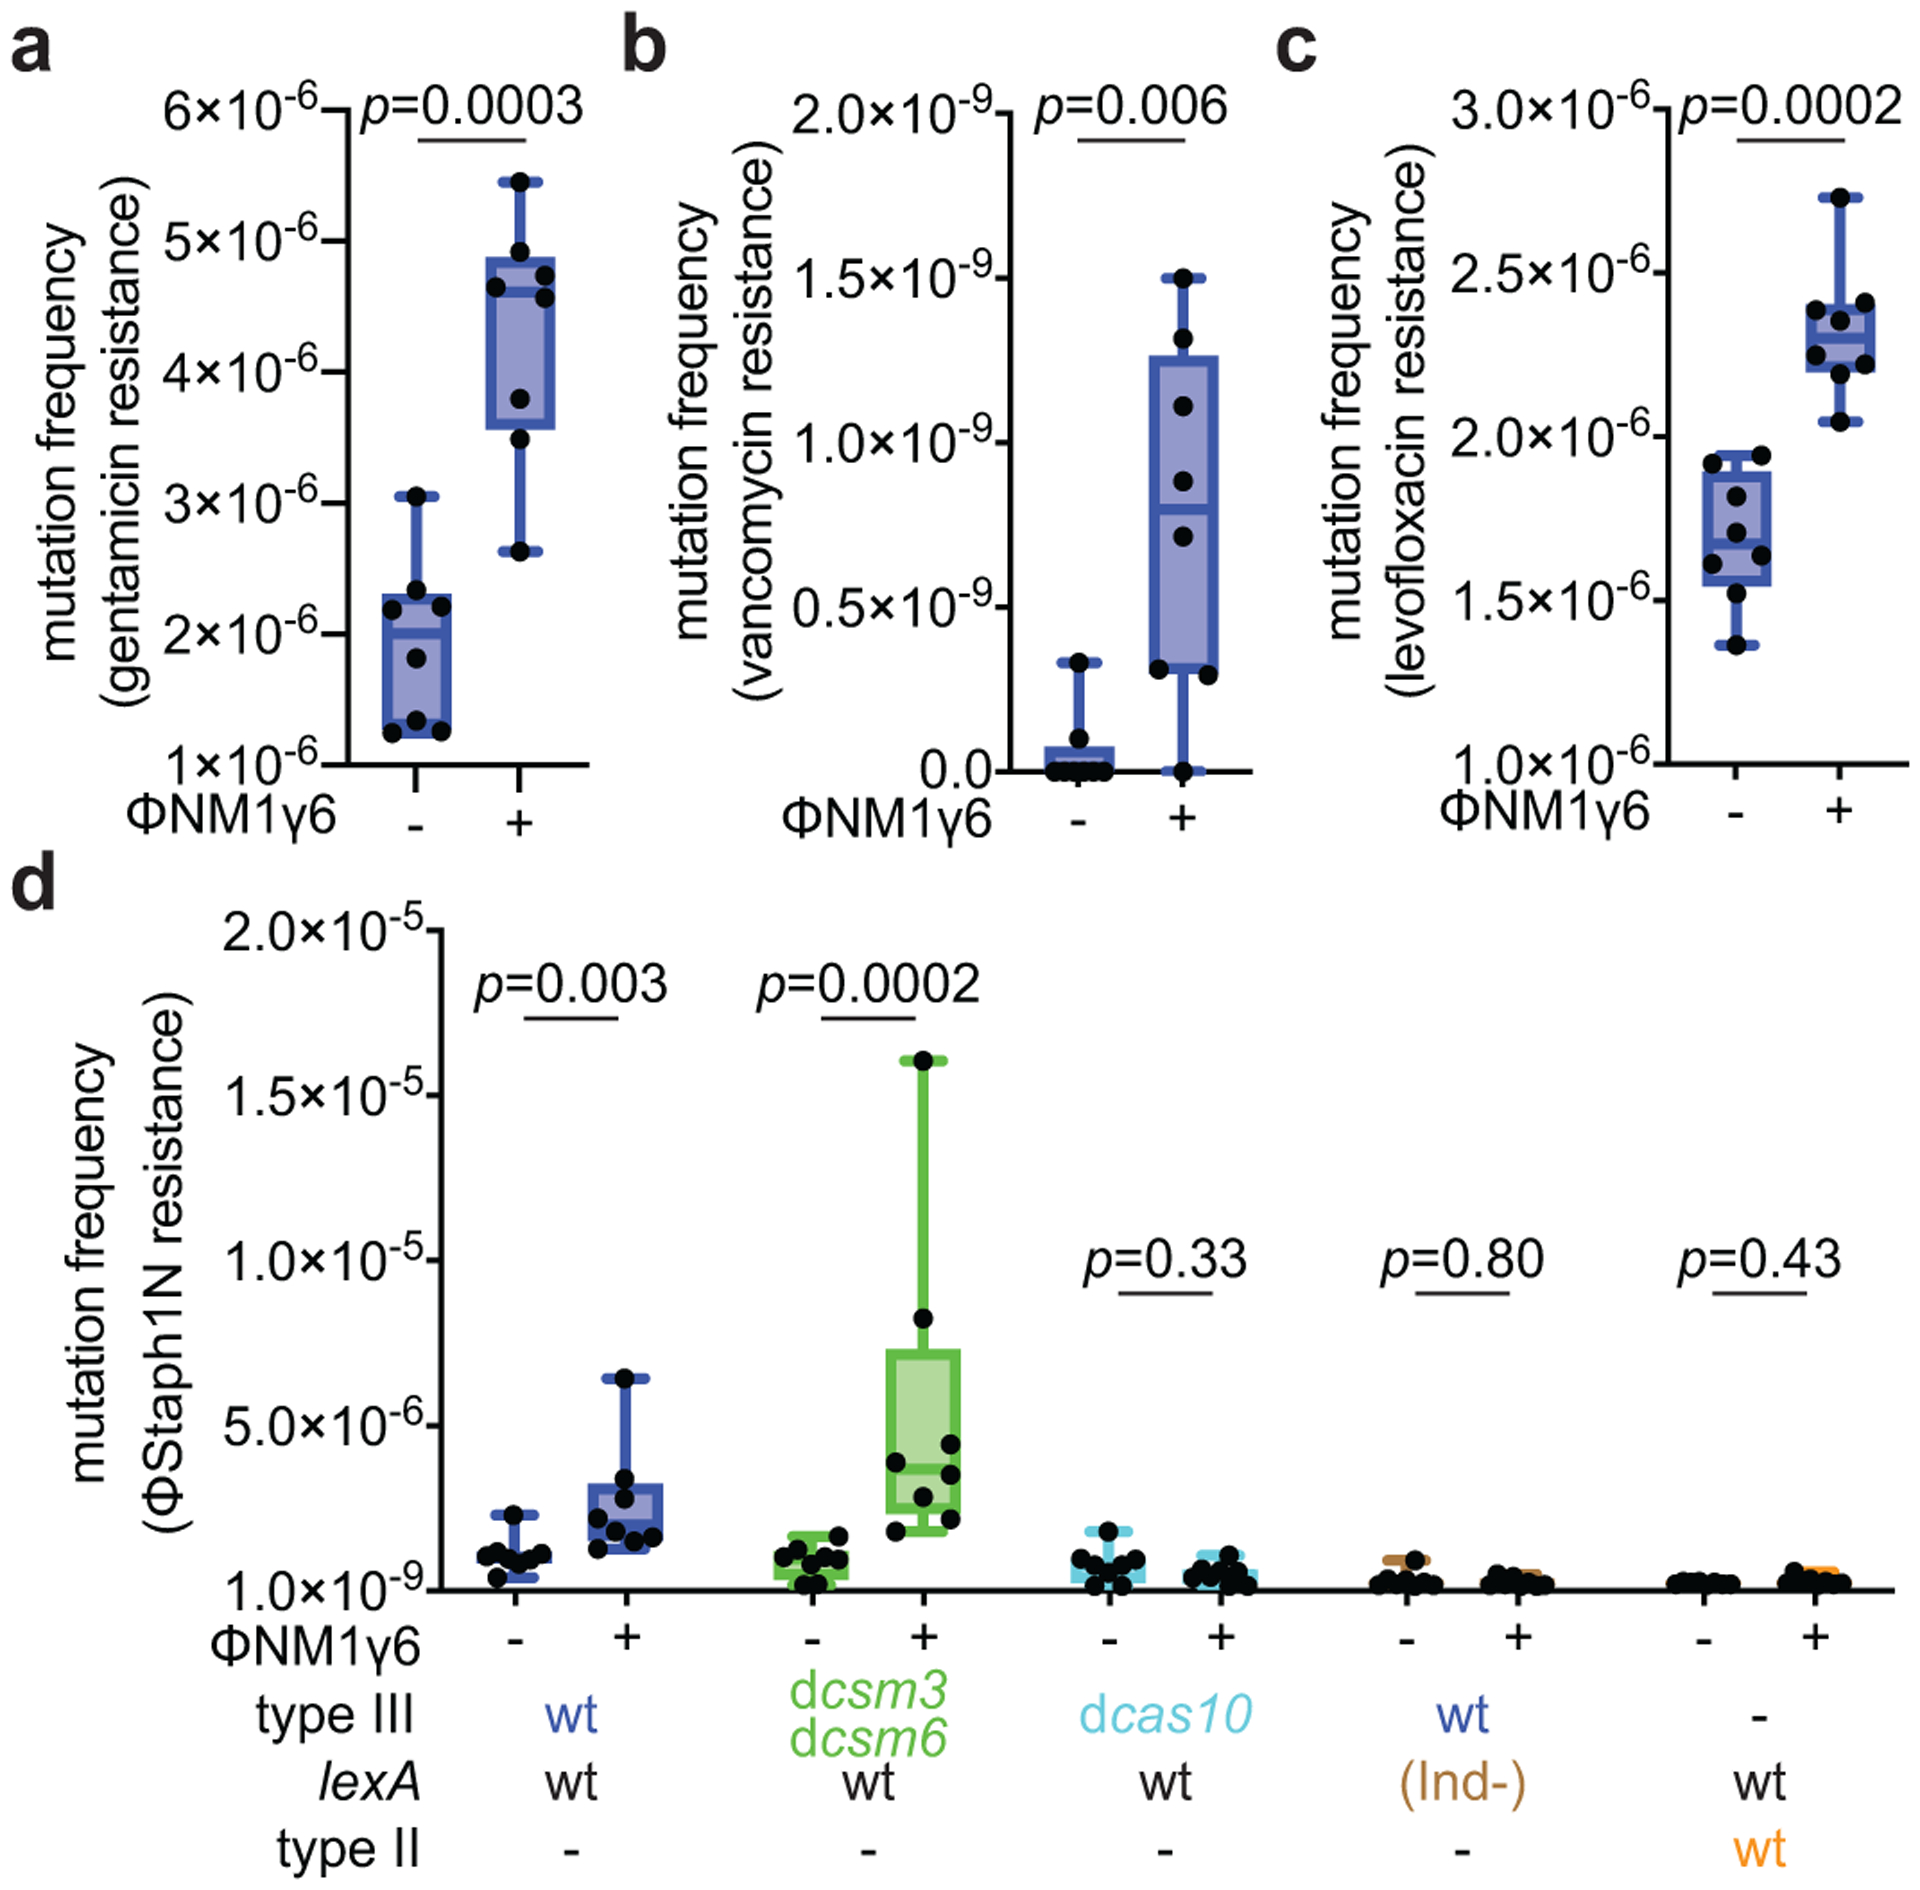
(a) S. aureus cells (~109) that were treated with ϕNM1γ6 phage and survived infection through the targeting of an early-expressed gene (gp14) by the type III-A CRISPR-Cas system, were seeded on plates with or without gentamicin to calculate their mutation frequency. (b) Same as (a) but seeding on plates with vancomycin. (c) Same as (a) but seeding on plates with levofloxacin. (d) Same as (a) but mixing surviving staphylococci with top agar with or without ϕStaph1N phage to calculate their resistance frequency. (a-d) Box limits, interquartile range; whiskers, minimum to maximum; centre line, median; dots, individual data points; n=8 biologically independent experiments; p-values obtained with two-sided Mann-Whitney test.
Finally, we investigated the effects of type III-A-mediated mutagenesis over time. We grew, diluted and infected cultures with ϕNM1γ6 (MOI=1) every day for 24 days (~160 generations), plating cells every six days on rifampicin-containing plates to determine the mutation frequency over time. We tested both wild-type and dcas10/dcsm3 cultures (5 replicates for each), which displayed similar total colony-forming unit (CFU) counts over the course of the experiment (Extended Data Fig. 8a). Although the mutation frequency values showed fluctuation, there was a consistent increase in the presence of Cas10, but not with the nuclease-defective mutant (Fig. 4a). To measure all mutations accumulated over time, we extracted DNA from the cultures collected after 18 passages and subjected it to DNA sequencing to estimate the number of mutations per base pair sequenced, which, consistent with the increase in the frequency of rifampicin resistance, approximately doubled the frequency observed in the presence of dCas10 (Fig. 4b). Mutations were not clustered but spread along the staphylococcal genome (Extended Data Fig. 8b–c). Both results show that low level of phage exposure and activation of the Cas10 nuclease over time can lead to the accumulation of mutations.
Figure 4. Induction of mutagenesis by the type III-A CRISPR-Cas system over longer time frames.
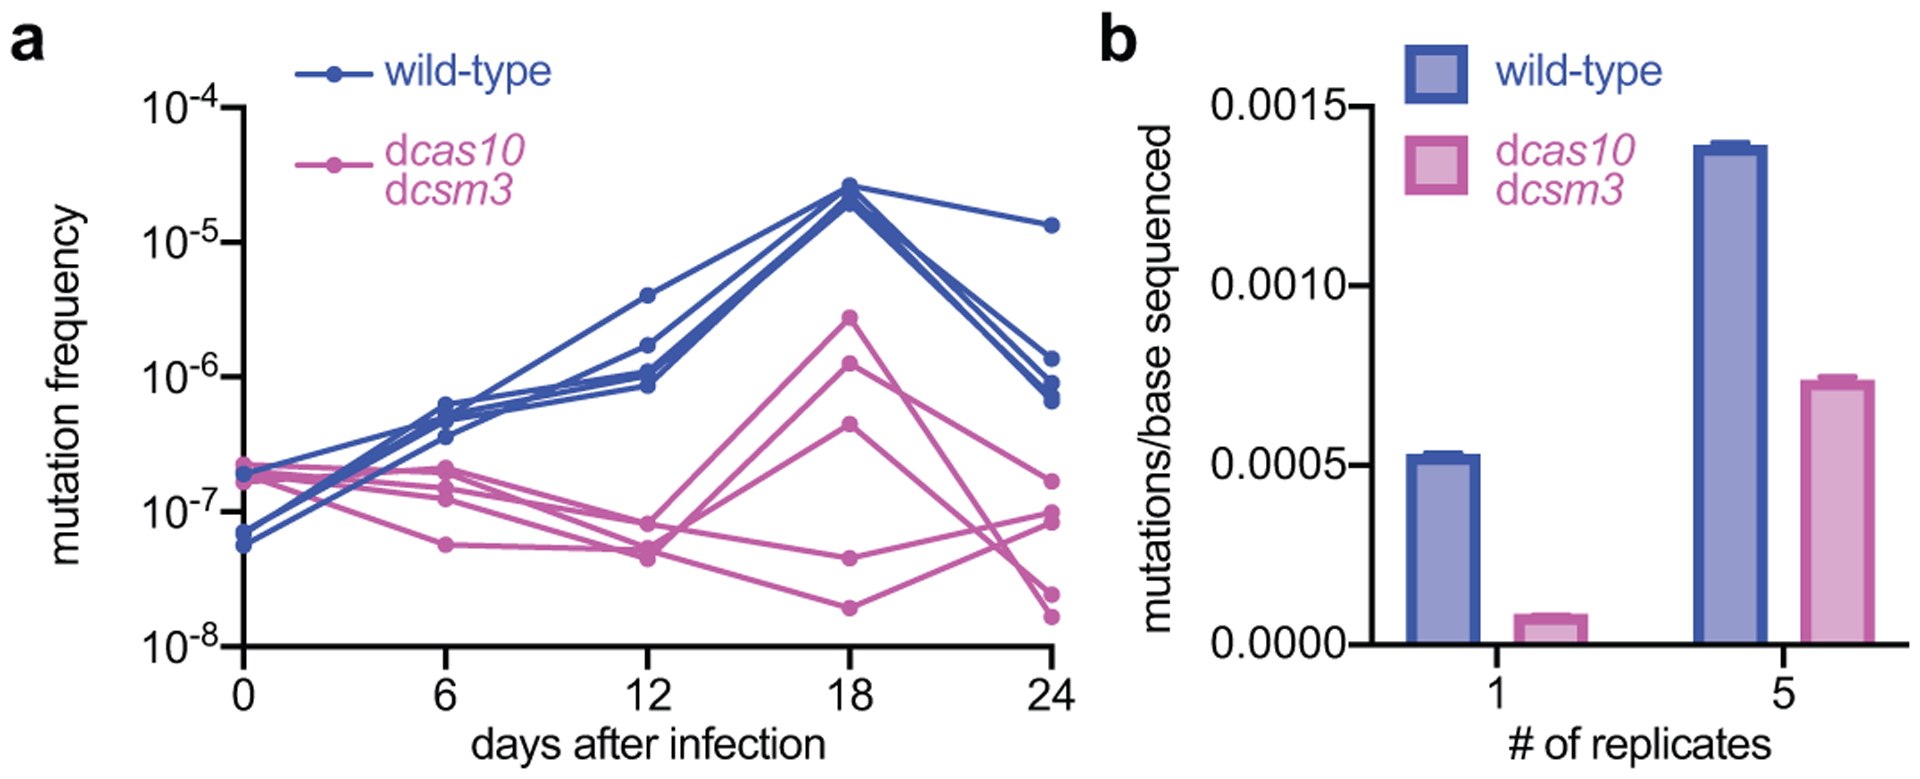
(a) Staphylococci harboring either wild-type or dcas10/dcsm3 type III-A CRISPR-Cas systems programmed to target the early-expressed gene gp14 in ϕNM1γ6 phage were exposed daily to the phage (MOI 1) over 24 days and the rifampicin mutation frequency was calculated every six days. Five independent cultures of each strain were passaged. (b) Genomic DNA extracted from the cultures obtained after the 18th passage were analyzed with next-generation sequencing to determine the mutations per base. “1” shows the results for a single replicate culture; “5” for the pool of the five replicates. The bar graphs represent the mean number of mutations per bases sequenced and the error bars represent 95% confidence intervals.
Based on these results, we propose that the non-specific ssDNase activity of Cas10 introduces chromosomal lesions that induce the SOS response (Extended Data Fig. 9). While we have not determined what type of ssDNA is degraded by this activity, the possibilities include unwound DNA and R-loops generated during transcription. Such degradation could expose the intact DNA strand for RecA binding, or could lead to the introduction of double-strand breaks that would also generate substrates for RecA binding after resection28. In either case, the formation of RecA filaments would activate the SOS response and the expression of low-fidelity DNA polymerases, which, when used in the final steps of DNA repair, can increase the rate of mutation, including those that result in antibiotic resistance24,29. We also showed that the sole presence of type III-A CRISPR-Cas loci results in a minor but detectable increase in the mutation rates, which could be due to low levels of targeting mediated by spacers that bear some homology with host transcripts30. It is interesting to speculate that this spurious activity could create pre-existing mutants that are selected to generate the “outlier” data points we often detected. It is also important to note that many of our experiments were performed using a type III-A CRISPR-Cas locus cloned in a multi-copy plasmid. All staphylococcal type III-A systems are very similar at the nucleotide level31, and therefore we do not believe this experimental setup will change our results qualitatively. However, over-expression could exacerbate the magnitude of the reported mutation rates.
Many Staphylococcus species harbor type III-A CRISPR-Cas systems31 whose main function is to protect from parasitic elements. However, due to the dependence of staphylococci on plasmids and phages for the horizontal transfer of antibiotic resistance genes and virulence factors32, respectively, type III-A immunity can also limit the evolution of these organisms. Our results suggest that these systems could potentially offset this limitation by promoting adaptation and antimicrobial resistance through non-specific mutagenesis (Extended Data Fig. 9). While we detected only 2–3 fold increases in the mutation rate, it is well established that weak or intermediate mutator phenotypes can substantially contribute to the development of antibiotic-resistant bacteria, including staphylococci33,34. Our data also suggest that the long-term effects of this mutator mechanism can have substantial impact on the evolution of staphylococci, potentially beyond the generation of antibiotic resistance.
Interestingly, we found that the mutagenesis induced by type III-A systems is also capable of generating additional phage resistance. This activity can function in parallel with spacer acquisition, which is the main mechanism by which CRISPR confers phage resistance3. Since the frequency of spacer integration into type III CRISPR loci is low compared to other CRISPR types35, it is intriguing to speculate that, while the main role of Cas10’s nuclease activity is the cleavage of the invader’s genome to accelerate its clearance from the infected cell, low levels of collateral non-specific ssDNA degradation on the host chromosome is a secondary feature evolved to provide additional resistance. Recently, non-specific ssDNA cleavage has been observed for other CRISPR systems, notably the crRNA-guided nucleases Cas124 and Cas1436 from type V loci, raising the possibility that these systems have also evolved this activity to elevate the mutation rate of the host and facilitate adaptation to changing environments and new phage threats.
Methods
Bacterial strains and growth conditions
S. epidermidis (RP62a37 and LAM1042) and S. aureus (TB438 and RN422039) strains were cultured in BHI media. When required, the medium was supplemented with the following antibiotics: chloramphenicol (10 μg/ml) for the selection of pC19440-based plasmids; tetracycline (5 μg/ml) for the selection of pT18141-based plasmids; erythromycin (10 μg/ml) for the selection of pE19442-based plasmids; and mupirocin (5 μg/ml) for the selection the pG040043 and pG0(mut)2 plasmid. The same strains were plated onto BHI agar plates. The following antibiotics were added to the agar, when appropriate: chloramphenicol (10 μg/ml) for the selection of pC194-based plasmids; erythromycin (10 μg/ml) for the selection of pE194-based plasmids; 0.064 μg/mL of rifampicin to select for rifampicin-resistant mutants; 1 μg/mL of fusidic acid to select for fusidic acid-resistant mutants; 8 μg/mL of vancomycin to select for vancomycin-resistant mutants; and 0.5 μg/mL of levofloxacin to select for levofloxacin-resistant mutants. Complete information of all the bacterial strains used in this study is provided in Supplementary Table S1.
Calculation of the rifampicin resistance mutation frequency after plasmid conjugation
Conjugation was carried out by filter mating as described before2. Overnight donor and recipient cultures growing in BHI medium at 37 °C with the necessary antibiotics were diluted 1:100 and incubated until they reached an optical density (OD600) value of approximately 1. 500 μl of donor and recipient were mixed together and centrifuged to pellet the cells. The supernatant was removed and the pellet was washed twice with 100 μL of fresh BHI broth. Following the washes, the pellet was resuspended in 100 μl of BHI broth and pipetted onto the center of the 0.45 μm membrane filter. Filters were incubated on BHI agar plates at 37 °C for 16 hours and bacteria resuspended in 3 ml of BHI. Serial dilutions were then plated onto BHI agar containing the neomycin (15 μg/ml) and erythromycin (10 μg/mL) for selection of S. epidermidis RP62a and LAM104. The remaining resuspended cells were centrifuged, washed with fresh BHI media, and resuspended in 200 μL of BHI. The cells were then plated onto BHI agar containing the rifampicin (0.064 μg/mL), neomycin (15 μg/ml) and erythromycin (10 μg/mL) to select for resistant S. epidermidis RP62a and LAM104 colonies. Plain BHI plates were incubated 24 hours at 37°C and rifampicin plates were incubated 48 hours at 37°C. The mutation frequency was calculated by dividing the number of rifampicin-resistant colonies by the total number of S. epidermidis cells on the neomycin/erythromycin BHI plates. The two-sided Mann-Whitney rank sum test in the Prism software was used to determine statistical significance.
Calculation of the rifampicin resistance mutation frequency after phage infection
Overnight cultures of S. aureus transformed with various pCRISPR plasmids were diluted 1:100 into BHI media supplemented with chloramphenicol and 5 mM CaCl2. Cultures were then grown at 37 °C until reaching an optical density (OD600) of ~0.3. Cultures were then infected with ϕNM1γ6 phage at a multiplicity of infection (MOI) of 10; control cultures did not receive any phage treatment. Following 16 hours (or 2 hours) of growth, cells were plated onto BHI plates with chloramphenicol in order to calculate the total CFUs. A fraction of each culture was plated onto BHI plates with the desired antibiotic in order to determine the total number of resistant cells. With the exception of the dcsm3/dcsm6 strain, which reached ~106 CFU/μl due to a slightly negative impact of the mutations in the type III-A immune response, the total number of colonies for all the other strains was ~107 CFU/μl. Plain BHI plates were incubated 24 hours at 37°C and antibiotic plates were incubated 48 hours at 37°C. The mutation frequency was calculated by dividing the number of resistant colonies by the total number of S. aureus cells on the non-selective BHI plates. The two-sided Mann-Whitney rank sum test in the Prism software was used to determine statistical significance.
Calculation of the ϕStaph1N phage resistance mutation frequency
S. aureus TB4 strains carrying different pCRISPR plasmids were grown in overnight cultures and diluted 1:100 fold into BHI media supplemented with chloramphenicol and 5 mM CaCl2. Cultures were then grown at 37 °C until reaching an optical density (OD600) of ~0.3. Each culture was then split into pairs: one member of the pair was infected with ϕNM1γ6 at MOI 10, while the other member did not receive any phage treatment. Following 16 hours of growth, cells were plated onto BHI plates with chloramphenicol in order to calculate the total CFUs. 100 μL of culture was mixed with 5 mL BHI liquid top agar, 5 mM CaCl2, and ϕStaph1N at an MOI of approximately 2. The combined top agar mixture was then poured onto BHI plates with chloramphenicol and incubated at 37 °C for 24–48 hours. Plain BHI plates were incubated at 37 °C for 24 hours. The mutation frequency towards ϕStaph1N was calculated by dividing the number of resistant colonies by the total number of S. aureus cells on the non-selective BHI plates. The two-sided Mann-Whitney rank sum test in the Prism software was used to determine statistical significance between different samples.
Calculation of the rifampicin resistance mutation frequency after target transcription
S. aureus RN4220 cells were transformed with a plasmid carrying an inducible target sequence (pJTR162) or a non-matching sequence (pWJ153) via standard electroporation protocols for staphylococci. Following plasmid selection with erythromycin, transformed cells were then transformed again with a pCRISPR plasmid carrying either the dcsm3/dcsm6 double mutation (pWJ242) or the dcas10/dcsm3/dcsm6 triple mutation (pJTR127) in the type III-A CRISPR-Cas system; both variants possess a spacer matching the target sequence in pJTR162 (gp43). Overnight cultures of the double-transformed strains were diluted 1:106 into fresh BHI media with chloramphenicol and 0.125 μg/mL of anhydrotetracycline (aTc); no erythromycin was added. These media conditions select for the pCRISPR plasmid, induce transcription of the target or non-matching sequence, and does not select for the target plasmid. Following 48 hours of growth at 37 °C, cells were plated onto BHI plates with chloramphenicol (10 μg/mL) in order to calculate the total CFU, and plated onto BHI plates with rifampicin (0.064 μg/mL) to determine the number of mutants. Non-selective BHI plates were incubated 24 hours at 37°C and rifampicin plates were incubated 48 hours at 37°C. The mutation frequency was calculated by dividing the number of resistant colonies by the total number of S. aureus cells on the non-selective BHI plates. A two-sided Mann-Whitney rank sum test in the Prism software was used to determine statistical significance.
Mutation rate estimation
Fluctuation analysis was performed using an adapted version of established protocols22. Overnight cultures of S. epidermidis and S. aureus strains were diluted into fresh BHI media supplemented with the appropriate antibiotics to a starting cell count of ~1,000 cells (106-fold dilution). For the S. epidermidis strains, cultures were grown to saturation at 37 °C for 48 hours, before being plated onto BHI agar and BHI agar with 0.064 μg/mL of rifampicin. Non-selective plates were incubated for 16 hours at 37 °C, while the rifampicin BHI plates were incubated for 48 hours. The total CFUs and number of rifampicin resistant colonies were counted and the numbers of total cells and resistant colonies were then entered into the MutRateCalc software to perform maximum likelihood analysis, which yields the mutation rate and associated confidence intervals22.
To test the effect of phage-induced CRISPR immunity on bacterial mutation rates, S. aureus strains carrying various CRISPR systems were diluted to a starting cell count of ~1,000 cells in BHI media with 10 μg/mL of chloramphenicol and either treated or not treated with ϕNM1γ6 at MOI ~10,000. The strains with the dcsm3/dcsm6 variant and the empty vector control did not recover when treated with phage at an MOI of ~10,000, and therefore for these two cultures only non-infected cultures were analyzed. Cultures were then grown at 37 °C for 48 hours until saturation before being plated onto BHI plates supplemented with 10 μg/mL of chloramphenicol and BHI agar plates supplemented with 0.064 μg/mL of rifampicin. The chloramphenicol plates were incubated for 16 hours at 37 °C, while the rifampicin BHI plates were incubated for 48 hours. The total CFUs and number of rifampicin resistant colonies were counted. The mutation rate was estimated using the same MutRateCalc software as described above.
For CRISPR immunity against inducible target plasmids, S. aureus strains carrying various CRISPR systems were diluted to a starting cell count of ~1,000 cells in BHI media with 10 μg/mL of chloramphenicol and treated with 0.125 μg/mL of anhydrotetracycline in order to induce transcription of the target sequence. Cultures were then grown at 37 °C for 48 hours until saturation before being plated onto BHI plates supplemented with 10 μg/mL of chloramphenicol and BHI agar plates supplemented with 0.064 μg/mL of rifampicin. The chloramphenicol plates were incubated for 16 hours at 37 °C, while the rifampicin BHI plates were incubated for 48 hours. The total CFUs and number of rifampicin resistant colonies were counted. The mutation rate was estimated using the same MutRateCalc software as described above.
Phage plaquing assays
S. aureus TB4 strains carrying the pCRISPR plasmids were cultured overnight in BHI media with chloramphenicol. 100 μL of the overnight cultures were mixed with 5 mL of liquid BHI top agar supplemented with 5 mM of CaCl2. Top agar mixtures were then poured onto BHI agar plates with chloramphenicol and allowed to solidify. ϕNM1γ6 and ϕStaph1N were subjected to serial 10-fold dilutions and then spotted onto the top agar lawns. Plates were incubated at 37 °C for 16 hours before being imaged. The raw plate images are shown in Supplementary Figure 1a, b, and d.
PCR analysis of the type III-A CRISPR-Cas spacer array.
Individual S. aureus colonies were picked from the top agar plates and resuspended in cell lysis buffer (250 mM, KCL, 5 mM MgCl2, 50 mM Tris-HCL (pH 9.0), 0.5% Triton X-100) supplemented with 0.1 mg/mL of lysostaphin. Resuspended cells were incubated at 37 °C for 20 minutes and boiled at 95 °C for 10 minutes before being stored at 4 °C. PCR reactions on the lysed cells were performed with the Phusion High-Fidelity Polymerase (NEB) and a primer pair that flanks the spacer array (CYM-Pm733 and CYM-Pm734) using standard PCR running conditions. Amplification products were run and visualized on a 1% agarose gel supplemented with ethidium bromide. The raw gel image is shown in Supplementary Figure 1e. Complete information of all the oligonucleotides used in this study is provided in Supplementary Table S2.
Target plasmid degradation.
S. aureus RN4220 cells were transformed with a plasmid carrying an inducible target sequence (pJTR162) or a non-matching sequence (pWJ153). Following plasmid selection with erythromycin, cells were transformed again with a pCRISPR plasmid carrying either the dcsm3/dcsm6 double mutation (pWJ242) or the dcas10/dcsm3/dcsm6 triple mutation (pJTR127) in the type III-A CRISPR-cas locus; in both cases harboring a spacer matching the target sequence in pJTR162 (gp43). Overnight cultures of the double-transformed strains were diluted 1:100 into fresh BHI media with chloramphenicol and grown to an OD600 of ~0.3. A pre-induction sample, designated as timepoint 0, was then taken from each culture. 0.125 μg/mL of anhydrotetracycline was subsequently added to the cultures and samples were taken at the indicated time points. Plasmid DNA was then extracted and both pCRISPR and pTarget plasmids were linearized by digesting with the restriction enzyme BamHI (New England Biolabs). Digested plasmids were run and visualized on a 1% agarose gel supplemented with ethidium bromide. The raw gel image is shown in Supplementary Figure 1c.
Measuring the MIC of strains
MICs were determined using serial 2-fold dilutions of the drug and following previously published guidelines44. The reported MICs represent the average of three independent measurements.
Deep sequencing of the rifampicin resistance clusters in S. aureus rpoB
S. aureus TB4 strains carrying the wild-type (pWJ245) type III-A CRISPR-Cas system, the dcas10/dcsm3 (pJTR122) mutant, or the wild-type system in a lexA(ind-) background (pWJ245 JAV6) were grown up in BHI media supplemented with chloramphenicol as overnight cultures. The next day, overnight cultures were diluted 100-fold into fresh BHI media supplemented with chloramphenicol and 5 mM CaCl2. At an OD600 of 0.3, cultures were infected with phage ϕNM1γ6 at MOI 10. The cultures were grown overnight at 37 °C with shaking. Following growth, cultures were then plated onto selective levels of rifampicin, as described previously, and incubated at 37 °C for 48 hours. Resistant colonies on each plate were pooled, lysed, and subjected to phenol-chloroform genomic extraction. The S. aureus rpoB gene was then PCR-amplified with primers (CYM-Pm128 and CYM-Pm129) that anneal to regions flanking the rpoB locus. Amplified PCR product or purified whole genomic DNA were sonicated to a size of ~600 bp and prepared with an Illumina TruSeq DNA Sample Prep kit. Samples were then paired-end sequenced on an Illumina MiSeq system. Paired-end reads from the sequencing run were entered into the Geneious software platform45 and mapped to the rpoB gene from the S. aureus reference sequence (Refseq: NC_007795.1). Mutations were called using the “Find Variations/SNPs” program of Geneious. Mutations that (i) corresponded to known resistance mutations in the two rifampicin resistance clusters18,46 and (ii) occurred at a frequency greater or equal to 1% of the coverage at its position were counted.
Construction of the lexA(Ind-) mutant in S. aureus TB4
Allelic replacement in S. aureus was carried out as previously described47. Briefly, pKOR1 derivative pJW83 was designed to introduce the K168A mutation into the lexA gene. This plasmid was propagated in RN4220 at 30°C with chloramphenicol (5 μg/ml), and subsequently transformed into TB4 under the same conditions. This strain was then propagated at 42°C with chloramphenicol in liquid culture and then streaked out to single colonies at 42°C with chloramphenicol. Large colonies were inoculated and grown at 30°C without selection and then plated at 30°C on plates with anhydrotetracycline (100 ng/ml). Large colonies were then propagated and genomic DNA was extracted with the Wizard Genomic DNA Purification Kit (Promega) to confirm introduction of the mutation.
Validation of the lexA(Ind-) mutant in the JAV6 strain
S. aureus TB4 pWJ245 and JAV6 pWJ245 strains were transformed with an SOS reporter plasmid, pAV22, where GFP is under the control of the promoter for 4-oxalocrotonate tautomerase. This promoter has been shown to be highly induced during the SOS response in S. aureus48. Overnight cultures were diluted 1:100 fold in BHI supplemented with both chloramphenicol and spectinomycin (250 μg/mL), added to Tecan plate reader, and grown at 37 °C with orbital shaking (Amplitude: 3 mm). After 1 hour growth, mitomycin C (MMC) was added to a final concentration of 0.5 μg/mL in the appropriate wells. Cells were then left to grow at 37 °C with orbital shaking. OD600 and GFP fluorescence intensity (Ex:475nm/Em:509nm) was monitored throughout. For data analysis, the fluorescence intensity in each culture-containing well was subtracted with the background fluorescence values from wells containing just BHI plain media. The corrected fluorescence values were then normalized with the OD600 readings at each time point. The fluorescence / OD600 values are then plotted over time.
Reverse Transcriptase qPCR of the polV gene
Overnight cultures were diluted 1:500 fold into BHI media supplemented with 10 μg/mL of chloramphenicol and grown to an OD600 of 0.05. Cells were then infected with ϕNM1γ6 at an MOI of 10 and grown to an OD600 of 0.15 before being pelleted. RNA was extracted from the cells using the Direct-zol™ RNA MiniPrep Plus kit (Zymo Research) and treated with the Turbo DNA-free kit (Invitrogen) to remove contaminating DNA. cDNA of the RNA transcripts was generated using SuperScript™ IV reverse transcriptase and random hexamer primers (Invitrogen) according to the protocol by the manufacturer. qPCR on the cDNA was performed with Fast SYBR Green MasterMix (Applied Biosystems) and a QuantStudio3 Realtime PCR system (Applied Biosystems). The housekeeping rho gene was used as a control for normalization. The primers used for amplification of rho and pol V are listed in Supplementary Table S2.
Passaging experiments
Five independent cultures of S. aureus TB4 strains carrying either wild-type type III-A CRISPR-Cas (WT) or the dcas10/dcsm3 double mutant were passaged for a total of 24 passages. For each passage, cultures were diluted 1:100 into fresh BHI media supplemented with 10 μg/mL of chloramphenicol and 5 mM of CaCl2. The cultures were grown at 37 °C to an OD600 of ~0.3 and then infected with ϕNM1γ6 at a MOI of 1. Cultures were plated every sixth passage onto BHI agar plates supplemented with 10 μg/mL of chloramphenicol and BHI agar plates supplemented with 0.064 μg/mL of rifampicin. The chloramphenicol plates were incubated for 16 hours at 37 °C, while the rifampicin BHI plates were incubated for 48 hours. Following incubation, the colonies on both sets of plates were counted and the mutation frequency of the cultures estimated.
Sequencing of passaged S. aureus cultures
Genomic DNA was extracted from culture samples of passage 18. For Experiment 1, we obtained genomic samples from an individual WT and dcas10/dcsm3 culture; for Experiment 2, we combined the 5 replicates of WT cultures and the 5 replicates of the dcas10/dcsm3 cultures to generate two pooled samples. Genomic DNA samples were isolated and then sheared with sonication to a size of ~250 bp (Covaris S220 Focused Ultrasonicator). Sheared genomic DNA were then prepared for Duplex Sequencing following a previously published protocol49. Sample libraries were then sequenced using an Illumina NextSeq 500 sequencing (High output, 2×150 bp paired-end). Sequenced reads were subsequently processed using the Duplex Sequencing pipeline49. The mutation rate estimated by the pipeline is defined as the number of mutations per nucleotides sequenced. Distances in base pairs between mutations was quantified using the Python script MutPosGraph (available upon request).
Plasmid cloning
Complete information of all the plasmids used in this study is provided in Supplementary Table S3.
pJTR122 was made by restriction digestion of pJTR116 with BsaI-HF (New England Biolabs), followed by ligation of the annealed primer pair W1051 and W1052 into the backbone with T7 ligase (New England Biolabs). pJTR127 was made by amplifying pWJ191 with W852+GG425, and pJTR126 with W614 and GG424, and joining the resulting PCR products by Gibson assembly50.
pAV22 was constructed using 3-piece Gibson assembly. pLZ12spec51 was linearized using primers AV119 and NP114, the GFP coding sequence was amplified from pCN5452 using primers AV131 and NP112, while the promoter from the SOS-responsive gene 4-oxalocrotonate tautomerase was amplified with primers AV129 and AV130.
pDB236 was constructed by amplifying pDB11453 with primer pair B585/B586, and genomic DNA isolated from S. aureus strain M06/017154 with primer pair B587/B588, and joining the resulting PCR products by Gibson assembly.
pDVB47 was constructed by amplifying pDB236 with three primer pairs: oDVB96/oDVB128, oDVB97/oDVB129, and oDVB126/oDVB127, and joining the resulting PCR products by Gibson assembly.
pDVB51 was constructed by restriction digestion of pDVB47 with BsaI-HF, followed by ligation of the annealed primer pair oDVB146 and oDVB147 into the backbone with T7 ligase.
Extended Data
Extended Data Figure 1. Type III-A CRISPR-Cas immunity against the pG0400 conjugative plasmid and the ϕNM1γ6 phage increases the mutation frequency and rate of the staphylococcal host.
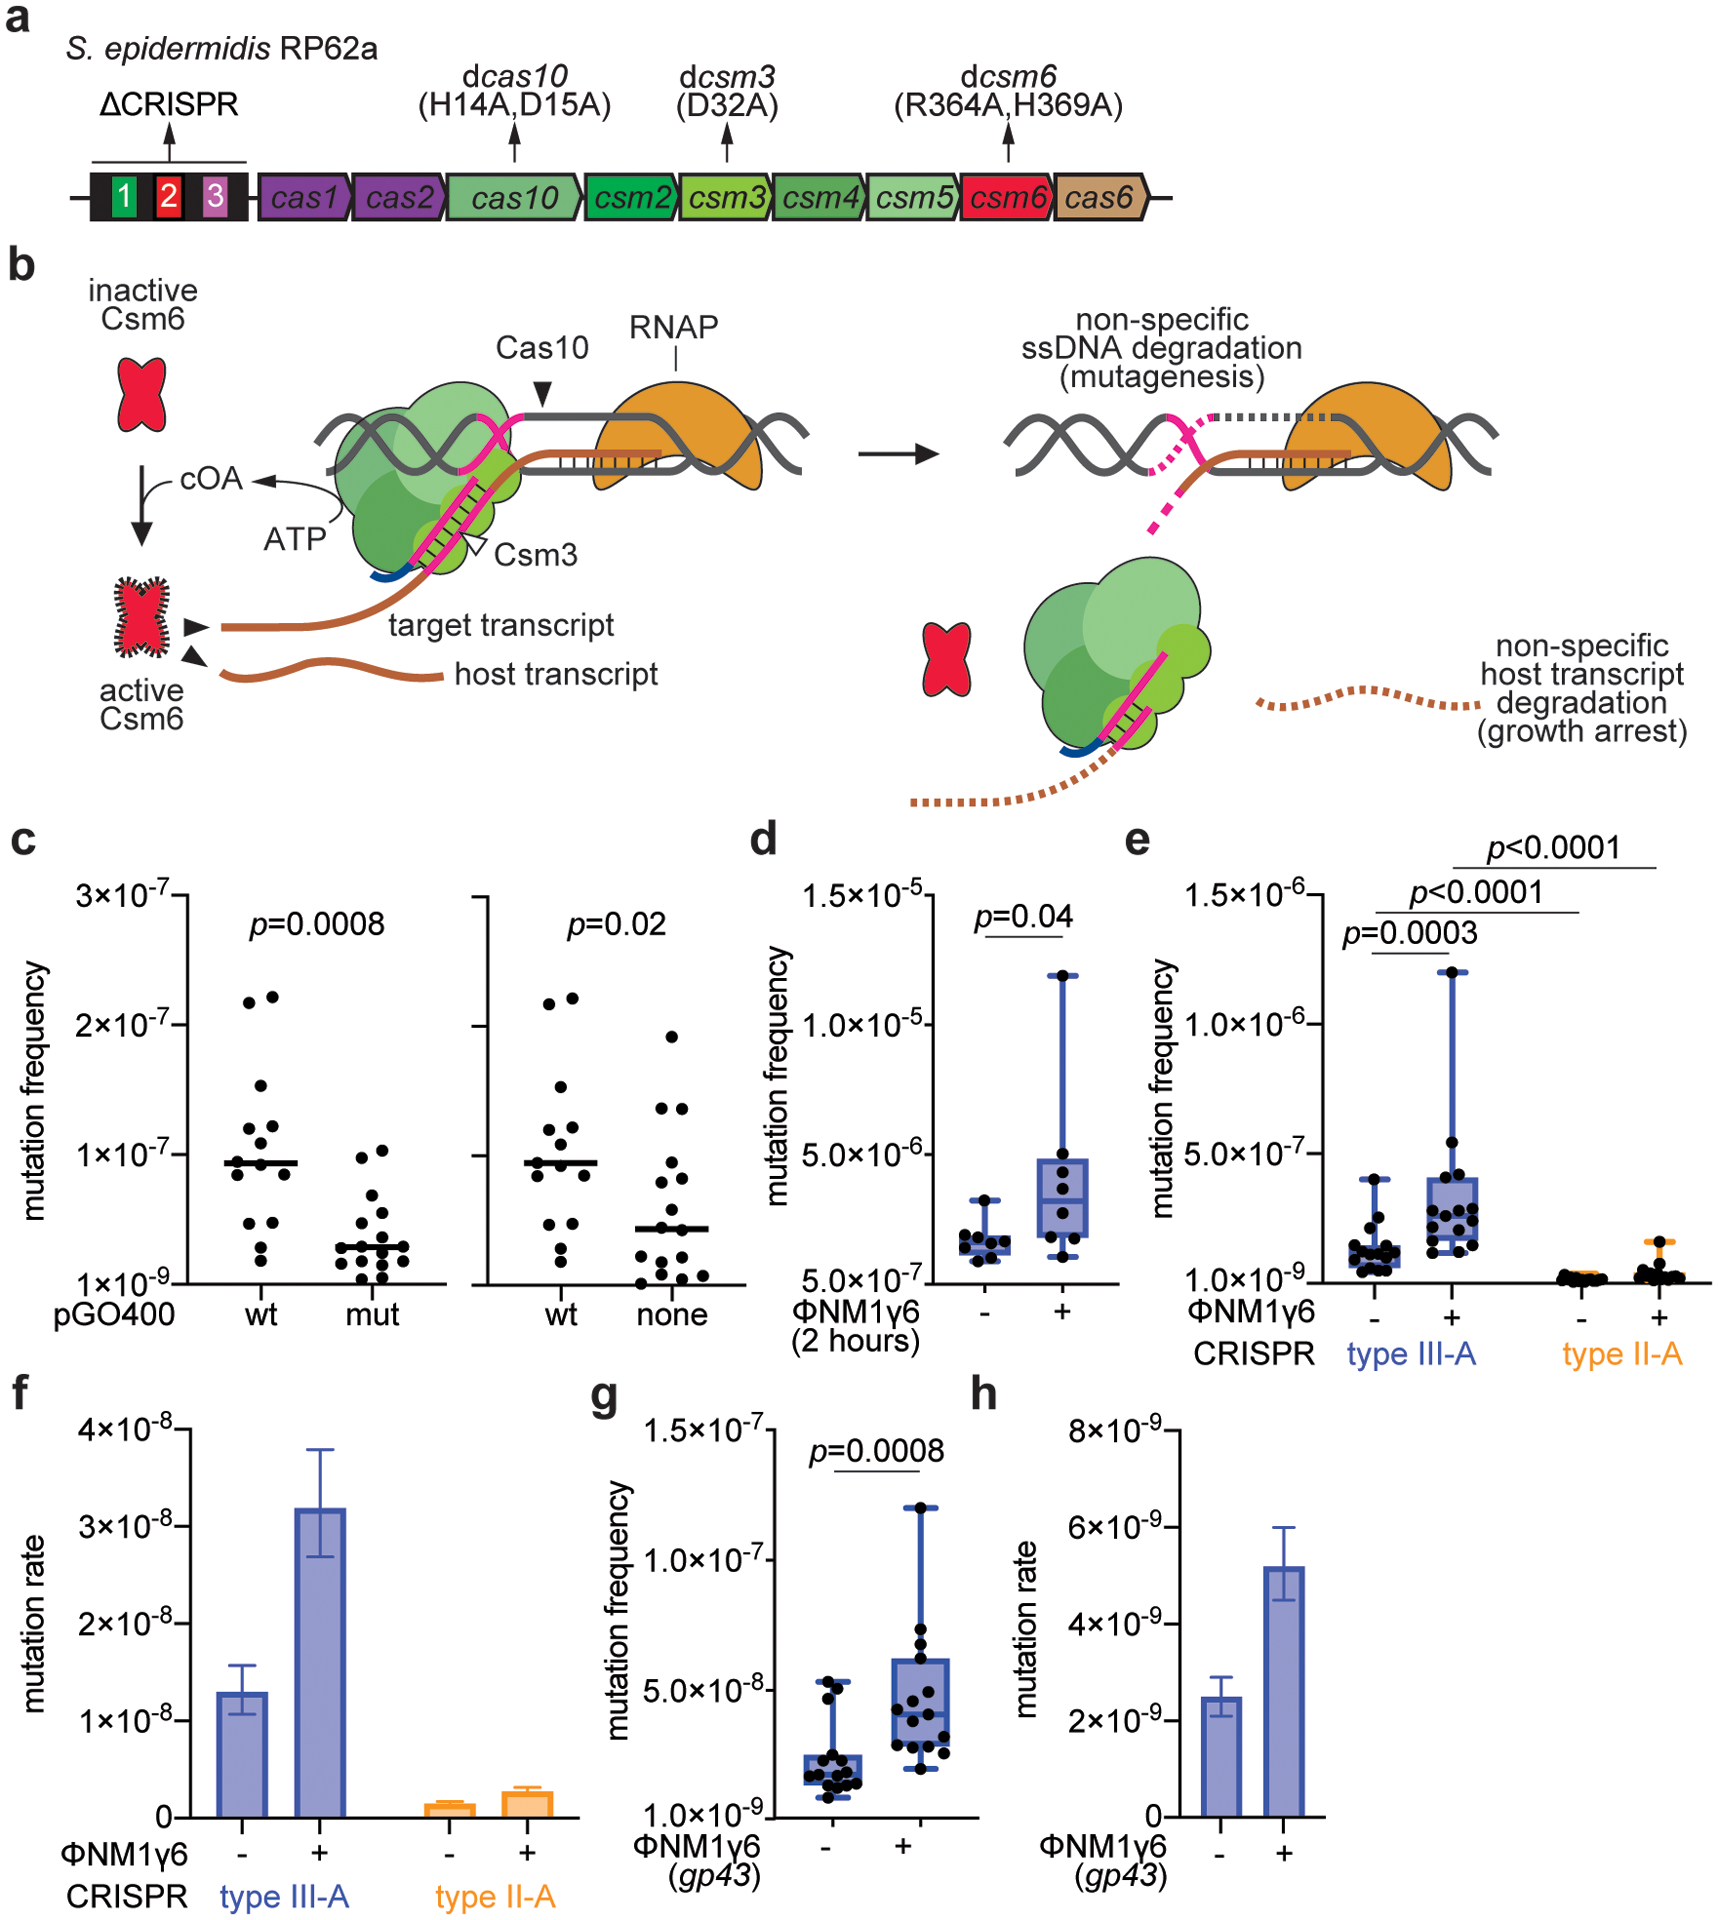
(a) Schematic of the S. epidermidis RP62a type III-A locus showing the mutants analyzed in this study. The CRISPR array shows repeats as black boxes and spacers as colored, numbered boxes. (b) Current model of the type III-A CRISPR-Cas immune response. A Cas10 complex, composed of Cas10, Csm2–5 (in different shades of green) is loaded with a crRNA guide after processing of the transcript of the CRISPR array by Cas6 (not shown). The crRNA guide is used to direct the Cas10 complex to a complementary transcript produced by the invader following infection. Target recognition triggers two activities of Cas10. The Palm domain catalyzes the conversion of ATP into a cyclic tetra- or hexa-adenosyl ring that serves as a second messenger that binds and activates Csm6, a non-specific RNase. Degradation of both cellular and invader transcripts by this nuclease generates the growth arrest of the host that is required for the clearance of plasmids and phages which targets that have mismatches with the crRNA guide or that are transcribed either weakly or late in the phage lytic cycle. In addition, the HD domain of Cas10 is activated, leading to the non-specific degradation of ssDNA. This activity is believed to be concentrated on the ssDNA generated at the invader’s transcription bubble or within R-loops such as those formed during transcription elongation by RNA polymerase. Finally, the Csm3/Cmr4 subunit of the Cas10 complex cleaves the target transcript, turning off both enzymatic activities of Cas10. In this study we show that the ssDNase activity of type III-A CRISPR-Cas immunity can also lead to an increase in the mutation frequency and rates of the host, presumably through degradation of other ssDNA regions of the host chromosome. (c) Calculation of p-values using two-sided Mann-Whitney test of the data presented in Figure 1b for the mutation frequency of wild-type S. epidermidis RP62a, without the two outlier data points in the “pG0400-wt” samples. Horizontal bars: median values; n(pG0400-wt)=14 biologically independent experiments; n(pG0400-mut, none)=16 biologically independent experiments. (d) S. aureus cells (~109) that were treated with ϕNM1γ6 phage and survived infection through the targeting of an early-expressed gene by the staphylococcal type II-A or type III-A CRISPR-Cas systems were seeded after 2 hours of outgrowth on plates with or without rifampicin to calculate their mutation frequency. Box limits, interquartile range; whiskers, minimum to maximum; centre line, median; dots, individual data points; n=15 biologically independent experiments; p-values obtained with two-sided Mann-Whitney test. (e) S. aureus cells (<1,000) that were treated with ϕNM1γ6 phage and survived infection through the targeting of an early-expressed gene (gp12 or gp14) by the staphylococcal type II-A or type III-A CRISPR-Cas systems were seeded on plates with or without rifampicin to calculate their mutation frequency. Box limits, interquartile range; whiskers, minimum to maximum; centre line, median; dots, individual data points; n=15 biologically independent experiments; p-values obtained with two-sided Mann-Whitney test. (f) Calculation of the mutation rate using the data presented in (e). The bar graphs represent the mean; the error bars represent 95% confidence intervals. (g) S. aureus cells (<1,000) that were treated with ϕNM1γ6 phage and survived infection through the targeting of a late-expressed gene (gp43) employing type III-A CRISPR-Cas immunity, were seeded on plates with or without rifampicin to calculate their mutation frequency. Box limits, interquartile range; whiskers, minimum to maximum; centre line, median; dots, individual data points; n=15 biologically independent experiments; p-values obtained with two-sided Mann-Whitney test. (h) Calculation of the mutation rate using the data presented in (g). The bar graphs represent the mean; the error bars represent 95% confidence intervals.
Extended Data Figure 2. Mutagenesis mediated by type III-A CRISPR-Cas immunity against phage infection.
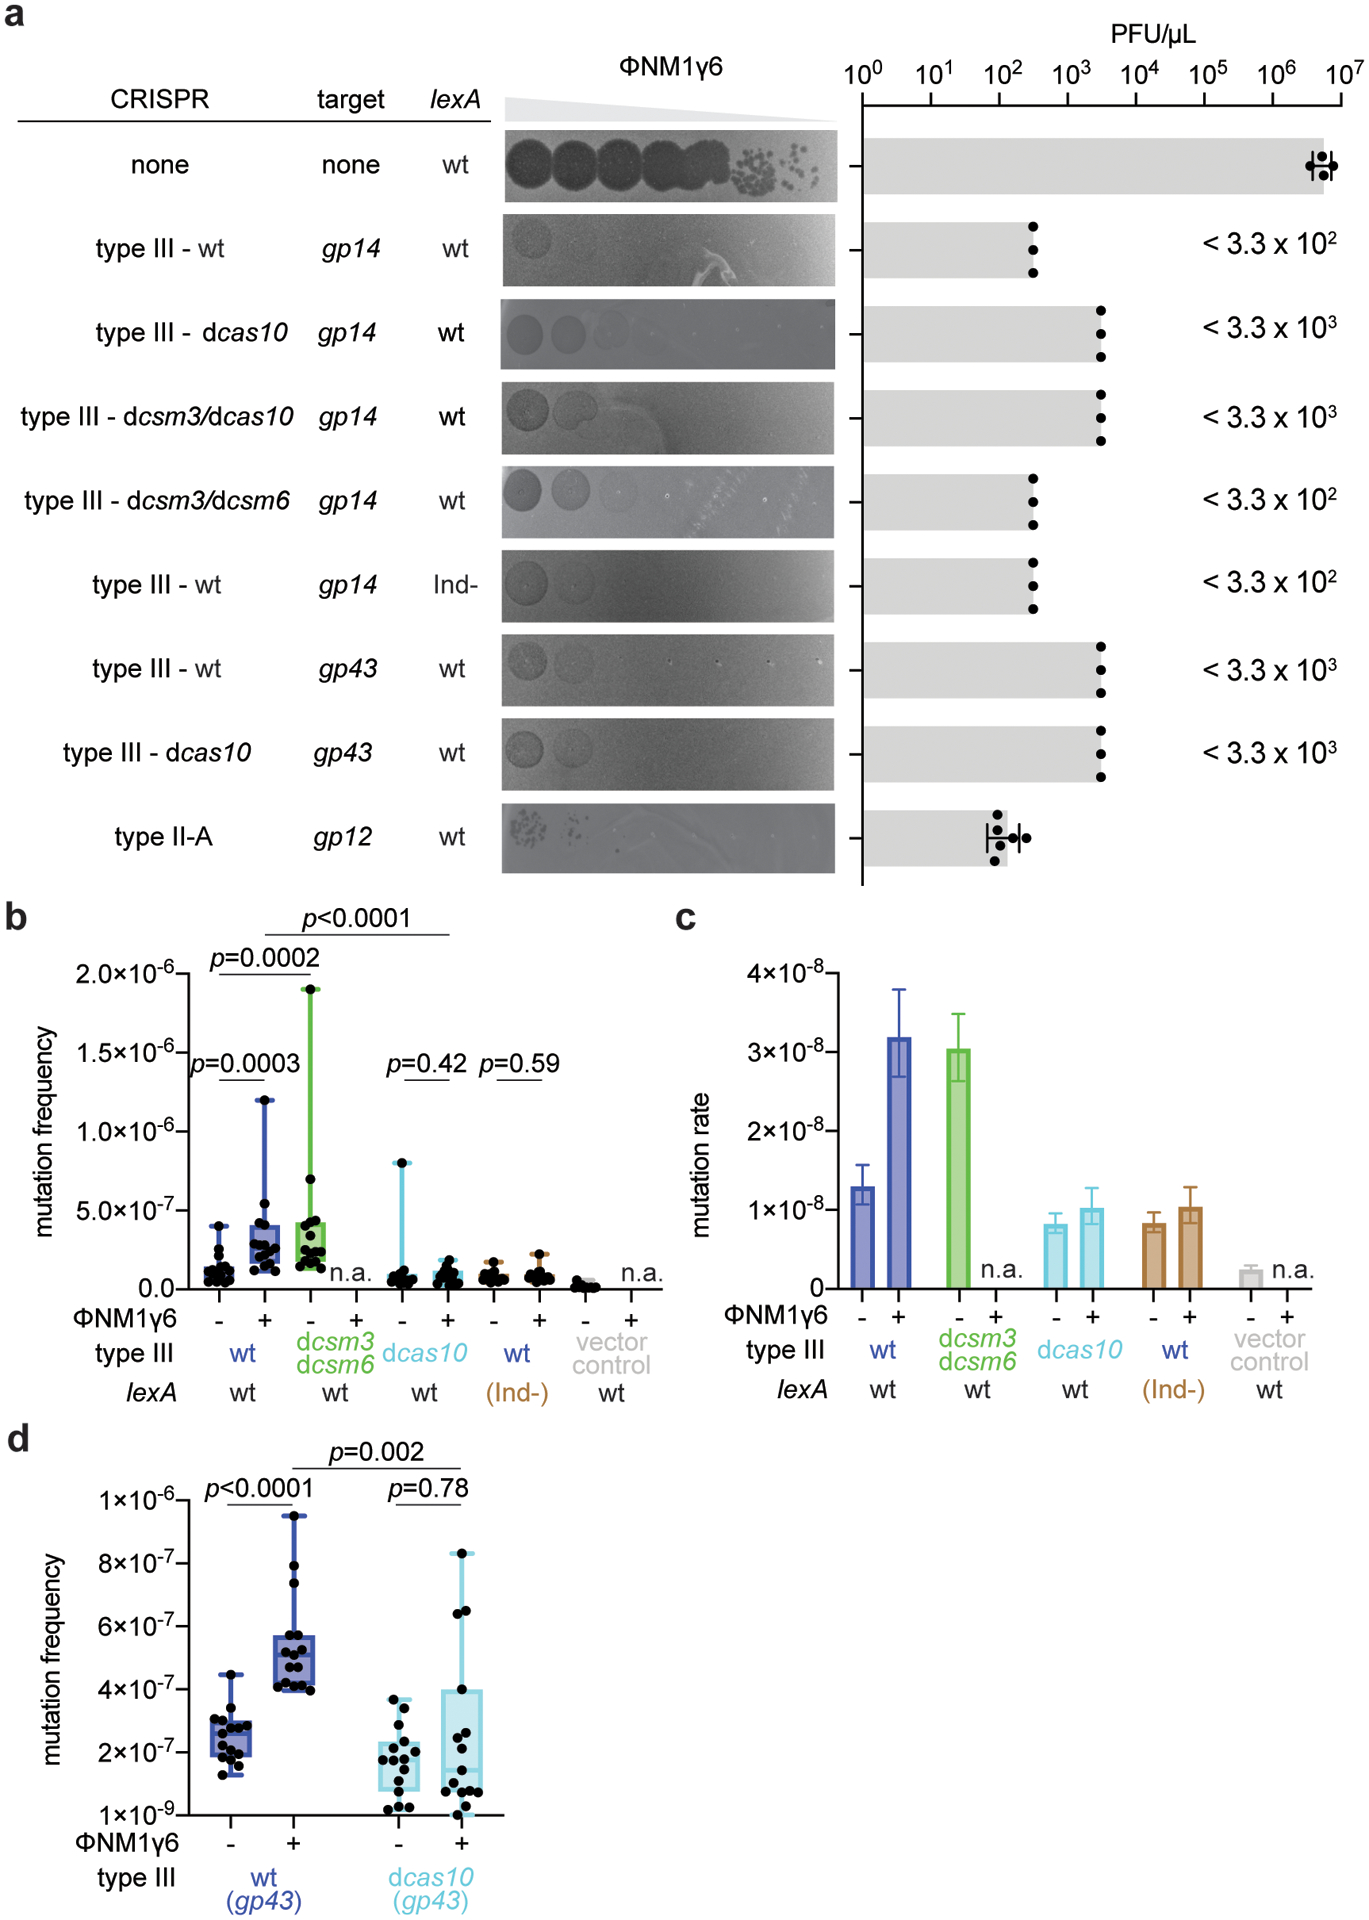
(a) Serial ten-fold dilutions of ϕNM1γ6 phage were spotted on plates seeded with different strains of staphylococci expressing a gp14- or gp43-targeting S. epidermidis type III-A systems with different mutations, wild-type or (Ind-) LexA, or the gp12-targeting S. aureus type II-A system. Plaque-forming units (PFU) were enumerated; mean ±s.e.m.; n=4 (non-targeting control) or n=6 (type II-A CRISPR immunity) biologically independent experiments. In cases where plaques were not readily visible, the limit of detection of three biologically independent experiments was reported. (b) S. aureus cells (<1,000) that were treated with ϕNM1γ6 phage and survived infection through the targeting of an early-expressed gene (gp14) by different mutant versions of the type III-A CRISPR-Cas system, in the presence of an active (wild-type, wt) or inactive (lexA(Ind-)) SOS response, were seeded on plates with or without rifampicin to calculate their mutation frequency. Box limits, interquartile range; whiskers, minimum to maximum; centre line, mesdian; dots, individual data points; n=15 biologically independent experiments; p-values obtained with two-sided Mann-Whitney test. (c) Calculation of the mutation rate using the data presented in (b). The bar graphs represent the mean; the error bars represent 95% confidence intervals. (d) S. aureus cells (~109) that were treated with ϕNM1γ6 phage and survived infection through the targeting of a late-expressed gene (gp43) by either a wild-type or a dcas10 type III-A CRISPR-Cas system, were seeded on plates with or without rifampicin to calculate their mutation frequency. Box limits, interquartile range; whiskers, minimum to maximum; centre line, median; dots, individual data points; n=15 biologically independent experiments; p-values obtained with two-sided Mann-Whitney test.
Extended Data Figure 3. Type III-A CRISPR-Cas immunity against plasmids carrying inducible targets.
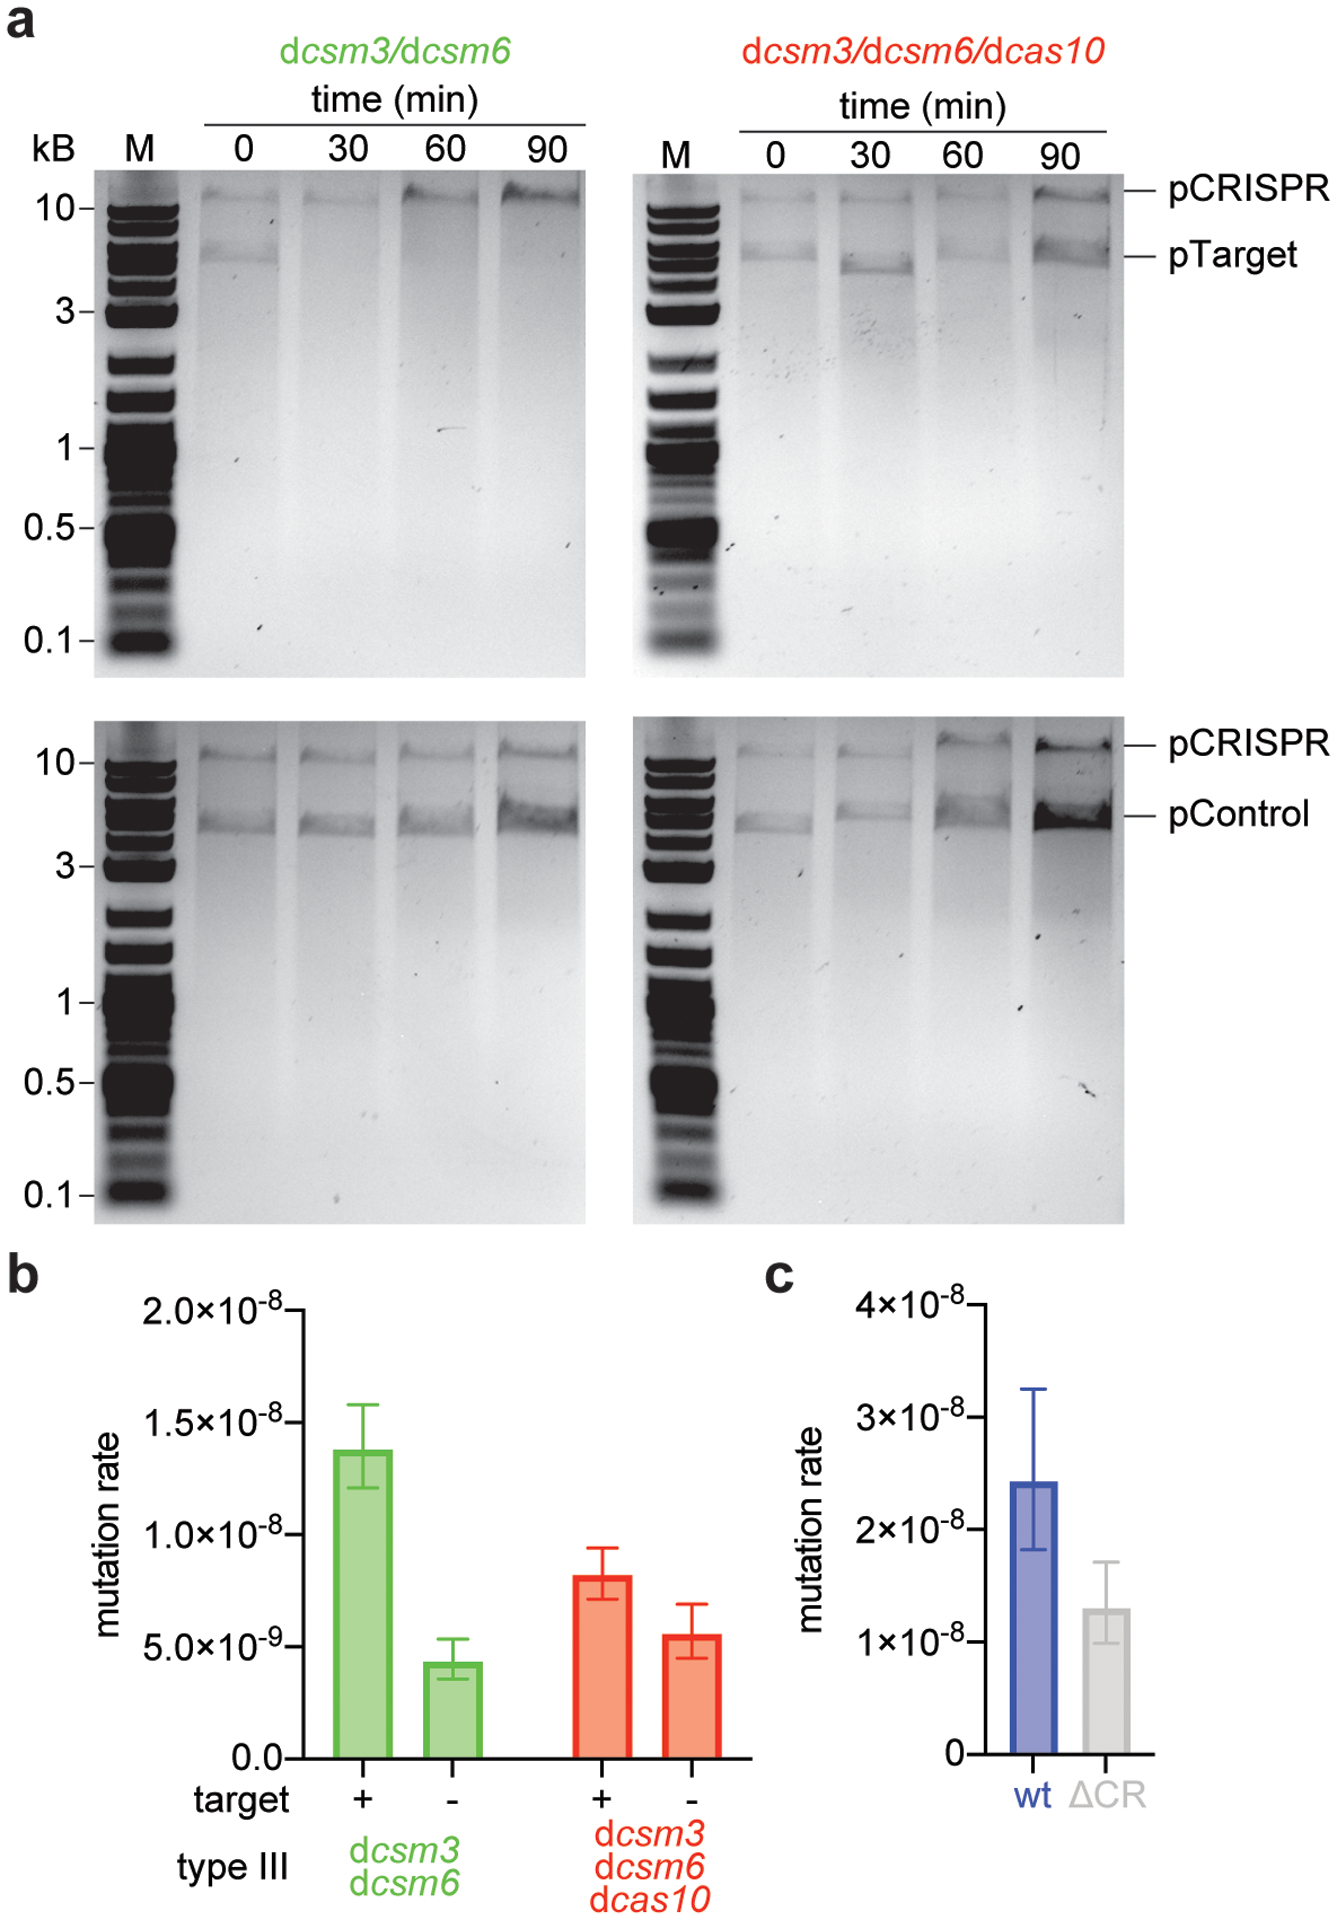
(a) S. aureus TB4 strains were transformed with pCRISPR plasmids carrying the dcsm3/dcsm6 or the dcas10/dcsm3/dcsm6 mutations in the type III-A CRISPR-Cas locus. Strains were then transformed with a plasmid expressing an inducible transcript with a target (pTarget, upper gels) or non-target (pControl, lower gels) sequence. Cultures were induced with anhydrotetracycline and samples were collected at the indicated time points. Plasmids were extracted, linearized by restriction digestion, separated and visualized with agarose gel electrophoresis. Performed once. “M”, molecular weight marker. (b) Calculation of the mutation rate of the data presented in Figure 3b. The bar graphs represent the mean; the error bars represent 95% confidence intervals. (c) Calculation of the mutation rate of S. epidermidis RP62a, wild-type and ΔCRISPR mutant. The bar graphs represent the mean; the error bars represent 95% confidence intervals; n=10 biologically independent experiments.
Extended Data Figure 4. Abrogation of SOS induction in the lexA(Ind-) mutant.
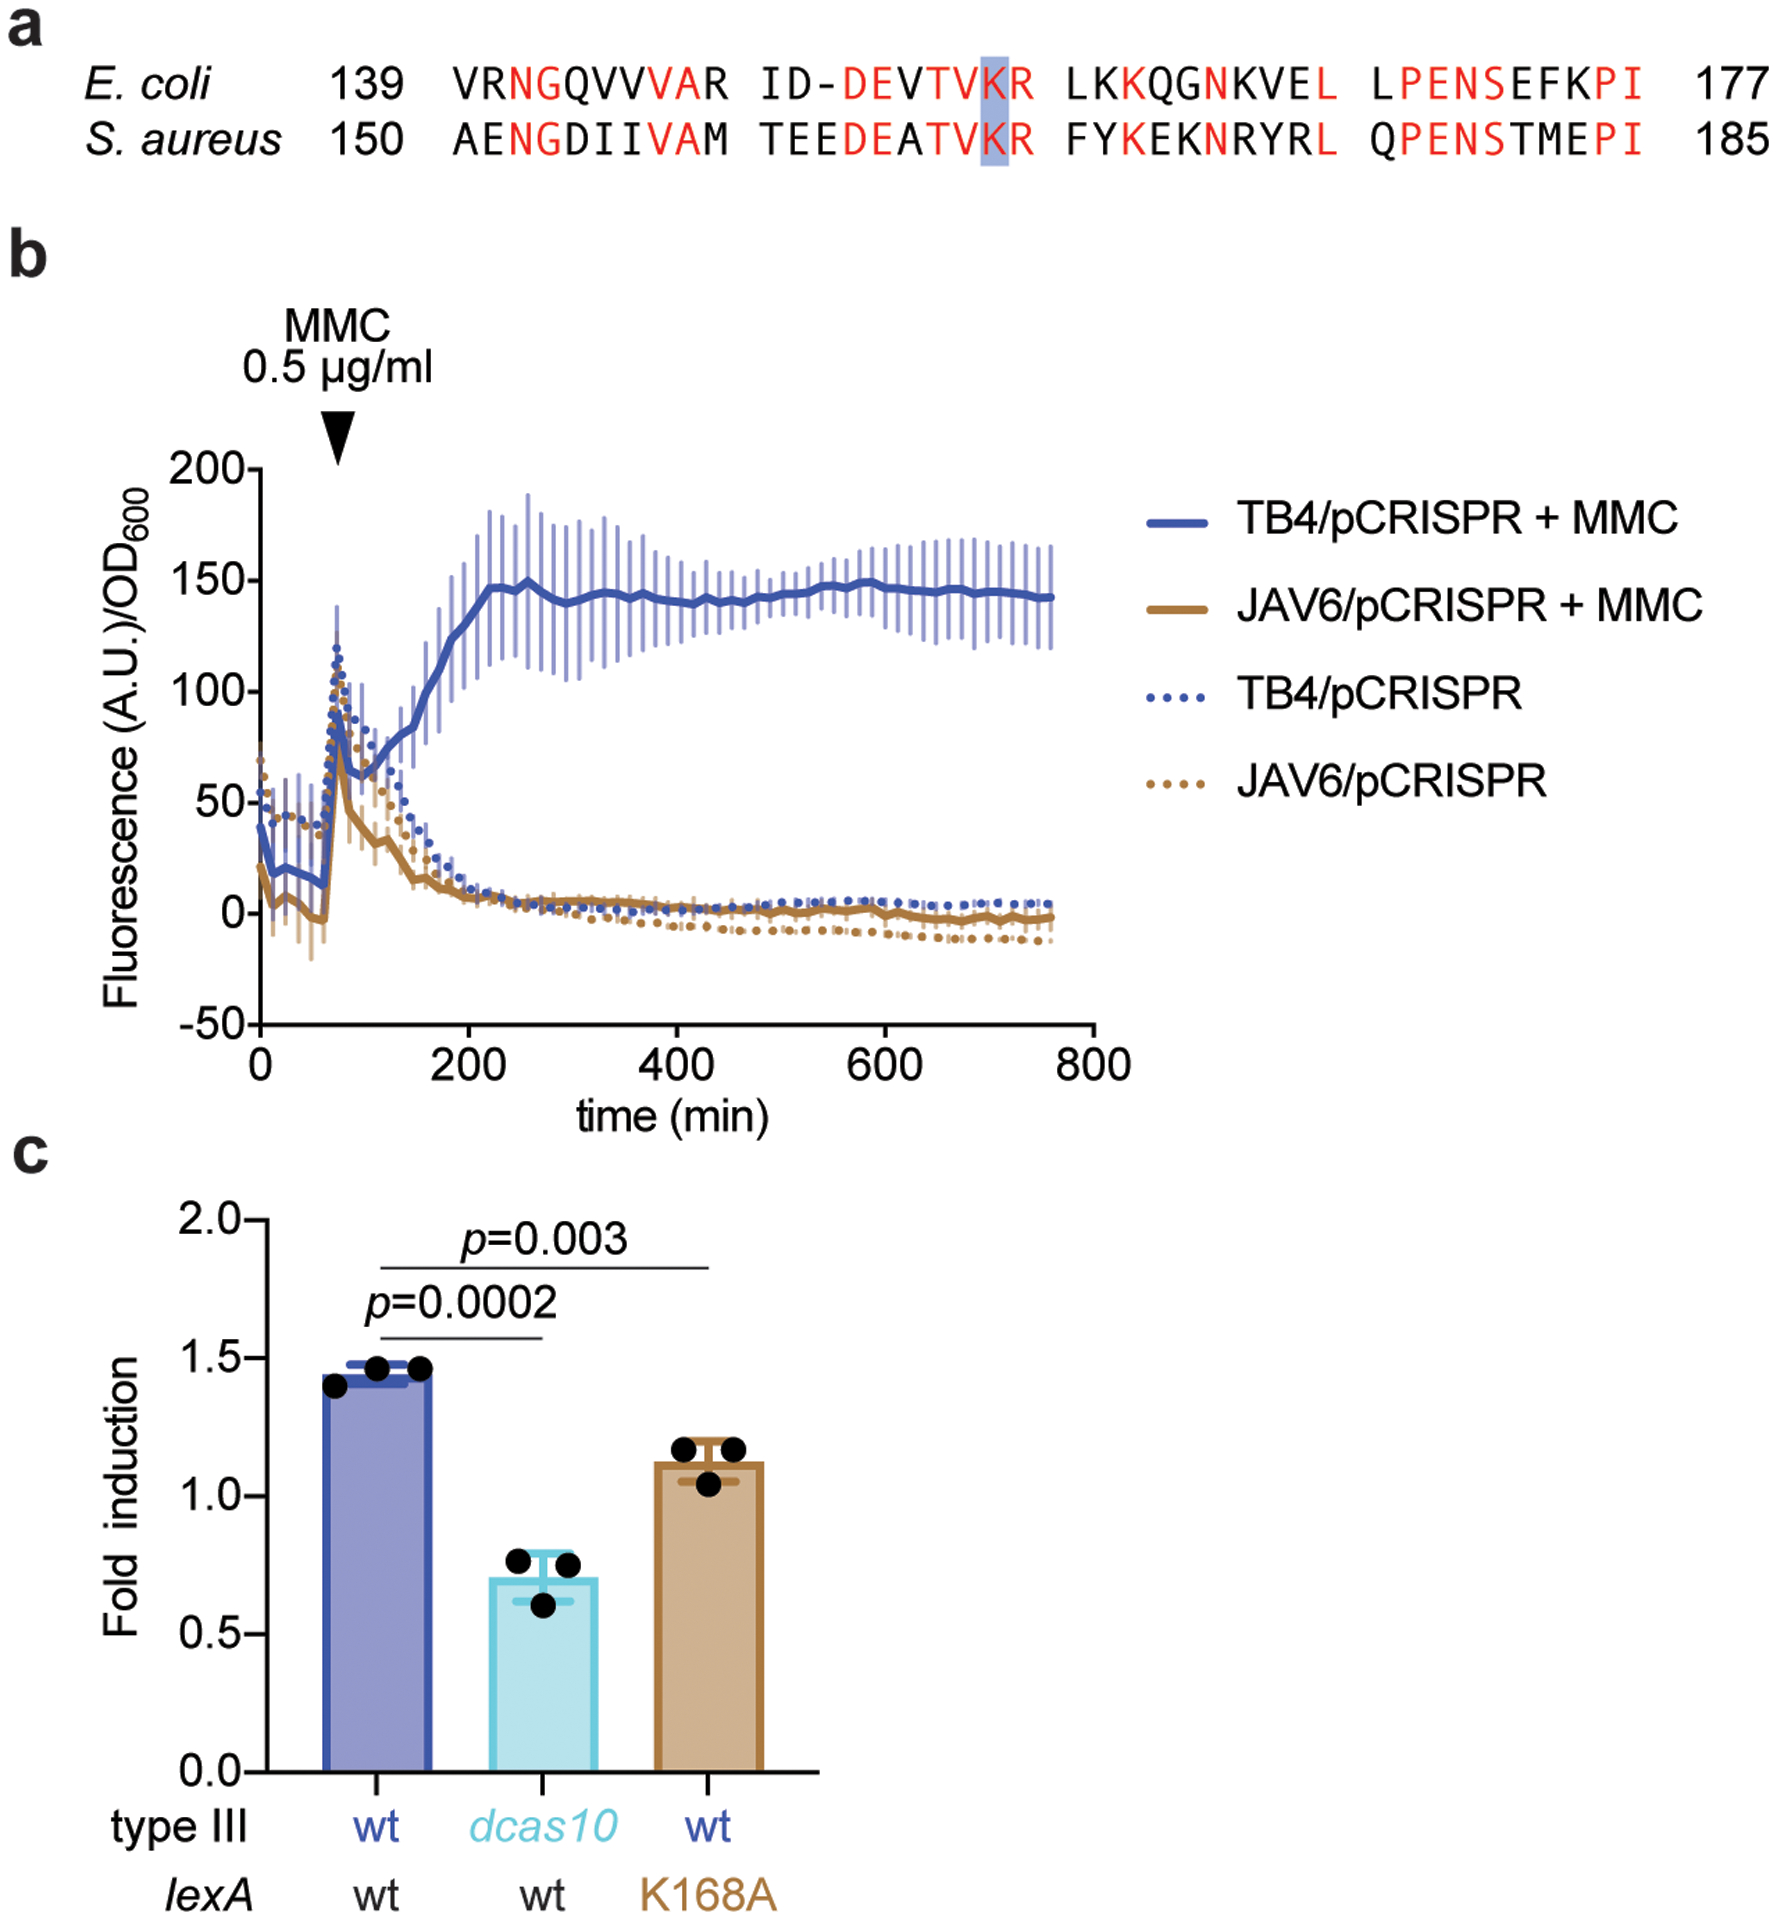
(a) A mutation in lexA that prevents its self-cleavage and the induction of the SOS response, K156A, was previously identified in Escherichia coli. Alignment with the LexA sequence of S. aureus identified K168 as the homologous residue, which was mutated in S. aureus TB4 to alanine to generate strain JAV6. (b) Strains TB4 and JAV6 were transformed with an SOS reporter plasmid, pAV22, carrying the GFP ORF downstream of the promoter for the 4-oxalocrotonate tautomerase gene. This promoter is activated after LexA self-cleavage when the SOS response is induced with mitomycin C (MMC). Each strain was either treated or not with MMC and both the growth (OD600) and green fluorescence (arbitrary units, A.U.) were measured over time, to report the fluorescence/growth ratio. (c) qPCR of the SOS-induced polV transcript after infection (with ϕNM1γ6) of cells carrying a wild-type type III-A system in either wild-type or lexA(Ind-) hosts, as well as carrying the dcas10 mutation. RNA was collected when the cultures reached OD600 0.15 (exponential growth phase), after infection at MOI 10, and used for qPCR, using the housekeeping gene rho as an internal reference for each sample. Mean of three independent biological replicates ± s.d. are reported. p-values obtained with two-sided t-test.
Extended Data Figure 5. Distribution of rpoB mutations detected via next-generation sequencing.
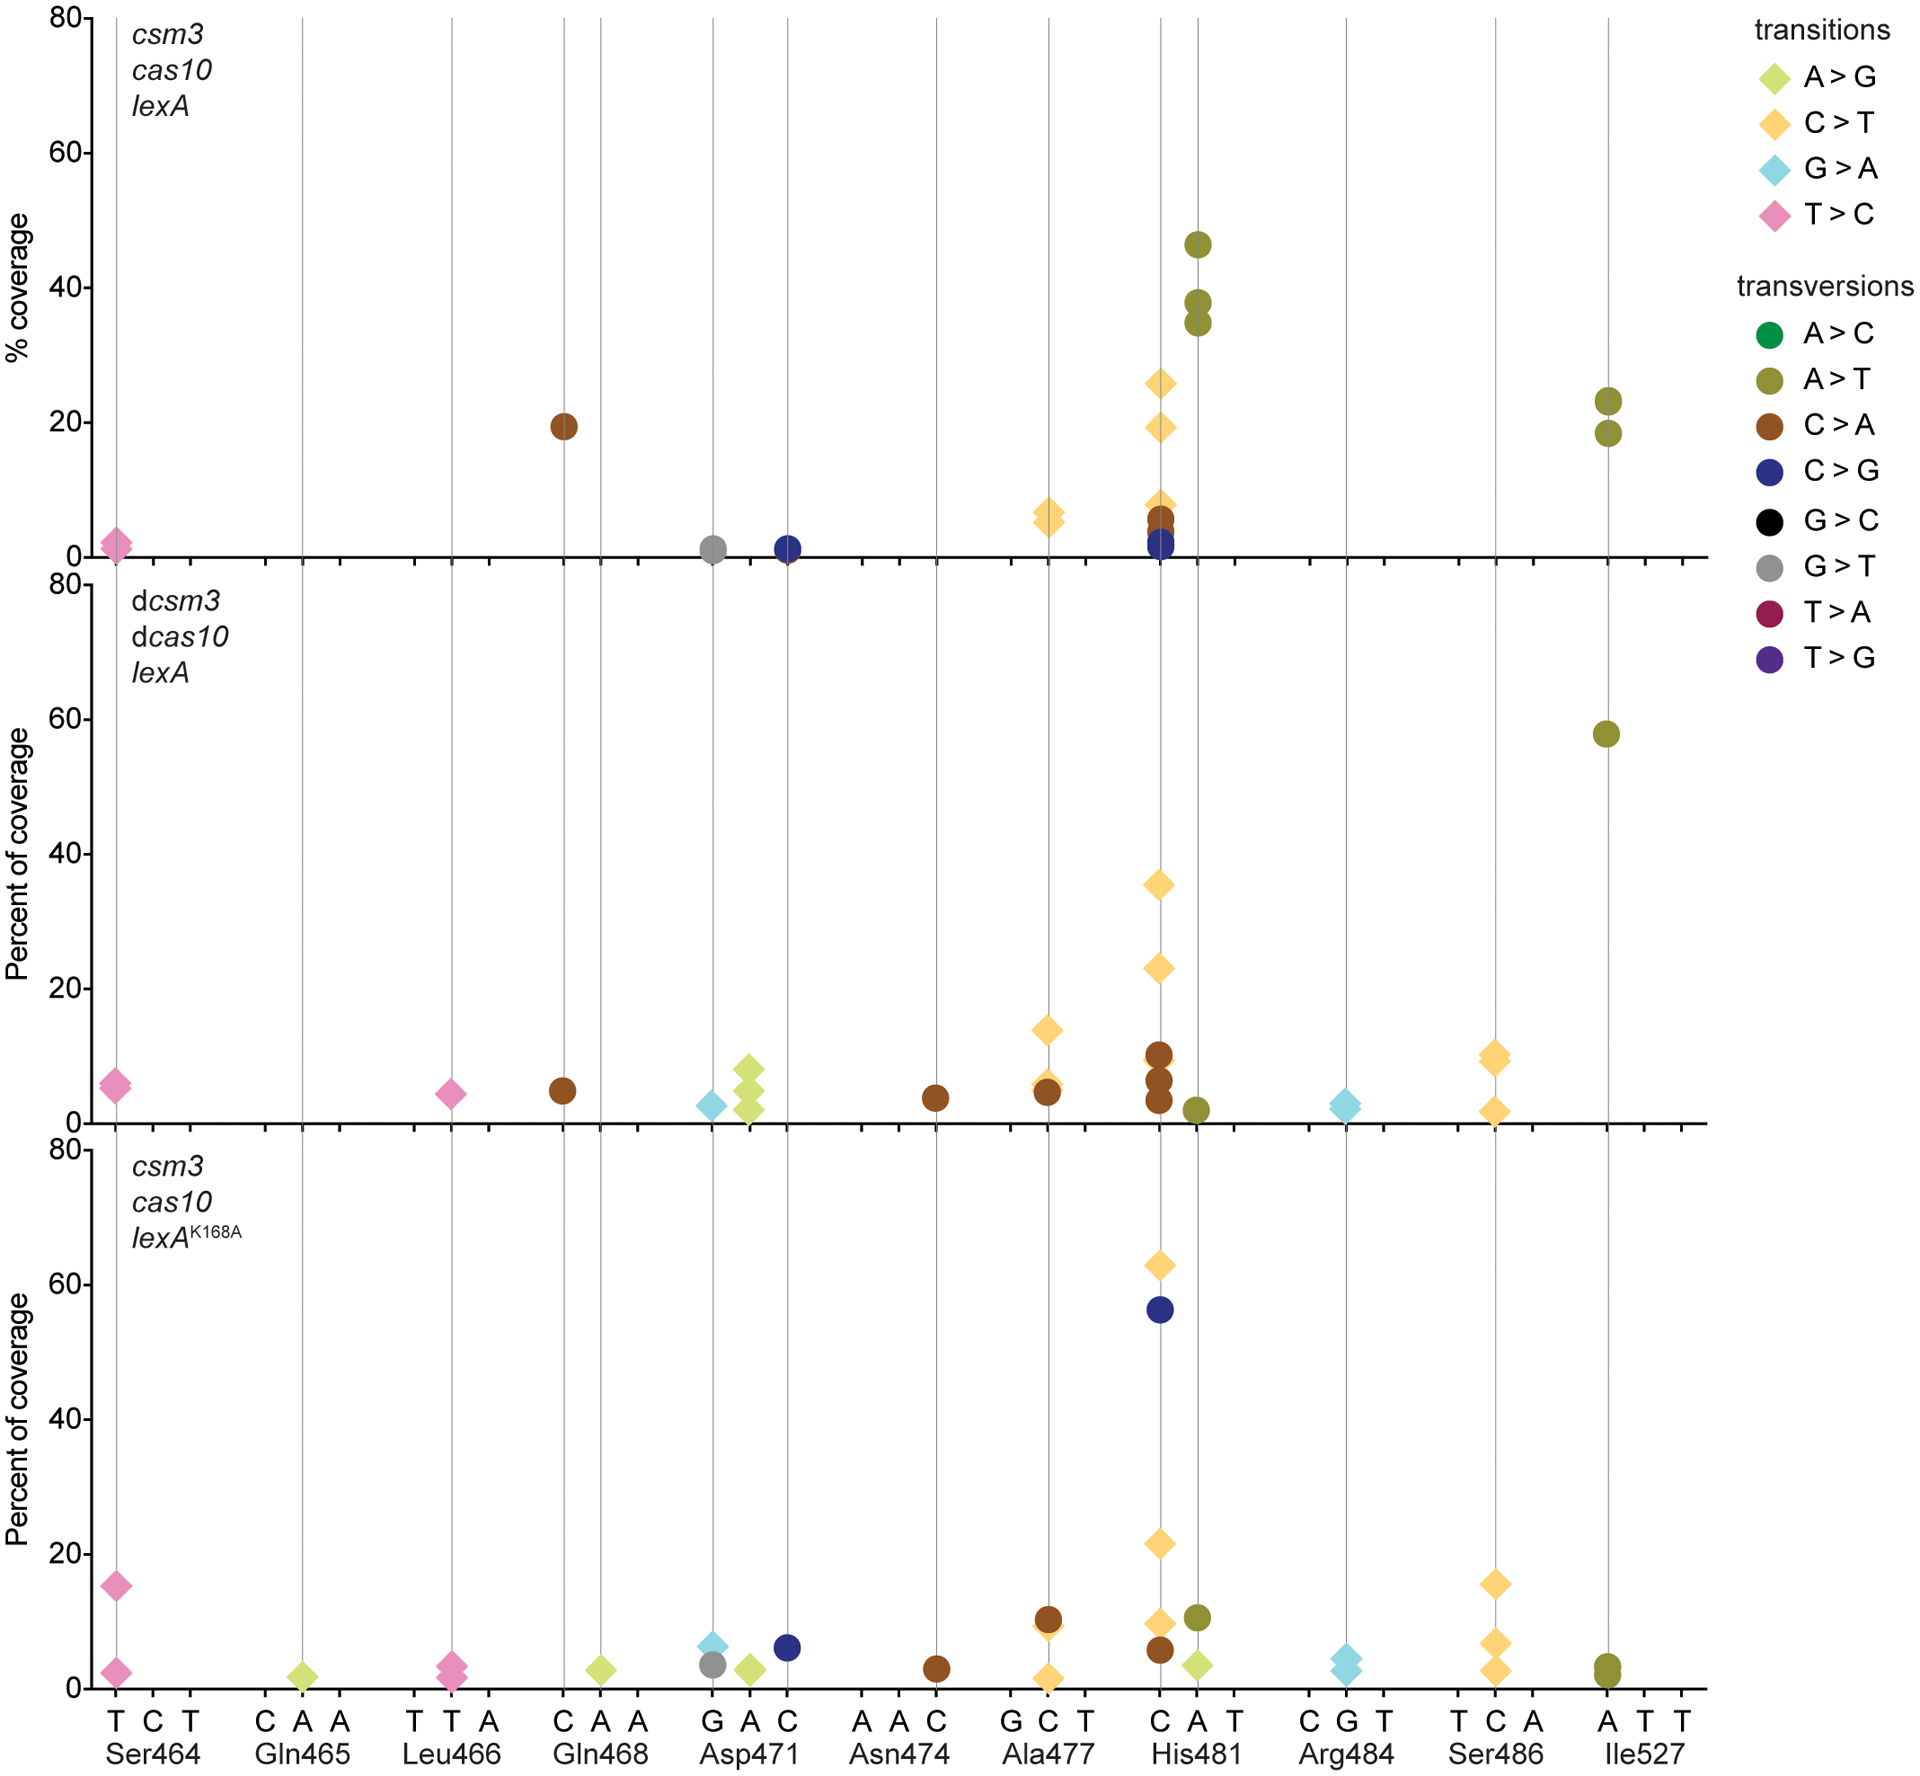
DNA from ϕNM1γ6- or rifampicin-resistant staphylococci with different genetic backgrounds was extracted and subjected to NGS. Mutations that localized to either of the two clusters known to contain amino acid substitutions that confer rifampicin resistance (cluster I: Gly462 – Gly489; cluster II: Pro515 – Leu530) were counted. The % of the total mutations in these clusters is shown for different nucleotides within codons. Different data markers indicate were used to indicate different mutations. Numerical values of data points are provided in Supplementary Data File 2.
Extended Data Figure 6. Mutagenesis mediated by type III-A CRISPR-Cas immunity increases resistance to gentamicin but not fusidic acid.
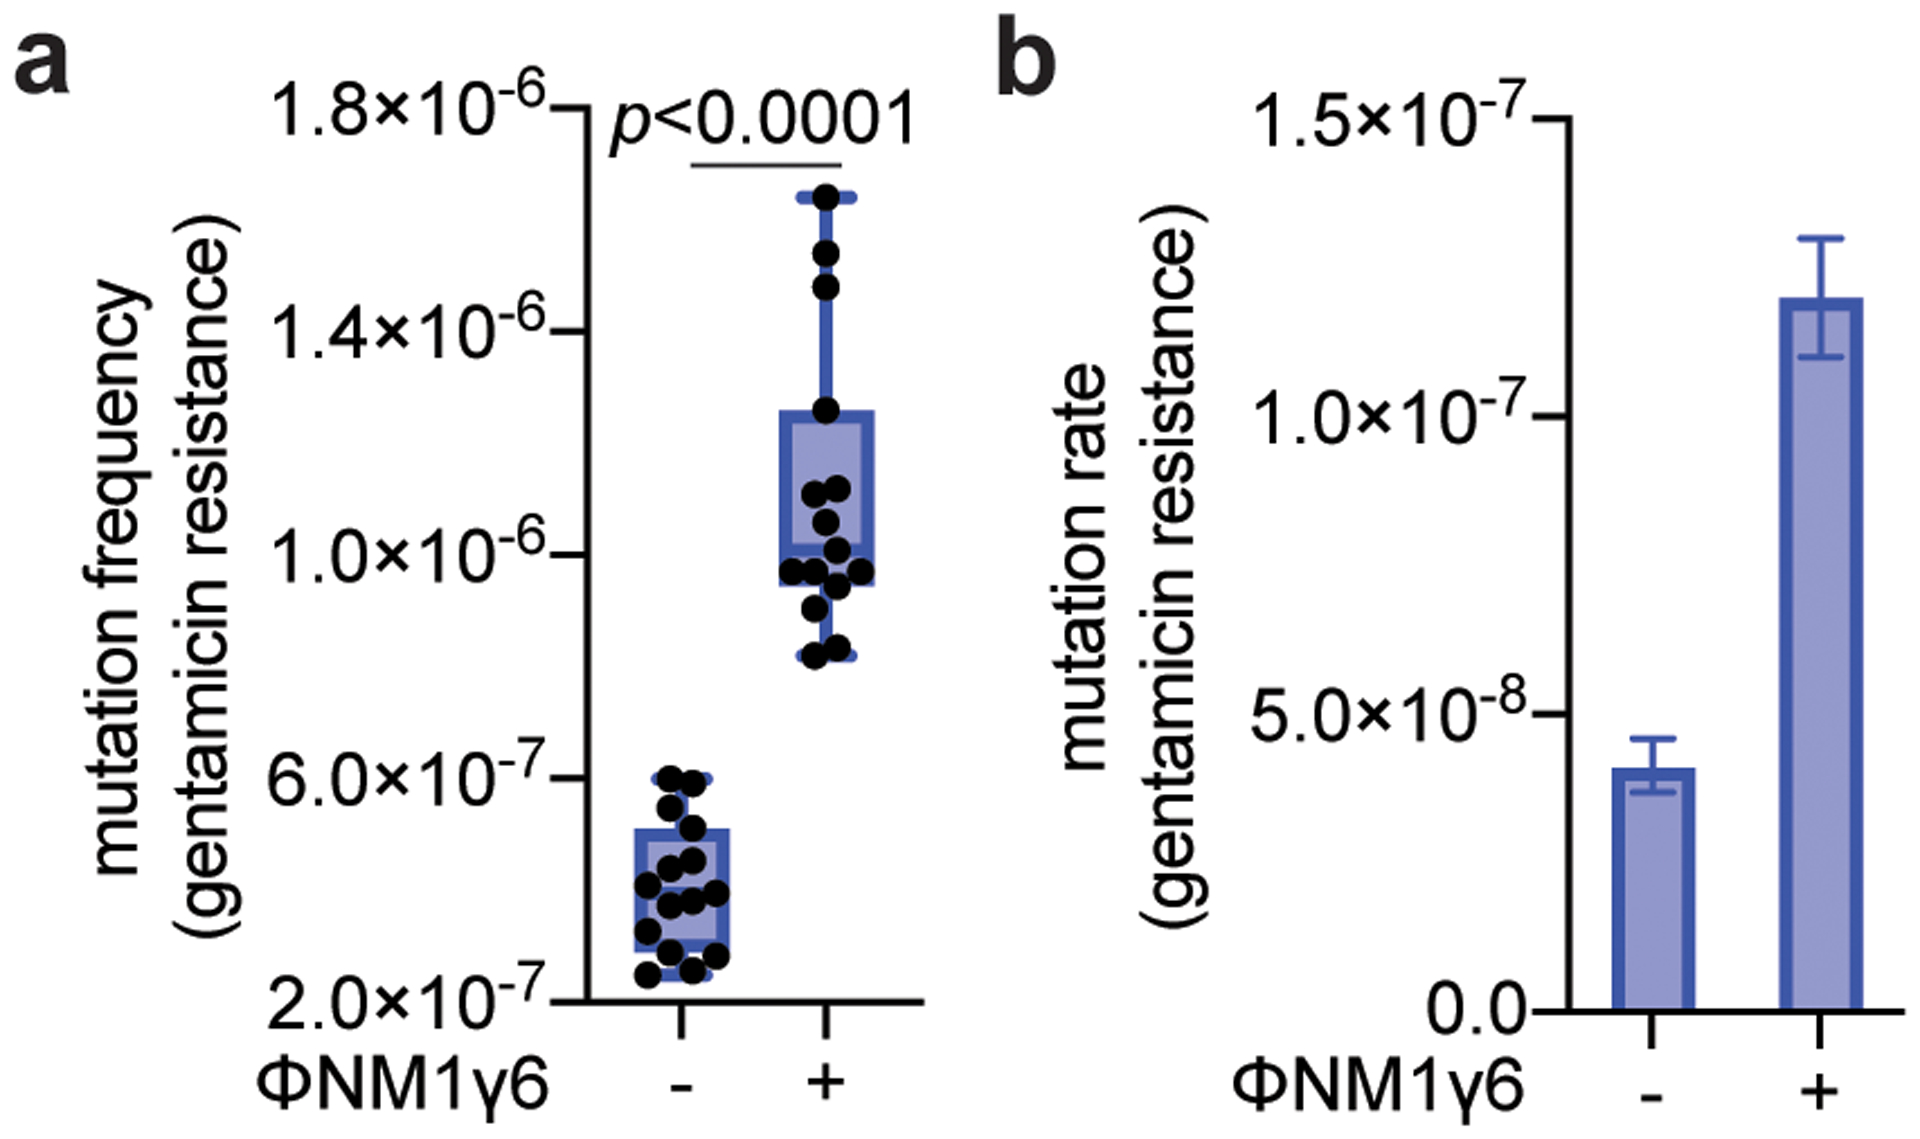
(a) S. aureus cells (<1,000) that were treated with ϕNM1γ6 phage and survived infection through the targeting of an early-expressed gene (gp14) by the type III-A CRISPR-Cas system, were seeded on plates with or without gentamicin to calculate their mutation frequency. Box limits, interquartile range; whiskers, minimum to maximum; centre line, median; dots, individual data points; n=15 biologically independent experiments; p-values obtained with two-sided Mann-Whitney test. (b) Calculation of the mutation rate using the data presented in in panel (a). The bar graphs represent the mean; the error bars represent 95% confidence intervals.
Extended Data Figure 7. Type III-A CRISPR-Cas immunity against ϕStaph1N phage.
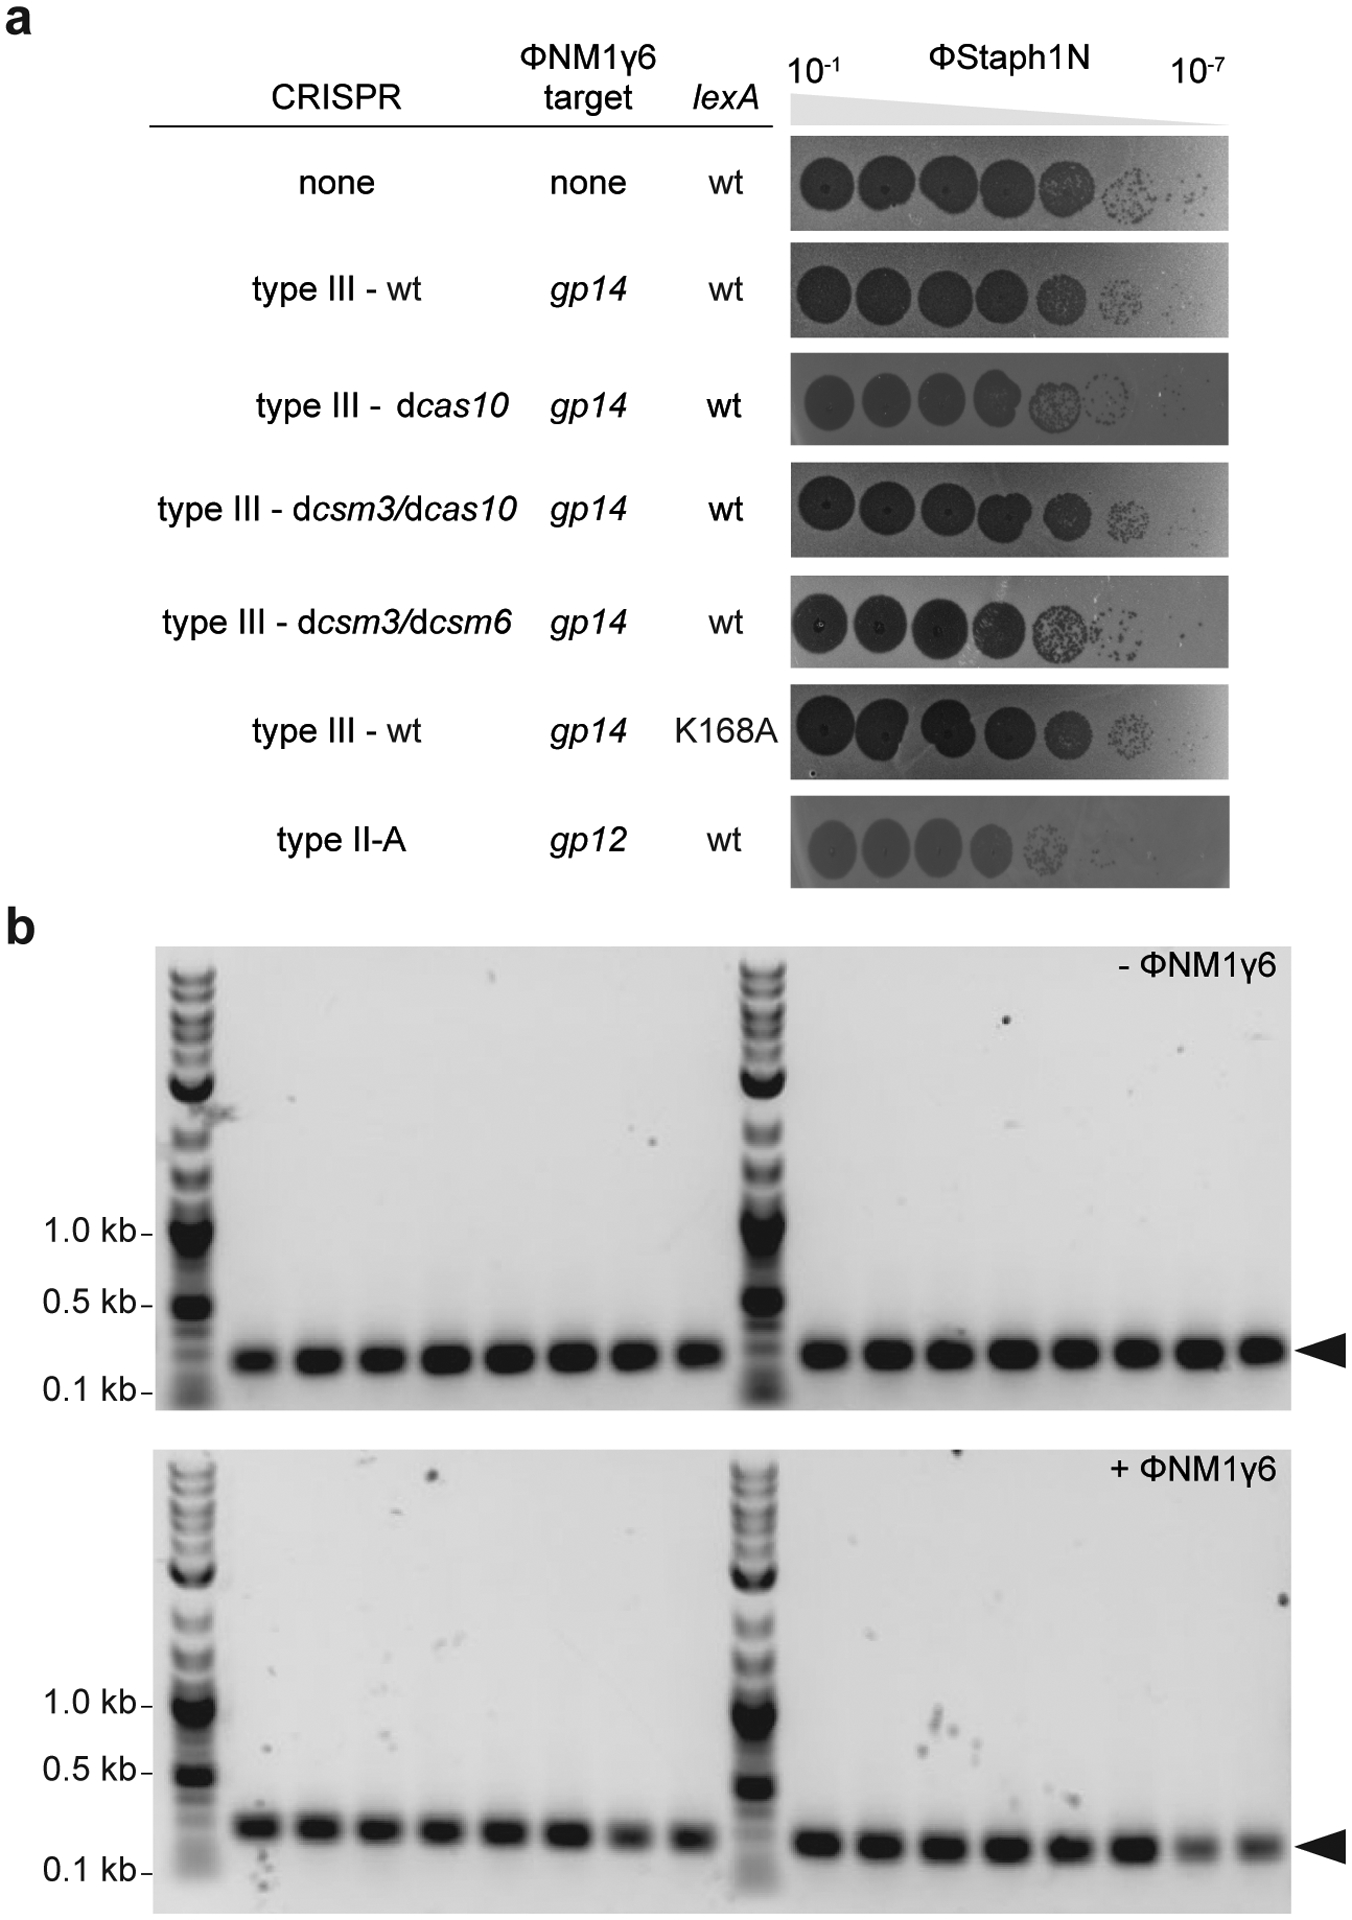
(a) Serial ten-fold dilutions of ϕStaph1N phage were spotted on plates seeded with different strains of staphylococci expressing a gp14-targeting S. epidermidis type III-A system with different mutations, wild-type or (Ind-) LexA, or the S. aureus type II-A system. (b) PCR amplification of the CRISPR arrays of the wild-type pCRISPR plasmid isolated from 16 individual colonies resistant to ϕStaph1N phage that were previously exposed to or not treated with ϕNM1γ6 phage. Molecular markers (in kilobases) are shown on the left; the PCR product of the non-expanded CRISPR array is marked by the arrowhead.
Extended Data Figure 8. Distribution of mutations generated during the type III-A CRISPR-Cas immune response against ϕNM1γ6 phage.
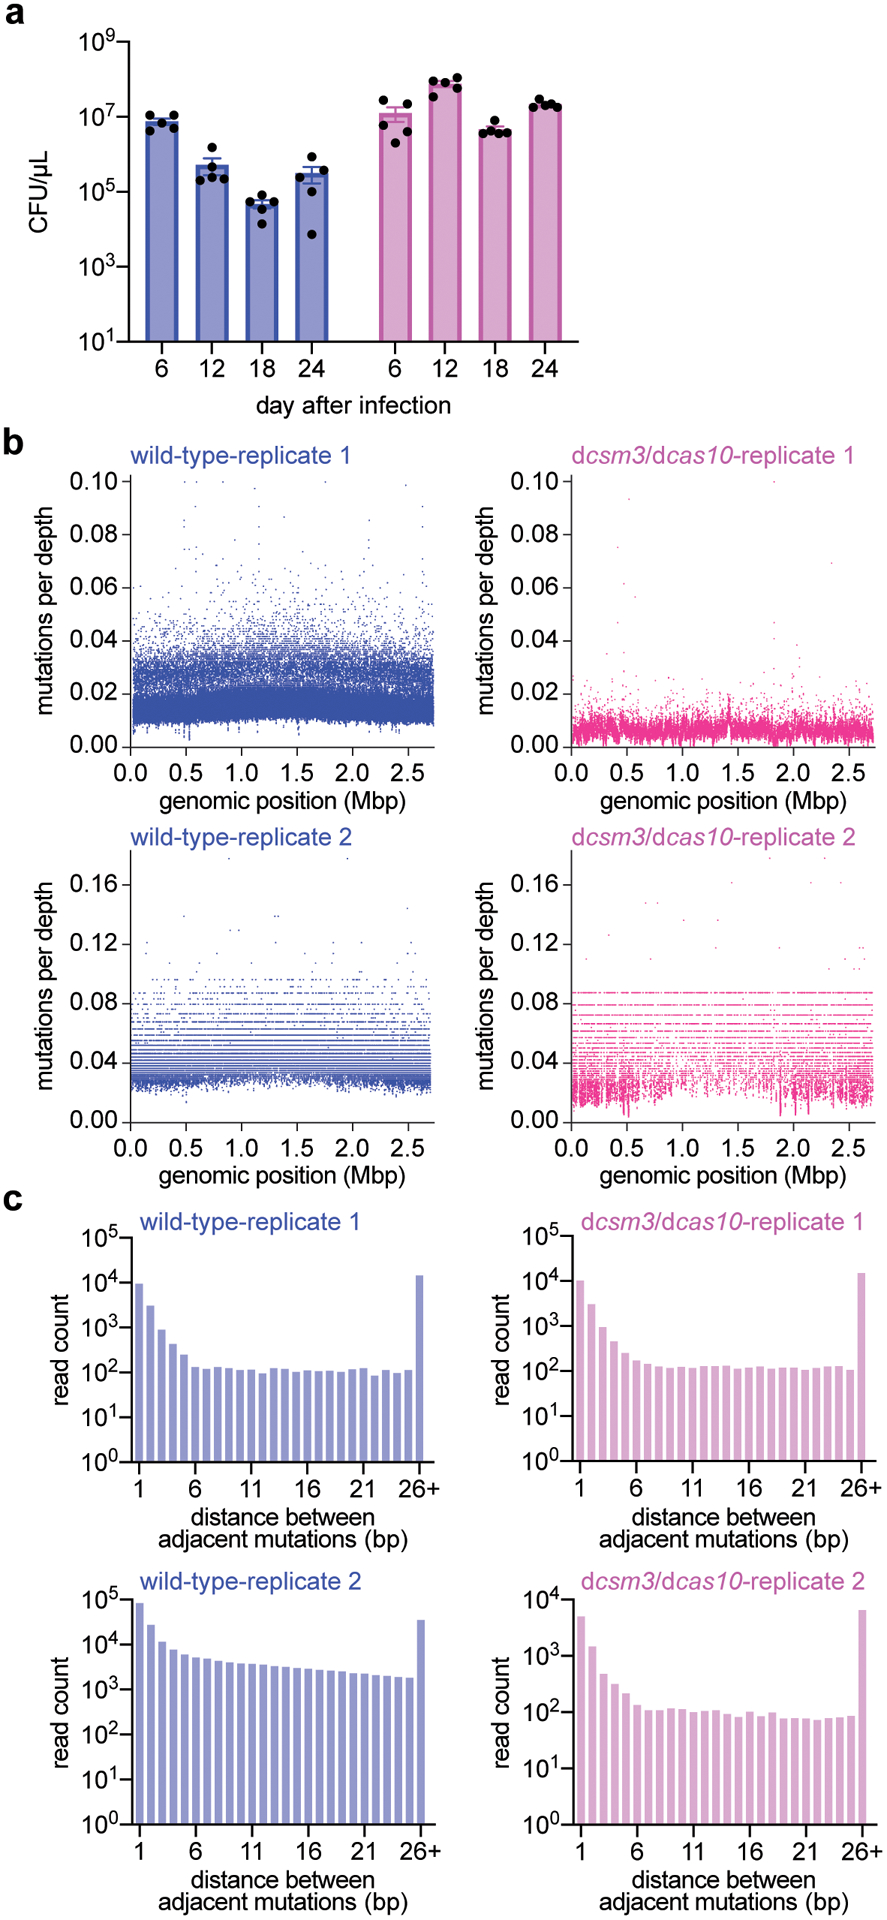
(a) Colony forming units per microliter (CFU/μL) of wild-type and dcas10/dcsm3 cultures after 6, 12, 18 and 24 daily infections with ϕNM1γ6 phage. Bar graphs represent the mean CFU/μL; individual black dots represent the individual values from the 5 independent cultures. (b) Distribution of mutations in the S. aureus TB4 genome of wild-type and dcas10/dcsm3 cells infected daily with ϕNM1γ6 phage after 18 days. Genomic DNA from the cultures was labeled with unique molecular barcodes in order to reduce sequencing errors, subjected to next-generation sequencing and analyzed with the appropriate software for this procedure (https://github.com/Kennedy-Lab-UW/Duplex-Sequencing). Mutations were counted if a particular genomic position possess a minimal depth of 10 reads. The x-axis represents the position within the S. aureus TB4 genome, while the y-axis represents the number of mutations divided by the sequencing depth at that particular position. Replicate 1 shows the data collected from a single wild-type or dcas10/dcsm3 culture, while replicate 2 shows data from the pooled five cultures of each strain. Based on this analysis, the samples do not show an obvious mutational hot spot in the genome. (c) Distance, in base pairs (bp), between adjacent mutations in the S. aureus TB4 genome, calculated from the data obtained in panel (b).
Extended Data Figure 9. Effects of type III-A CRISPR-Cas immunity on self and non-self DNA.
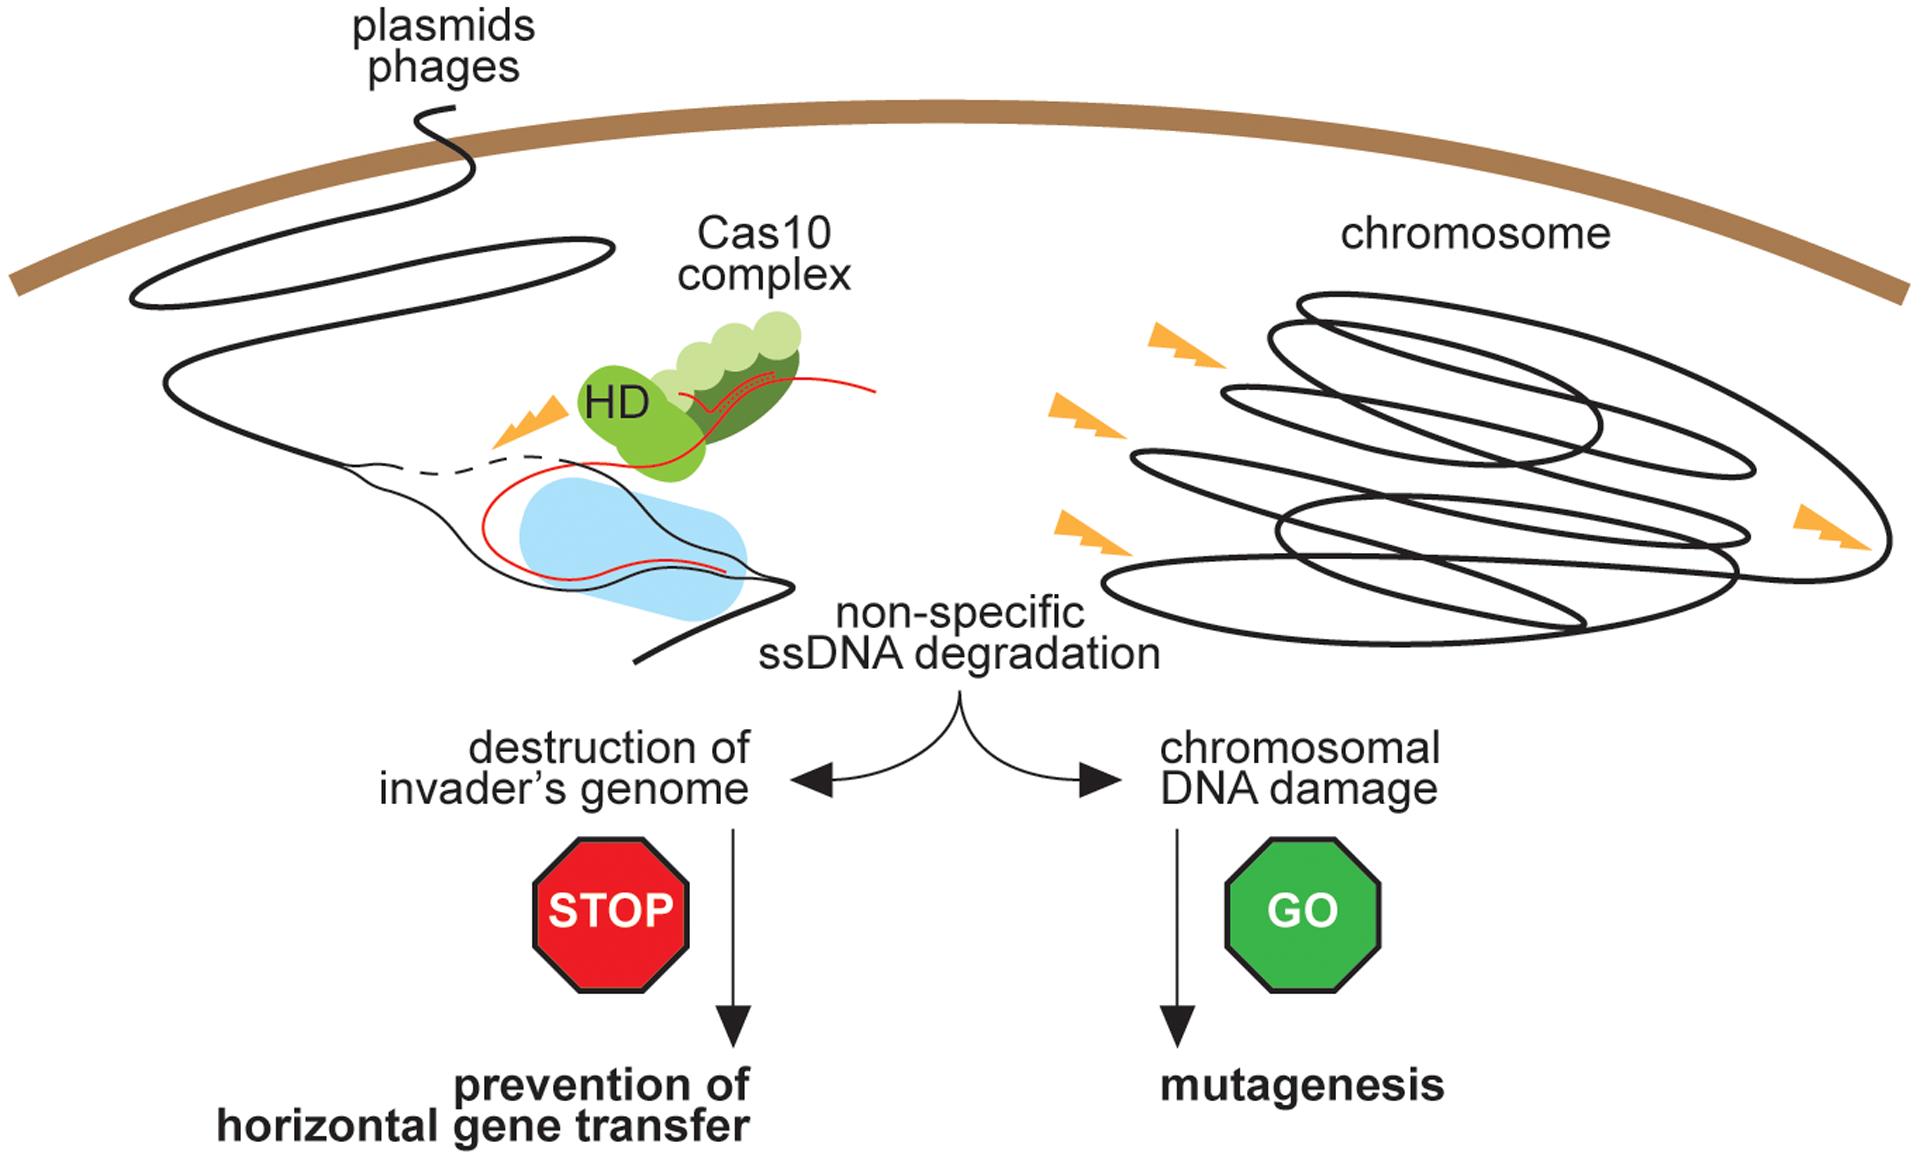
During type III-A CRISPR-Cas immunity the ssDNase activity of Cas10 (HD domain) is activated by the recognition of a target transcript produced by the invading phage or plasmid. On one hand, destruction of foreign DNA by this activity provides immunity and restricts evolution through horizontal gene transfer. On the other hand, non-specific ssDNA degradation can also damage the host chromosome, leading to the induction of the SOS response and error-prone repair, facilitating evolution through mutagenesis.
Extended Data Table 1.
MIC of the resistant staphylococci obtained after activation of the type III-A CRISPR-Cas immune response.
| MIC (μg/ml) regular colonies | MIC (μg/ml) resistant colonies | |
|---|---|---|
| rifampicin | 0.004–0.008 | >0.256 |
| gentamicin | 1–2 | 16–32 |
| vancomycin | 2.0 | 16.0 |
| levofloxacin | 0.125 | 1.0 |
Supplementary Material
Acknowledgments:
We thank David Bikard (Pasteur Institute) for constructing plasmid pDB236. We thank Christine Lai, Nneka Nnatubeugo, and Xiaoyun Qiu of the Rockefeller Genomics Core for their advice on and assistance with the Illumina library preparation procedure. CYM is supported by an NIH NRSA postdoctoral fellowship (1F32GM128271-01). AV is supported by the Arnold O. Beckman Postdoctoral Fellowship. JTR is supported by a Boehringer Ingelheim Fonds PhD fellowship. DVB is supported by an NIH Medical Scientist Training Program grant (T32GM007739) to the Weill Cornell/Rockefeller/Sloan Kettering Tri-Institutional MD-PhD Program. Support for this work comes from the National Institute of Health Director’s Pioneer Award 1DP1GM128184-01 and the Burroughs Wellcome Fund PATH Award to LAM. LAM is an investigator of the Howard Hughes Medical Institute.
Footnotes
Competing interests: L.A.M. is a cofounder and Scientific Advisory Board member of Intellia Therapeutics, and a co-founder of Eligo Biosciences.
Data availability.
The raw data for the DNAseq of the rpoB gene and the staphylococcal genome after daily phage infections performed in this study are found at the NCBI BioProject records PRJNA683580 and PRJNA683848, respectively. Our custom Python script MutPosGraph can be accessed at https://github.com/marraffinilab/Distance-Between-Mutant-Calculator.
References
- 1.Polz MF, Alm EJ & Hanage WP Horizontal gene transfer and the evolution of bacterial and archaeal population structure. Trends Genet. 29, 170–175. [DOI] [PMC free article] [PubMed] [Google Scholar]
- 2.Marraffini LA & Sontheimer EJ CRISPR interference limits horizontal gene transfer in staphylococci by targeting DNA. Science 322, 1843–1845. [DOI] [PMC free article] [PubMed] [Google Scholar]
- 3.Barrangou R et al. CRISPR provides acquired resistance against viruses in prokaryotes. Science 315, 1709–1712. [DOI] [PubMed] [Google Scholar]
- 4.Chen JS et al. CRISPR-Cas12a target binding unleashes indiscriminate single-stranded DNase activity. Science 360, 436–439. [DOI] [PMC free article] [PubMed] [Google Scholar]
- 5.Kazlauskiene M, Tamulaitis G, Kostiuk G, Venclovas C & Siksnys V Spatiotemporal Control of Type III-A CRISPR-Cas Immunity: Coupling DNA Degradation with the Target RNA Recognition. Mol. Cell 62, 295–306. [DOI] [PubMed] [Google Scholar]
- 6.Brouns SJ et al. Small CRISPR RNAs guide antiviral defense in prokaryotes. Science 321, 960–964. [DOI] [PMC free article] [PubMed] [Google Scholar]
- 7.Tang TH et al. Identification of novel non-coding RNAs as potential antisense regulators in the archaeon Sulfolobus solfataricus. Mol. Microbiol 55, 469–481. [DOI] [PubMed] [Google Scholar]
- 8.Garneau JE et al. The CRISPR/Cas bacterial immune system cleaves bacteriophage and plasmid DNA. Nature 468, 67–71. [DOI] [PubMed] [Google Scholar]
- 9.Hale CR et al. RNA-guided RNA cleavage by a CRISPR RNA-Cas protein complex. Cell 139, 945–956. [DOI] [PMC free article] [PubMed] [Google Scholar]
- 10.Makarova KS et al. Evolutionary classification of CRISPR-Cas systems: a burst of class 2 and derived variants. Nat. Rev. Microbiol 18, 67–83. [DOI] [PMC free article] [PubMed] [Google Scholar]
- 11.Goldberg GW, Jiang W, Bikard D & Marraffini LA Conditional tolerance of temperate phages via transcription-dependent CRISPR-Cas targeting. Nature 514, 633–637. [DOI] [PMC free article] [PubMed] [Google Scholar]
- 12.Rostol JT & Marraffini LA Non-specific degradation of transcripts promotes plasmid clearance during type III-A CRISPR-Cas immunity. Nat Microbiol 4, 656–662. [DOI] [PMC free article] [PubMed] [Google Scholar]
- 13.Kazlauskiene M, Kostiuk G, Venclovas C, Tamulaitis G & Siksnys V A cyclic oligonucleotide signaling pathway in type III CRISPR-Cas systems. Science 357, 605–609. [DOI] [PubMed] [Google Scholar]
- 14.Niewoehner O et al. Type III CRISPR-Cas systems produce cyclic oligoadenylate second messengers. Nature 548, 543–548. [DOI] [PubMed] [Google Scholar]
- 15.Jiang W, Samai P & Marraffini LA Degradation of phage transcripts by CRISPR-associated RNases enables type III CRISPR-Cas immunity. Cell 164, 710–721. [DOI] [PMC free article] [PubMed] [Google Scholar]
- 16.Samai P et al. Co-transcriptional DNA and RNA Cleavage during Type III CRISPR-Cas Immunity. Cell 161, 1164–1174. [DOI] [PMC free article] [PubMed] [Google Scholar]
- 17.Liu TY, Liu JJ, Aditham AJ, Nogales E & Doudna JA Target preference of Type III-A CRISPR-Cas complexes at the transcription bubble. Nat Commun 10, 3001. [DOI] [PMC free article] [PubMed] [Google Scholar]
- 18.Didier JP et al. Impact of ciprofloxacin exposure on Staphylococcus aureus genomic alterations linked with emergence of rifampin resistance. Antimicrob. Agents Chemother 55, 1946–1952. [DOI] [PMC free article] [PubMed] [Google Scholar]
- 19.Rosche WA & Foster PL Determining mutation rates in bacterial populations. Methods 20, 4–17. [DOI] [PMC free article] [PubMed] [Google Scholar]
- 20.El Meouche I & Dunlop MJ Heterogeneity in efflux pump expression predisposes antibiotic-resistant cells to mutation. Science 362, 686–690. [DOI] [PMC free article] [PubMed] [Google Scholar]
- 21.Luria SE & Delbruck M Mutations of Bacteria from Virus Sensitivity to Virus Resistance. Genetics 28, 491–511. [DOI] [PMC free article] [PubMed] [Google Scholar]
- 22.Gerrish P A simple formula for obtaining markedly improved mutation rate estimates. Genetics 180, 1773–1778. [DOI] [PMC free article] [PubMed] [Google Scholar]
- 23.Maslowska KH, Makiela-Dzbenska K & Fijalkowska IJ The SOS system: A complex and tightly regulated response to DNA damage. Environ Mol Mutagen 60, 368–384. [DOI] [PMC free article] [PubMed] [Google Scholar]
- 24.Mo CY et al. Systematically Altering Bacterial SOS Activity under Stress Reveals Therapeutic Strategies for Potentiating Antibiotics. mSphere 1. [DOI] [PMC free article] [PubMed] [Google Scholar]
- 25.Slilaty SN & Little JW Lysine-156 and serine-119 are required for LexA repressor cleavage: a possible mechanism. Proc Natl Acad Sci U S A 84, 3987–3991. [DOI] [PMC free article] [PubMed] [Google Scholar]
- 26.Miller JH & Low KB Specificity of mutagenesis resulting from the induction of the SOS system in the absence of mutagenic treatment. Cell 37, 675–682. [DOI] [PubMed] [Google Scholar]
- 27.Lobocka M et al. Genomics of staphylococcal Twort-like phages--potential therapeutics of the post-antibiotic era. Adv. Virus Res 83, 143–216. [DOI] [PubMed] [Google Scholar]
- 28.Ayora S et al. Double-strand break repair in bacteria: a view from Bacillus subtilis. FEMS Microbiol. Rev 35, 1055–1081. [DOI] [PubMed] [Google Scholar]
- 29.Cirz RT et al. Inhibition of mutation and combating the evolution of antibiotic resistance. PLoS Biol. 3, e176. [DOI] [PMC free article] [PubMed] [Google Scholar]
- 30.Pyenson NC, Gayvert K, Varble A, Elemento O & Marraffini LA Broad Targeting Specificity during Bacterial Type III CRISPR-Cas Immunity Constrains Viral Escape. Cell Host Microbe 22, 343–353 e343. [DOI] [PMC free article] [PubMed] [Google Scholar]
- 31.Cao L et al. Identification and functional study of type III-A CRISPR-Cas systems in clinical isolates of Staphylococcus aureus. Int. J. Med. Microbiol 306, 686–696. [DOI] [PubMed] [Google Scholar]
- 32.Diep BA et al. Complete genome sequence of USA300, an epidemic clone of community-acquired meticillin-resistant Staphylococcus aureus. Lancet 367, 731–739. [DOI] [PubMed] [Google Scholar]
- 33.Denamur E et al. Intermediate mutation frequencies favor evolution of multidrug resistance in Escherichia coli. Genetics 171, 825–827. [DOI] [PMC free article] [PubMed] [Google Scholar]
- 34.Wang S, Wang Y, Shen J, Wu Y & Wu C Polymorphic mutation frequencies in clinical isolates of Staphylococcus aureus: the role of weak mutators in the development of fluoroquinolone resistance. FEMS Microbiol. Lett 341, 13–17. [DOI] [PubMed] [Google Scholar]
- 35.Silas S et al. Direct CRISPR spacer acquisition from RNA by a natural reverse transcriptase-Cas1 fusion protein. Science 351, aad4234. [DOI] [PMC free article] [PubMed] [Google Scholar]
- 36.Harrington LB et al. Programmed DNA destruction by miniature CRISPR-Cas14 enzymes. Science. [DOI] [PMC free article] [PubMed] [Google Scholar]
- 37.Gill SR et al. Insights on evolution of virulence and resistance from the complete genome analysis of an early methicillin-resistant Staphylococcus aureus strain and a biofilm-producing methicillin-resistant Staphylococcus epidermidis strain. J. Bacteriol 187, 2426–2438. [DOI] [PMC free article] [PubMed] [Google Scholar]
- 38.Bae T, Baba T, Hiramatsu K & Schneewind O Prophages of Staphylococcus aureus Newman and their contribution to virulence. Mol. Microbiol 62, 1035–1047. [DOI] [PubMed] [Google Scholar]
- 39.Kreiswirth BN et al. The toxic shock syndrome exotoxin structural gene is not detectably transmitted by a prophage. Nature 305, 709–712. [DOI] [PubMed] [Google Scholar]
- 40.Horinouchi S & Weisblum B Nucleotide sequence and functional map of pC194, a plasmid that specifies inducible chloramphenicol resistance. J. Bacteriol 150, 815–825. [DOI] [PMC free article] [PubMed] [Google Scholar]
- 41.Khan SA & Novick RP Complete nucleotide sequence of pT181, a tetracycline-resistance plasmid from Staphylococcus aureus. Plasmid 10, 251–259. [DOI] [PubMed] [Google Scholar]
- 42.Horinouchi S & Weisblum B Nucleotide sequence and functional map of pE194, a plasmid that specifies inducible resistance to macrolide, lincosamide, and streptogramin type B antibodies. J. Bacteriol 150, 804–814. [DOI] [PMC free article] [PubMed] [Google Scholar]
- 43.Morton TM, Johnston JL, Patterson J & Archer GL Characterization of a conjugative staphylococcal mupirocin resistance plasmid. Antimicrob. Agents. Chemother 39, 1272–1280. [DOI] [PMC free article] [PubMed] [Google Scholar]
- 44.Andrews JM Determination of minimum inhibitory concentrations. J. Antimicrob. Chemother 48 Suppl 1, 5–16. [DOI] [PubMed] [Google Scholar]
- 45.Kearse M et al. Geneious Basic: an integrated and extendable desktop software platform for the organization and analysis of sequence data. Bioinformatics 28, 1647–1649. [DOI] [PMC free article] [PubMed] [Google Scholar]
- 46.Wichelhaus TA et al. Biological cost of rifampin resistance from the perspective of Staphylococcus aureus. Antimicrob. Agents Chemother 46, 3381–3385. [DOI] [PMC free article] [PubMed] [Google Scholar]
- 47.Bae T & Schneewind O Allelic replacement in Staphylococcus aureus with inducible counter-selection. Plasmid 55, 58–63. [DOI] [PubMed] [Google Scholar]
- 48.Cirz RT et al. Complete and SOS-mediated response of Staphylococcus aureus to the antibiotic ciprofloxacin. J. Bacteriol 189, 531–539. [DOI] [PMC free article] [PubMed] [Google Scholar]
- 49.Kennedy JJ et al. Demonstrating the feasibility of large-scale development of standardized assays to quantify human proteins. Nat. Methods 11, 149–155. [DOI] [PMC free article] [PubMed] [Google Scholar]
- 50.Gibson DG et al. Enzymatic assembly of DNA molecules up to several hundred kilobases. Nat. Methods 6, 343–345. [DOI] [PubMed] [Google Scholar]
- 51.Husmann LK, Scott JR, Lindahl G & Stenberg L Expression of the Arp protein, a member of the M protein family, is not sufficient to inhibit phagocytosis of Streptococcus pyogenes. Infect. Immun 63, 345–348. [DOI] [PMC free article] [PubMed] [Google Scholar]
- 52.Charpentier E et al. Novel cassette-based shuttle vector system for gram-positive bacteria. Appl. Environ. Microbiol 70, 6076–6085. [DOI] [PMC free article] [PubMed] [Google Scholar]
- 53.Bikard D et al. Exploiting CRISPR-Cas nucleases to produce sequence-specific antimicrobials. Nat. Biotechnol 32, 1146–1150. [DOI] [PMC free article] [PubMed] [Google Scholar]
- 54.Kinnevey PM et al. Emergence of sequence type 779 methicillin-resistant Staphylococcus aureus harboring a novel pseudo staphylococcal cassette chromosome mec (SCCmec)-SCC-SCCCRISPR composite element in Irish hospitals. Antimicrob. Agents Chemother 57, 524–531. [DOI] [PMC free article] [PubMed] [Google Scholar]
Associated Data
This section collects any data citations, data availability statements, or supplementary materials included in this article.
Supplementary Materials
Data Availability Statement
The raw data for the DNAseq of the rpoB gene and the staphylococcal genome after daily phage infections performed in this study are found at the NCBI BioProject records PRJNA683580 and PRJNA683848, respectively. Our custom Python script MutPosGraph can be accessed at https://github.com/marraffinilab/Distance-Between-Mutant-Calculator.


