Abstract
Background.
The residual lifetime risk (RLR) of developing heart failure (HF) may have changed over time due to the increasing population burden of hypertension, obesity, and diabetes, greater survival after myocardial infarction (MI), and a greater lifespan.
Objective.
We assessed changes in the RLR for HF in two 25-year epochs (1965-1989; 1990-2014).
Methods.
We compared the RLR of HF at age 50 (adjusting for competing risk of death) in the two epochs in Framingham Study participants overall, and in the following strata: sex, body mass index (BMI), blood pressure (BP), and diabetes.
Results:
Mean life expectancy increased from 75.9 to 82.1 years in women and 72.5 to 78.1 years in men. We observed 624 HF events over 111,351 person-observations in epoch 1, and 875 HF events over 128,903 person-observations in epoch 2. The mean age at onset of HF increased across the epochs by 6.6 (women) to 7.7 (men) years. The RLR of HF at age 50 increased across epochs from 18.86 to 22.55 percent (absolute increase 3.69, 95% CI 0.90-6.49, p=0.01) in women, and from 19.19 to 25.25 percent (absolute increase 6.06, 95% CI 3.08-9.04, p<0.001) in men. The increase in RLR of HF in the second epoch was consistent across strata with excess BMI or higher BP (relative increase of 28-47%) and in participants without prior MI (relative increase of 23%).
Conclusions.
The RLR of HF has increased in our community-based sample of white individuals over the last five decades, possibly due to an increase in life expectancy.
Keywords: Heart failure, lifetime risk, epidemiology, cohort studies, period effects
Condensed abstract
We investigated whether the residual lifetime risk of developing heart failure has changed over the last five decades (1965-2014). We observed that the residual lifetime risk of heart failure at age 50 years is 22.55 (women) to 25.25% (men) in the recent period 1990-2014; this represents an absolute increase of 3.69 (95%CI 0.90-6.49) in women and 6.06 (95%CI 3.08-9.04) in men from the earlier period (residual lifetime risk of heart failure 18.86% in women and 19.19% in men during the period 1965-1989). The rising lifetime risk of heart failure is likely due to an increase in life expectancy over time.
Introduction
Heart failure (HF) affects 64 million people worldwide, including 6 million in the United States (1,2). The national burden of HF is estimated to increase by 25% to about 8 million by 2030 (3). Prevention of HF, therefore, is a major public health priority (4,5).
Preventing HF requires promoting public awareness of the disease risk; such heightened awareness of their risk may motivate people to adopt healthier lifestyles and manage their risk factor profiles effectively (5). In this context, the residual lifetime risk (RLR) statistic is a valuable communication tool that offers quantitative information regarding the absolute risk of developing a disease over an individual’s lifecourse (6–8). Furthermore, estimating the RLR of a disease in pre-defined subgroups may facilitate the targeting of high-risk groups with preventive measures (9). Hence, recent investigations have reported on the RLR of HF, typically based on community-based cohort studies or administrative databases (10–16).
Data on temporal changes in the RLR of developing HF are lacking, however, in part because such data require serial observations of population-based samples performed over much more extended periods. Moreover, changes in RLR (of diseases) can serve as public health indicators that may guide preventive public health measures (17).
Accordingly, we leveraged the longitudinal surveillance for HF (using the same criteria consistently (18)) and the excellent follow-up of the Framingham Heart Study (FHS) cohorts (19) over five decades (1965-2014) to assess the change in the RLR of HF at age 50 years. We hypothesized that a greater life expectancy, an increasing population burden of HF risk factors such as high blood pressure (BP) (20), excess body mass index (BMI) (21), presence of diabetes (22), major advances in the management of coronary heart disease (with antiplatelet and cholesterol-lowering drugs) and acute coronary syndromes (with percutaneous interventions and thrombolysis), and a greater survival post-myocardial infarction (MI) (23) might result in an increase in the RLR of HF in the recent decades. Conversely, it is conceivable that better rates of control of high blood pressure (20) and dyslipidemia (24) over these decades may mitigate HF burden.
Methods
Study Samples
We used data from all FHS cohorts from 1965 through 2014. The design and sampling of the FHS cohorts and their accompanying minority cohorts have been described previously (19,25–28). FHS cohorts are examined every two (original cohort) or four to eight years (all other cohorts) (19). Participants provided written informed consent to participate in the core study protocols approved by the Institutional Review Board at the Boston University Medical Center.
Time Windows (Epochs)
The first epoch spanned from January 1, 1965, to December 31, 1989 and the second epoch from January 1, 1990, to December 31, 2014. The year 1990 was chosen as a transition point because HF incidence has been reported to decline after the mid-1990s (29).
Selection of Study Samples
For both epochs, participants were considered eligible if they were at least 50 years of age but not older than 94 years of age, participated in an FHS examination during the specific epoch, and were followed up during that epoch for incident HF. Participants ‘entered’ the investigation at the start of the epoch if they were already age 50 years or more, or when they turned 50 years during that epoch. Individuals without HF during an epoch were censored either at the age of 94 or at the end of the epoch, whichever occurred first. Thus, a participant who is 70 years old at the start of an epoch and free of HF can contribute 25 years of observation during the epoch— the individual can provide a total of 45 years of follow-up after age 50 years. Thus, we can estimate the 30-year, the 40-year incidence after age 50, and the RLR of HF at age 50 within each epoch even though the period is 25 years.
We excluded participants if they had a history of HF before entering an epoch; they did not attend an examination between age 45 and 54, or did not have follow-up within the epoch. Supplemental Figure 1 displays the sample size derivation in the two epochs. In the first epoch, eligible participants were from the Original (Generation 1) and the Offspring (Generation 2) cohorts. The second epoch included participants from the Original, Offspring, and the Third Generation, Omni-1, and Omni-2 cohorts.
Definitions of risk factor strata
At each examination, all attendees underwent anthropometry, BP measurements, and laboratory assessment of risk factors (after an overnight fast) using standardized protocols (19). Body mass index (BMI) categories were defined as 1) Normal, ≥18.5 kg/m2 but <25 kg/m2; 2) Overweight, ≥25 kg/m2 but <30 kg/m2; and 3) Obese, ≥30 kg/m2 (30). We defined BP categories as 1) Normal: systolic BP<130 mmHg and diastolic BP<80 mmHg and not receiving antihypertensive therapy; 2) Intermediate: systolic BP ≥130 mmHg but <140 mmHg or diastolic BP ≥80 mmHg but <90 mmHg and not receiving antihypertensive therapy; and 3) Hypertension: systolic BP ≥140 mmHg or diastolic BP≥90 mmHg or receiving antihypertensive therapy (31). We chose a definition of hypertension prevalent in the epochs evaluated. Diabetes mellitus was defined as fasting glucose ≥126 mg/dL or non-fasting glucose ≥200 mg/dL, or the use of hypoglycemic medications (32).
Heart Failure Outcomes
FHS participants are under continuous surveillance for the development of HF. Suspected HF events are adjudicated by a three-physician panel that reviews all medical records. A definitive diagnosis of HF is made in the presence of two major criteria, or one major and two minor criteria (Supplemental Table 1) (18). The FHS HF criteria have been shown to have reasonable sensitivity and specificity (33).
In the more recent epoch (1990-2014) and for participants who developed new-onset HF, we evaluated their left ventricular ejection fraction (LVEF) data closest to and within six months after the HF event. We evaluated HF with a reduced LVEF (HFrEF) defined as the presence of an LVEF<50%, and HF with a preserved LVEF (HFpEF) characterized by an LVEF≥50% (34). Participants with HF but without information on LVEF were classified as ‘HF unknown ejection fraction.’
Statistical Methods
We compared the estimates for RLR of HF at age 50, overall and stratified by sex, BMI category, BP category, and diabetes status. Mortality-adjusted cumulative incidence and RLR of HF at age 50 were estimated using methods detailed by Beiser et al. (6). The method uses survival age as the time scale and age at entry into the study (50 years) as the left-truncation variable in each epoch. Hazard ratios (HR) and P values from Wald chi-square tests were estimated using Fine-Gray sub-distribution hazards models, adjusted for competing risk of death (35). We repeated the analyses mentioned in participants without antecedent MI (36).
RLR of HF by cumulative risk factor burden
We also analyzed the RLR of HF at age 50 according to cumulative risk factor burden. Participants received scores for their BMI category (0, 1 and 2 for normal BMI, overweight, and obesity, respectively), BP category (0, 1 and 2 for normal BP, intermediate BP, and hypertension, respectively), diabetes status (0=no, 1=yes), and prevalent MI (0=no, 1=yes). Three risk score strata were defined empirically as 0-1 (low), 2-3 (intermediate), or 4-6 (high risk).
Comparisons of the RLR of HF and hazards ratios for HF associated with risk factor strata across epochs
RLR estimates of HF at age 50 in strata within a given calendar period and across the two epochs were compared using a z test. The Fine-Gray regression models compared the risk of developing HF among participants in risk factor strata within an epoch (e.g., risk of HF in overweight versus normal BMI in epoch 1), and for comparing HF incidence in a specific risk factor stratum across epochs (e.g., HF risk in overweight in epoch 1 versus overweight in epoch 2). The assumption of proportionality of hazards was met in all models.
Additional analyses
We compared the overall mean survival and the mean age at onset of HF in each epoch. We performed sensitivity analyses limiting our samples to white FHS participants only, excluding minority Omni cohort participants. We assessed if the distribution of individual major and minor criteria for the diagnosis of HF in the two epochs had changed across epochs because of increased physician awareness and greater availability of diagnostic testing.
RLR of HF subtypes in the second epoch
We assessed the RLR (at age 50) of developing HFpEF and HFrEF overall and within the risk factor strata for the second epoch. Too few individuals in the first epoch had an evaluation of LVEF close to the HF event to permit the assessment of HF subtypes. In these analyses, competing events included death, HF subtype undetermined, and HF subtype other than the subtype of interest.
Statistical significance
A two-tailed P value less than 0.05 was considered statistically significant.
Results
Sample characteristics at age 50 years in each epoch are presented in Table 1. Mean BMI and mean fasting blood glucose concentrations, proportions with obesity and diabetes, and percentages using antihypertensive, cholesterol-lowering, and diabetes medications rose in the second epoch compared to the first epoch (P<0.001 for all). However, the rates of smoking, the proportion of people with hypertension and prior MI, and the mean values of BP and serum cholesterol concentrations were lower in the second epoch than the first epoch (P<0.001 for all).
Table 1.
Participant characteristics at age 50 years according to observation epoch
| Epoch 1 (1965-1989) | Epoch 2 (1990-2014) | P valued¶ | |
|---|---|---|---|
|
| |||
| Number at risk | 7500 | 9540 | - |
|
| |||
| Age, years | 47.6±2.6 | 47.6±2.4 | 0.41 |
|
| |||
| Women | 4063 (54.2) | 5318 (55.8) | 0.041 |
|
| |||
| Body mass index, kg/m2 | 26.1±4.2 | 26.8±5.0 | <0.001 |
|
| |||
| Body mass categories | |||
| Normal | 2743 (43.3) | 3307 (40.6) | <0.001 |
| Overweight | 2619 (41.3) | 3164 (38.9) | |
| Obese | 973 (15.4) | 1671 (20.5) | |
|
| |||
| Systolic blood pressure, mmHg | 130±19 | 123±16 | <0.001 |
|
| |||
| Diastolic blood pressure, mmHg | 83±11 | 79±10 | <0.001 |
|
| |||
| Hypertensive medication | 327 (7.5) | 789 (10.4) | <0.001 |
|
| |||
| Blood pressure categories | |||
| Normal | 2033 (31.8) | 3712 (45.2) | <0.001 |
| Intermediate | 2159 (33.7) | 2360 (28.7) | |
| Hypertensive | 2208 (34.5) | 2148 (26.1) | |
|
| |||
| Blood glucose, mg/dL* | 89±21 | 94±20 | <0.001 |
|
| |||
| Diabetes medication | 65 (1.0) | 131 (1.6) | 0.002 |
|
| |||
| Diabetes mellitus status | |||
| Normal | 6094 (98.6) | 7868 (97.4) | <0.001 |
| Diabetes mellitus | 86 (1.4) | 212 (2.6) | |
|
| |||
| Total cholesterol, mg/dL | 228±43 | 210±41 | <0.001 |
|
| |||
| Total/HDL | 4.7±1.8 | 4.2±1.7 | <0.001 |
|
| |||
| Lipid-lowering medication | 37 (0.9) | 375 (5.2) | <0.001 |
|
| |||
| Current smoker | 2875 (47.4) | 2411 (29.6) | <0.001 |
|
| |||
| Prior myocardial infarction† | 1071 (14.2) | 971 (10.2) | <0.001 |
|
| |||
| Non-white participants | 0 | 684 (7.2%) | - |
Values are mean±SD or N (%).
Note that frequencies for some risk factors are smaller than the total sample size due to a combination of data not collected at a particular exam or participants missed exams during the eligible age of 50 years.
Includes fasting and non-fasting.
Myocardial infarction before entry into a time window entry or to survival age during the time window.
2-sample T-test for continuous variables and the chi-Square test for categorical variables.
RLR of HF in Epoch 1 versus Epoch 2
We accrued 111,351 person-years (64,013 in women) and 128,903 person-years (72,931 in women) of follow-up for epochs 1 and 2, respectively. The median follow-up ranged from 20 (men) to 23 (women) years in the first epoch, and from 18 (women) to 19 (men) years in the second epoch. Approximately 8.3% and 9.2% of participants developed HF in epoch 1 and 2, respectively, with corresponding incidence rates of 5.60/1000 person-years and 6.79/1000 person-years. The mean age at onset of HF in the first epoch was 70.7 (SD 9.2) years in men and 74.7 (SD 9.5) years in women, whereas the life expectancy was 72.5 (SD 9.7) years in men and 75.9 (SD 10.0) in women. Corresponding data in the second epoch were as follows: mean age of onset of HF, 77.9 (SD 9.6) years in men and 81.3 (SD 8.8) years in women; life expectancy, 78.1 (SD 9.9) years in men and 82.1 (SD 9.4) years in women.
Figure 1 shows the mortality-adjusted cumulative incidence of HF by sex (Panels A-B), BMI (Panels C-D), BP (Panels E-F), and diabetes strata (Panels G-H) in the two epochs. In the second epoch, HF occurred later in life and incidence continued to rise into the ninth decade. Table 2 summarizes the mortality-adjusted cumulative incidence of HF on follow-up for 30 years, 40 years, and RLR for both epochs. Compared to the first epoch, the 30-year risk of HF was lower in the second epoch overall and for most risk factor subgroups, but the 40-year risk of HF rose in the second epoch all strata. The RLR of HF at age 50 increased from the first to the second epoch in both sexes (absolute increase in women, 3.69, 95% CI 0.90-6.49, p=0.01; in men, 6.06, 95% CI 3.08-9.04, p<0.001) overweight (absolute increase 8.14, 95% CI 4.61-11.66, p<0.001) and obese people (absolute increase 9.77, 95% CI 3.46-16.08, p=0.002) and those with intermediate BP (absolute increase 7.78, 95% CI 4.03-11.54, p<0.001) or hypertension (absolute increase 6.65, 95% CI 1.73-11.57, p=0.008).
Figure 1. Mortality-adjusted cumulative incidence of heart failure at age 50 years.
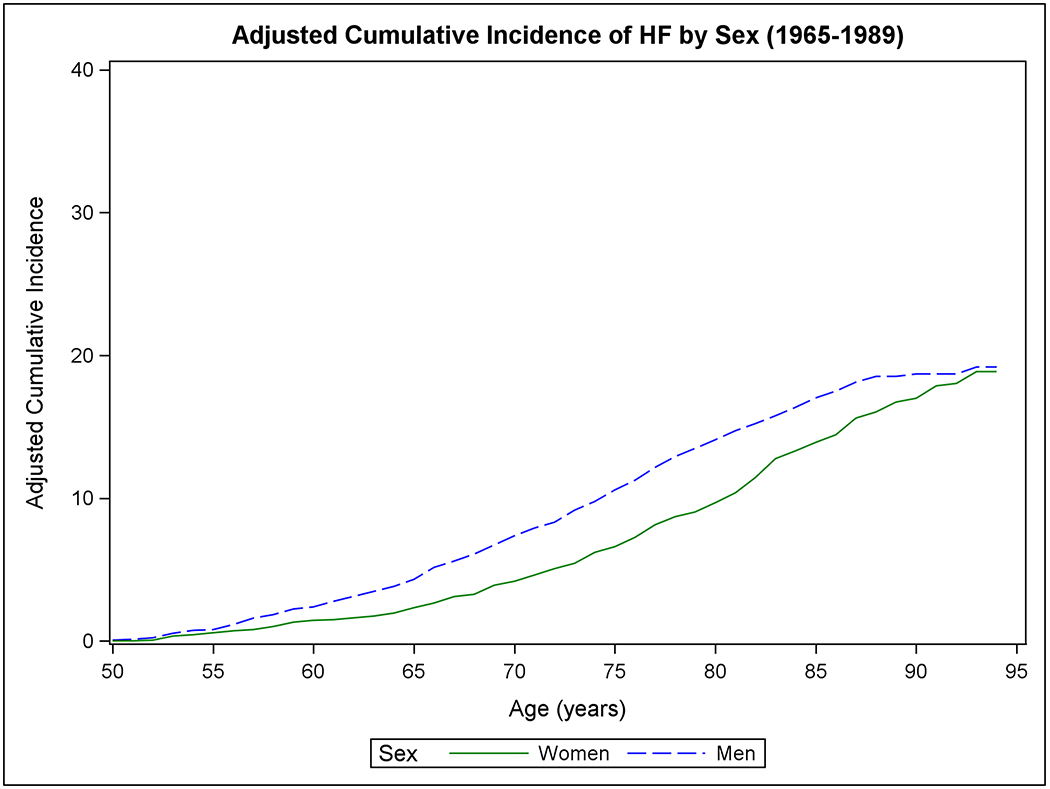
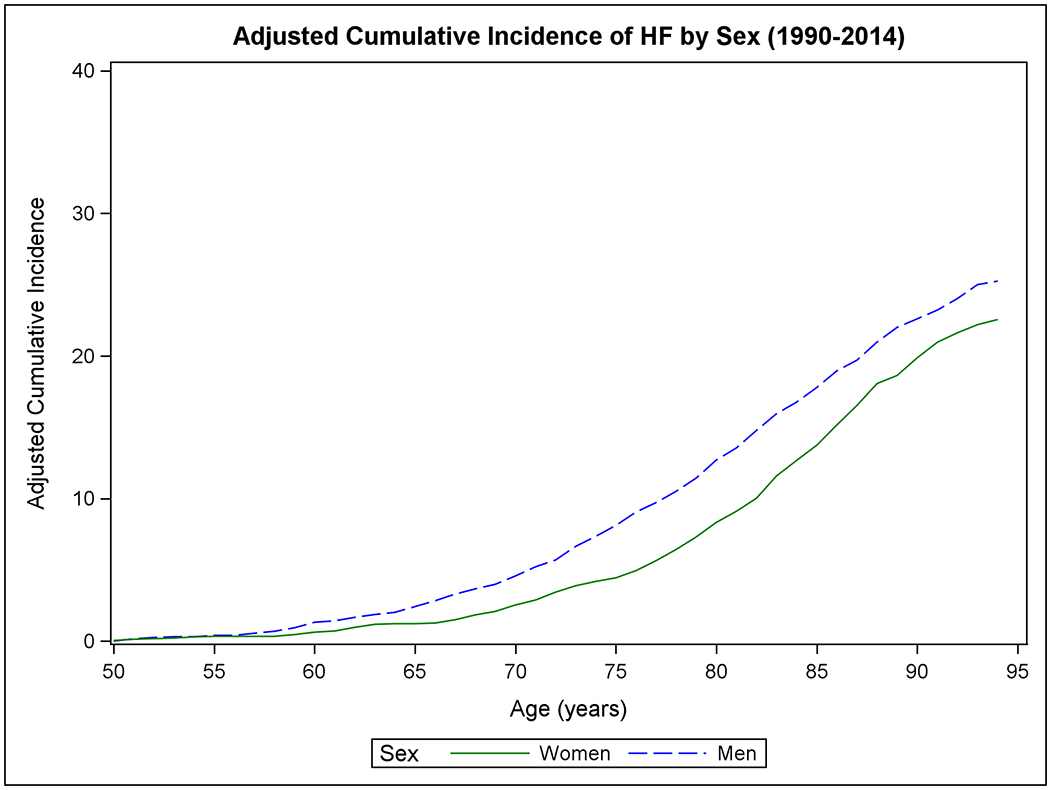
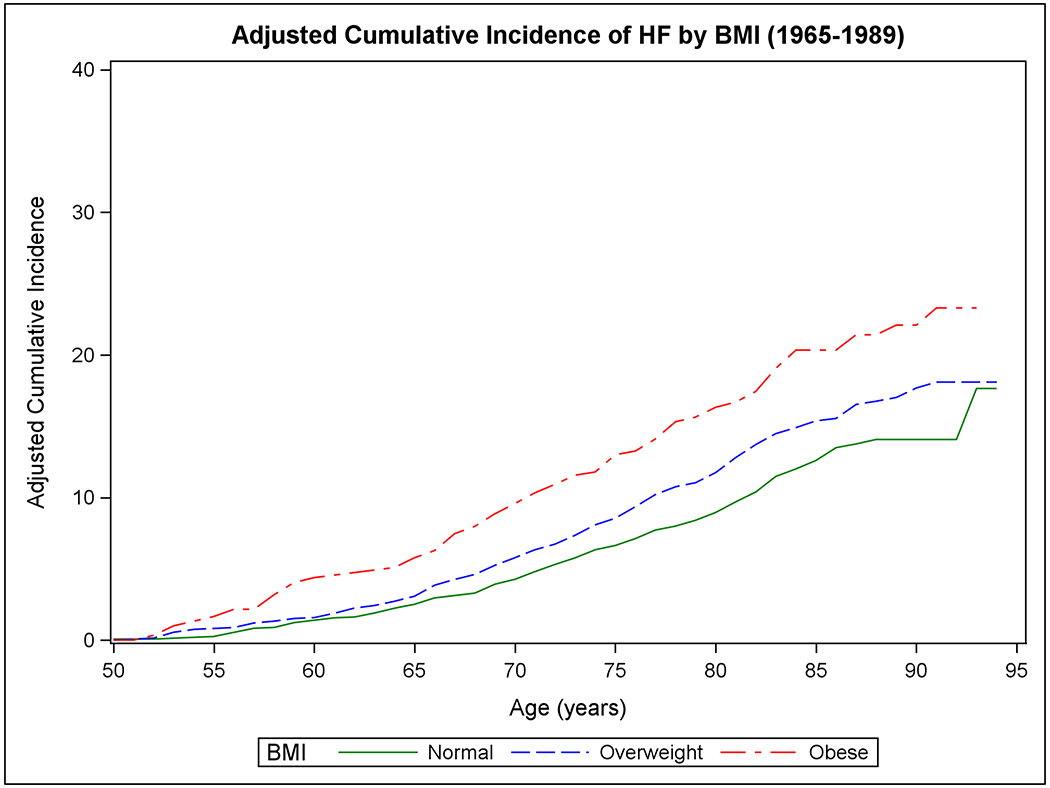
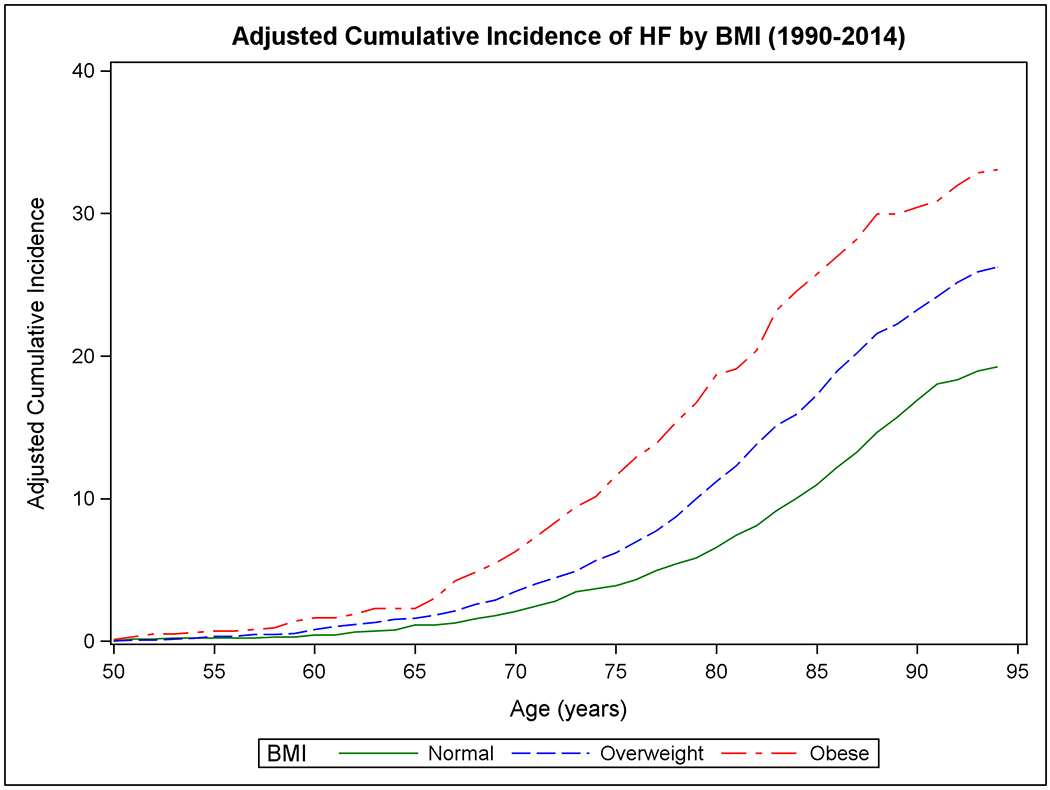
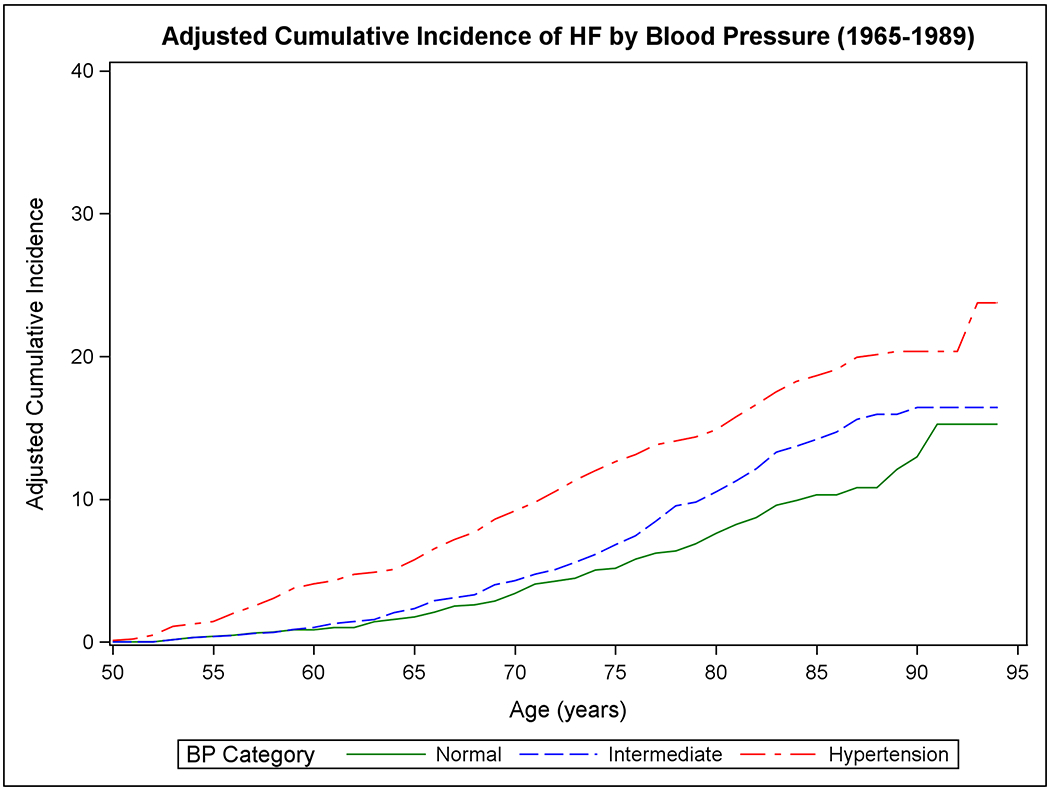
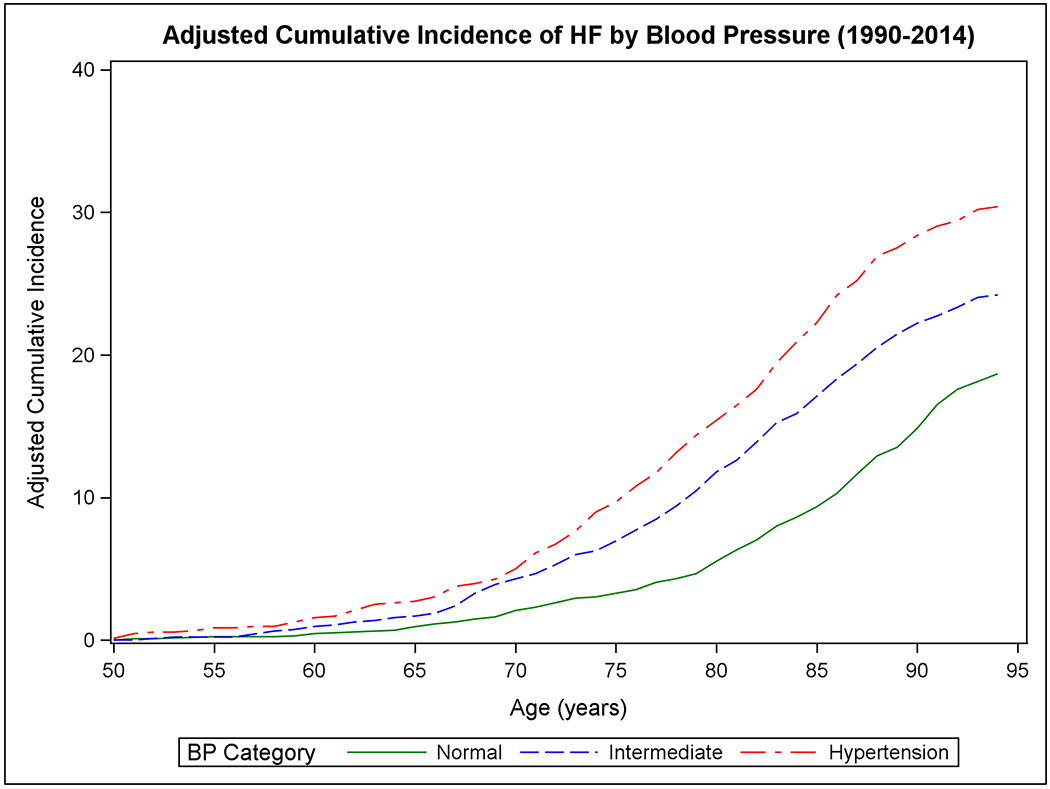
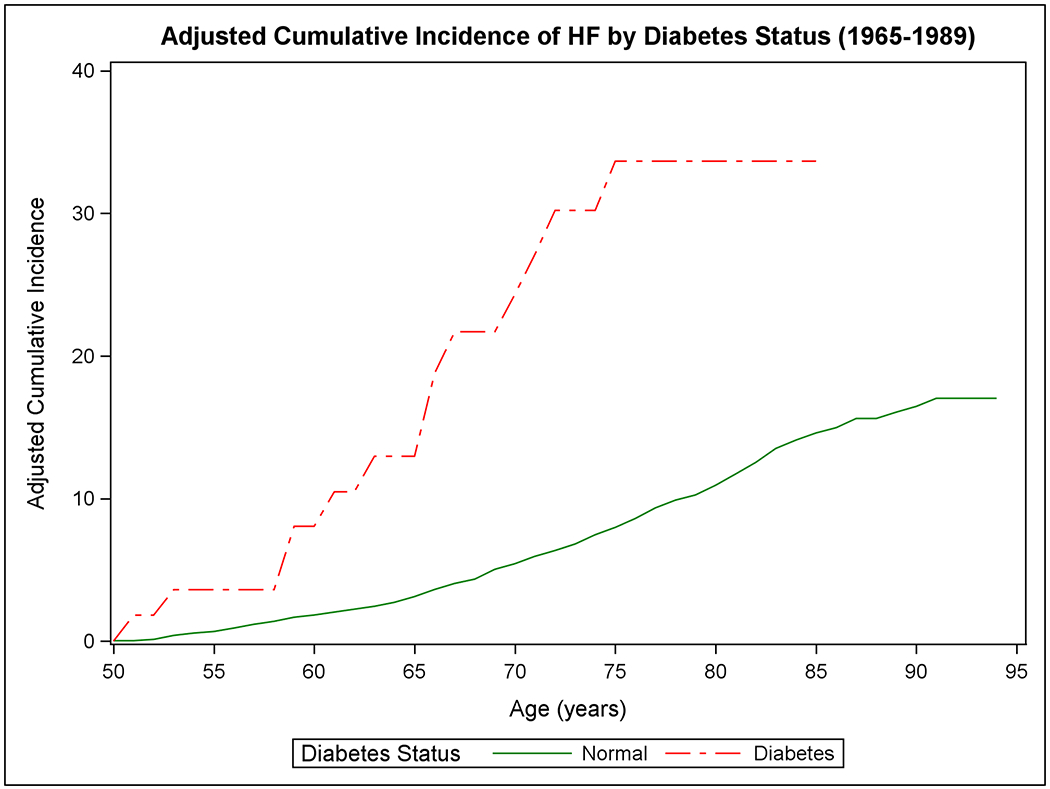
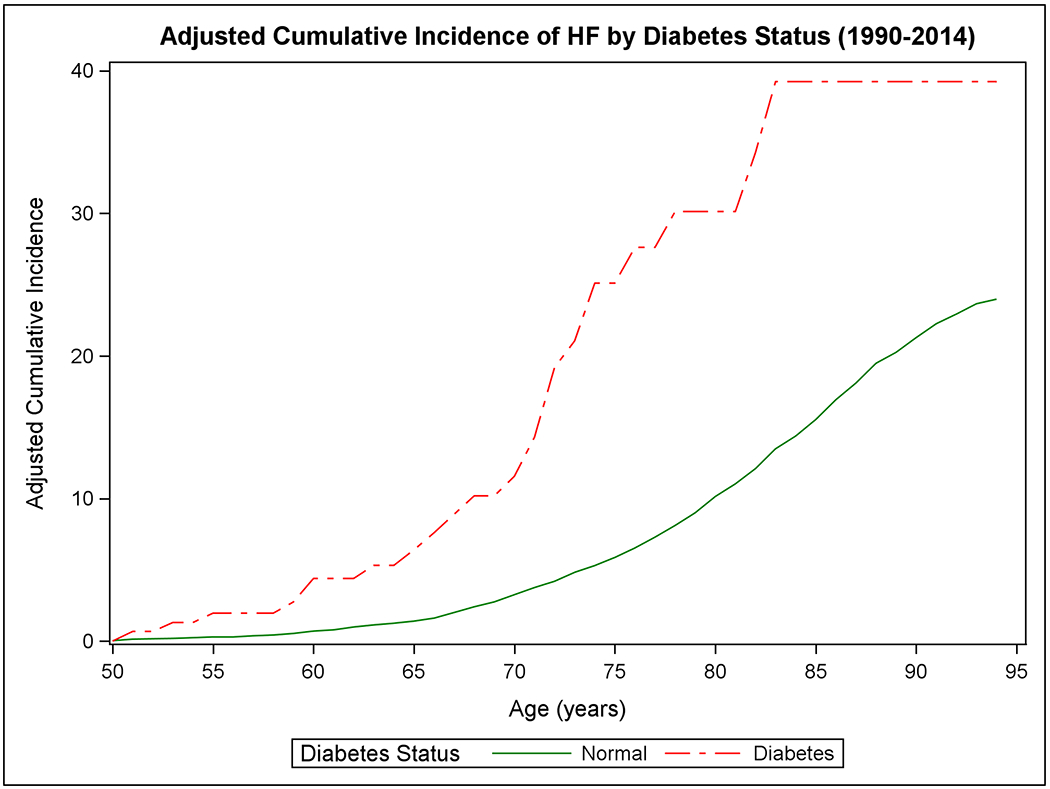
The cumulative incidence of heart failure in the two epochs is displayed by sex in Panels A-B, by BMI categories in Panels C-D, according to BP groups in Panels E-F, and by diabetes status in Panels G-H.
Table 2.
Cumulative incidence of HF at age 50 across two epochs according to risk factor strata
| Adjusted cumulative incidence, % (95% CI), 1965-1989, Epoch 1 | Adjusted cumulative incidence, % (95% CI), 1990-2014, Epoch 2 | RLR Rate ratio Epoc h2/Epoch 1, P | ||||||
|---|---|---|---|---|---|---|---|---|
| 30-year | 40-year | Lifetime (RLR) | 30-year | 40-year | Lifetime (RLR) | |||
| Overall | N/Pyr | 458/102596 | 608/110715 | 624/111351 | 367/109961 | 758/126183 | 875/128903 | |
| ACI | 11.03 (10.07-11.99) | 17.54 (16.19-18.88) | 19.03 (17.52-20.53) | 9.26 (8.36-10.17) | 20.14 (18.86-21.43) | 23.68 (22.30-25.05) | 1.24 P<0.001 | |
| Sex | ||||||||
| Women | N/Pyr | 206/57921 | 304/63512 | 317/64013 | 152/60391 | 379/70916 | 455/72931 | |
| ACI | 9.03 (7.85-10.22) | 16.73 (14.90-18.57) | 18.86 (16.75-20.98) | 7.31 (6.18-8.43) | 18.63 (16.93-20.33) | 22.55 (20.73-24.38) | 1.20, P=0.010 | |
| Men | N/Pyr | 252/44676 | 304/47205 | 307/47338 | 215/49571 | 379/55268 | 420/55972 | |
| ACI | 13.49 (11.92-15.06) | 18.53 (16.54-20.52) | 19.19 (17.09-21.29) | 11.44 (9.99-12.88) | 22.01 (20.03-23.98) | 25.25 (23.14-27.36) | 1.32 P<0.001 | |
| P | <0.001 | 0.19 | 0.83 | <0.001 | 0.011 | 0.06 | ||
| BMI category | ||||||||
| Normal | N/Pyr | 131/40971 | 166/43382 | 169/43490 | 82/38016 | 228/45585 | 277/46975 | |
| ACI | 8.40 (7.00-9.81) | 14.07 (11.77-16.37) | 17.65 (13.34-21.95) | 5.83 (4.60-7.05) | 15.70 (13.83-17.57) | 19.24 (17.20-21.28) | 1.09 P=0.51 | |
| Overweight | N/Pyr | 164/37148 | 209/39601 | 212/39690 | 133/37156 | 287/42680 | 335/43583 | |
| ACI | 11.04 (9.42-12.66) | 17.02 (14.71-19.32) | 18.10 (15.53-20.66) | 9.98 (8.37-11.60) | 22.23 (19.96-24.50) | 26.24 (23.82-28.65) | 1.45 P<0.001 | |
| Obese | N/Pyr | 81/12716 | 96/13313 | 97/13338 | 103/19309 | 162/20835 | 176/21054 | |
| ACI | 15.64 (12.42-18.87) | 22.09 (17.77-26.41) | 23.09 (18.49-28.10) | 16.71 (13.71-19.72) | 29.95 (25.98-33.93) | 33.07 (28.97-37.16) | 1.43 P=0.002 | |
| P Overweight vs. normal | 0.016 | 0.08 | 0.86 | <0.001 | <0.001 | <0.001 | ||
| P Obese vs. normal | <0.001 | 0.001 | 0.09 | <0.001 | <0.001 | <0.001 | ||
| BP category | ||||||||
| Normal | N/Pyr | 70/29389 | 87/30875 | 90/30942 | 64/44377 | 160/50279 | 209/51253 | |
| ACI | 6.88 (5.27-8.48) | 12.09 (9.02-15.16) | 15.25 (10.73-19.77) | 4.65 (3.52-5.79) | 13.52 (11.54-15.49) | 18.67 (16.36-20.99) | 1.22 P=0.19 | |
| Intermediate | N/Pyr | 116/32652 | 147/34485 | 148/34553 | 114/26545 | 249/31979 | 281/32927 | |
| ACI | 9.79 (8.05-11.54) | 15.94 (13.25-18.64) | 16.42 (13.59-19.25) | 10.47 (8.65-12.30) | 21.46 (19.09-23.83) | 24.21 (21.74-26.68) | 1.47 P<0.001 | |
| Hypertension | N/Pyr | 194/29805 | 243/31999 | 246/32085 | 140/24367 | 268/27805 | 298/28417 | |
| ACI | 14.36 (12.47-16.25) | 20.35 (17.94-22.75) | 23.75 (19.77-27.73) | 14.38 (12.17-16.58) | 27.52 (24.71-30.33) | 30.40 (27.52-33.29) | 1.28 P=0.008 | |
| P Intermediate vs. Normal | 0.016 | 0.064 | 0.67 | <0.001 | <0.001 | <0.001 | ||
| P Hypertension vs. Normal | <0.001 | <0.001 | <0.001 | <0.001 | <0.001 | <0.001 | ||
| Diabetes Status | ||||||||
| Normal | N/Pyr | 350/88180 | 435/93206 | 439/93357 | 292/91510 | 642/105777 | 752/108237 | |
| ACI | 10.25 (9.21-11.29) | 16.06 (14.48-17.64) | 17.03 (15.21-18.86) | 9.00 (8.01-9.99) | 20.26 (18.85-21.66) | 23.98 (22.49-25.48) | 1.41 P<0.001 | |
| Diabetes | N/Pyr | 13/798 | - | - | 22/2386 | 24/2434 | 24/2438 | |
| ACI | 33.67 (18.40-48.93) | - | - | 30.13 (18.60-41.66) | 39.24 (24.47-54.02) | 39.24 (24.47-54.02) | - | |
| P Diabetes vs. Normal | 0.003 | - | - | <0.001 | 0.012 | 0.044 | ||
| Cumulative Risk factor burden * | ||||||||
| Low* | N/PYrs | 92/39395 | 120/41396 | 122/41447 | 86/46913 | 220/54590 | 279/55928 | |
| ACI | 6.86 (5.47-8.26) | 12.35 (9.85-14.85) | 14.22 (10.66-17.78) | 5.50 (4.37-6.64) | 14.83 (13.02-16.65) | 19.35 (17.30-22.40) | 1.36 P=0.014 | |
| Intermediate* | N/PYrs | 204/41298 | 248/43924 | 250/44008 | 150/36251 | 336/42097 | 381/43101 | |
| ACI | 12.00 (10.43-13.57) | 17.11 (15.01-19.21) | 17.85 (15.54-20.16) | 10.79 (9.16-12.42) | 23.85 (21.63-26.08) | 27.07 (24.75-29.40) | 1.52 P<0.001 | |
| High* | N/PYrs | 63/7341 | 75/7706 | - | 78/9974 | 110/10628 | 116/10731 | |
| ACI | 18.61 (14.40-22.81) | 25.33 (20.03-30.63) | - | 22.51 (18.01-27.02) | 35.57 (30.08-41.06) | 37.28 (31.79-42.78) | - | |
| P Intermediate vs. Low | <0.001 | 0.004 | 0.09 | <0.001 | <0.001 | <0.001 | ||
| P high vs. Low | <0.001 | <0.001 | - | <0.001 | <0.001 | <0.001 | ||
ACI= adjusted cumulative incidence %. N = number of HF events, Pyrs= person-years of observation.
Lifetime risk evaluated at up to 45 years of follow-up except for the analyses of the stratum according to diabetes status, in which 30 years of follow-up was used due to limited data.
participants received a score of 0-2 for the three BMI categories (0 for normal BMI, 1 for overweight, and 2 for obesity), a score of 0-2 for BP categories (0 for normal BP, 1 for intermediate BP, and 2 for hypertension), a score of 0-1 for diabetes (0= no, 1= yes), and a score of 0-1 for myocardial infarction before age 50 (0=no, 1=yes). Thus, participants could have a score that ranged from 0 (minimum) to 6 (maximum). Three strata of the risk score were empirically defined as 0-1 (low risk factor burden), 2-3 (intermediate), 4-6 (high risk factor burden).
In the first epoch, we observed modest differences in RLR of HF at age 50 for individuals with normal BMI versus obesity (P=0.09), for participants with normal BP versus hypertension (P<0.001), and for people with low versus intermediate risk factor burden (P=0.06). The 30-year risk of HF increased for people with diabetes (versus those without diabetes; P=0.003. The RLR of HF in people with diabetes could not be estimated due to a lack of data over more extended periods. The RLR of HF in the overweight and intermediate BP categories was not statistically different from those in normal BMI and normal BP categories, respectively.
In the second epoch, we observed larger differences in RLR of HF at age 50 when groups with overweight or obesity were compared with those with normal BMI and when people with intermediate BP or hypertension were compared with those with normal BP (P<0.001 for all). A large difference in RLR of HF was also seen for people with diabetes compared to those without (P=0.044). Furthermore, people with intermediate or high risk factor burden had much higher RLR of HF compared with those with a low burden (P<0.001 for both; Table 2). Supplemental Figure 2 (Panels A to H) and Supplemental Table 2 show the mortality-adjusted cumulative incidence of HF according to risk factor strata in the two epochs for people without antecedent MI. Results consistent with the main analyses including all participants were obtained.
Association of risk factors with HF incidence in the two epochs
The results of Fine-Gray models (Figure 2 Panel A) suggest that within both epochs, male sex, being overweight or obese, or having higher BP or diabetes were associated with increased HF risk. Figure 2 Panel B compares the incidence of HF associated with a specific risk factor stratum in epoch 2 versus epoch one (expressed as hazards ratios). For instance, the risk of HF was 23% higher in women in the second epoch compared to women in the first. The risk of developing HF in all three BMI categories and participants with intermediate BP or hypertension was 24-62% higher in the second epoch relative to corresponding risk factor strata in the first epoch. Similar findings were observed in people without antecedent MI (Supplemental Figure 3).
Figure 2. Association of risk factors with heart failure incidence (Fine-Gray regression).
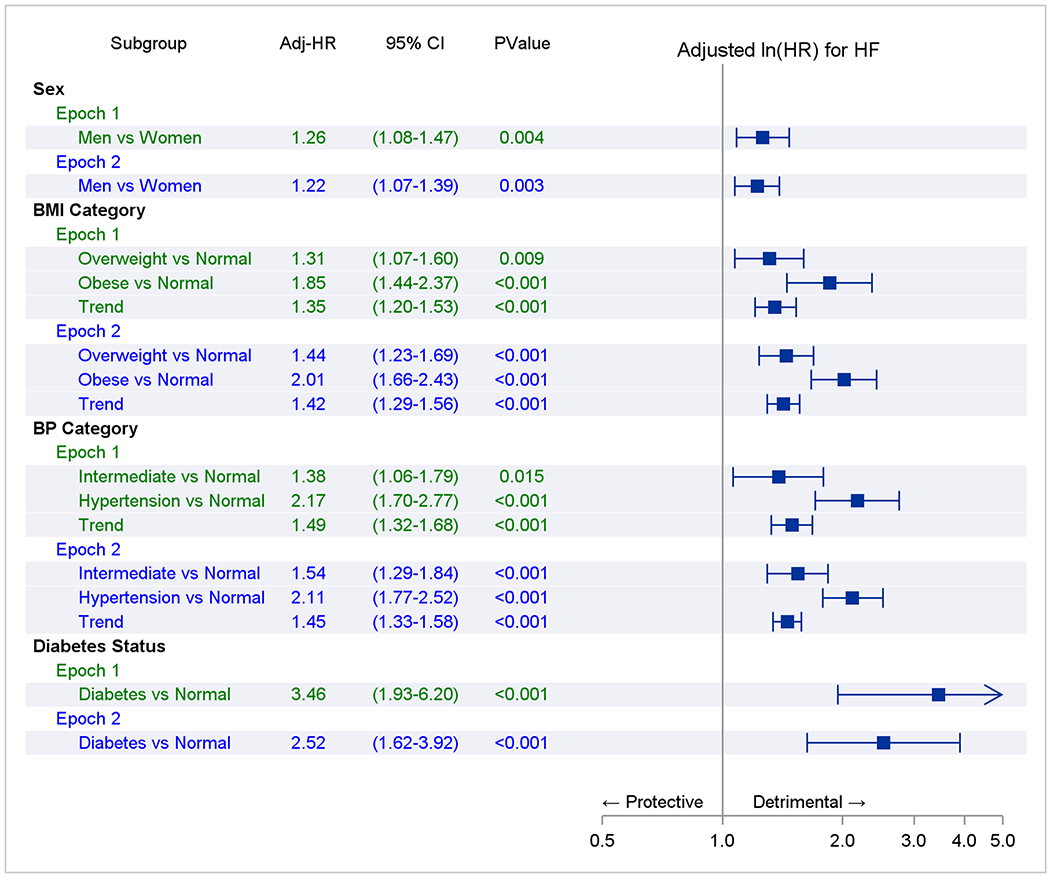
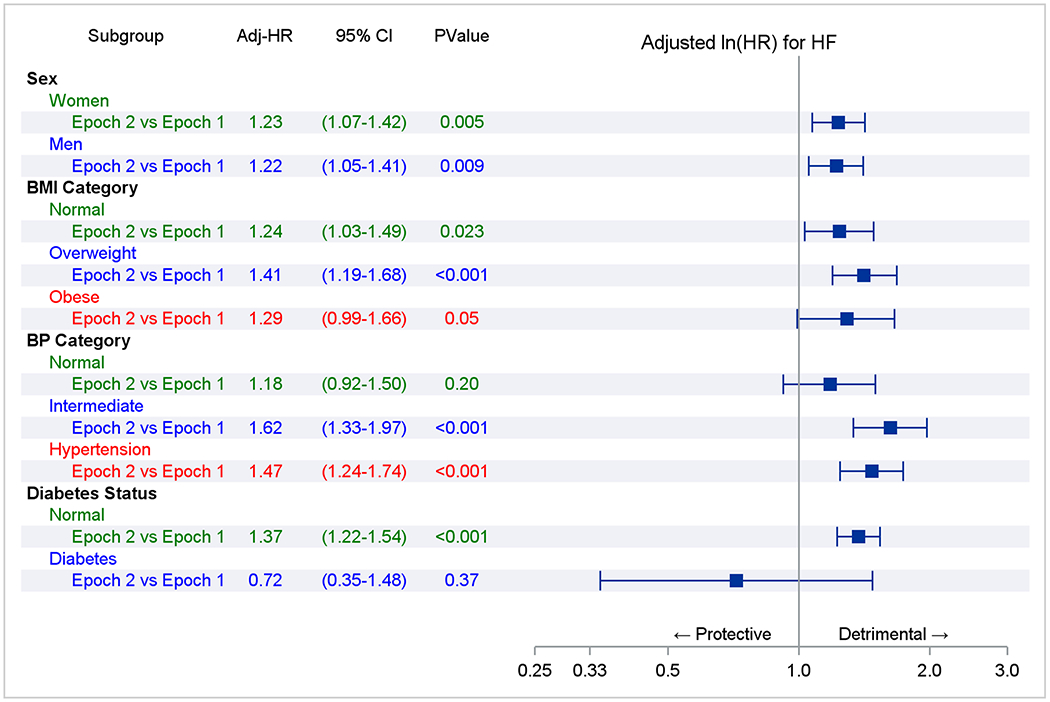
Panel A represents comparisons within an epoch. The referent groups are normal body mass index (BMI), blood pressure (BP), or no diabetes (e.g., overweight vs. normal BMI in epoch 1). Trend indicates a test of a trend across risk factor categories (e.g., across BMI categories in epoch 1). Panel B compares the adjusted-incidence of heart failure associated with a risk factor stratum in epoch 2 versus 1 (referent; e.g., overweight in epoch 2 versus overweight in epoch 1). The point estimate of the hazards ratios and their 95% CI are represented by solid rectangles and the lines on either side.
Additional analyses
We repeated the analysis after excluding Omni cohort participants (second epoch), and we observed that the RLR of HF, HFpEF, and HFrEF remained unchanged (data not shown). The prevalence of individual major and minor criteria for HF in the two epochs are shown in Supplemental Table 3. Severe symptoms (e.g., orthopnea) and evidence of pulmonary or systemic congestion were more frequent in the first epoch.
RLR of HFpEF versus HFrEF in Epoch 2
In the second epoch, 338 individuals developed HFpEF (64% women), 429 participants developed HFrEF (41% women), and 108 attendees (57% women) were classified as new-onset HFuEF, with corresponding incidence rates of 2.63, 3.33, and 0.84 per 1000 person-years, respectively. The mean age at onset of HFpEF was 81 (SD 8.4) years in both sexes, whereas the mean age at onset of HFrEF was 76.1 (SD 9.6) in men and 80.4 (SD (8.8) years in women. Supplemental Figure 4 (Panels A to H) and Table 3 show the mortality-adjusted cumulative incidence of HFpEF and HFrEF, respectively, according to risk factor strata, in the second epoch. Women had a higher RLR of HFpEF at age 50 compared to men (p=0.025), while men had a higher RLR of HFrEF (p<0.001). Higher BMI, intermediate BP, and presence of diabetes demonstrated more robust associations with RLR of HFrEF (vs. HFpEF), although they were associated with both HF subtypes. Results of Fine-Gray regression models were consistent (Supplemental Figure 5).
Table 3.
Cumulative incidence of HFpEF versus HFrEF at age 50 according to risk factor strata
| Adjusted Cumulative incidence, % (95% CI) for HFpEF | Adjusted Cumulative incidence, % (95% CI) for HFrEF | RLR Rate ratio HFrEF vs. HFpEF, P | ||||||
|---|---|---|---|---|---|---|---|---|
| 30-year | 40-year | Lifetime (RLR) | 30-year | 40-year | Lifetime (RLR) | |||
| Overall | N/Pyr | 122/109839 | 282/125946 | 338/128634 | 210/109883 | 393/126001 | 429/128680 | |
| ACI | 3.12 (2.57-3.67) | 7.57 (6.72-8.42) | 9.26 (8.32-10.21) | 5.27 (4.57-5.96) | 10.34 (9.37-11.31) | 11.43 (10.41-12.45) | 1.23 p=0.002 | |
| Sex | ||||||||
| Women | N/Pyr | 72/60351 | 181/70817 | 217/72812 | 64/60347 | 153/70803 | 176/72791 | |
| ACI | 3.48 (2.69-4.27) | 8.91 (7.67-10.15) | 10.77 (9.42-12.13) | 3.06 (2.32-3.80) | 7.49 (6.35-8.64) | 8.68 (7.45-9.91) | 0.81 P=.025 | |
| Men | N/Pyr | 50/49489 | 101/55130 | 121/55823 | 146/49536 | 240/55198 | 253/55889 | |
| ACI | 2.72 (1.98-3.47) | 6.02 (4.88-7.17) | 7.61 (6.29-8.92) | 7.72 (6.51-8.92) | 13.73 (12.11-15.36) | 14.76 (13.06-16.46) | 1.94 P<0.001 | |
| P | 0.17 | 0.001 | 0.001 | <0.001 | <0.001 | <0.001 | ||
| BMI category | ||||||||
| Normal | N/Pyr | 30/37990 | 87/45514 | 111/46892 | 43/37996 | 110/45526 | 126/46899 | |
| ACI | 2.13 (1.38-2.89) | 5.98 (4.76-7.20) | 7.72 (6.34-9.10) | 3.06 (2.16-3.96) | 7.58 (6.22-8.94) | 8.74 (7.28-10.20) | 1.13 P=0.32 | |
| Overweight | N/Pyr | 44/37112 | 102/42587 | 122/43477 | 77/37128 | 152/42612 | 167/43499 | |
| ACI | 3.30 (2.34-4.27) | 7.92 (6.44-9.39) | 9.59 (7.97-11.21) | 5.78 (4.53-7.04) | 11.74 (9.98-13.49) | 12.99 (11.15-14.83) | 1.35 P=0.007 | |
| Obese | N/Pyr | 31/19273 | 62/20785 | 72/21002 | 62/19289 | 87/20797 | 89/21011 | |
| ACI | 5.25 (3.43-7.07) | 12.18 (9.30-15.07) | 14.41 (11.30-17.53) | 9.86 (7.49-12.24) | 15.51 (12.43-18.60) | 15.96 (12.83-19.09) | 1.11 P=0.49 | |
| P Overweight vs. Normal | 0.06 | 0.047 | 0.09 | 0.001 | <0.001 | <0.001 | ||
| P Obese vs. Normal | 0.002 | <0.001 | <0.001 | <0.001 | <0.001 | <0.001 | ||
| BP Category | ||||||||
| Normal | N/Pyr | 18/44354 | 57/50227 | 79/51188 | 38/44364 | 82/50240 | 99/51198 | |
| ACI | 1.41 (0.76-2.06) | 4.95 (3.69-6.20) | 7.26 (5.71-8.81) | 2.72 (1.86-3.59) | 6.82 (5.37-8.26) | 8.61 (6.96-10.26) | 1.19 P=0.24 | |
| Intermediate | N/Pyr | 36/26506 | 87/31898 | 105/32839 | 65/26521 | 132/31920 | 141/32857 | |
| ACI | 3.24 (2.19-4.28) | 7.39 (5.89-8.89) | 8.94 (7.30-10.57) | 6.06 (4.63-7.50) | 11.49 (9.64-13.34) | 12.27 (10.36-14.17) | 1.37 P=0.009 | |
| Hypertension | N/Pyr | 51/24322 | 107/27725 | 121/28328 | 79/24336 | 135/27739 | 142/28339 | |
| ACI | 5.24 (3.84-6.64) | 10.99 (9.02-12.96) | 12.33 (10.27-14.40) | 8.11 (6.40-9.83) | 13.87 (11.69-16.04) | 14.54 (12.33-16.75) | 1.18 P=0.15 | |
| P Intermediate vs. Normal | 0.004 | 0.014 | 0.15 | <0.001 | <0.001 | 0.004 | ||
| P Hypertension vs. Normal | <0.001 | <0.001 | <0.001 | <0.001 | <0.001 | <0.001 | ||
| Diabetes status | ||||||||
| Normal | N/Pyr | 97/91414 | 238/105577 | 292/108007 | 165/91447 | 329/105621 | 361/108042 | |
| ACI | 3.01 (2.42-3.60) | 7.54 (6.62-8.47) | 9.37 (8.35-10.40) | 5.07 (4.32-5.83) | 10.34 (9.28-11.40) | 11.42 (10.31-12.53) | 1.22 P=0.008 | |
| Diabetes | N/Pyr | 6/2378 | 7/2425 | 7/2430 | 15/2382 | 16/2429 | 16/2434 | |
| ACI | 8.17 (1.29-15.06) | 13.15 (2.02-24.27) | 13.15 (2.02-24.27) | 20.87 (10.71-31.03) | 25.01 (12.78-37.24) | 25.01 (12.78-37.24) | 1.90 P=0.16 | |
| P Diabetes vs. Normal | 0.14 | 0.33 | 0.51 | 0.002 | 0.019 | 0.030 | ||
| Cumulative Risk factor burden * | ||||||||
| Low* | N/PYrs | 29/46884 | 81/54520 | 108/55842 | 45/46891 | 108/54533 | 128/55852 | |
| ACI | 1.91 (1.22-2.60) | 5.52 (4.35-6.69) | 7.59 (6.21-8.97) | 2.85 (2.03-3.68) | 7.23 (5.91-8.54) | 8.75 (7.30-10.21) | 1.15 p=0.26 | |
| Intermediate* | N/PYrs | 48/36201 | 120/41990 | 143/42981 | 91/36222 | 182/42021 | 193/43007 | |
| ACI | 3.43 (2.47-4.38) | 8.48 (7.03-9.93) | 10.13 (8.55-11.70) | 6.56 (5.26-7.86) | 12.96 (11.20-14.71) | 13.74 (11.94-15.54) | 1.36 p=0.003 | |
| High* | N/PYrs | 26/9948 | 44/10595 | 48/10697 | 44/9957 | 55/10600 | 56/10701 | |
| ACI | 7.74 (4.83-10.65) | 15.07 (10.90-19.25) | 16.21 (11.95-20.48) | 12.48 (8.96-15.99) | 16.99 (12.78-21.20) | 17.28 (13.05-21.51) | 1.07 p=0.73 | |
| P Intermediate vs. Low | 0.011 | 0.002 | 0.018 | <0.001 | <0.001 | <0.001 | ||
| P high vs. Low | <0.001 | <0.001 | <0.001 | <0.001 | <0.001 | <0.001 | ||
ACI= adjusted cumulative incidence %. N = number of HF events, Pyrs= person-years of observation.
Lifetime risk was evaluated at 45 years except for the analyses of the stratum according to diabetes status, in which 30 years was used due to limited data.
participants received a score of 0-2 for the three BMI categories (0 for normal BMI, 1 for overweight, and 2 for obesity), a score of 0-2 for BP categories (0 for normal BP, 1 for intermediate BP, and 2 for hypertension), a score of 0-1 for diabetes (0= no, 1= yes), and a score of 0-1 for myocardial infarction before age 50 (0=no, 1=yes). Thus, participants could have a score that ranged from 0 (minimum) to 6 (maximum). Three strata of the risk score were empirically defined as 0-1 (low risk factor burden), 2-3 (intermediate), 4-6 (high risk factor burden).
Impact of Missing data
Missing covariates did not impact the overall and sex-specific estimates of RLR of HF; they impacted analyses of RLR in select risk factor strata only. Most participants with missing covariates did not attend an examination between ages 45-54 years. In the first epoch, missingness was 14.7% for BP, 15.5% for BMI, and 17.6% for diabetes status (Supplemental Figure 1). In the second epoch, missingness was 13.8% for BP, 14.7% for BMI, and 15.3% for diabetes status (Supplemental Figure 1).
Discussion
Principal Findings
Our principal findings are four-fold. First, the RLR of HF at age 50 increased relatively by ~20 (women) to 30% (men) over the last twenty-five years in the FHS cohorts (Central Illustration). This increase in RLR of HF (at age 50) in the second epoch was consistent in individuals without antecedent MI. The age at onset of HF increased in the second epoch by 6.6 (women)-7.2 (men) years. The 30-year risk of HF decreased in the second epoch (compared to the first epoch), yet the 40-year risk and RLR of HF were higher than in the first epoch. These observations suggest that an increase in life expectancy in the second epoch of approximately six years may be a contributor to the rise in RLR. The later age of occurrence of HF in the second epoch is consistent with the compression of morbidity (37).
Central Illustration. Change in lifetime risk of heart failure.
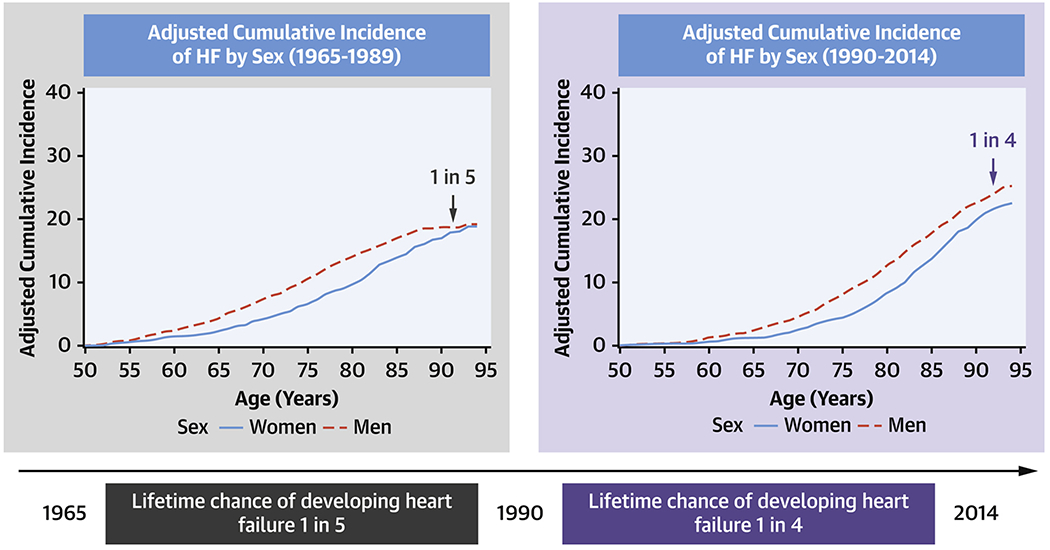
The lifetime risk of developing HF has increased from 1 in 5 during 1965-1989 to 1 in 4 during 1990-2014.
Second, in the second epoch, being overweight or obese or having elevated BP was associated with a relative increase in RLR of HF of ~45% compared to corresponding strata in the first epoch. We were unable to evaluate change in RLR of HF in people with diabetes. Of note, in the second epoch, participants with diabetes had a high RLR of HF of ~39%. Furthermore, the RLR of HF rose as the cumulative burden of risk factors increased, being more pronounced in the second epoch. These were consistent in participants without prior MI.
Third, Fine-Gray analyses suggested a higher risk of HF associated with overweight, obesity, intermediate BP, and hypertension in the second epoch (compared to corresponding strata in the first epoch; Figure 2 Panel B), which might have contributed to the increase in RLR of HF over time.
Fourth, we observed noticeable sex differences in the RLR of HF subtypes (at age 50) in the second epoch. Women experienced a higher RLR of HFpEF (relative to HFrEF), whereas men faced an almost two-fold RLR of HFrEF (relative to HFpEF). Key HF risk factors such as being overweight or having intermediate BP levels were associated with a ~35% greater RLR of HFrEF than HFpEF.
Comparison with the literature
Several investigations have reported on the RLR of HF, with estimates ranging from 5 to 41.6 % (Supplemental Table 4; median of ~24%) (10–17). Potential sources of heterogeneity in published RLR estimates for HF include diverse HF diagnostic criteria and data sources; surveillance over different periods; varying follow-up; assorted derivation methods; and inherent differences in the samples evaluated (10–15). Unlike prior reports, we evaluated change in RLR of HF at age 50 over the last five decades.
We also evaluated the RLR of HFpEF versus HFrEF in the second epoch. Pandey et al. recently reported that the RLR estimates for HFpEF versus HFrEF (defined using an LVEF cutpoint of 45%) for 45-year old white individuals were 10.7 and 5.8% in women, and 10.4 and 10.6% in men, respectively (14). We observed slightly higher estimates for RLR of HFrEF in both sexes and a somewhat lower RLR of HFpEF in men. The longer median follow-up in our investigation and the choice of a higher cutpoint of LVEF to define the HF subtypes may have contributed to these modest differences in RLR estimates across these two reports.
Potential causes of increasing RLR of HF
The increase in the RLR for HF at age 50 may be multifactorial in origin. The increase in life expectancy, a higher prevalence of excess adiposity and diabetes, and the greater relative risks for HF associated with key risk factors (overweight, obesity, high BP) in the second epoch all likely contributed to our observations.
It is conceivable that earlier and more frequent detection of HF cases due to better diagnostic tests in the second epoch may translate into greater disease incidence and a higher RLR of HF. This possibility is supported by our observation that symptoms and signs of severe HF were more common in the first epoch in our sample. Also, the rising burden of comorbidities such as overweight, obesity, diabetes, and increased post-MI survival may have elevated the RLR of HF in the second epoch (38–40).
Strengths and Limitations
Our community-based investigation is strengthened by using data from a single-site study in which disease surveillance, endpoint adjudication processes, HF criteria, and monitoring of competing causes of death in the FHS cohorts are standardized over the last five decades (19). There are several limitations of our approach. We did not correct for multiple statistical testing. Additionally, conjoint associations of age, birth cohort, and period effects on risk factor-disease incidence may impact changes in RLR of HF and can be challenging to disentangle. We addressed this partially by using age as the time scale, with the additional constraint of estimating RLR at age 50 in each epoch. In analyses stratifying by risk factor burden, we weighted risk factors equally to simplify interpretation. We did not assess the impact of medication use (for BP, cholesterol, and diabetes) on the RLR of HF, given the observational nature of our investigation. It is important to emphasize that the RLR of HF varies with race, ethnicity, and geography, as illustrated by several prior reports (9,13,14). However, our FHS sample was overwhelmingly white and living in the greater New England region. Our findings cannot be extrapolated to other non-white races/ethnicities or to residents in other parts of the US who may have a much higher burden of HF at a much earlier age (41).
Conclusions and Clinical Relevance
The RLR for HF at age 50 increased in our predominantly white community-based sample over the last three decades. Key contributory factors include increased life expectancy and the rising societal burden of key modifiable HF risk factors such as high BP, obesity, diabetes, and multimorbidity (20–22,38–40). Continued efforts to screen for, prevent and control comorbidities in adulthood, and identify and manage HF risk factors in older people may be essential to mitigate the projected increase in the HF burden (3).
Supplementary Material
Clinical Perspectives.
Competency in Systems-Based Practice:
The probability of developing heart failure over the course of a lifetime increased from 20 to 25% over the last 25 years. Among people with multiple risk factors (such as excess weight, high blood pressure, and diabetes), the probability of developing heart failure is even higher, exceeding 30%.
Translational Outlook:
Future clinical trials should evaluate whether specific screening and risk factor management strategies applied at earlier stages of life can reduce the burden of heart failure in the elderly.
Funding:
This work is supported by Contracts NO1-HC-25195, HHSN268201500001I, and 75N92019D00031 from the National Heart, Lung, and Blood Institute, Bethesda, MD. Dr. Vasan is supported in part by the Evans Medical Foundation and the Jay and Louis Coffman Endowment from the Department of Medicine, Boston University School of Medicine, MA.
Abbreviations.
- BMI
Body mass index
- BP
Blood pressure
- FHS
Framingham Heart Study
- HF
Heart failure
- HFpEF
Heart failure with a preserved ejection fraction
- HFrEF
Heart failure with a reduced ejection fraction
- LVEF
Left ventricular ejection fraction
- MI
Myocardial infarction
- RLR
Residual lifetime risk
Footnotes
Publisher's Disclaimer: This is a PDF file of an unedited manuscript that has been accepted for publication. As a service to our customers we are providing this early version of the manuscript. The manuscript will undergo copyediting, typesetting, and review of the resulting proof before it is published in its final form. Please note that during the production process errors may be discovered which could affect the content, and all legal disclaimers that apply to the journal pertain.
Disclosures: None.
References
- 1.Bragazzi NL, Zhong W, Shu J et al. Burden of heart failure and underlying causes in 195 countries and territories from 1990 to 2017. Eur J Prev Cardiol 2021. DOI: 10.1093/eurjpc/zwaa147 [DOI] [PubMed] [Google Scholar]
- 2.Virani SS, Alonso A, Aparicio HJ et al. Heart Disease and Stroke Statistics;2021 Update. Circulation 2021;143:e254–e743. [DOI] [PubMed] [Google Scholar]
- 3.Heidenreich PA, Albert NM, Allen LA et al. Forecasting the impact of heart failure in the United States: a policy statement from the American Heart Association. Circ Heart Fail 2013;6:606–619. [DOI] [PMC free article] [PubMed] [Google Scholar]
- 4.Groenewegen A, Rutten FH, Mosterd A, Hoes AW. Epidemiology of heart failure. Eur J Heart Fail 2020;22:1342–1356. [DOI] [PMC free article] [PubMed] [Google Scholar]
- 5.Jafari LA, Suen RM, Khan SS. Refocusing on the Primary Prevention of Heart Failure. Curr Treat Options Cardiovasc Med 2020;22:13. [DOI] [PMC free article] [PubMed] [Google Scholar]
- 6.Beiser A, D’Agostino RB Sr, Seshadri S, Sullivan LM, Wolf PA. Computing estimates of incidence, including lifetime risk: Alzheimer’s disease in the Framingham Study. The Practical Incidence Estimators (PIE) macro. Stat Med 2000;19:1495–1522. [DOI] [PubMed] [Google Scholar]
- 7.Navar AM, Wang TY, Mi X et al. Influence of Cardiovascular Risk Communication Tools and Presentation Formats on Patient Perceptions and Preferences. JAMA Cardiol 2018;3:1192–1199. [DOI] [PMC free article] [PubMed] [Google Scholar]
- 8.Sasieni PD, Adams J. Standardized lifetime risk. Am J Epidemiol 1999;149:869–875. [DOI] [PubMed] [Google Scholar]
- 9.Berry JD, Dyer A, Cai X et al. Lifetime risks of cardiovascular disease. N Engl J Med 2012;366:321–329. [DOI] [PMC free article] [PubMed] [Google Scholar]
- 10.Bleumink GS, Knetsch AM, Sturkenboom MC et al. Quantifying the heart failure epidemic: prevalence, incidence rate, lifetime risk and prognosis of heart failure: The Rotterdam Study. Eur Heart J 2004;25:1614–1619. [DOI] [PubMed] [Google Scholar]
- 11.Djoussé L, Driver JA, Gaziano JM. Relation Between Modifiable Lifestyle Factors and Lifetime Risk of Heart Failure. JAMA 2009;302:394–400. [DOI] [PMC free article] [PubMed] [Google Scholar]
- 12.Folsom AR, Shah AM, Lutsey PL et al. American Heart Association’s Life’s Simple 7: avoiding heart failure and preserving cardiac structure and function. Am J Med 2015;128:970–976. e2. [DOI] [PMC free article] [PubMed] [Google Scholar]
- 13.Huffman MD, Berry JD, Ning H et al. Lifetime risk for heart failure among white and black Americans: cardiovascular lifetime risk pooling project. J Am Coll Cardiol 2013;61:1510–1517. [DOI] [PMC free article] [PubMed] [Google Scholar]
- 14.Pandey A, Omar W, Ayers C et al. Sex and Race Differences in Lifetime Risk of Heart Failure With Preserved Ejection Fraction and Heart Failure With Reduced Ejection Fraction. Circulation 2018;137:1814–1823. [DOI] [PMC free article] [PubMed] [Google Scholar]
- 15.Rapsomaniki E, Timmis A, George J et al. Blood pressure and incidence of twelve cardiovascular diseases: lifetime risks, healthy life-years lost, and age-specific associations in 1· 25 million people. The Lancet 2014;383:1899–1911. [DOI] [PMC free article] [PubMed] [Google Scholar]
- 16.Avery CL, Loehr LR, Baggett C et al. The Population Burden of Heart Failure Attributable to Modifiable Risk Factors. J Am Coll Cardiol 2012;60:1640–1646. [DOI] [PMC free article] [PubMed] [Google Scholar]
- 17.Lloyd-Jones DM, Larson MG, Leip EP et al. Lifetime risk for developing congestive heart failure: the Framingham Heart Study. Circulation 2002;106:3068–3072. [DOI] [PubMed] [Google Scholar]
- 18.McKee PA, Castelli WP, McNamara PM, Kannel WB. The natural history of congestive heart failure: the Framingham study. N Engl J Med 1971;285:1441–6. [DOI] [PubMed] [Google Scholar]
- 19.Tsao CW, Vasan RS. Cohort Profile: The Framingham Heart Study (FHS): overview of milestones in cardiovascular epidemiology. Int J Epidemiol 2015;44:1800–1813. [DOI] [PMC free article] [PubMed] [Google Scholar]
- 20.Dorans KS, Mills KT, Liu Y, He J. Trends in Prevalence and Control of Hypertension According to the 2017 American College of Cardiology/American Heart Association (ACC/AHA) Guideline. J Am Heart Assoc 2018;7:e008888. [DOI] [PMC free article] [PubMed] [Google Scholar]
- 21.Wang Y, Beydoun MA, Min J, Xue H, Kaminsky LA, Cheskin LJ. Has the prevalence of overweight, obesity and central obesity levelled off in the United States? Trends, patterns, disparities, and future projections for the obesity epidemic. Int J Epidemiol 2020;49:810–823. [DOI] [PMC free article] [PubMed] [Google Scholar]
- 22.Gregg EW, Zhuo X, Cheng YJ, Albright AL, Narayan KM, Thompson TJ. Trends in lifetime risk and years of life lost due to diabetes in the USA, 1985-2011: a modelling study. Lancet Diabetes Endocrinol 2014;2:867–74. [DOI] [PubMed] [Google Scholar]
- 23.Velagaleti RS, Pencina MJ, Murabito JM et al. Long-term trends in the incidence of heart failure after myocardial infarction. Circulation 2008;118:2057. [DOI] [PMC free article] [PubMed] [Google Scholar]
- 24.Peters SAE, Muntner P, Woodward M. Sex Differences in the Prevalence of, and Trends in, Cardiovascular Risk Factors, Treatment, and Control in the United States, 2001 to 2016. Circulation 2019;139:1025–1035. [DOI] [PubMed] [Google Scholar]
- 25.Dawber TR, Meadors GF, Moore FE Jr. Epidemiological approaches to heart disease: the Framingham Study. Am J Public Health Nations Health 1951;41:279–81. [DOI] [PMC free article] [PubMed] [Google Scholar]
- 26.Kannel WB, Feinleib M, McNamara PM, Garrison RJ, Castelli WP. An investigation of coronary heart disease in families: the Framingham Offspring Study. Am J Epidemiol 1979;110:281–290. [DOI] [PubMed] [Google Scholar]
- 27.Splansky GL, Corey D, Yang Q et al. The Third Generation Cohort of the National Heart, Lung, and Blood Institute’s Framingham Heart Study: design, recruitment, and initial examination. Am J Epidemiol 2007;165:1328–35. [DOI] [PubMed] [Google Scholar]
- 28.Quan SF, Howard BV, Iber C et al. The sleep heart health study: design, rationale, and methods. Sleep 1997;20:1077–1085. [PubMed] [Google Scholar]
- 29.Dunlay SM, Roger VL. Understanding the epidemic of heart failure: past, present, and future. Curr Heart Fail Rep 2014;11:404–415. [DOI] [PMC free article] [PubMed] [Google Scholar]
- 30.Health NIo. Clinical guidelines for the identification, evaluation, and treatment of overweight and obesity in adults-the evidence report. Obes Res 1998;6:51S–209S. [PubMed] [Google Scholar]
- 31.Chobanian AV, Bakris GL, Black HR et al. The seventh report of the joint national committee on prevention, detection, evaluation, and treatment of high blood pressure: the JNC 7 report. JAMA 2003;289:2560–2571. [DOI] [PubMed] [Google Scholar]
- 32.American Diabetes Association. Diagnosis and classification of diabetes mellitus. Diabetes Care 2014;37:S81–S90. [DOI] [PubMed] [Google Scholar]
- 33.Mosterd A, Deckers JW, Hoes AW et al. Classification of heart failure in population based research: an assessment of six heart failure scores. Eur J Epidemiol 1997;13:491–502. [DOI] [PubMed] [Google Scholar]
- 34.Tsao CW, Lyass A, Enserro D et al. Temporal Trends in the Incidence of and Mortality Associated With Heart Failure With Preserved and Reduced Ejection Fraction. JACC: Heart Fail 2018;6:678–685. [DOI] [PMC free article] [PubMed] [Google Scholar]
- 35.Fine JP, Gray RJ. A proportional hazards model for the subdistribution of a competing risk. J Am Stat Assoc 1999;94:496–509. [Google Scholar]
- 36.Kannel W, Wolf P, Garrison R. Monograph Section 34: Some Risk Factors Related to the Annual Incidence of Cardiovascular Disease and Death Using Pooled Repeated Biennial Measurements: Framingham Heart Study, 30-Year Followup. Springfield, Mass: National Technical Information Service, 1987. [Google Scholar]
- 37.Maurer MS. Heart failure with a normal ejection fraction (HFNEF): embracing complexity. J Card Fail 2009;15:561–564. [DOI] [PMC free article] [PubMed] [Google Scholar]
- 38.Boyd CM, Fortin M. Future of multimorbidity research: how should understanding of multimorbidity inform health system design? Public Health Reviews 2010;32:451–474. [Google Scholar]
- 39.Christiansen MN, Køber L, Weeke P et al. Age-specific trends in incidence, mortality, and comorbidities of heart failure in Denmark, 1995 to 2012. Circulation 2017;135:1214–1223. [DOI] [PubMed] [Google Scholar]
- 40.Khan MS, Samman Tahhan A, Vaduganathan M et al. Trends in prevalence of comorbidities in heart failure clinical trials. Eur J Heart Fail 2020;22:1032–1042. [DOI] [PMC free article] [PubMed] [Google Scholar]
- 41.Vasan RS, Musani SK, Matsushita K et al. Epidemiology of Heart Failure Stages in Middle-Aged Black People in the Community: Prevalence and Prognosis in the Atherosclerosis Risk in Communities Study. J Am Heart Assoc 2021;10:e016524. [DOI] [PMC free article] [PubMed] [Google Scholar]
Associated Data
This section collects any data citations, data availability statements, or supplementary materials included in this article.


