



Abstract
This study examined kitchen adequacy in a racially/ethnically diverse low-income sample and associations with child diet quality. Families with children age five to seven years old (n=150) from non-Hispanic white, non-Hispanic Black, Hispanic, Native American, Hmong, and Somali families were recruited through primary care clinics. More than 85% of families had 15 of the 20 kitchen items queried, indicating that the sample had adequate kitchen facilities. Only one item (a kitchen table) was associated with higher overall diet quality of children. In contrast, children living in households with can openers and measuring spoons consumed more sodium and added sugars, respectively.
Keywords: kitchen adequacy, child diet quality, nutrition, obesity, healthy eating
Introduction
Previous studies demonstrate positive associations between home cooking and healthier dietary intake in children and adults (Fertig et al., 2019; Monsivais et al., 2014; Wolfson & Bleich, 2015), including more frequent intake of fruits, vegetables, and whole grains (Fertig et al., 2019; Monsivais et al., 2014). Conversely, meals eaten away from home have been associated with lower diet quality (Bowman et al., 2004; Todd et al., 2012), and the amount of meals eaten away from home has significantly increased in the past decades for both children (Bowman et al., 2004) and adults (Poti & Popkin, 2011). Some researchers have argued that home cooking is less frequent in low-income families due to lack of adequate kitchen facilities. A qualitative study of 150 families found that many low-income families live in apartments, small trailers, or motels with minimal space, no kitchen tables or functional appliances, and lack basic tools like sharp knives, cutting boards, pots, and pans (Bowen et al., 2019). Similarly, a quantitative study of 103 low-income families found that food preparation supplies are often limited in the most socioeconomically disadvantaged households (Appelhans et al., 2014). The current study adds to this limited research by examining the kitchen adequacy in a sample of 150 racially and ethnically diverse and immigrant/refugee households with young children from primarily low socioeconomic backgrounds. In addition, this study expands our understanding of the potential importance of kitchen adequacy by investigating the associations between kitchen adequacy and child dietary quality measured by 24-hour dietary recalls.
Materials and Methods
Study Design
Data for the current study are from Family Matters, a mixed-methods, 5-year longitudinal observational study. Aims of the study are to identify novel risk and protective factors for childhood obesity in the home environments of racially/ethnically diverse children from primarily low-income families. Phase I of the study includes an in-depth 10-day examination of the family home environments of diverse families (n=150), collecting both quantitative assessments and qualitative observations. Phase II is an 18-month epidemiological cohort study with diverse families (n=1307). Data in the current study are from Phase I of the Family Matters study. In-depth details of the study design, methods, and measures are published elsewhere (Berge et al., 2017).
Participants and Recruitment
The study recruited children and their families from the Minneapolis/St. Paul, MN metropolitan area in 2015-2016 via a letter sent to them by their family physician. Children were eligible to participate if they were five to seven years old, had a sibling between the ages of two and 12 years old living in the same home, lived with their parent/primary caregiver (hereafter “parent”) more than 50% of the time, shared at least one meal per day with the parent, and were from one of six racial/ethnic categories (non-Hispanic white, non-Hispanic Black, Hispanic, Native American, Hmong, and Somali). Within each racial/ethnic group, half of the families recruited had a study child with body mass index (BMI) ≥85th percentile while the other half of families had a study child with BMI >5th and <85th percentile. While income was not an eligibility criteria, recruitment occurred at clinics serving primarily low-income populations such that more than two-thirds of the sample have household incomes below $35,000 per year. One family did not complete the survey used in this analysis and thus, the sample size for this analysis is 149.
The University of Minnesota’s Institutional Review Board Human Subjects Committee approved all protocols used in both phases of the Family Matters study. All adult participants provided written informed consent, all children had written parental consent, and all children between eight and 17 years assented to the study.
Procedures and Data Collection
Data for Phase I of the study were collected from participants over a 10-day period, which included an eight-day observational period between two home visits. Parents completed an online survey during the second home visit. During the eight-day observation period, parents completed an ecological momentary assessment (EMA) survey on a study-provided iPad after each meal (defined as breakfast, lunch, dinner, or snack) eaten with the study child. Also during the eight-day observation period, certified researchers used the Nutrition Data System for Research (NDSR) (NDSR Software, n.d.) to collect three 24-hour dietary recalls on the study child on non-consecutive days. Because young children are not considered reliable reporters of dietary intake, recalls were conducted with the child’s parent. Families participated in all components of the study in their preferred language.
Measures
Kitchen Adequacy
Kitchen adequacy was assessed through the online survey which asked about the presence of 20 items in working condition (Yes/No), including five large appliances, ten food preparation supplies, and five cookware or bakeware items (see Figure 1). The list of items was based on the 41-item Food Preparation Checklist, developed by Appelhans et al. (2014), omitting all small appliances (e.g., toaster, blender), all specialty items (e.g., crockpot, waffle iron), two large appliances (BBQ grill, dishwasher), six food preparation supplies (e.g., tongs, ladle), and two cookware/bakeware items (large pot, glass/ceramic bakeware). At the time of our study, there was no validated instrument to assess kitchen adequacy (Schönberg et al., 2020).
Figure 1:
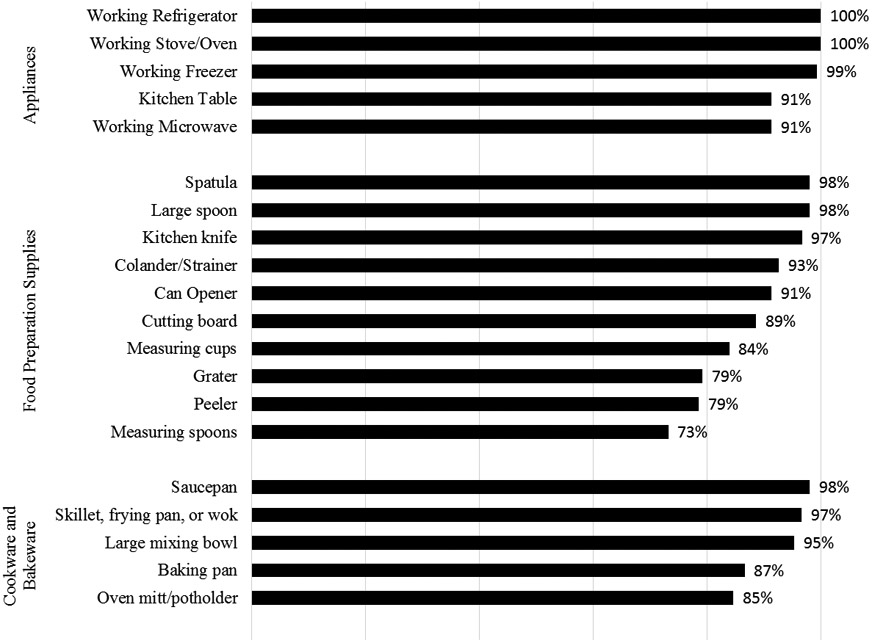
Percentage of Families Reporting Presence of Kitchen Items
Child Diet Quality
Child diet quality was captured through 11 characteristics of diet calculated from three 24-hour dietary recalls (see Table 1): The Healthy Eating Index (HEI-2010); the average daily calories consumed; and the average daily intake of fruit, vegetables, fat, carbohydrates, fiber, added sugars, protein, sodium and calcium. HEI is calculated from 12 components: Total Fruit, Whole Fruit, Total Vegetables, Greens and Beans, Whole Grains, Dairy, Total Protein Foods, Seafood and Plant Proteins, Fatty Acids, Refined Grains, Sodium, and Empty Calories. Each component is assigned a point value, which are then summed. The maximum HEI score, indicating a healthier diet, is 100. Detailed descriptions of the HEI score, including its calculation, evaluation, and validation, are available online (Guenther et al., 2013; National Cancer Institute, n.d.).
Table 1.
Relationship between Kitchen Items and Child Diet Quality (n=149)
| Energy (Kcal) |
HEI 2010 |
Fruit (servings) |
Vege- tables (servings) |
Total Fat (g) |
Total Carbohy- drates (g) |
Total Fiber (g) |
Added Sugars (g) |
Total Protein (g) |
Sodium (mg) |
Calcium (mg) |
|
|---|---|---|---|---|---|---|---|---|---|---|---|
| Mean Outcome | 1567.1 | 57.1 | 2.2 | 1.4 | 54.9 | 211.9 | 13.4 | 50.9 | 62.7 | 2386.0 | 969.2 |
| Kitchen Table | −38.21 (134.88) |
7.36* (2.85) |
0.24 (0.48) |
0.26 (0.30) |
−5.05 (6.49) |
0.02 (18.27) |
1.55 (1.54) |
−13.78 (8.45) |
2.18 (5.98) |
−31.68 (271.79) |
66.87 (112.00) |
| Working Microwave | 29.44 (134.64) |
−4.04 (2.84) |
−0.49 (0.48) |
−0.59* (0.30) |
−2.62 (6.48) |
13.05 (18.24) |
−4 84** (1.54) |
14.79 (8.44) |
−1.65 (5.97) |
−9.07 (271.30) |
215.88 (111.80) |
| Colander/Strainer | −95.83 (161.11) |
−2.67 (3.40) |
−0.33 (0.57) |
0.07 (0.35) |
1.61 (7.75) |
−20.80 (21.82) |
−1.47 (1.84) |
−2.87 (10.10) |
−7.87 (7.14) |
−209.16 (324.66) |
−146.90 (133.79) |
| Can Opener | 214.48 (154.60) |
0.44 (3.26) |
0.43 (0.55) |
0.26 (0.34) |
8.04 (7.44) |
29.73 (20.94) |
1.53 (1.77) |
−1.10 (9.69) |
5.87 (6.85) |
719.51* (311.53) |
220.72 (128.38) |
| Cutting board | −268.06 (155.10) |
3.06 (3.27) |
0.60 (0.55) |
−0.50 (0.34) |
−12.17 (7.46) |
−31.85 (21.01) |
−0.83 (1.78) |
−3.98 (9.72) |
−7.63 (6.88) |
−375.86 (312.53) |
−218.84 (128.79) |
| Measuring cups | 127.99 (135.16) |
1.88 (2.85) |
−0.09 (0.48) |
0.24 (0.30) |
7.17 (6.50) |
6.30 (18.31) |
−0.48 (1.55) |
−2.54 (8.47) |
9.78 (5.99) |
227.09 (272.35) |
110.17 (112.23) |
| Grater | 49.08 (114.78) |
0.94 (2.42) |
0.31 (0.41) |
−0.21 (0.25) |
0.75 (5.52) |
7.62 (15.55) |
0.35 (1.31) |
−3.60 (7.19) |
2.57 (5.09) |
230.36 (231.29) |
90.22 (95.31) |
| Peeler | −37.69 (96.26) |
2.00 (2.03) |
0.65 (0.34) |
0.01 (0.21) |
−1.71 (4.63) |
−6.34 (13.04) |
1.88 (1.10) |
−9.72 (6.03) |
1.56 (4.27) |
−157.64 (193.97) |
−13.26 (79.93) |
| Measuring spoons | 26.54 (107.33) |
−2.65 (2.26) |
−0.57 (0.38) |
0.28 (0.24) |
0.69 (5.17) |
8.20 (14.54) |
−0.14 (1.23) |
14.86* (6.73) |
−2.98 (4.76) |
−88.29 (216.28) |
−111.76 (89.12) |
| Baking pan | 27.58 (136.99) |
−2.91 (2.89) |
0.09 (0.49) |
−0.28 (0.30) |
0.59 (6.59) |
7.40 (18.56) |
0.88 (1.57) |
5.30 (8.59) |
−1.61 (6.07) |
−185.35 (276.05) |
−4.43 (113.76) |
| Oven mitt/potholder | −162.11 (109.87) |
−0.22 (2.32) |
−0.27 (0.39) |
−0.18 (0.24) |
−6.04 (5.29) |
−25.09 (14.88) |
−0.10 (1.26) |
−13.71* (6.89) |
−2.33 (4.87) |
−293.42 (221.39) |
−18.24 (91.23) |
p<0.001
p<0.01
p<0.05 Each column displays one ordinary least squares (OLS) regression model with adjustments for race/ethnicity, child's weight status, income, household composition, primary caregiver's education and employment status. Coefficients reported (standard errors in parentheses). Example interpretation: The presence of a kitchen table is associated with a 7.36 point higher HEI-2010, after adjusting for demographic and socioeconomic characteristics (p<0.05), where the mean HEI-2010 for the sample is 57.1 and a higher HEI is healthier.
Covariates
Parent-reported race/ethnicity and objectively measured child weight status were included as covariates to adjust for the stratification design of the study. The number of children and adults in the household, household income, and the parent’s educational attainment and employment status were all obtained by the parent’s report on the survey.
Analysis
Descriptive statistics are provided to demonstrate kitchen adequacy of the sample. Multivariate linear regressions were employed to estimate the relationship between specific kitchen items and each diet quality outcome, adjusting for the covariates listed above. Because some kitchen items were in almost all households, only those items that less than 95% of households had were included in the multivariate analyses. All analyses were conducted in Stata 16.1 SE (StataCorp, 2017).
Results
Description of Kitchen Adequacy
Every family in the sample had a working refrigerator and a working stove/oven, and almost every family had a working freezer (Figure 1). Only 91% of families had “a table to eat at that is large enough to seat all of your family living in your home”. Ninety-one percent had a working microwave. Of the ten food preparation supplies examined, more than 95% of families reported having a spatula, a large spoon, and a kitchen knife. Between 85% and 95% of families had a colander/strainer, a can opener, and/or a cutting board. Fewer than 85% of families had measuring spoons, a peeler, a grater, and/or measuring cups. Over 95% had a frying pan, a saucepan, and a large mixing bowl, but less than 90% had an oven mitt and a baking pan.
Associations between Kitchen Adequacy and Dietary Quality
Adjusted regression results indicated that there are few associations between the presence of specific kitchen items and child diet quality. The only kitchen item significantly associated with HEI was having a kitchen table; having a kitchen table was associated with a 7.36 higher HEI (p<0.05) where the average HEI for the sample is 57.1. None of the eleven kitchen items were significantly associated with average daily calories, fruit intake, fat intake, carbohydrate intake, protein intake, or calcium intake. Having a working microwave was associated with significantly lower vegetable (−0.59 servings, p<0.05) and fiber (−4.84 g, p<0.01) intake. The presence of a can opener was significantly associated with higher sodium intake (719.51 mg, p<0.05). Finally, added sugar consumption was significantly higher in households with measuring spoons (14.86 g, p<0.05) but lower in households with an oven mitt/potholder (−13.71 g, p<0.05).
Discussion
Although the sample was low-income, the majority of families had adequate kitchen facilities and supplies in their homes. The items most likely to be lacking included equipment for using the oven (baking pan and oven mitt), utensils for measuring (cups and spoons), and tools for preparing vegetables (cutting board, peeler and grater). These results are not consistent with the few prior studies on kitchen adequacy that find low adequacy among low-income families (Appelhans et al., 2014a; Bowen et al., 2019). The differences in findings may be due to method (quantitative vs. qualitative (Bowen et al., 2019), region (Minnesota versus Chicago (Appelhans et al., 2014) and North Carolina (Bowen et al., 2019)), and race/ethnicity (six equally-sized racial/ethnic groups vs. African-Americans only (Appelhans et al., 2014)).
In adjusted analyses, we found that children in families with or without these kitchen items had the same overall diet quality (HEI-2010). Three of the kitchen items (microwave oven, can opener, and measuring spoons) were associated with worse diet characteristics (lower vegetables, lower fiber, higher sodium, and higher added sugars). This may be related to more consumption of canned and other pre-prepared foods. Only two of the kitchen items (a kitchen table, and an oven mitt) were associated with better diet quality (HEI-2010 and lower added sugars). Overall, these results suggest that kitchen adequacy is not a major barrier to overall healthy eating. This finding may be useful for nutrition interventions, in that it may be important to focus on other factors rather than providing kitchen supplies to intervene in the home environment.
It is important to note that this study has both strengths and limitations. The major strength and contribution of this study is the examination of a rich set of measures on child dietary quality; thus, this study expands our understanding of the potential importance of kitchen adequacy on child diet quality. While another strength of this study is its inclusion of primarily low-income families from six different racial and ethnic backgrounds, it is limited by the small number of families included (n=149), and the focus on only families with young children and families living in the Twin Cities in Minnesota. An additional limitation is the kitchen adequacy measure has not been validated and only included 20 items. Future research with larger samples of diverse families using a validated instrument (Schönberg et al., 2020) is needed.
Acknowledgements:
The Family Matters study is a team effort and could not have been accomplished without the dedicated staff who carried out the home visits.
Funding details:
This work is supported by the National Heart, Lung, and Blood Institute (PI: Jerica Berge) under grant numbers R01HL126171 and 5R03HD084897-02. The content is solely the responsibility of the authors and does not necessarily represent the official views of the National Heart, Lung and Blood Institute or the National Institutes of Health.
Footnotes
Declaration of Interest Statement: Authors have no conflicts of interest to report.
References
- Appelhans BM, Waring ME, Schneider KL, & Pagoto SL (2014a). Food preparation supplies predict children’s family meal and home-prepared dinner consumption in low-income households. Appetite, 76, 1–8. 10.1016/j.appet.2014.01.008 [DOI] [PubMed] [Google Scholar]
- Berge JM, Trofholz A, Tate AD, Beebe M, Fertig A, Miner MH, Crow S, Culhane-Pera KA, Pergament S, & Neumark-Sztainer D (2017). Examining unanswered questions about the home environment and childhood obesity disparities using an incremental, mixed-methods, longitudinal study design: The Family Matters study. Contemporary Clinical Trials, 62. 10.1016/j.cct.2017.08.002 [DOI] [PMC free article] [PubMed] [Google Scholar]
- Bowen S, Brenton J, & Elliott S (2019). Pressure cooker: Why home cooking won’t solve our problems and what we can do about it. Oxford University Press. [Google Scholar]
- Bowman SA, Vinyard BT, Bowman SA, & Vinyard BT (2004). Fast Food Consumption of U.S. Adults: Impact on Energy and Nutrient Intakes and Overweight Status. Journal of the American College of Nutrition, 23(2), 163–168. 10.1080/07315724.2004.10719357 [DOI] [PubMed] [Google Scholar]
- Fertig AR, Loth KA, Trofholz AC, Tate AD, Miner M, Neumark-Sztainer D, & Berge JM (2019). Compared to Pre-prepared Meals, Fully and Partly Home-Cooked Meals in Diverse Families with Young Children Are More Likely to Include Nutritious Ingredients. Journal of the Academy of Nutrition and Dietetics, 119(5), 818–830. 10.1016/j.jand.2018.12.006 [DOI] [PMC free article] [PubMed] [Google Scholar]
- Guenther PM, Casavale KO, Reedy J, Kirkpatrick SI, Hiza HAB, Kuczynski KJ, Kahle LL, & Krebs-Smith SM (2013). Update of the Healthy Eating Index: HEI-2010. Journal of the Academy of Nutrition and Dietetics, 113(4), 569–580. 10.1016/J.JAND.2012.12.016 [DOI] [PMC free article] [PubMed] [Google Scholar]
- Monsivais P, Aggarwal A, & Drewnowski A (2014). Indicators of Healthy Eating. American Journal of Preventive Medicine, 47(6), 796–802. 10.1016/j.amepre.2014.07.033 [DOI] [PMC free article] [PubMed] [Google Scholar]
- National Cancer Institute. (n.d.). Overview & Background of The Healthy Eating Index. National Cancer Institute. Retrieved April 15, 2019, from https://epi.grants.cancer.gov/hei/ [Google Scholar]
- NDSR Software. (n.d.).
- Poti J, & Popkin B (2011). Trends in energy intake among US children by eating location and food source, 1977-2006. Journal of the American Dietetic Association, 111(8), 1156–1164. 10.1016/j.jada.2011.05.007.Trends [DOI] [PMC free article] [PubMed] [Google Scholar]
- Schönberg S, Asher R, Stewart S, Fenwick MJ, Ashton L, Bucher T, Van der Horst K, Oldmeadow C, Collins CE, & Shrewsbury VA (2020). Development of the Home Cooking EnviRonment and Equipment Inventory Observation form (Home-CookERITM): An Assessment of Content Validity, Face Validity, and Inter-Rater Agreement. Nutrients, 12(6), 1853. 10.3390/nu12061853 [DOI] [PMC free article] [PubMed] [Google Scholar]
- StataCorp. (2017). Stata Statistical Software: Release 15. StataCorp LLC. [Google Scholar]
- Todd JE, Mancino L, Lin B, & Jessica E (2012). The Impact of Food Away From Home on Adult Diet Quality Visit Our Website To Learn More! Cataloguing Record : SSRN Electronic Journal. [Google Scholar]
- Wolfson JA, & Bleich SN (2015). Is cooking at home associated with better diet quality or weight-loss intention? Public Health Nutrition, 18(08), 1397–1406. 10.1017/S1368980014001943 [DOI] [PMC free article] [PubMed] [Google Scholar]