ABSTRACT
Biobanking of live microbiota is becoming indispensable for mechanistic and clinical investigations of drug–microbiome interactions and fecal microbiota transplantation. However, there is a lack of methods to rapidly and systematically evaluate whether the biobanked microbiota maintains their cultivability and functional activity. In this study, we use a rapid ex vivo microbiome assay and metaproteomics to evaluate the cultivability and the functional responses of biobanked microbiota to treatment with a prebiotic (fructo-oligosaccharide, FOS). Our results indicate that the microbiota cultivability and their functional responses to FOS treatment were well maintained by freezing in a deoxygenated glycerol buffer at −80°C for 12 months. We also demonstrate that the fecal microbiota is functionally stable for 48 hours on ice in a deoxygenated glycerol buffer, allowing off-site fecal sample collection and shipping to laboratory for live microbiota biobanking. This study provides a method for rapid evaluation of the cultivability of biobanked live microbiota. Our results show minimal detrimental influences of long-term freezing in deoxygenated glycerol buffer on the cultivability of fecal microbiota.
KEYWORDS: Biobanking, freezing, metaproteomics, microbiome assay, gut microbiota
Introduction
Increasing evidence associates the gut microbiota with human health and the development of various diseases, including both intestinal and non-intestinal disorders.1–3 Fecal microbiota transplantation (FMT) has been used to treat recurrent Clostridium difficile infection (CDI), inflammatory bowel diseases (IBD)4,5 and to overcome resistance to anti-PD1 therapy in melanoma patients.6,7 Small molecules, prebiotics and dietary components are also being studied in high-throughput in vitro microbiome screens to identify potential therapeutics targeting the gut microbiota8–12 and to study the effects of the microbiome on these compounds.13 Although some successes have emerged in therapeutic interventions of gut microbiota for disease management,14–16 there is a need for systematic and robust study of microbiome-therapeutic interactions. Biobanked live microbiota are increasingly used for FMT and in high-throughput screening for new therapeutics, but most studies do not investigate whether biobanked microbiota maintain their functionalities.
Biobanked stools stored in the presence of preservation chemicals, such as glycerol, are commonly used for either microbiome assay, fermentation or FMT applications.13,17,18 Using the bacterial cell counting approach, Guerin-Danan et al. demonstrated that freezing in glycerol buffer had no effect on aerobes in fecal samples, while decreased the survival of anaerobes, but did not exceed the inter-individual variations.19 In a mouse FMT experiment, Ericsson et al. demonstrated that FMT using frozen feces performed similarly to fresh feces in maintaining the richness, diversity, and composition of donor microbiota.20 Utilizing a propidium monoazide (PMA)-based live bacteria-specific P18CR and sequencing approach, Papanicolas et al. showed that freeze-thaw reduced the microbial viability to ~20% in feces, although the composition of viable microbiota was not significantly altered.21 In addition, the exposure of fecal samples to ambient air further reduced viability and could lead to >10-fold reductions in the abundance of important commensal bacteria, such as Faecalibacterium prausnitzii.21 Therefore, biobanking of live microbiota needs to be systematically evaluated to determine whether the viability and functional activity of microbiota are maintained.
High-throughput whole-microbiome culture methods have been recently developed.11,13 For example, we reported a rapid assay for individual microbiome (RapidAIM),11 which maintains the functional profiles of individual gut microbiomes. RapidAIM has been used to screen, evaluate, and reclassify the modulating effects of drugs, natural compounds, and dietary components against individual human microbiomes.8,9 In this study, we used the RapidAIM assay and quantitative metaproteomics to determine whether freezing and delayed sample processing of human gut microbiota affect their cultivability and functional responses to treatments. In this study, fructo-oligosaccharides (FOS) was selected as an example treatment because it is a prebiotic with well known in vitro modulating effects on microbiota,22–24 such as the increase of Actinobacrteria species. Briefly, fresh and frozen microbiomes isolated from human stools were cultured in the RapidAIM assay with or without FOS. We showed that microbiome samples stored in deoxygenated, buffered 10% glycerol at −80°C were stable and maintained their functional responses to FOS treatment for up to 1 year. In addition, we demonstrated that gut microbiomes were stable on ice with glycerol-based preservation buffer for 48 hours prior to sample processing and biobanking. This study provides a convenient and rapid approach for evaluating live microbiota and reveals that freezing in glycerol-based preservation buffer at −80°C minimally affects the cultivability and activity of gut microbiomes.
Results
Freezing does not change the functional individuality of cultured gut microbiome
We first evaluated whether frozen biobanked fecal microbiota maintain their cultivability and functions. Briefly, fresh stools from three adult volunteers were collected, processed to make a final concentration of 20% (weight (g)/volume (mL), w/v) fecal slurry in 10% (volume (mL)/volume (mL), v/v) glycerol buffer (containing 1 mg/ml L-cysteine and pre-equilibrated in anaerobic workstation over night). The fecal slurry was aliquoted and stored at −80°C up to 1 year with testing at 0, 1, 2, 4, 8, 16, 24, and 52 weeks (1 year) by RapidAIM (Figure 1a). RapidAIM culturing was performed with or without 5 mg/ml of FOS for 24 hours in an anaerobic workstation. The microbiome cultures as well as the uncultured baseline samples were analyzed by shotgun metaproteomics to examine the functional microbiome profiles overtime.
Figure 1.
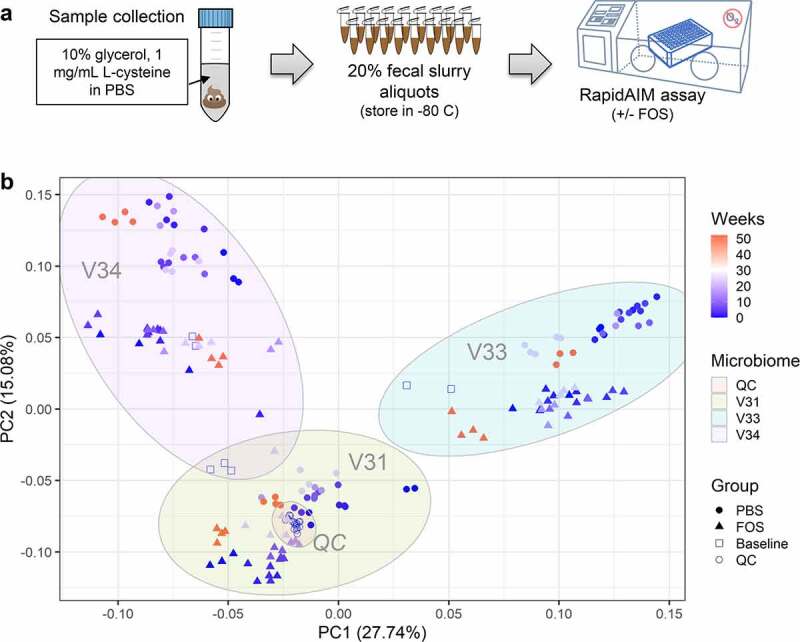
Evaluation of the cultivability of frozen biobanked fecal microbiota. (a) experimental workflow. Fresh stool was directly collected from healthy adult volunteers into pre-reduced 10% glycerol in phosphate buffered saline (PBS). Samples were transferred into anaerobic workstation immediately, homogenized to make a 20% (w/v) fecal slurry and aliquoted followed by filtering using sterile gauzes to remove large particles. The pre-processed stools were cultured directly in anaerobic workstation or frozen in −80°C for up to 52 weeks prior to culturing with or without fructo-oligosaccharide (FOS) in triplicates. (b) Principal component analysis (PCA) score plot of quantified protein groups. The log10-tranformed LFQ intensities of protein groups that were quantified in >50% samples were used for PCA analysis. Different symbol colors indicate the weeks of frozen in −80°C prior to culturing, and different shapes indicate the treatment groups for each culturing experiment. Baseline, uncultured microbiome samples; QC, quality controls for monitoring mass spectrometry measurement performance; V31, V33 and V34, origin donors of the microbiome samples.
In this study, 181 MS raw files were generated, including 16 quality control (QC) MS runs. Protein identification with MetaLab software yielded 83,273 unique peptide sequences and 20,304 protein groups, with an average MS spectra identification rate of 42.1 ± 6.9% (mean ± standard deviation). To examine the overall protein expression profiles, protein groups that were quantified in at least 50% of the samples were used for principal component analysis (PCA, Figure 1b). As shown in the PCA score plot, QC runs clustered closely together, indicating high quality and consistency of the metaproteomic data throughout the year (Figure 1b). Overall, the samples segregated into three clusters according to the individual origin of microbiomes tested. Both pre- and post-cultured microbiome samples of the same individual clustered together, suggesting adequate maintenance of the microbiome functional profiles.10 Within each individual microbiome, the treatment of FOS led to obvious separation (as represented by the second principal component, PC2) (Figure 1b). These findings suggest that the individuality of microbiome functions was well maintained by biobanking, ex vivo culturing, as well as the treatment with prebiotic FOS.
Frozen biobanked microbiota maintains the functional responses to FOS in RapidAIM
A total of 19,134 (94%) identified gut microbial protein groups were annotated with the Clusters of Orthologous Groups of proteins (COGs) database, representing 1214 COGs and 24 COG categories. The relative abundances of COGs were then used for PCA analysis, which again demonstrated consistency of individual microbiome functional responses to culturing, biobanking and treatment with FOS (Figure 2). Obvious separation of samples treated with and without FOS was observed along the second PC for all three microbiomes (Figure 2). We then calculated the abundance distributions at COG category level for each group, which showed highly similar patterns for all microbiomes at all different time points (Figure 3). Interestingly, consistent functional responses of cultured microbiomes to FOS could be observed for all tested time points, indicating well maintained cultivability and activity of the biobanked microbiomes.
Figure 2.
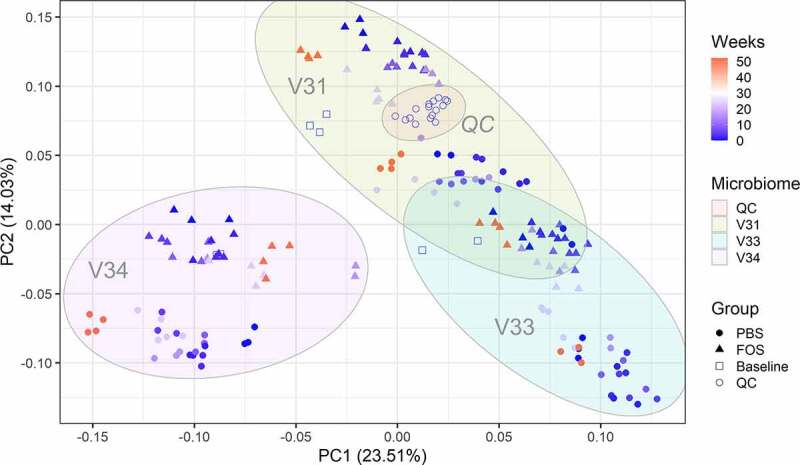
Principal component analysis (PCA) score plot of quantified functional orthologs of baseline and cultured microbiomes using fresh or frozen biobanked stools. The log10-tranformed LFQ intensities of COGs that were quantified in >50% samples were used for PCA analysis. Different symbol colors indicate the weeks of frozen in −80°C prior to culturing, and different shapes indicate the treatment groups for each culturing experiment. Baseline, uncultured microbiome samples; FOS, fructo-oligosaccharide treatment group; PBS, phosphate buffered saline treatment group. QC, quality controls for monitoring mass spectrometry measurement performance; V31, V33 and V34, origin donors of the microbiome samples.
Figure 3.
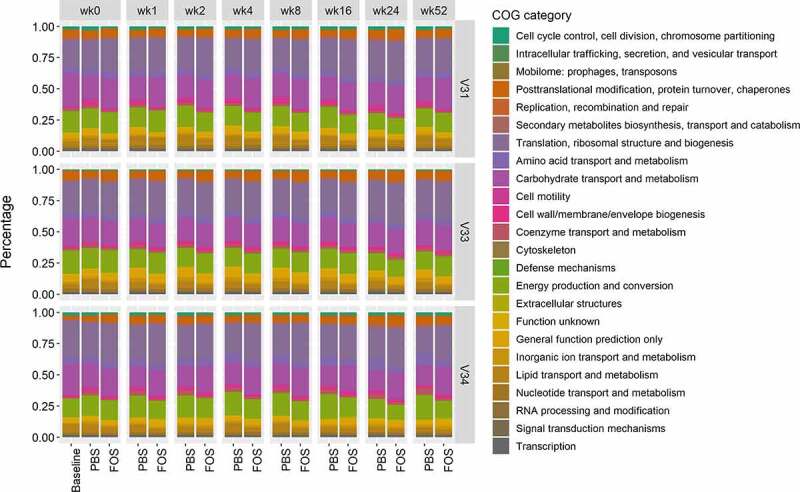
Abundance distribution of quantified COG categories in baseline and cultured microbiomes using fresh or frozen biobanked stools. Group average of LFQ intensities were used for plotting. Baseline, uncultured microbiome samples; FOS, fructo-oligosaccharide treatment group; PBS, phosphate buffered saline treatment group. V31, V33 and V34, origin donors of the microbiome samples. Different colors indicate COG categories. Column facet grid names (wk0, 1, 2, 4, 8, 16, 24 and 52) indicate the weeks of frozen in −80°C prior to culturing.
Frozen biobanked microbiota maintains the taxonomic responses to FOS in RapidAIM
Quantitative taxonomic analysis was performed using identified distinctive peptides that were determined with a lowest common ancestor (LCA) approach. In total, 17 phyla from all 4 superkingdoms, 25 classes, 36 orders, 49 families, 74 genera, and 163 species were quantified using a threshold of ≥3 distinctive peptides. Overall phylum-level distribution of the pre- and post-cultured microbiomes showed high consistency of different groups and was distinct for different individuals (Figure 4). FOS is known to elevate the growth of Actinobacteria both in vitro and in vivo.22–24 Accordingly, consistent responses of the phylum Actinobacteria to FOS treatment were observed across all time points for all three tested microbiomes (Figure 5). Genus level analysis also showed that the two most abundant genera from Actinobacteria, Collinsella and Bifidobacterium, were consistently increased by FOS treatment (Figure S1). The relative abundances of several phyla, such as Verrucomicrobia and Fusobacteria, were found to be responsive to freezing in certain microbiomes (Figure 4). In microbiome V31, the relative abundance of Verrucomicrobia was increased in the cultured samples using biobanked stools compared to those using fresh stools. In microbiome V33, Fusobacteria were found to increase when frozen inoculums were used. With the supplementation of FOS, the relative abundances of Verrucomicrobia and Fusobacteria in cultured microbiomes using frozen inoculums were decreased to similar levels to those using fresh inoculums in V31 and V33, respectively (Figure S2). These findings suggest that biobanking might lead to growth advantages for some bacterial species in the microbial community.
Figure 4.
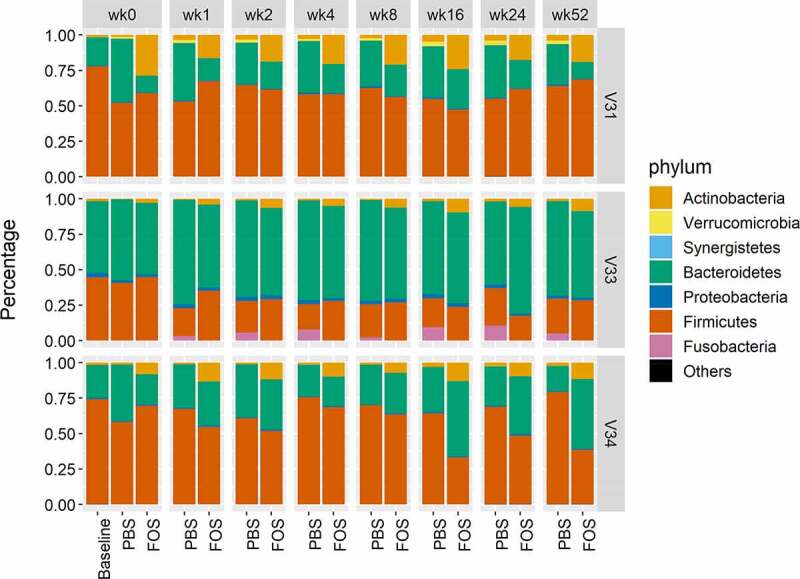
Phylum level composition of baseline and cultured microbiomes using fresh or frozen biobanked stools. Group average of relative abundances was used for plotting. Baseline, uncultured microbiome samples; FOS, fructo-oligosaccharide treatment group; PBS, phosphate buffered saline treatment group. V31, V33 and V34, origin donors of the microbiome samples. Different colors indicate phyla as indicated in the legend. Column facet grid names (wk0, 1, 2, 4, 8, 16, 24 and 52) indicate the weeks of frozen in −80°C prior to culturing.
Figure 5.
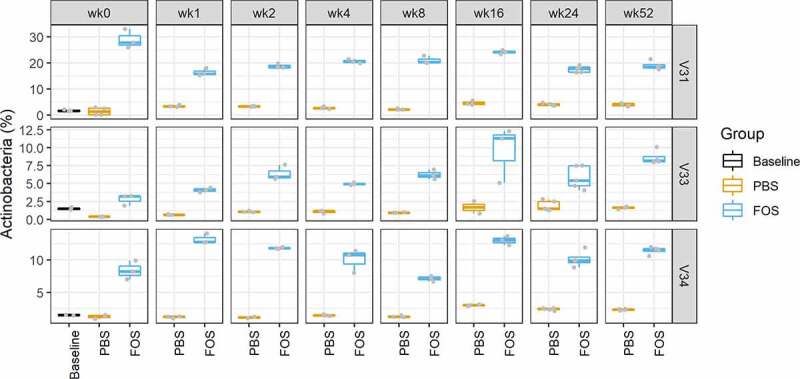
Relative abundances of Actinobacteria in baseline and cultured microbiomes using fresh or frozen biobanked stools. Baseline, uncultured microbiome samples; FOS, fructo-oligosaccharide treatment group; PBS, phosphate buffered saline treatment group. V31, V33 and V34, origin donors of the microbiome samples. Column facet grid names (wk0, 1, 2, 4, 8, 16, 24 and 52) indicate the weeks of frozen in −80°C prior to culturing. Box plots were generated using ggplot2 with data points overlapped with the boxes. The first and third quantiles were indicated as the box width and median was also displayed in the middle of box. Upper and lower whiskers indicate the smallest value ≥1.5 interquartile range (IQR) and largest value ≤1.5 IQR, respectively.
Microbiota cultivability is better maintained on ice with buffer than on dry ice
During biobanking, there is usually a delay prior to sample processing as the stools are usually collected off-site and shipped/transferred to the laboratory. We thereby evaluated whether fecal microbiota samples are stable during a delayed sample processing. We first compared stools that are (1) processed immediately, (2) stored on ice for 6 hours in deoxygenated glycerol buffer, and (3) directly stored on dry ice for 6 hours. Each of the stools was processed and cultured using RapidAIM assay with or without the treatment of FOS, and cultured samples were collected for metaproteomic analyses. PCA analysis of quantified protein groups showed that, for all the 3 tested microbiomes, most variations were found to be contributed by FOS treatment, however the samples from stools that were kept on dry ice were separated from fresh stools or stools that were kept on ice (Figure 6a). Taxonomic analysis also showed that the phylum level composition was more similar between fresh and ice-stored microbiomes than that between fresh and dry ice-stored microbiomes (Figure 6b). Interestingly, Fusobacteria were also found to be increased in V33 samples with dry ice-stored stools as inoculum, but not in those with ice-stored stools as inoculum (Figure 6b). These findings suggest that temporary storage of fecal samples on ice with deoxygenated glycerol buffer is better than on dry ice for maintaining the cultivability of microbiomes.
Figure 6.
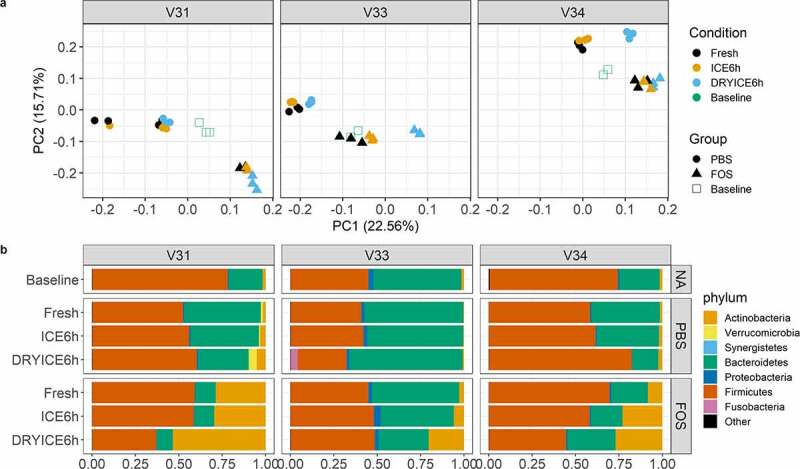
Effects of delayed fecal sample processing on the cultivability of microbiomes. (a) Principal component analysis (PCA) score plots of quantified protein groups. Baseline, uncultured microbiome samples; FOS, fructo-oligosaccharide treatment group; PBS, phosphate buffered saline treatment group. V31, V33 and V34, origin donors of the microbiome samples; Fresh, culturing with fresh stools; ICE6h, culturing with stools stored on ice for 6 hours; DRYICE6h, culturing with stools stored on dry ice for 6 hours. (b) Phylum level taxonomic compositions as calculated using metaproteomic data. Group average of relative abundances was used for plotting. NA indicated no treatment/culturing for baseline samples. Different colors indicate different phyla as shown in the legend at the bottom.
We also evaluated whether fecal samples can be stored on ice for up to 48 hours mimicking a two-day shipping procedure for sample collection. Briefly, we simulated the shipping process by keeping stools in shipping packages with ice packs for 0, 24 and 48 hours, respectively, prior to processing and RapidAIM culturing. As shown in Figure 7a, while there was a shift along with the increase of shipping hours at PC2 (explained 7.26% of the total variations), most of the variations (57.12%) of the overall microbiome protein expressions were contributed by the treatment by FOS. Taxonomic analysis also showed that relatively stable phylum level composition of cultured microbiomes was obtained for up to 48 hours, and consistent responses of cultured microbiomes to FOS treatment were achieved (Figure 7b).
Figure 7.
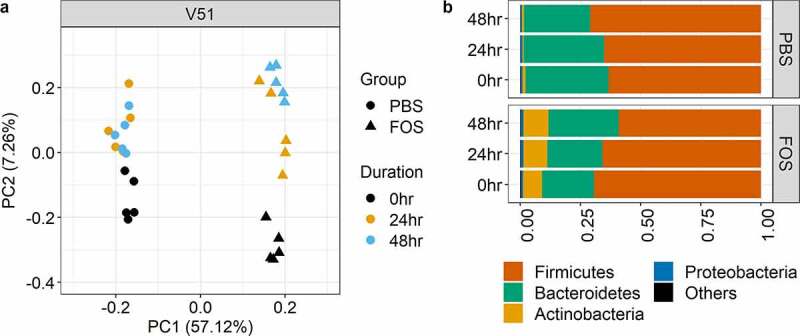
Influence of two-day delayed processing on the cultivability of microbiomes. (a) Principal component analysis (PCA) score plots of quantified protein groups. FOS, fructo-oligosaccharide treatment group; PBS, phosphate buffered saline treatment group. V51, origin donor of the microbiome samples; Duration of 0 hr, 24 hr and 48 hr (different colors) indicate the stool processing were processed immediately, delayed for 24 hours and 48 hours, respectively. (b) Phylum level taxonomic compositions as calculated using metaproteomic data. Group average of relative abundances was used for plotting. Different colors indicate different phyla as shown in the legend at the bottom.
Discussion
The development of novel intervention approaches targeting the gut microbiome requires a high throughput screening of potential therapeutics against the microbiome, which leads to the increasing use of live microbiota.25 Due to the operational challenges for using fresh stools, most studies used frozen biobanked samples. However, evaluation of the functionality of frozen microbiotas has not been standardized and was missed in most studies. A few studies evaluated the performance of frozen microbiota using animal models and FMT.20,21 However, animal experiments are expensive and time-consuming. In this study, we used the RapidAIM assay11 and metaproteomics to evaluate over 1 year whether frozen fecal microbiota in deoxygenated glycerol buffer maintains the microbiome cultivability and functional activity.
RapidAIM is an in vitro assay of individual microbiomes, which has been applied to study various compounds, such as FDA-approved drugs, resistant starches, and natural compounds, for their effects on human gut microbiomes.8–11 We have previously shown that RapidAIM maintains the functional and compositional profiles of microbiome and recapitulates known in vivo effects of drugs, such as metformin.10 Here, microbiomes cultured in the RapidAIM assay with and without a compound (i.e., FOS) with known microbiota-modulating effects were compared to baseline/uncultured microbiome samples (i.e., baseline, non-treated, and FOS-treated groups). We used quantitative metaproteomics to measure the expressed proteins and functions, because we were particularly interested in the functional state of the microbiomes, which is best assessed at the protein level instead of DNA level (16S rRNA gene sequencing or metagenomics).26 Moreover, recent development of MS-based deep metaproteomics approaches26–28 allows rapid and comprehensive profiling of the functions of the cultured microbiomes in this study. In agreement with previous FMT and animal studies,20,21 we did not observe obvious detrimental effects on the functional profiles of the microbiomes frozen up to a year. Consistent responses of microbiome to FOS treatment, including the upregulation of Actinobacteria, were achieved using either fresh or frozen fecal samples. It is noteworthy that FOS treatment has strong in vitro modulating effects on microbiota, and additional treatment groups in RapidAIM assay with compounds that have mild and moderate microbiota-modulating effects will enable more efficient evaluations.
Time spent in transporting and processing the stools is an important factor that may affect the viability of microbiota for biobanking. Gratton et al. reported that temperatures during transportation markedly affected the metabolite profiles of crude feces due to the microbial fermentation, which was reduced at 4°C.29 Fecal samples frozen at −20°C showed increased levels of amino acids, nicotinate and decreased levels of short-chain fatty acids (SCFAs) when compared to fresh samples.29 Therefore, Gheorghe et al. recommended that fecal samples should be kept at 4°C or on ice after collection and during transportation to better maintain the viability of microbiota for FMT.30 Burz et al. provided a comprehensive guideline in handling and storing stools for FMT through a systemic evaluation using 16S rRNA sequencing, metabolomic fingerprinting and flow cytometry, which also suggested that fresh samples should refrigerated at 4℃ if the transformation to transplant process exceeded 24 hours.31 Accordingly, in the current study, we demonstrated that the cultivability of microbiome and functional responses to treatment with FOS were better maintained in deoxygenated buffer on ice than on dry ice, and the microbiome was stable on ice in buffer for 48 hours. Cultured microbiomes using feces stored on dry ice showed marked changes in taxonomic compositions, even at phylum level, when compared to those using fresh feces. A limitation of the current study is the lack of direct comparison of stools stored with and without deoxygenated glycerol buffer for delayed sample processing, which is worth for further investigations. Nevertheless, the findings of this study confirm that fecal samples can be collected off-site, stored on ice, and shipped to laboratory using a standard two-day courier for further processing. Altogether, this study suggests the feasibility of using properly biobanked live microbiota for applications, such as drug-microbiome interaction study or FMT.
It is noteworthy that although no obvious detrimental effect of freezing or delayed sample processing was observed in this study, we did observe some taxonomic changes that can be associated with freezing. For example, in microbiome V31, the relative abundance of genus Akkermansia (phylum Verrucomicrobia) in cultured microbiomes was increased when frozen feces were used as inoculum, including those on dry ice for only 6 hours. This might be due to the better resistance of Akkermansia species, such as A. muciniphila, to stressors including low temperature and oxygen.32 Interestingly, Verrucomicrobia has also been frequently reported to be abundant bacteria in microbial communities of sub-ice waters,33,34 indicating their resilience to low temperature and may be more viable following freeze-thaw cycles. Similarly, Fusobacterium (phylum Fusobacteria), a type of gram-negative anaerobic bacteria that has been frequently considered as pathogens and being associated with diseases including colorectal cancer,35–37 also showed higher relative abundance in cultured microbiome samples using frozen stools as inoculum. These findings indicate the differential impacts of freezing on individual’s microbiome and suggest that the evaluation of biobanked microbiome viability and cultivability is needed for each individual microbiome.
In summary, this study combines an ex vivo microbiome assay and metaproteomics to rapidly evaluate the impacts of freezing and delayed sample processing on the cultivability and functional activity of individual microbiome. We showed that the fecal microbiome is stable in deoxygenated buffer with preservant, such as glycerol, on ice for 48 hours, allowing for off-site sample collection and standard two-day shipping to the laboratory. We also demonstrated that freezing the microbiomes at −80°C for one year has minimal detrimental effects on the cultivability of microbiomes and functional responses to treatment with FOS, although changes on some bacterial species, such as those in Verrucomicrobia and Fusobacteria, can be observed in some individual microbiomes. It remains to be studied whether freezing for longer than one year and/or at lower temperature (e.g., liquid nitrogen) affects the functionality of biobanked microbiome. Nevertheless, we recommend that for live microbiota biobanking: 1) fecal samples need to be collected using a deoxygenated buffer with preservant, 2) immediately placed on ice and transferred to the facility within 48 hours, and 3) processed in anaerobic conditions upon reception for biobanking. Our results also suggest that each microbiome needs to be evaluated for its functionality prior to usage for microbiome assay or transplantation.
Materials and methods
Human stool collection, processing, and storage
The protocol for human stool sample collection (# 20160585–01 H) was approved by the Ottawa Health Science Network Research Ethics Board at the Ottawa Hospital, Ottawa, Canada. Four healthy volunteers (V31, V33, V34 and V51, with age of 34, 31, 48, and 49 years old, respectively; two men and two women) were recruited for stool sample collection. Exclusion criteria for participation included the presence of irritable bowel syndrome, inflammatory bowel disease, or diabetes diagnosis; antibiotic use or gastroenteritis episode in three months preceding collection; use of pro-/pre-biotic, laxative, or anti-diarrheal drugs in the last month preceding collection; or pregnancy. Approximately 8 g of fresh stools were collected from the volunteers and were immediately kept on dry ice or immersed in 20 mL pre-reduced deoxygenated preservation buffer in 50 mL sterile conical centrifuge tubes. The deoxygenated preservation buffer was prepared with sterile phosphate-buffered saline (PBS, pH 7.6) with a final concentration of 10% (v/v) glycerol and 0.1% (w/v) L-cysteine hydrochloride. Prior to usage, the preservation buffer was stored in anaerobic workstation (5% H2, 5% CO2, and 90% N2) for overnight with the lid open for gas exchange.
For the first experiment to evaluate the effects of freezing, stools that were kept in deoxygenated preservation buffer were immediately transferred to anaerobic workstation and homogenized to make a 20% (w/v) fecal slurry by adding additional pre-reduced deoxygenated preservation buffer followed by filtering using sterile gauzes to remove large particles. A minimum of eight aliquots were generated for each microbiome. One aliquot was directly used for RapidAIM culturing (see details below), and the other aliquots were stored in −80°C for future use at 1, 2, 4, 8, 16, 24, and 52 weeks, respectively. For the second experiment to evaluate the effects of stool transportation on dry ice, stools were kept on dry ice or in deoxygenated preservation buffer on ice for 6 hours. After that, both stool samples were transferred to anaerobic workstation for processing to make a 20% (w/v) fecal slurry as described above. Both samples were then used as inoculum directly for RapidAIM culturing (see details below). For the third experiment to evaluate the effects of delayed sample processing, approximately 8 g of fresh stools were kept in 20 mL deoxygenated preservation buffer in 50 mL sterile conical centrifuge tubes and stored on ice for 24 or 48 hours prior to sample preprocessing and RapidAIM culturing as described above.
RapidAIM culturing and metaproteomic sample processing
RapidAIM culturing was performed with a 96-well plate and optimized gut microbiota culture medium as described previously.11 The culture medium was composed of 2.0 g L−1 peptone water, 2.0 g L−1 yeast extract, 0.5 g L−1 L-cysteine hydrochloride, 2 mL L−1 Tween 80, 5 mg L−1 hemin, 5 μL L−1 vitamin K1, 1.0 g L−1NaCl, 0.4 g L−1 K2HPO4, 0.4 g L−1 KH2PO4, 0.1 g L−1 MgSO4 · 7H2O, 0.1 g L−1 CaCl2 · 2H2O, 4.0 g L−1NaHCO3, 4.0 g L−1 porcine gastric mucin, 0.25 g L−1 sodium cholate, and 0.25 g L−1 sodium chenodeoxycholate. The culture medium was equilibrated in anaerobic workstation overnight before use. Fresh fecal slurry was inoculated into 1 ml microbiota culture medium at a final fecal concentration of 2% (w/v), while frozen fecal slurry was thawed at 37°C with thorough shaking prior to inoculation. FOS was added at a final concentration of 5 mg/ml and PBS (pH 7.6) was added as vehicle control at the same volume of FOS. Following the addition of inoculums, FOS or PBS, the plates were covered with vented sterile silicone mats and shaken at 500 rpm at 37°C for 24 hours in the anaerobic workstation. Baseline samples were collected from the culturing plate after a brief shaking for 2 min after inoculation of microbiota.
Microbial cell harvesting and metaproteomic sample processing were performed according to our previously established workflow.38 Briefly, following culturing, samples were transferred from 96-well plates to individual 1.5 ml Eppendorf tubes for centrifugation at 14,000 g for 20 min at 4°C to pellet the microbiota cells. The pelleted microbiota cells were then resuspended with 1 mL cold PBS and centrifuged at 300 g at 4°C for 5 min to remove any debris. The supernatants were then transferred into new 1.5 ml tubes for two additional rounds of debris removal, and the resulting supernatants were centrifuged at 14,000 g at 4°C for 20 min to pellet the microbiota cells. The pelleted microbiota cells were washed twice by resuspending in 1 ml cold PBS, centrifugation at 14,000 g at 4°C for 20 min followed by supernatant removal. The harvested microbiota cell pellets were then stored at −80°C prior to protein extraction and digestion.
Protein extraction was performed by resuspending the microbiota cell pellets in 100 µL lysis buffer containing 8 M urea, 4% (w/v) sodium dodecyl sulfate (SDS), 50 mM Tris-HCl (pH 8.0), and Roche cOmplete™ Mini protease inhibitor. Lysis was then carried out with three ultrasonications (30 s each with 30s interval on ice) using QSonica Q125 sonicator (QSonica LLC., Newtown, USA) with an amplitude of 25%. After sonication, samples were centrifuged at 16,000 g at 8°C for 10 min to remove any cell debris, and the supernatant was transferred to new tube for precipitation using 5-fold volumes of ice-cold protein precipitation buffer (acetone/ethanol/acetic acid, 50/50/0.1 (v/v/v)) overnight at −20°C. Proteins were pelleted by centrifugation at 16,000 g at 4°C for 25 min. The proteins were then washed three times by resuspending in ice-cold pure acetone and centrifugation at 16,000 g at 4°C for 10 min with supernatant being removed. After last acetone wash, protein pellets were resuspended in 100 µL of 6 M urea in 50 mM ammonium bicarbonate for DC® protein assay (Bio-Rad Laboratories) and trypsin digestion.
Fifty micrograms of proteins of each sample were used for in-solution trypsin digestion as described previously.38 Briefly, the proteins were first reduced with 10 mM dithiothreitol (DTT) at 56°C for 30 min and alkylated in the dark with 20 mM iodoacetamide (IAA) at room temperature for 45 min. Then the lysates were diluted using 50 mM ammonium bicarbonate to reduce the concentration of urea to less than 1 M. One μg of trypsin (Worthington Biochemical Corp., Lakewood, NJ) and the tryptic digestion was performed at 37°C overnight with agitation. The tryptic peptides were then purified using a 10-μm C18 column and eluted with 80% acetonitrile (v/v)/0.1% formic acid (v/v). After evaporation, the tryptic peptides were dissolved in 0.1% formic acid (v/v) for MS analysis.
Liquid chromatography-tandem mass spectrometry
Tryptic peptides were analyzed on a Q Exactive mass spectrometer (ThermoFisher Scientific Inc.) coupled with a high-performance liquid chromatography. The separation of peptides was performed on an analytical column (75 μm × 50 cm) packed with reverse phase beads (1.9 μm; 120-Å pore size) with 2-hour gradient from 5 to 35% acetonitrile (v/v) at a flow rate of 200 nl/min. The MS method consisted of one full MS scan from 300 to 1800 m/z followed by data-dependent MS/MS scan of the 12 most intense ions. A dynamic exclusion repeat count was set to 2, and the repeat exclusion duration to 30s. All data were recorded by Xcalibur version 4.3 and exported into RAW format for further peptide/protein identification and quantification.
Since the experiments in this study span for around 1 year, the samples were run on MS at different batches. To monitor the performance and consistency of MS measurement, a quality control (QC) sample was prepared by randomly mixing 10 samples and aliquoted for MS run at each batch of MS measurement.
Bioinformatic data analysis and visualization
All MS raw files were subjected to data processing using MetaLab (version 1.2), a bioinformatic tool for automated and comprehensive metaproteomic data analysis.39 Briefly, peptides and proteins were identified and quantified using the MetaPro-IQ workflow.40 To generate a reduced database, redundant spectra were removed using a spectral clustering strategy and the resulting clustered spectra were then searched against the human gut microbial gene catalog database (containing 9.9 million microbial genes).41 All matched proteins were then extracted, and their sequences were compiled as a database for a second step target-decoy database search with a strict filtering of the peptide-spectrum matches (PSMs) based on a false discovery rate (FDR) of 0.01. Relative abundances of identified protein groups were quantified using label-free quantification (LFQ) with maxLFQ algorithm.42 Taxonomic annotation of all identified peptide sequences was performed using a built-in pep2tax database as described previously.39 The identified taxa were then quantified using the intensities of corresponding distinctive peptides and were analyzed at different taxonomic rank levels separately. Identified protein groups were then subjected for functional annotation using eggNOG-mapper.43 In this study, Clusters of Orthologous Groups of proteins (COGs) and COG category were used for functional analyses. Relative abundances of a COG or COG category were derived by summing the LFQ intensities of all protein groups that were annotated as that COG or COG category.
Principal component analysis (PCA) was performed in R (version 4.0.2) using the function prcomp and visualized using autoplot function. To do PCA analysis, quantified protein groups or COGs were first filtered using a criterion of an appearance of non-zero data in ≥ 50% samples; the intensities of the remaining protein groups or COGs were then log10-transformed, and the missing values were imputed using K-nearest neighbors algorithm in R with the function kNN. Taxonomic compositions at phylum or genus level were visualized using a stacked bar plot with ggplot2. Box plots were generated using ggplot2 as well.
Supplementary Material
Funding Statement
This work was supported by the Government of Canada through Genome Canada and the Ontario Genomics Institute [OGI-156 and OGI-149], the Natural Sciences and Engineering Research Council of Canada [NSERC, grant no. 210034], and the Ontario Ministry of Economic Development and Innovation [ORF-DIG-14405 and project 13440].
Disclosure statement
D.F. and A.S. have co-founded MedBiome, a clinical microbiomics company. All other authors declare no potential conflicts of interest.
Data availability
All MS proteomics data along with the MetaLab search results were deposited to the ProteomeXchange Consortium (http://www.proteomexchange.org) via the PRIDE partner repository with the dataset identifier PXD028857.
Supplementary material
Supplemental data for this article can be accessed on the publisher’s website
References
- 1.Fan Y, Pedersen O.. Gut microbiota in human metabolic health and disease. Nat Rev Microbiol. 2021;19:55–13. doi: 10.1038/s41579-020-0433-9. [DOI] [PubMed] [Google Scholar]
- 2.Caruso R, Lo BC, Nunez G. Host-microbiota interactions in inflammatory bowel disease. Nat Rev Immunol. 2020;20:411–426. [DOI] [PubMed] [Google Scholar]
- 3.Clemente JC, Ursell LK, Parfrey LW, Knight R. The impact of the gut microbiota on human health: an integrative view. Cell. 2012;148:1258–1270. doi: 10.1016/j.cell.2012.01.035. [DOI] [PMC free article] [PubMed] [Google Scholar]
- 4.Colman RJ, Rubin DT. Fecal microbiota transplantation as therapy for inflammatory bowel disease: a systematic review and meta-analysis. J Crohn’s Colitis. 2014;8:1569–1581. doi: 10.1016/j.crohns.2014.08.006. [DOI] [PMC free article] [PubMed] [Google Scholar]
- 5.van Nood E, Vrieze A, Nieuwdorp M, Fuentes S, Zoetendal EG, de Vos WM, Visser CE, Kuijper EJ, Bartelsman JFWM, Tijssen JGP, et al. Duodenal infusion of donor feces for recurrent Clostridium difficile. N Engl J Med. 2013;368:407–415. doi: 10.1056/NEJMoa1205037. [DOI] [PubMed] [Google Scholar]
- 6.Davar D, Dzutsev AK, McCulloch JA, Rodrigues RR, Chauvin JM, Morrison RM, Deblasio RN, Menna C, Ding Q, Pagliano O, et al. Fecal microbiota transplant overcomes resistance to anti-PD-1 therapy in melanoma patients. Science. 2021;371:595–602. doi: 10.1126/science.abf3363. [DOI] [PMC free article] [PubMed] [Google Scholar]
- 7.Baruch EN, Youngster I, Ben-Betzalel G, Ortenberg R, Lahat A, Katz L, Adler K, Dick-Necula D, Raskin S, Bloch N, et al. Fecal microbiota transplant promotes response in immunotherapy-refractory melanoma patients. Science. 2021;371:602–609. doi: 10.1126/science.abb5920. [DOI] [PubMed] [Google Scholar]
- 8.Li L, Chang L, Zhang X, Ning Z, Mayne J, Ye Y, Stintzi A, Liu J, Figeys D. Berberine and its structural analogs have differing effects on functional profiles of individual gut microbiomes. Gut Microbes. 2020;11:1348–1361. doi: 10.1080/19490976.2020.1755413. [DOI] [PMC free article] [PubMed] [Google Scholar]
- 9.Li L, Ryan J, Ning Z, Zhang X, Mayne J, Lavallee-Adam M, Stintzi A, Figeys D. A functional ecological network based on metaproteomics responses of individual gut microbiomes to resistant starches. Comput Struct Biotechnol J. 2020;18:3833–3842. doi: 10.1016/j.csbj.2020.10.042. [DOI] [PMC free article] [PubMed] [Google Scholar]
- 10.Li L, Abou-Samra E, Ning Z, Zhang X, Mayne J, Wang J, Cheng K, Walker K, Stintzi A, and Figeys D . An in vitro model maintaining taxon-specific functional activities of the gut microbiome. Nat Commun. 2019;10:4146. doi: 10.1038/s41467-019-12087-8. [DOI] [PMC free article] [PubMed] [Google Scholar]
- 11.Li L, Ning Z, Zhang X, Mayne J, Cheng K, Stintzi A, Figeys D. RapidAIM: a culture- and metaproteomics-based rapid assay of individual microbiome responses to drugs. Microbiome. 2020;8:33. doi: 10.1186/s40168-020-00806-z. [DOI] [PMC free article] [PubMed] [Google Scholar]
- 12.Maier L, Pruteanu M, Kuhn M, Zeller G, Telzerow A, Anderson EE, Brochado AR, Fernandez KC, Dose H, Mori H, et al. Extensive impact of non-antibiotic drugs on human gut bacteria. Nature. 2018;555:623–628. doi: 10.1038/nature25979. [DOI] [PMC free article] [PubMed] [Google Scholar]
- 13.Javdan B, Lopez JG, Chankhamjon P, Lee YJ, Hull R, Wu Q, Wang X, Chatterjee S, Donia MS. Personalized mapping of drug metabolism by the human gut microbiome. Cell. 2020;181:1661–79 e22. doi: 10.1016/j.cell.2020.05.001. [DOI] [PMC free article] [PubMed] [Google Scholar]
- 14.Zhao L, Zhang F, Ding X, Wu G, Lam YY, Wang X, Fu H, Xue X, Lu C, Ma J, et al. Gut bacteria selectively promoted by dietary fibers alleviate type 2 diabetes. Science. 2018;359:1151–1156. doi: 10.1126/science.aao5774. [DOI] [PubMed] [Google Scholar]
- 15.Chen RY, Mostafa I, Hibberd MC, Das S, Mahfuz M, Naila NN, Islam MM, Huq S, Alam MA, Zaman MU, et al. A microbiota-directed food intervention for undernourished children. N Engl J Med. 2021;384:1517–1528. doi: 10.1056/NEJMoa2023294. [DOI] [PMC free article] [PubMed] [Google Scholar]
- 16.Gehrig JL, Venkatesh S, Chang HW, Hibberd MC, Kung VL, Cheng J, Chen RY, Subramanian S, Cowardin CA, Meier MF, et al. Effects of microbiota-directed foods in gnotobiotic animals and undernourished children. Science. 2019;365. [DOI] [PMC free article] [PubMed] [Google Scholar]
- 17.Hamilton MJ, Weingarden AR, Sadowsky MJ, Khoruts A. Standardized frozen preparation for transplantation of fecal microbiota for recurrent Clostridium difficile infection. Am J Gastroenterol. 2012;107:761–767. doi: 10.1038/ajg.2011.482. [DOI] [PubMed] [Google Scholar]
- 18.de Carvalho NM, Oliveira DL, Dib Saleh MA, Pintado M, Madureira AR. Preservation of human gut microbiota inoculums for in vitro fermentations studies. Fermentation. 2021;7:14. doi: 10.3390/fermentation7010014. [DOI] [Google Scholar]
- 19.Guerin-Danan C. Storage of intestinal bacteria in samples frozen with glycerol. Microb Ecol Health Dis. 1999;11:180–182. doi: 10.1080/089106099435772. [DOI] [Google Scholar]
- 20.Ericsson AC, Personett AR, Turner G, Dorfmeyer RA, Franklin CL. Variable colonization after reciprocal fecal microbiota transfer between mice with low and high richness microbiota. Front Microbiol. 2017;8:196. doi: 10.3389/fmicb.2017.00196. [DOI] [PMC free article] [PubMed] [Google Scholar]
- 21.Papanicolas LE, Choo JM, Wang Y, Leong LEX, Costello SP, Gordon DL, Wesselingh SL, Rogers GB. Bacterial viability in faecal transplants: which bacteria survive? EBioMedicine. 2019;41:509–516. doi: 10.1016/j.ebiom.2019.02.023. [DOI] [PMC free article] [PubMed] [Google Scholar]
- 22.Mao B, Gu J, Li D, Cui S, Zhao J, Zhang H, Chen W. Effects of different doses of fructooligosaccharides (FOS) on the composition of mice fecal microbiota, especially the bifidobacterium composition. Nutrients. 2018;10:1105. doi: 10.3390/nu10081105. [DOI] [PMC free article] [PubMed] [Google Scholar]
- 23.Liu F, Li P, Chen M, Luo Y, Prabhakar M, Zheng H, He Y, Qi Q, Long H, Zhang Y, et al. Fructooligosaccharide (FOS) and galactooligosaccharide (GOS) increase bifidobacterium but reduce butyrate producing bacteria with adverse glycemic metabolism in healthy young population. Sci Rep. 2017;7:11789. doi: 10.1038/s41598-017-10722-2. [DOI] [PMC free article] [PubMed] [Google Scholar]
- 24.Zhang X, Ning Z, Mayne J, Deeke SA, Li J, Starr AE, Chen R, Singleton R, Butcher J, Mack DR, et al. In vitro metabolic labeling of intestinal microbiota for quantitative metaproteomics. Anal Chem. 2016;88(12):6120–6125. doi: 10.1021/acs.analchem.6b01412. [DOI] [PubMed] [Google Scholar]
- 25.Zhang X, Li L, Butcher J, Stintzi A, Figeys D. Advancing functional and translational microbiome research using meta-omics approaches. Microbiome. 2019;7:154. [DOI] [PMC free article] [PubMed] [Google Scholar]
- 26.Zhang X, Figeys D. Perspective and guidelines for metaproteomics in microbiome studies. J Proteome Res. 2019;18:2370–2380. doi: 10.1021/acs.jproteome.9b00054. [DOI] [PubMed] [Google Scholar]
- 27.Gonzalez CG, Wastyk HC, Topf M, Gardner CD, Sonnenburg JL, Elias JE. High-throughput stool metaproteomics: method and application to human specimens. mSystems. 2020;5. doi: 10.1128/mSystems.00200-20. [DOI] [PMC free article] [PubMed] [Google Scholar]
- 28.Zhang X, Chen W, Ning Z, Mayne J, Mack D, Stintzi A, Tian R, Figeys D. Deep metaproteomics approach for the study of human microbiomes. Anal Chem. 2017;89:9407–9415. doi: 10.1021/acs.analchem.7b02224. [DOI] [PubMed] [Google Scholar]
- 29.Gratton J, Phetcharaburanin J, Mullish BH, Williams HR, Thursz M, Nicholson JK, Holmes E, Marchesi JR, Li JV. Optimized sample handling strategy for metabolic profiling of human feces. Anal Chem. 2016;88:4661–4668. doi: 10.1021/acs.analchem.5b04159. [DOI] [PubMed] [Google Scholar]
- 30.Gheorghe CE, Ritz NL, Martin JA, Wardill HR, Cryan JF, Clarke G. Investigating causality with fecal microbiota transplantation in rodents: applications, recommendations and pitfalls. Gut Microbes. 2021;13:1941711. [DOI] [PMC free article] [PubMed] [Google Scholar]
- 31.Burz SD, Abraham AL, Fonseca F, David O, Chapron A, Beguet-Crespel F, Cénard S, Le Roux K, Patrascu O, Levenez F, et al. A guide for ex vivo handling and storage of stool samples intended for fecal microbiota transplantation. Sci Rep. 2019;9:8897. doi: 10.1038/s41598-019-45173-4. [DOI] [PMC free article] [PubMed] [Google Scholar]
- 32.Machado D, Almeida D, Seabra CL, Andrade JC, Gomes AM, Freitas AC. Uncovering Akkermansia muciniphila resilience or susceptibility to different temperatures, atmospheres and gastrointestinal conditions. Anaerobe. 2020;61:102135. doi: 10.1016/j.anaerobe.2019.102135. [DOI] [PubMed] [Google Scholar]
- 33.Tran P, Ramachandran A, Khawasik O, Beisner BE, Rautio M, Huot Y, Walsh DA. Microbial life under ice: metagenome diversity and in situ activity of Verrucomicrobia in seasonally ice-covered Lakes. Environ Microbiol. 2018;20:2568–2584. doi: 10.1111/1462-2920.14283. [DOI] [PubMed] [Google Scholar]
- 34.Cabello-Yeves PJ, Zemskaya TI, Rosselli R, Coutinho FH, Zakharenko AS, Blinov VV, Rodriguez-Valera F. Genomes of Novel microbial lineages assembled from the sub-ice waters of lake baikal. Appl Environ Microbiol. 2018;84. doi: 10.1128/AEM.02132-17. [DOI] [PMC free article] [PubMed] [Google Scholar]
- 35.Parhi L, Alon-Maimon T, Sol A, Nejman D, Shhadeh A, Fainsod-Levi T, Yajuk O, Isaacson B, Abed J, Maalouf N, et al. Breast cancer colonization by Fusobacterium nucleatum accelerates tumor growth and metastatic progression. Nat Commun. 2020;11:3259. [DOI] [PMC free article] [PubMed] [Google Scholar]
- 36.Yu T, Guo F, Yu Y, Sun T, Ma D, Han J, Qian Y, Kryczek I, Sun D, Nagarsheth N, et al. Fusobacterium nucleatum promotes chemoresistance to colorectal cancer by modulating autophagy. Cell. 2017;170:548–63 e16. doi: 10.1016/j.cell.2017.07.008. [DOI] [PMC free article] [PubMed] [Google Scholar]
- 37.Han YW. Fusobacterium nucleatum: a commensal-turned pathogen. Curr Opin Microbiol. 2015;23:141–147. doi: 10.1016/j.mib.2014.11.013. [DOI] [PMC free article] [PubMed] [Google Scholar]
- 38.Zhang X, Li L, Mayne J, Ning Z, Stintzi A, Figeys D. Assessing the impact of protein extraction methods for human gut metaproteomics. J Proteomics. 2018;180:120–127. doi: 10.1016/j.jprot.2017.07.001. [DOI] [PubMed] [Google Scholar]
- 39.Cheng K, Ning Z, Zhang X, Li L, Liao B, Mayne J, Stintzi A, Figeys D. MetaLab: an automated pipeline for metaproteomic data analysis. Microbiome. 2017;5:157. [DOI] [PMC free article] [PubMed] [Google Scholar]
- 40.Liu CW, Chi L, Tu P, Xue J, Ru H, Lu K. Isobaric labeling quantitative metaproteomics for the study of gut microbiome response to arsenic. J Proteome Res. 2019;18:970–981. doi: 10.1021/acs.jproteome.8b00666. [DOI] [PubMed] [Google Scholar]
- 41.Li J, Jia H, Cai X, Zhong H, Feng Q, Sunagawa S, Arumugam M, Kultima JR, Prifti E, Nielsen T, et al. An integrated catalog of reference genes in the human gut microbiome. Nat Biotechnol. 2014;32:834–841. doi: 10.1038/nbt.2942. [DOI] [PubMed] [Google Scholar]
- 42.Cox J, Hein MY, Luber CA, Paron I, Nagaraj N, Mann M. Accurate proteome-wide label-free quantification by delayed normalization and maximal peptide ratio extraction, termed MaxLFQ. Mol Cel Proteom: MCP. 2014;13:2513–2526. doi: 10.1074/mcp.M113.031591. [DOI] [PMC free article] [PubMed] [Google Scholar]
- 43.Huerta-Cepas J, Forslund K, Coelho LP, Szklarczyk D, Jensen LJ, von Mering C, Bork P . Fast genome-wide functional annotation through orthology assignment by eggNOG-mapper. Mol Biol Evol. 2017;34:2115–2122. [DOI] [PMC free article] [PubMed] [Google Scholar]
Associated Data
This section collects any data citations, data availability statements, or supplementary materials included in this article.
Supplementary Materials
Data Availability Statement
All MS proteomics data along with the MetaLab search results were deposited to the ProteomeXchange Consortium (http://www.proteomexchange.org) via the PRIDE partner repository with the dataset identifier PXD028857.


