Abstract
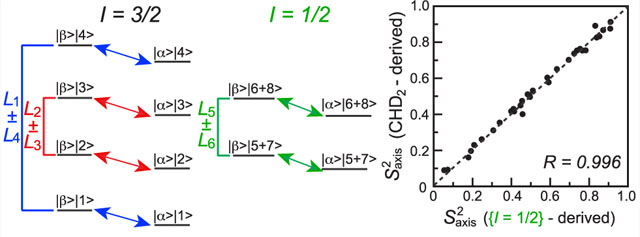
The dynamics of methyl-bearing side chains in proteins were probed by 13C relaxation measurements of a number of 13C magnetization modes in selectively 13CH3-labeled methyl groups of proteins. We first show how 13C magnetization modes in a 13CH3 spin-system can be isolated using acute-angle 1H radio-frequency pulses. The parameters of methyl-axis dynamics, a measure of methyl-axis ordering and the correlation time of fast local methyl-axis motions (τf), derived from 13C relaxation in 13CH3 groups are compared with their counterparts obtained from 13C relaxation in 13CHD2 methyl isotopomers. We show that in high-molecular-weight proteins, excellent correlations are obtained between the [13CHD2]-derived values and those extracted from relaxation of the 13C magnetization of the I = 1/2 manifold in 13CH3 methyls. In smaller proteins, a certain degree of anticorrelation is observed between the and τf values obtained from 13C relaxation of the I = 1/2 manifold magnetization in 13CH3 methyls. These parameters can be partially decorrelated by inclusion in the analysis of relaxation data of the I = 3/2 manifold 13C magnetization.
Graphical Abstract
INTRODUCTION
Protein side-chain motions are one of the principal determinants of conformational entropy of protein structures1,2 and play a significant role in molecular recognition events.3,4 Methyl groups have long been recognized as unique probes of molecular motions and have played a special role in NMR studies of protein side-chain dynamics, providing important insights into the dynamics and thermodynamics of many biochemical processes.5,6 The use of 13C spin relaxation in 13CH3 methyl moieties for the extraction of dynamics parameters, however, is fraught with difficulties, as the interpretation of 13C relaxation in these methyl isotopomers is complicated by interference effects between dipolar fields created by the three magnetically equivalent proton spins that lead to a non-single-exponential decay of the NMR signal.7,8 In contrast, 13C relaxation in 13CHD2 methyl isotopomers9,10 or relaxation of 2H nuclei in 13CH2D-11–13 or 13CHD2-labeled10,13,14 methyl groups present much more favorable alternatives. While relaxation of 2H nuclei in 13CH2D- and 13CHD2-methyls, which is governed almost exclusively by quadrupolar interactions, provides the most robust probe of methyl-axis dynamics,15 NMR experiments that quantify 13C spin relaxation in 13CHD2 methyls are generally more sensitive.10,15 The quantitative interpretation of 13C relaxation in 13CHD2 methyl isotopomers is well established.9,10,15 The use of 13CH3 methyls as probes for side-chain dynamics, however, has indisputable advantages in that no special (deuterium-containing) types of isotopic labels are required and the starting sensitivity of NMR experiments targeting 13CH3 methyls is two- to three-fold higher than those for 13CH2D- and 13CHD2-labeled methyl groups.16
Recently, we demonstrated the utility of acute (<90°)-angle 1H radio frequency (RF) pulses in a variety of NMR applications that target 13CH3 methyl groups in selectively 13CH3-labeled and otherwise perdeuterated proteins. In particular, we showed that more efficient and sensitive selection of 1H and 13C transitions belonging to the I = 1/2 manifolds of 13CH3 groups, which effectively reduces the complexity of a 13CH3 spin system to the simpler case of its AX(13C–1H) counterpart, can be achieved with 1H RF pulses adjusted to ~42°.17 A special case of acute angle pulses, the “magic-angle” (54.7°) 1H pulse, was shown to simplify and improve the sensitivity of NMR experiments that quantify the amplitudes of methyl three-fold symmetry axis motions in the case of small- to intermediate-sized proteins.18 We further demonstrated that the transfer of magnetization to and from the slow-relaxing 13C transitions of 13CH3 methyl groups can be optimized by carefully adjusting the angles of the 1H pulses in INEPT19 transfer schemes.20 This optimized transfer scheme was applied to methyl 13C Carr–Purcell–Meiboom–Gill (CPMG)21,22 relaxation dispersion experiments recorded on the slow-relaxing 13C transitions, significantly increasing the information content of the CPMG relaxation dispersion profiles in cases where the exchange process involved high-molecular-weight species (large protein complexes or partially aggregated states).
Here, we probe the dynamics of methyl-bearing side chains in proteins by separating groups of 13C magnetization modes in 13CH3-methyls using a variety of acute-angle 1H RF pulses and measuring their NMR spin relaxation properties, namely transverse (R2) and longitudinal (R1) relaxation rates. Two parameters that describe methyl-axis dynamics—the order parameter squared of the methyl three-fold symmetry axis, , that reports on the amplitudes of methyl-axis motions and the correlation time of fast local methyl-axis motions, τf, that occurs on the picosecond time scale (including the rotation of the methyl group around its three-fold symmetry axis)—are extracted from relaxation rates of groups of 13C magnetization modes in 13CH3 methyls of a {U-[2H]; Ileδ1-[13CH3]; Leu,Val-[13CH3, 12CD3]}-labeled (ILV-{13CH3}) sample of the protein ubiquitin at 25 and 5 °C (MW = 8.5 kDa) and a {U-[2H]; Ileδ1-[13CH3]}-labeled (Iδ1-{13CH3}) sample of the high-molecular-weight enzyme malate synthase G (MSG, MW = 82 kDa) at 37 °C. The 13CH3-derived reporters of methyl-axis dynamics were compared with their counterparts derived from 13C relaxation rates in 13CHD2 methyl isotopomers using samples of the two proteins with the same labeling schemes, where the 13CH3 methyl groups were substituted for those of the 13CHD2 variety.
METHODS
Details regarding sample expression, purification, and isotope labeling; NMR spectroscopy; and data analysis are provided in the Supporting Information.
RESULTS AND DISCUSSION
The energy-level diagram of a 13CH3 methyl spin system is shown in Figure 1, with the 13C transitions that are the main focus of the present work shown by diagonal arrows. The diagram consists of one manifold with spin I = 3/2 and two manifolds with I = 1/2. In the macromolecular limit, transverse spin-relaxation rates of the inner 13C transitions of the I = 3/2 manifold and those of the I = 1/2 manifolds are generally slower (, shown with red and green arrows for the I = 3/2 and I = 1/2 manifolds, respectively; Figure 1), while the rates of the outer 13C transitions of the I = 3/2 manifold are faster (; blue arrows). By the “modes” of 13C magnetization in this work, we denote classes of 13C transitions (described by 13C spin operators C+ = |α⟩⟨β| and C− = |β⟩⟨α|), as well as the corresponding spin-order groups (populations; described by 13C spin operators Cz = (1/2)(|α⟩⟨α| − |β⟩⟨β|)). These six 13C magnetization modes are differentiated by the eight 1H polarization states |n⟩⟨n|, where the term |n⟩ is a linear combination of |i, j, k⟩, i, j, k ∈{α, β} (Figure 1), and are given by
| (1) |
Figure 1.
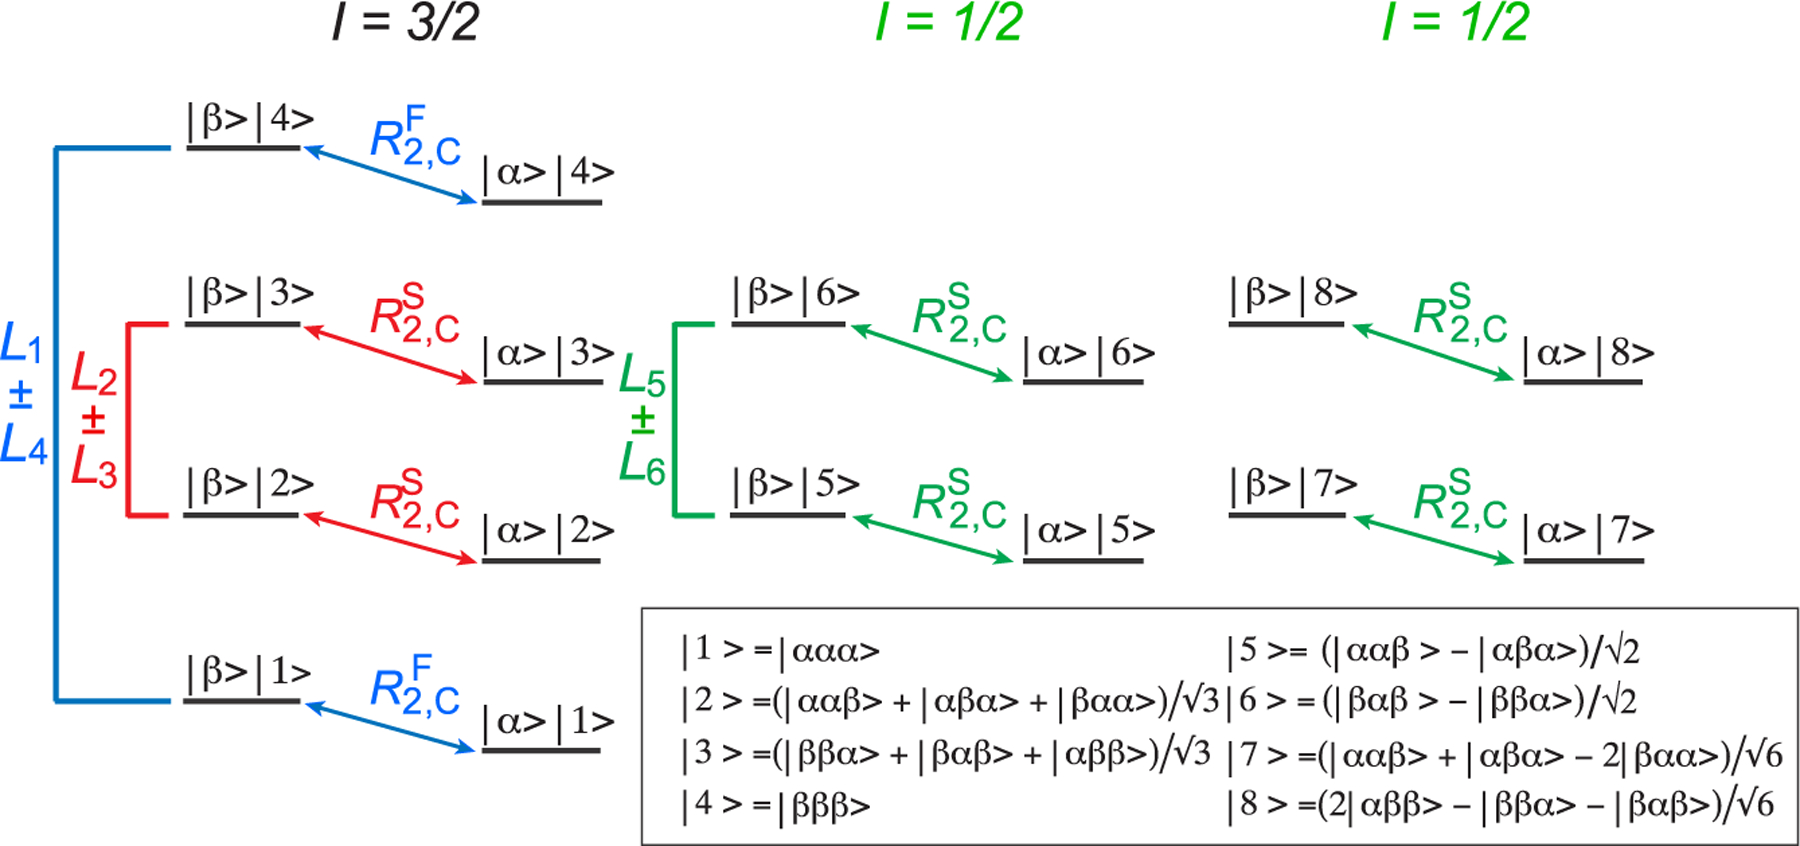
Energy level diagram of the 13CH3 (AX3) spin-system of a methyl group. Single-quantum 13C transitions are shown by diagonal arrows. The slow- and fast-relaxing 13C (R2,C) transitions are distinguished by the superscripts “S” and “F”, respectively. The spin quantum numbers, I, of the three manifolds are specified below the energy-level diagram. The slow- and fast-relaxing 13C transitions of the I = 3/2 manifold are colored in red and blue, respectively, while the transitions of the I = 1/2 manifold are colored in green. Various 13C magnetization modes isolated in the NMR experiments are denoted by Li ± Lj (i,j ∈ {1–6}) and shown using the same coloring scheme. All 16 eigenstates are denoted by |m⟩|n ⟩ , where |m⟩ is the state of the 13C spin, m ∈ {α, β}, and the eight 1H eigenstates |n⟩ are described by linear combinations of |i, j, k⟩ (i, j, k ∈ {α, β}) as shown below the diagram.
Relaxation decay of the modes that include raising or lowering 13C spin operators (C±) is described by transverse (R2) rates, while the longitudinal rates (R1) describe the relaxation of the modes involving longitudinal 13C operators (Cz). Further, we define the subset of 13C magnetization modes that involves the sums of the 1H states (the first three modes in eq 1) as “in-phase” modes and those that involve the differences of 1H states as “antiphase” modes.
Theoretical expressions for R2 and R1 spin relaxation rates of 13C magnetization modes in a 13CH3 methyl group, calculated for intra-methyl interactions using the basis set in eq 1, are presented in the Supporting Information. Here, we only include the relaxation matrix (eq 2) that describes contributions to the R2 and R1 rates arising from dipolar interactions with “external” proton spins (1H spins outside of a given methyl moiety), as these so-called “spin-flipping” rates are central to the content of the present work.
| (2) |
where μ0 is the vacuum permeability constant; γH is the gyromagnetic ratio of proton spins; rhhext is the distance from methyl protons to an external proton spin, with the sum running over all external proton spins in the protein molecule; and τC is the global molecular rotational correlation time. Note that only the spectral density function at zero frequency, J(0), is considered here, and the order parameter of the interactions with external proton spins is assumed to be unity.
Extraction of the parameters of methyl-axis dynamics from 13C relaxation measurements in 13CH3 methyl groups using 1H-detected NMR experiments is hampered by (1) pervasive cross-correlations (interference) between dipolar fields created by the three magnetically equivalent 1H spins (13C–1H/13C–1H and 1H–1H/1H–1H dipole–dipole cross-correlated relaxation) that lead to cross-relaxation between individual 13C magnetization modes, resulting in non-single-exponential decay of coherences of interest;7,8 and (2) dipolar interactions of methyl protons with external 1H spins. The latter contributes to (i) auto-relaxation of 13C magnetization, which is difficult to quantitatively account for even when a high-resolution 3D structure of a protein is available; and (ii) cross-relaxation between 13C magnetization modes that likewise results in non-single-exponential signal decay. In this work, the problem of “cross-talk” (cross-relaxation) between 13C magnetization modes is alleviated by sequestering groups of 13C modes of interest so that only these modes are present at the start of the relaxation delays. Meanwhile, the effects of auto-relaxation from spin-flips are mitigated by either (i) isolation of 13C magnetization that is not affected by spin-flips (in-phase mode of the I = 1/2 manifold, L5 + L6), or (ii) corrections applied to the measured relaxation rates that are based on experimental differences between the rates of the antiphase and in-phase inner 13C modes of the I = 3/2 manifold, (L2 − L3) and (L2 + L3). Note that both auto- and cross-relaxation arising from 1H spin-flips are significantly reduced by high levels of deuteration of protein samples.
As in-phase 13C magnetization of the I = 1/2 manifold (L5 + L6) is “immune” to interactions with external 1H spins (the third row and column of the relaxation matrix in eq 2), we first concentrate on the isolation and measurement of the R2 and R1 relaxation rates of the (L5 + L6) mode using the acute-angle pulse-based methodology described earlier.17 Figure 2 shows the pulse scheme for the measurements of R1ρ and R1 relaxation rates of the (L5 + L6) 13C magnetization mode. The interested reader is referred to our previous publication in ref 17 for details of (L5 + L6) sequestration from the rest of 13C magnetization. Briefly, the inner slow-relaxing multiple-quantum 13C–1H transitions are isolated first by the initial 2τb “purge” element of the scheme, after which a 1H pulse with flip angle α = sin−1(2/3) = 41.8° (shown in green in Figure 2) is applied to eliminate the inner transitions of the I = 3/2 manifold. Subsequently, the remaining fast-relaxing 1H transitions and 1H triple-quantum coherences are eliminated by the second 2τb purge element (enclosed together with the first one in the solid green box in Figure 2) and the “filtering” element with a 2τc duration (enclosed in the dashed green box in Figure 2), respectively. Following the application of a 1Hy pulse that polarizes only the 1H transitions of the I = 1/2 manifold, the rest of the scheme in Figure 2 is the same as that commonly employed for 13C relaxation measurements in AX(13C–1H) spin-systems (e.g., that of a 13CHD2 methyl group). The measurements of R2 and R1 relaxation rates are thus performed on magnetization terms of the type C±(|5⟩⟨5| + |6⟩⟨6| + |7⟩⟨7| + |8⟩⟨8|) and Cz(|5⟩⟨5| + |6⟩⟨6| + |7⟩⟨7| + |8⟩⟨8|), respectively (eq 1). Using the experiment shown in Figure 2, average (L5 + L6) R2 values of 4.2 and 7.5 s−1 are obtained for ILV-{13CH3}-labeled ubiquitin at 25 and 5 °C, respectively; the corresponding (L5 + L6) R1 values are 2.9 and 4.1 s−1, respectively. Average (L5 + L6) R2 and R1 values of 12.1 and 0.95 s−1, respectively, are obtained for ILV-{13CH3}-labeled MSG (37 °C).
Figure 2.
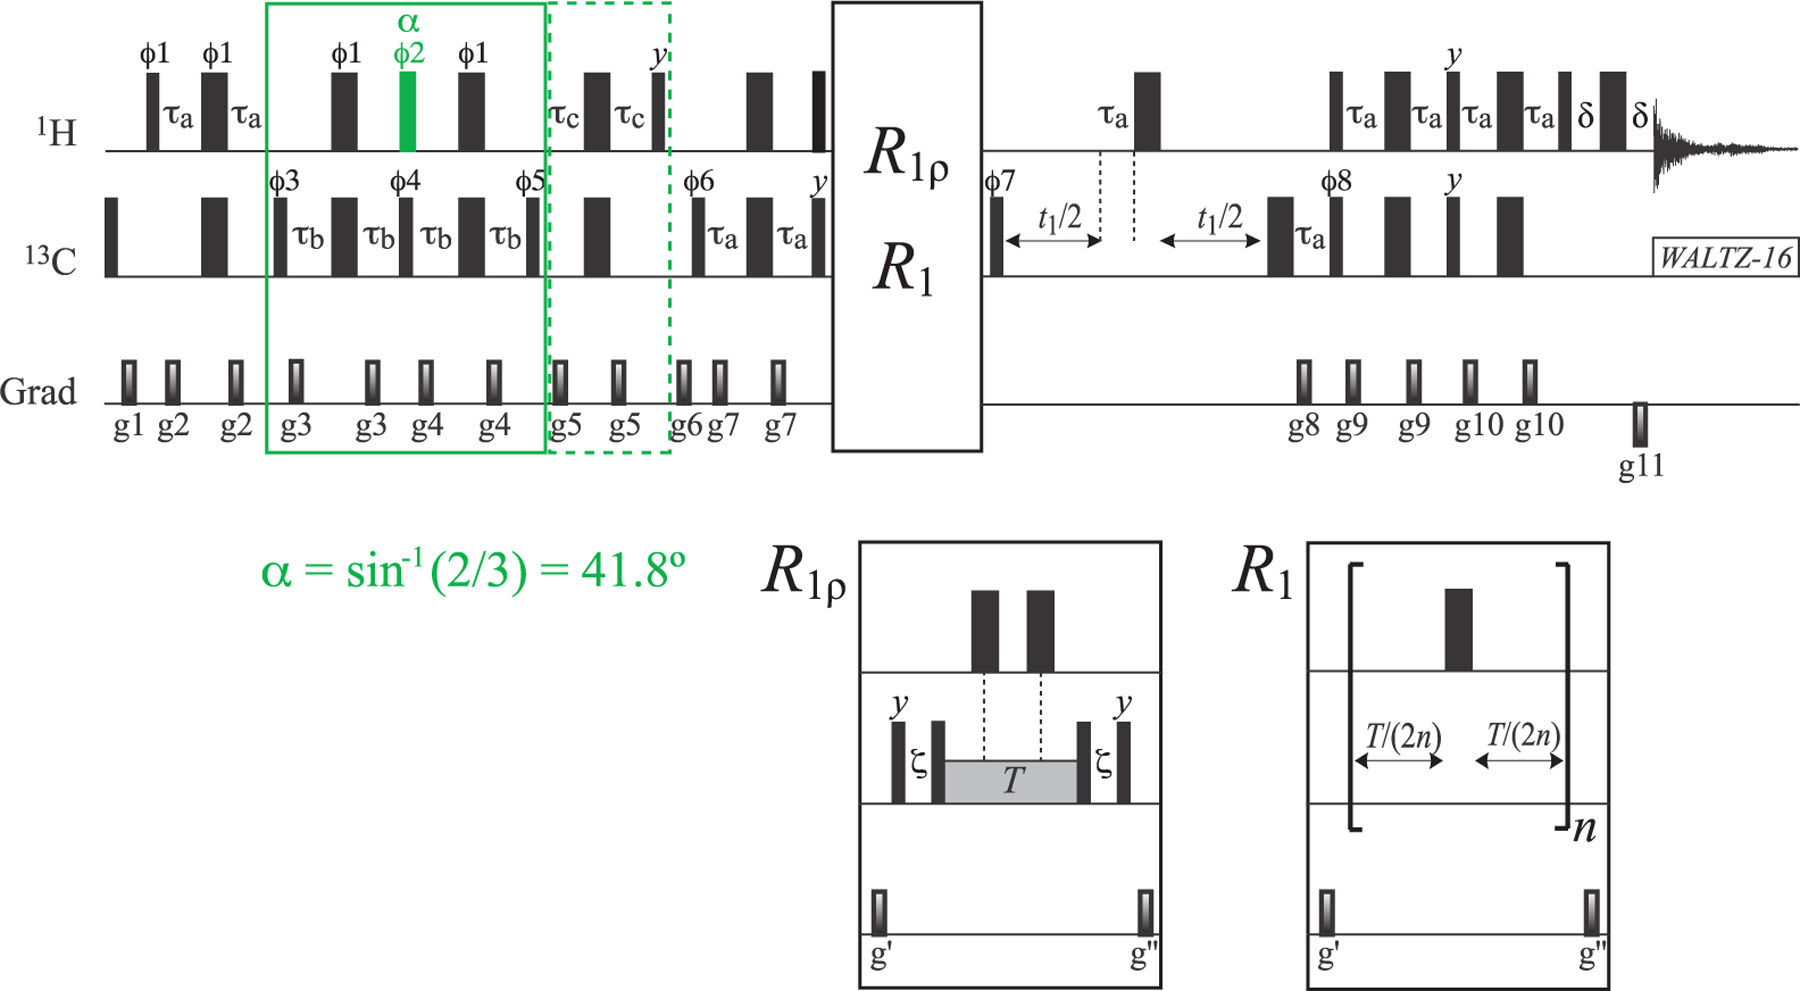
Pulse scheme for the measurement of R1ρ and R1 relaxation rates of the 13C magnetization mode (L5 + L6) (I = 1/2 manifold) in 13CH3 methyl groups. All narrow and wide rectangular pulses are applied with flip angles of 90° and 180°, respectively, along the x-axis unless indicated otherwise. For ILV-{13CH3}-labeled samples, the 1H and 13C carrier frequencies are positioned at 0.5 and 20 ppm, respectively, in the center of the Ileδ1-Leu-Val methyl region; for Iδ1-{13CH3}-labeled samples, the 1H and 13C carrier frequencies are set to 0.7 and 12 ppm, respectively. All 1H and 13C pulses are applied with the highest possible power, while 13C WALTZ-16 decoupling23 is achieved using a 2 kHz field. The 1H pulse colored in green is applied with flip angle α equal to sin−1(2/3) = 41.8°. Delays are τa = 1/(4JHC) = 2.0 ms; τb = 1/(8JHC) = 1.0 ms; τc = 1/(12JHC) = 0.67 ms; δ = 300 μs; and ζ = 1/(2π × BSL) – (4/π) × pwc,24,25 where BSL is the strength of 13C spin-lock field (Hz) applied along the x-axis, “pwc” is the length of the 13C 90° (high power) pulse. T is a variable relaxation delay. The durations and strengths of the pulsed-field gradients (ms; G/cm) are as follows: g1 = (1; 25), g2 = (0.4; 15), g3 = (0.3; 12), g4 = (0.35; 15), g5 = (0.2; 20), g6 = (1.2; −15), g7 = (0.4; 12), g8 = (0.2; 35), g9 = (0.5; 12), g10 = (0.4; 12), g11= (0.053; −35), g′= (1.2; 12), and g″= (0.8; 10). The phase cycle is as follows: ϕ1 = x; ϕ2 = 2(y), 2(−y); ϕ3 = 2(x), 2(−x); ϕ4 = y, −y; ϕ5 = 4(x), 4(−x); ϕ6 = 2(x), 2(−x); ϕ7 = x, −x; ϕ8 = x; receiver phase = 2(x, −x), 2(−x, x). Quadrature detection in t1 is achieved in a Rance-Kay mode26,27 by recording a pair of data sets for each value of t1 corresponding to (ϕ8, g8) and (−ϕ8, −g8). The phase ϕ7 is incremented by 180° along with the phase of the receiver for each complex t1 point.28
The parameters of methyl-axis dynamics (order parameters of the methyl three-fold symmetry axis, , and correlation times of local methyl-axis motions, τf) derived from 13CH3 methyl-labeled samples (see SI “Materials and Methods” for details of data analysis) are compared with their counterparts derived from 13C relaxation of 13CHD2 methyls of ubiquitin and MSG shown in Figures 3 and 4, respectively. Although good correlations are obtained for most methyl sites for the values of in ubiquitin (τC = 5 and 11 ns at 25 and 5 °C, respectively, in D2O solvent), a subset of around six sites showed notably poorer agreement at both temperatures (Figure 3A and C). Better correlations are generally obtained for τf, with only around four methyl sites exhibiting the highest τf values notably overestimated in the (L5 + L6)-derived data set (Figures 3B and D). The disagreements between the two sets of data can be traced to the lower sensitivity of the (L5 + L6) R2 rates toward compared to that of 13C R2 in the 13CHD2 methyl groups. Figure S1 (SI) compares the contour plots or theoretical R2 and R1 rates of the (L5 + L6) mode with those of the 13C nuclei in 13CHD2 methyls as a function of [; τf] for τC = 5 ns. It can be readily appreciated from these plots that since the R2 of (L5 + L6) is dependent on both and τf, these two parameters of dynamics can become significantly anti-correlated. As a consequence, a small error in R1 (and hence τf) can result in a relatively large error of opposite sign in (the two most prominent cases of such a correlation in ubiquitin are labeled in Figure 3). Simulations show that for five of the six methyl sites with the largest disagreements in values in Figures 3A and C, a “correction” of the measured R1 rate by only a few percent (on the order of 0.10–0.12 s−1 in absolute values) is sufficient to “restore” the agreement between the (L5 + L6)-derived and 13CHD2-derived values. The physical origin of the lower sensitivity of the (L5 + L6) R2 rates toward and the ensuing anti-correlations between and τf lie in the contributions to these rates from intramethyl 1H–1H interactions at zero frequency in the limit where the auto-relaxation spectral density is not equal to the cross-correlated relaxation one (see expressions for relaxation rates in SI), which is notably absent from 13C R2 rates in 13CHD2 isotopomers.
Figure 3.
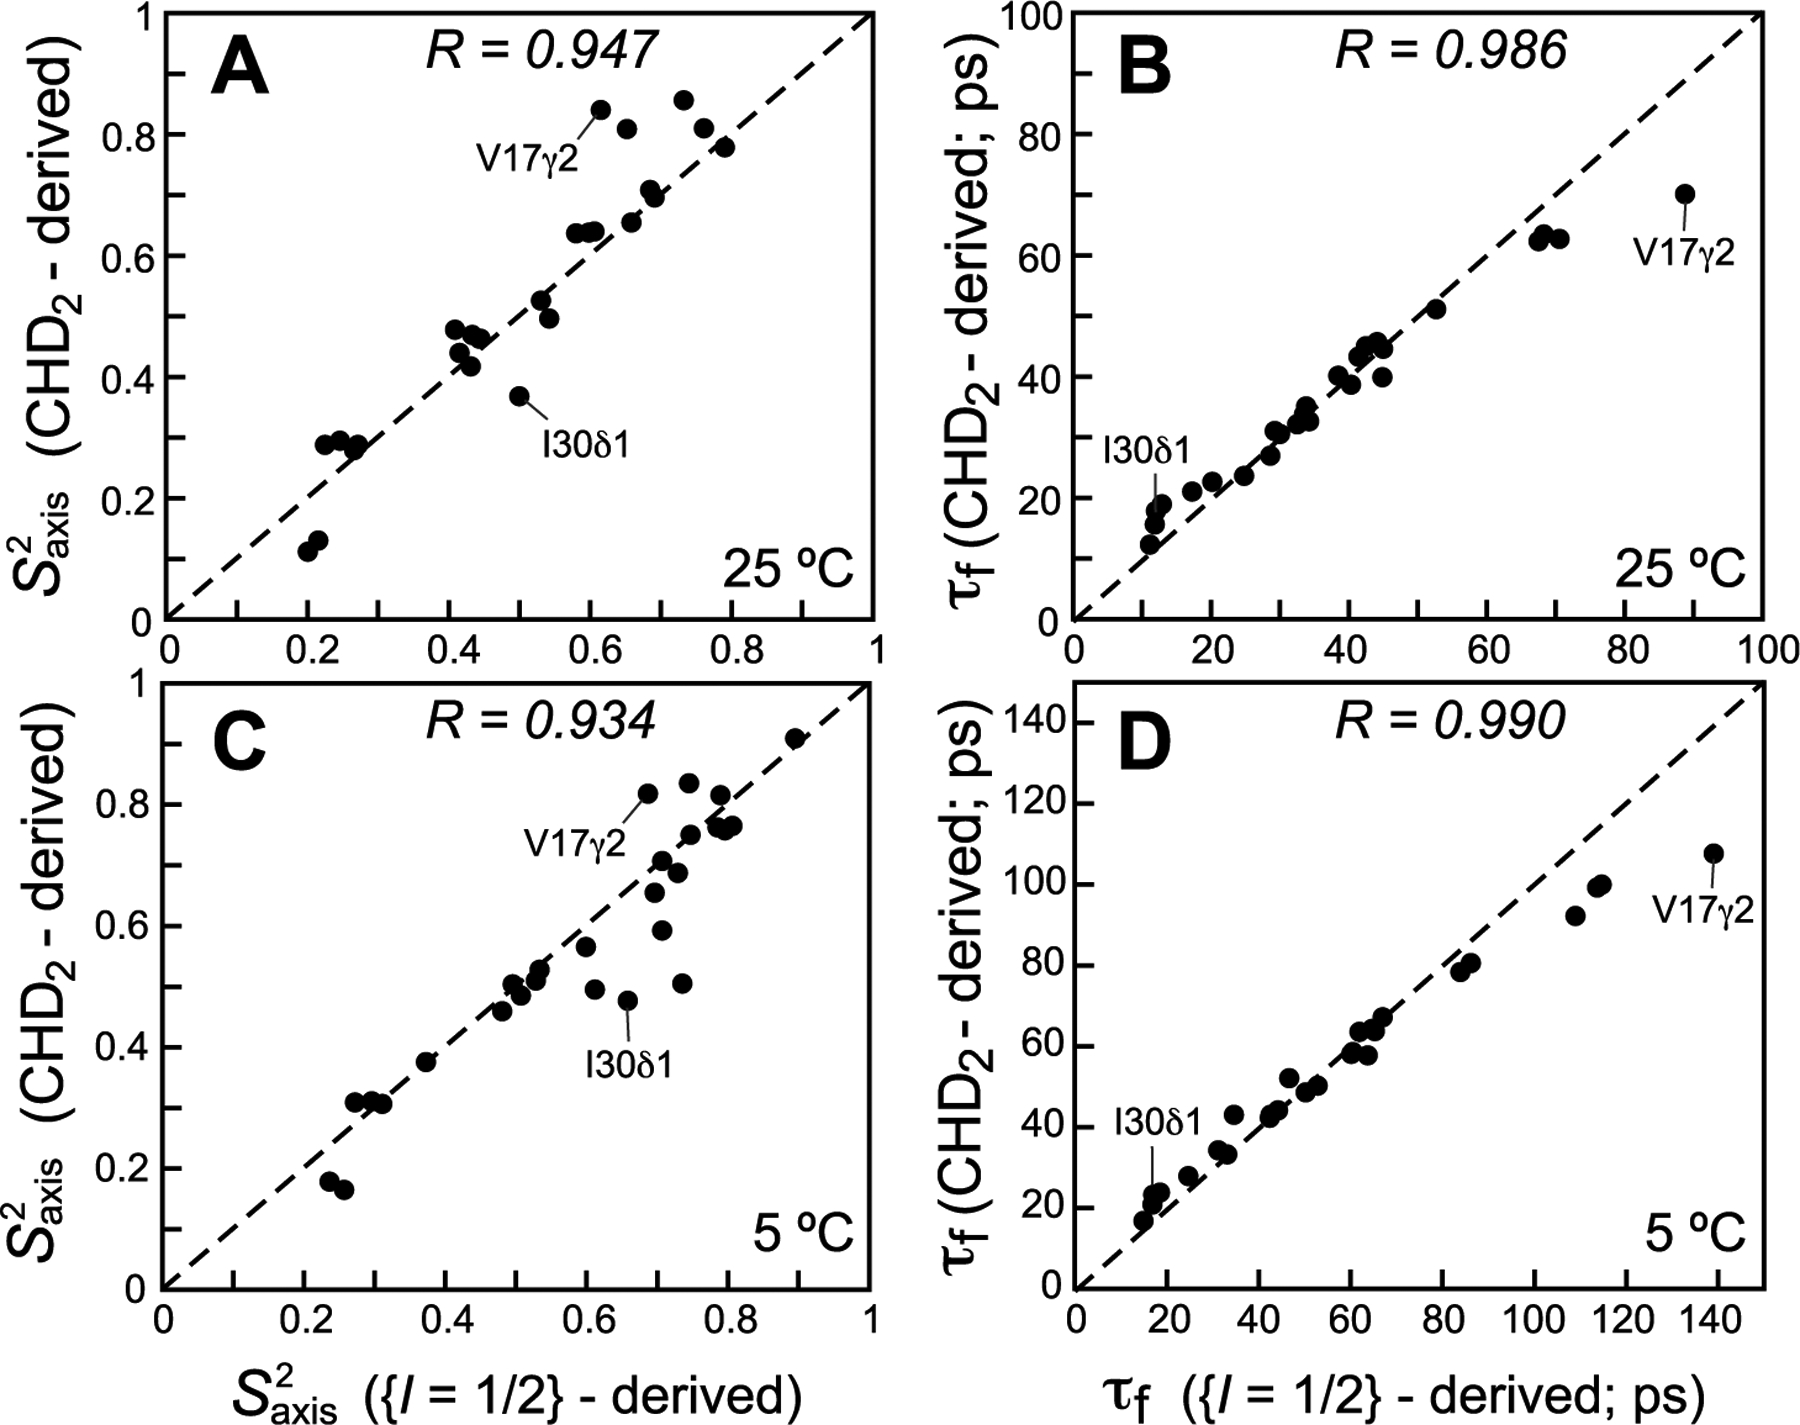
Correlation plots comparing methyl-axis dynamics parameters derived from 13C relaxation measurements of the (L5 + L6) magnetization mode (I = 1/2 manifold) in 13CH3 methyls using the scheme in Figure 2 (x-axes) with those derived from 13C relaxation in 13CHD2 methyls (y-axes) for ILV-labeled samples of ubiquitin at 25 °C (upper row; (A) and (B) τf; 29 correlations) and 5 °C (lower row; (C) and (D) τf; 30 correlations). All data were collected at 600 MHz. The data for the L50δ2 and L56δ2 methyl sites were excluded from the plots because of large exchange contributions to their R2 values. Linear correlation coefficients are shown at the top of each plot. Dashed lines are drawn at y = x.
Figure 4.
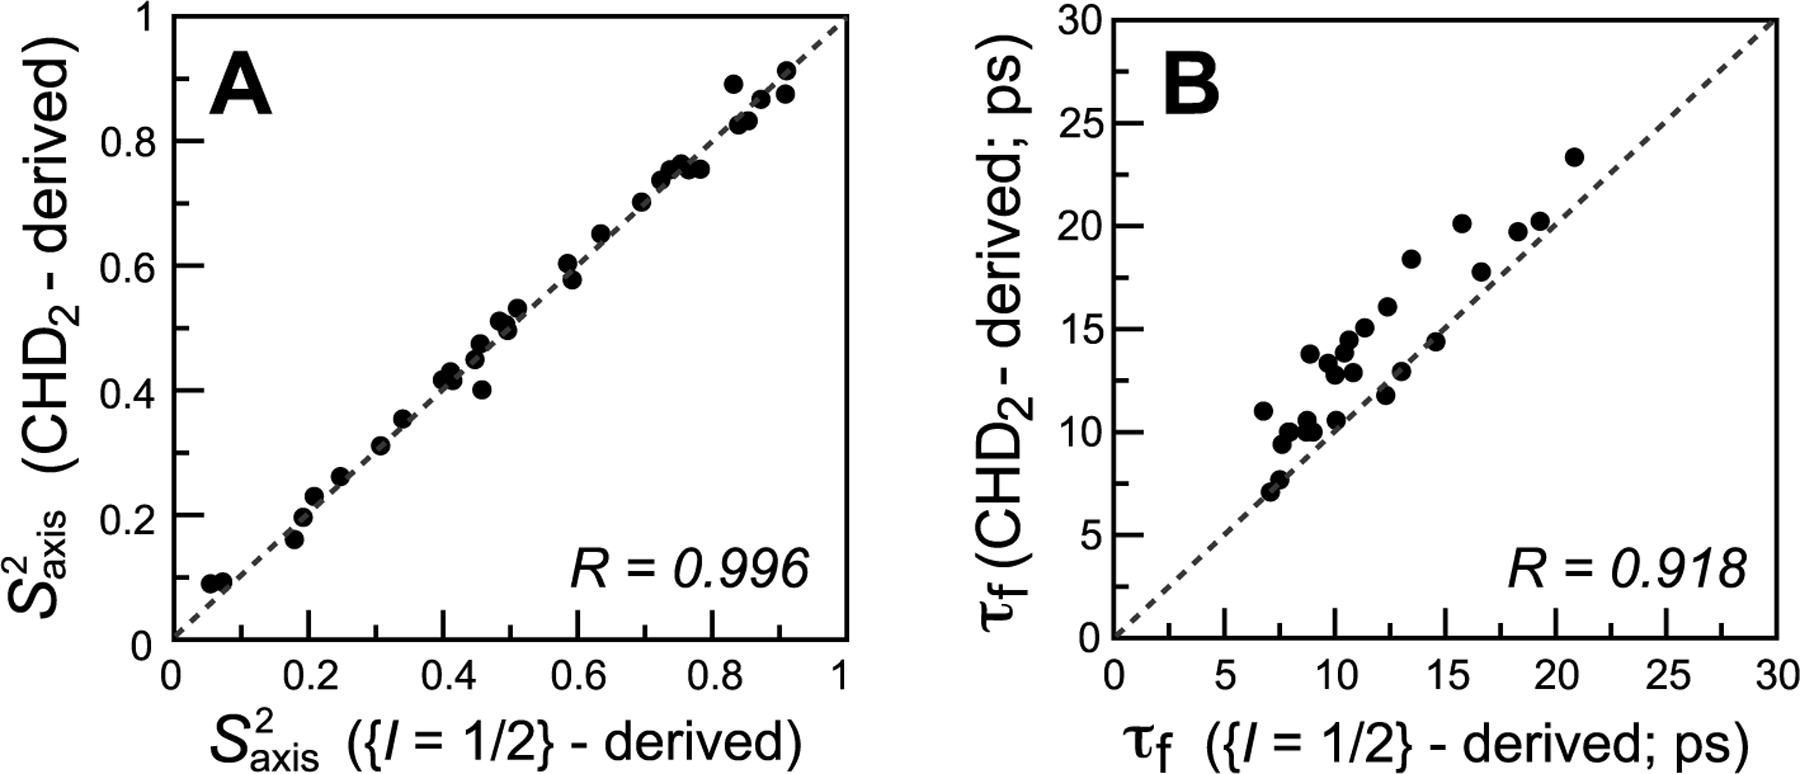
Correlation plots comparing methyl-axis dynamics parameters derived from 13C relaxation measurements of the (L5 + L6) magnetization mode (I = 1/2 manifold) in 13CH3 methyls using the scheme in Figure 2 (x-axes) with those derived from 13C relaxation in 13CHD2 methyls (y-axes) for Ileδ1-labeled samples of MSG at 37 °C (600 MHz). (A) and (B) τf (ps). Linear correlation coefficients are shown at the lower right corner of each plot. Dashed lines are drawn at y = x. A total of 33 correlations are included in panel A, and 27 correlations in panel B with 6 correlations showing the lowest values excluded from the plot.
In larger protein molecules such as MSG, with τC = 46 ns (assumed isotropic) at 37 °C in D2O, the (L5 + L6) R2 and R1 rates are separated in their information content in the sense that R2 reports almost exclusively on , while R1 is dependent exclusively on τf. This is a direct consequence of the (near) equality of the auto- and cross-correlated relaxation spectral density functions in the limit where τC ≫ τf. Therefore, the sensitivity of the (L5 + L6) R2 rates with respect to is “restored” in this case, and the agreement between the (L5 + L6)-derived values and their 13CHD2-derived counterparts is excellent for almost all Ileδ1 methyl sites in MSG (Figure 4A; see SI “Materials and Methods” for experimental details of the relaxation measurements). The contour plots of theoretical (L5 + L6) relaxation rates are compared with the 13C rates in 13CHD2 isotopomers as a function of [; τf] for τC = 60 ns in Figure S2 (SI). As the τC value of MSG is strongly dependent on the protein concentration in the NMR sample (ranging from ~46 ns for a 0.5 mM sample to ~64 ns for a 1.1 mM sample), we have chosen, for the purposes of illustration, to make the plots for a τC value closer to the upper limit of this range.
The correlations obtained between the two sets of τf data for MSG (Figure 4B) are notably inferior to those for smaller proteins (cf. Figure 4B and Figure 3B and D). This is not surprising considering the large contributions of 1H–1H dipolar interactions to the (L5 + L6) R1 rates, whereas 13C R1 rates in 13CHD2 methyls are not affected by these interactions. The worst agreement between the two sets of τf data is noted for methyl sites with the lowest values (where the part of the spectral density that accounts for local motions is the largest). Therefore, six such methyl sites were eliminated from the plot in Figure 4B. We note that the systematic underestimation of τf values derived from the (L5 + L6) rates compared to their 13CHD2-derived counterparts (apparent in Figure 4B) is unlikely to arise from differences in dynamics between 13CH3 and 13CHD2 methyl isotopomers (as the same trend is not observed for ubiquitin in Figures 3B and D) and is probably an artifact of the modeling of the spectral density function (see SI for details).
In an attempt to improve the agreement between the (L5 + L6)-derived and 13CHD2-derived measures of methyl-axis dynamics for small- to medium-sized proteins, we explored the possibility of using the relaxation properties of other 13C magnetization modes in a 13CH3 spin system. The fast-relaxing (outer) 13C transitions (shown in blue in Figure 1) and the corresponding spin orders (L1 ± L4) present a potentially attractive choice because of (1) the steep dependence of (L1 ± L4) R2 rates on (see Figure S1; the lower row of panels shows the contour plots of (L1 + L4) R2/R1 as a function of [;τf]) and (2) the absence of contributions from intramethyl 1H–1H interactions at zero frequency to (L1 ± L4) R2/R1 rates (see expressions for the relaxation rates in the SI). Note that both R2 and R1 rates of the antiphase magnetization (L1 − L4) are predicted to be very similar to those of the in-phase (L1 + L4) magnetization for deuterated proteins (down to very short distances to external 1H spins, ~2.5 Å). However, both auto- and cross-relaxation rates of the (L1 ± L4) mode have contributions from spin flips (eq 2). Although the contributions to R2 from spin flips are not predicted to exceed a few percent of the total rate in deuterated protein samples (a maximal value of ~6% is calculated for the shortest effective distance to an external 1H spin in deuterated ILV-{13CH3}-ubiquitin), the R1 rates are affected more significantly—up to ~40% of the total rate for ubiquitin at 5 °C. In larger proteins the size of MSG, spin flips are predicted to dominate the (L1 ± L4) R1 rates (>50% of the total), making them practically uninterpretable. Nevertheless, as long as the rate of spin flips does not dominate the longitudinal relaxation decay, and individual 13C magnetization modes are isolated prior to the relaxation delay, minimizing the effect of cross-relaxation between different modes, these contributions can be approximately corrected for. Indeed, close inspection of the expressions for relaxation rates of all magnetization modes (see SI) shows that the difference between the rates of decay (R2 or R1) of the antiphase and in-phase inner magnetization modes of the I = 3/2 manifold, (L2 − L3) and (L2 + L3), respectively, represents the most accurate measure of spin-flipping rates in the macromolecular limit (see eqs S5.1 and S5.2 and Figure S3 in the SI). According to eq 2, this difference is . Once estimated experimentally from the R(L2−L3) and R(L2+L3) rates, the value of Δ can then be scaled by a factor of 3/8 to be used as a correction for spin flips for R2/R1 rates of the (L1 ± L4) mode. Note that rather than relying on an estimation of distances to external protons from the protein structure, such a correction is entirely based on the relaxation properties of a 13CH3 spin system.
The pulse schemes designed for the isolation and relaxation measurements of the (L1 ± L4) and (L2 ± L3) 13C magnetization modes in 13CH3 methyls are shown in Figures 5 and 6, respectively, and rely on the use of acute-angle 1H pulses. Both schemes start with selection of fast-relaxing multiple-quantum 13C–1H magnetization using purge elements of duration 4τb (enclosed in solid blue and red boxes in Figures 5 and 6, respectively). In the scheme for (L1 ± L4) selection in Figure 5, this element is followed by a 1Hy pulse applied with a flip angle β equal to the “magic” angle cos−1(1/√3) = 54.7° (shown in blue), which selectively polarizes the outer 1H magnetization states (|1⟩⟨1| and |4⟩⟨4|, Figure 1; see SI for details) so that magnetization terms of the type C±(|1⟩⟨1| ± |4⟩⟨4|) and Cz(|1⟩⟨1| ± |4⟩⟨4|) can be generated for R2 and R1 measurements, respectively. In the experiment for the selection of (L2 ± L3) in Figure 6, the selection of fast-relaxing multiple-quantum 13C–1H magnetization is followed by a 1Hy 90° pulse to polarize all the 1H states of the I = 3/2 manifold(|1⟩⟨1|, |2⟩⟨2|, |3⟩⟨3| and |4⟩⟨4|; Figure 1), which is followed by selection of the desired 1H states (|2⟩⟨2|, |3⟩⟨3|) by a “filtering” element of 2τc duration (enclosed in a dashed red box in Figure 6) and subsequent generation of the magnetization terms C±(|2⟩⟨2| ± |3⟩⟨3|) and Cz(|2⟩⟨2| ± |3⟩⟨3|) for R2 and R1 measurements, respectively. Note that to maximize the transfer of magnetization from 13C coherences of the type C±,z(|2⟩⟨2| − |3⟩⟨3|) to the slow-relaxing component of the multiple-quantum 13C–1H magnetization C±(|2⟩⟨3| + |3⟩⟨2|), a 1H pulse with flip angle γ = sin−1(√8/27) = 33° is applied (shown in red in Figure 6; see the SI for details), followed by a purge element 2τb that selects for the slow-relaxing part of the (multiple-quantum) magnetization before the t1 evolution period.
Figure 5.
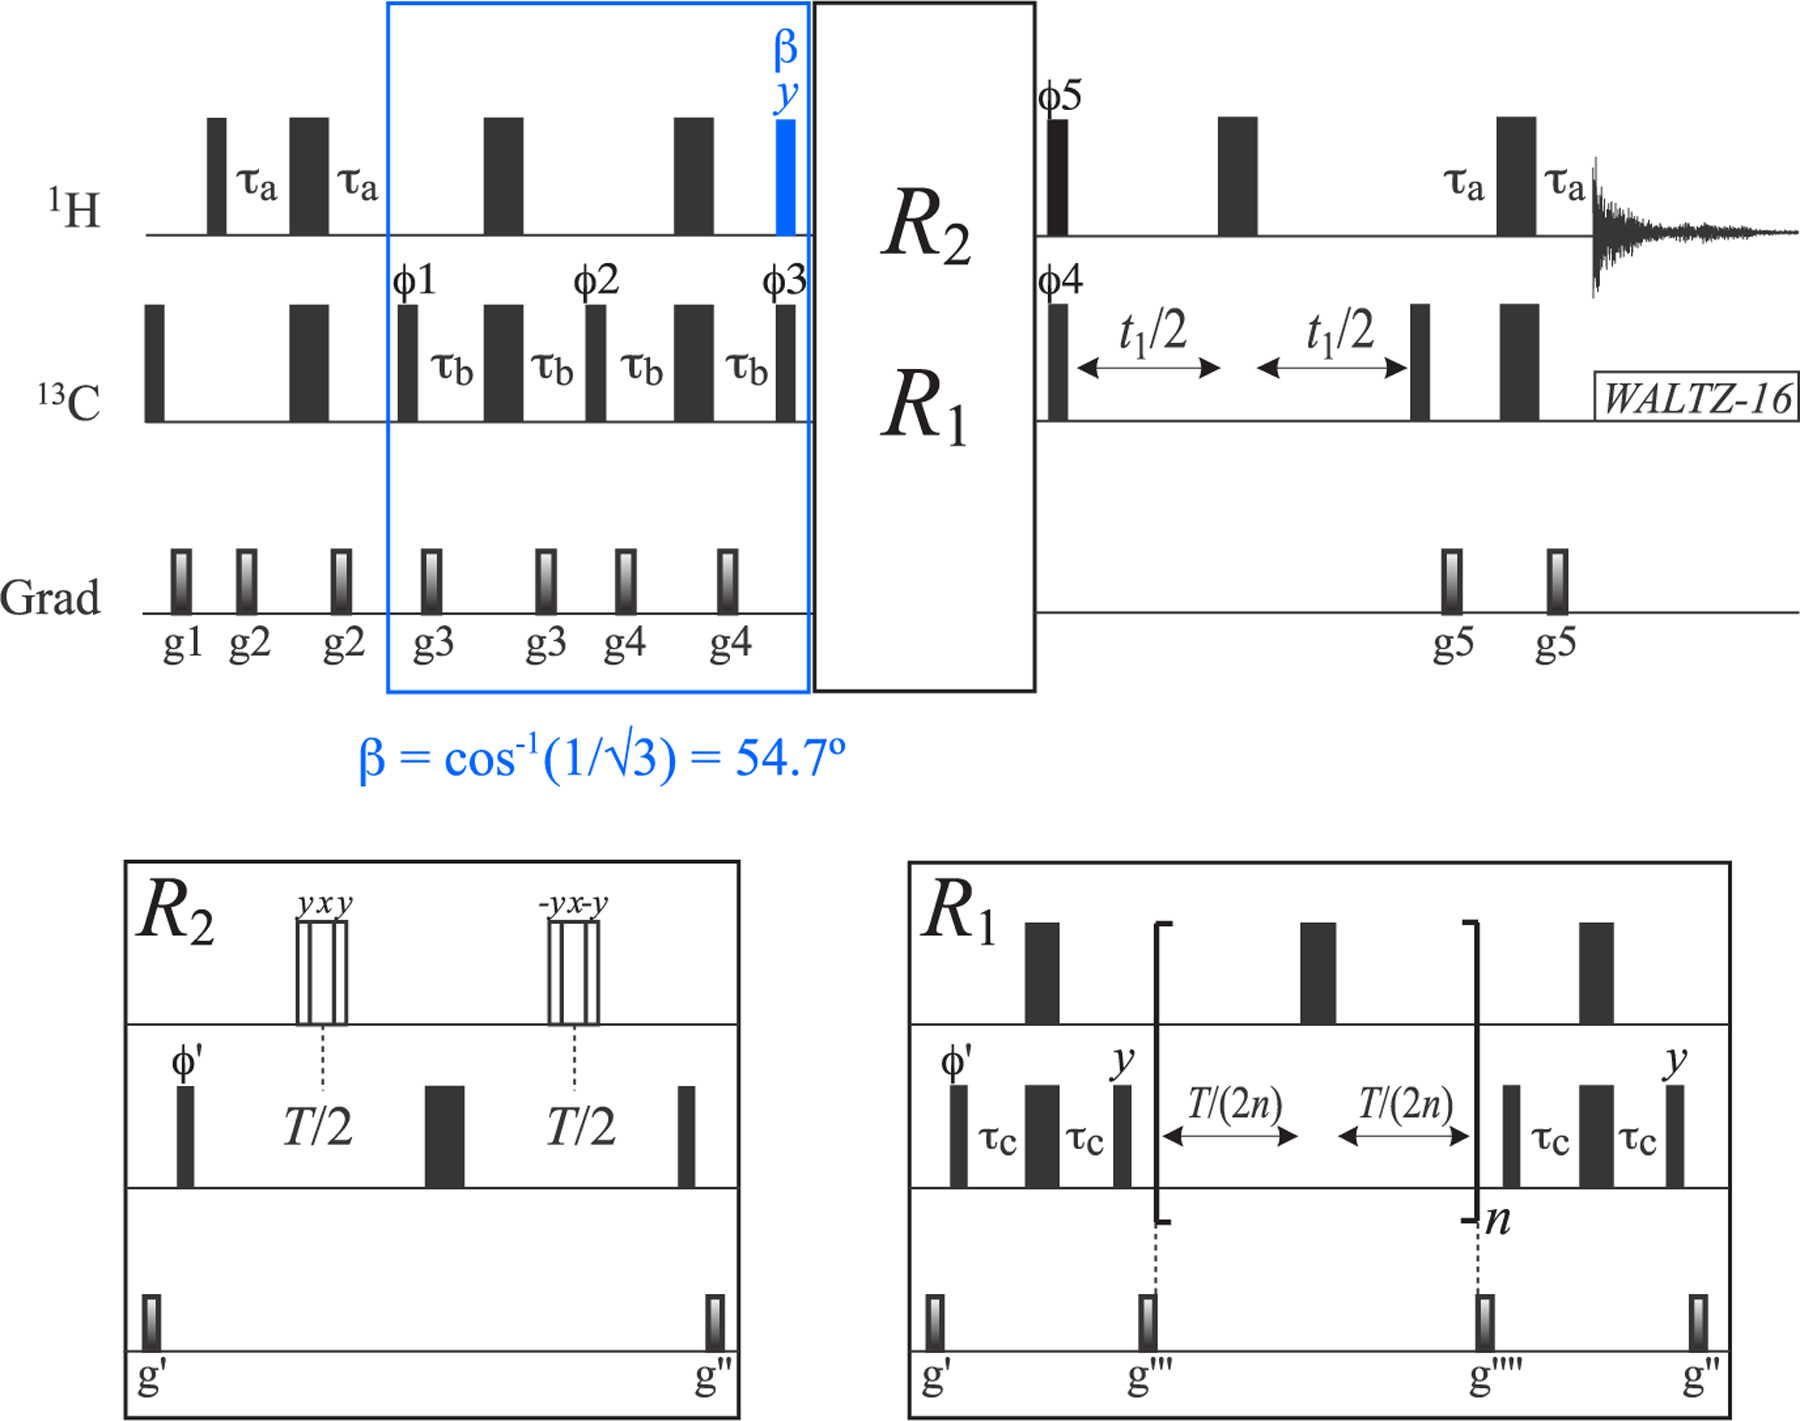
Pulse scheme for the measurement of R2 and R1 relaxation rates of the outer 13C magnetization modes of the I = 3/2 manifold (L1 ± L4) in 13CH3 methyl groups. All the parameters of the scheme (including delays) are the same as described in Figure 2. The 1H pulse shown in blue is applied with the flip-angle β = cos−1(1/√3) = 54.7°. “Open” 1H pulses in R2 measurements are composite pulses of the 90°–240°–90° variety29 that are applied with the phase-cycling indicated in the figure. Only the scheme for in-phase (L1 + L4) R1 measurements is shown as used in practice. The durations and strengths of the pulsed-field gradients(ms; G/cm) are as follows: g1 = (1; 25), g2 = (0.4; 15), g3 = (0.3; 12), g4 = (0.35; 12), g5 = (0.4; 15), g′ = (1.2; 20), g″ = (0.8; 15), g‴ = (0.8; 20), and g⁗ = (0.6; 20). The phase cycle is as follows: ϕ1 = 2(x), 2(−x); ϕ2 = x, −x; ϕ3 = 4(x), 4(−x); ϕ4 = x, −x; ϕ5 = 4(x), 4(−x); ϕ′ = 4(x), 4(−x); and = receiver phase of (x,−x,−x,x, −x,x,x,−x). Quadrature detection in t1 is achieved via States-TPPI28 incrementation of ϕ4.
Figure 6.
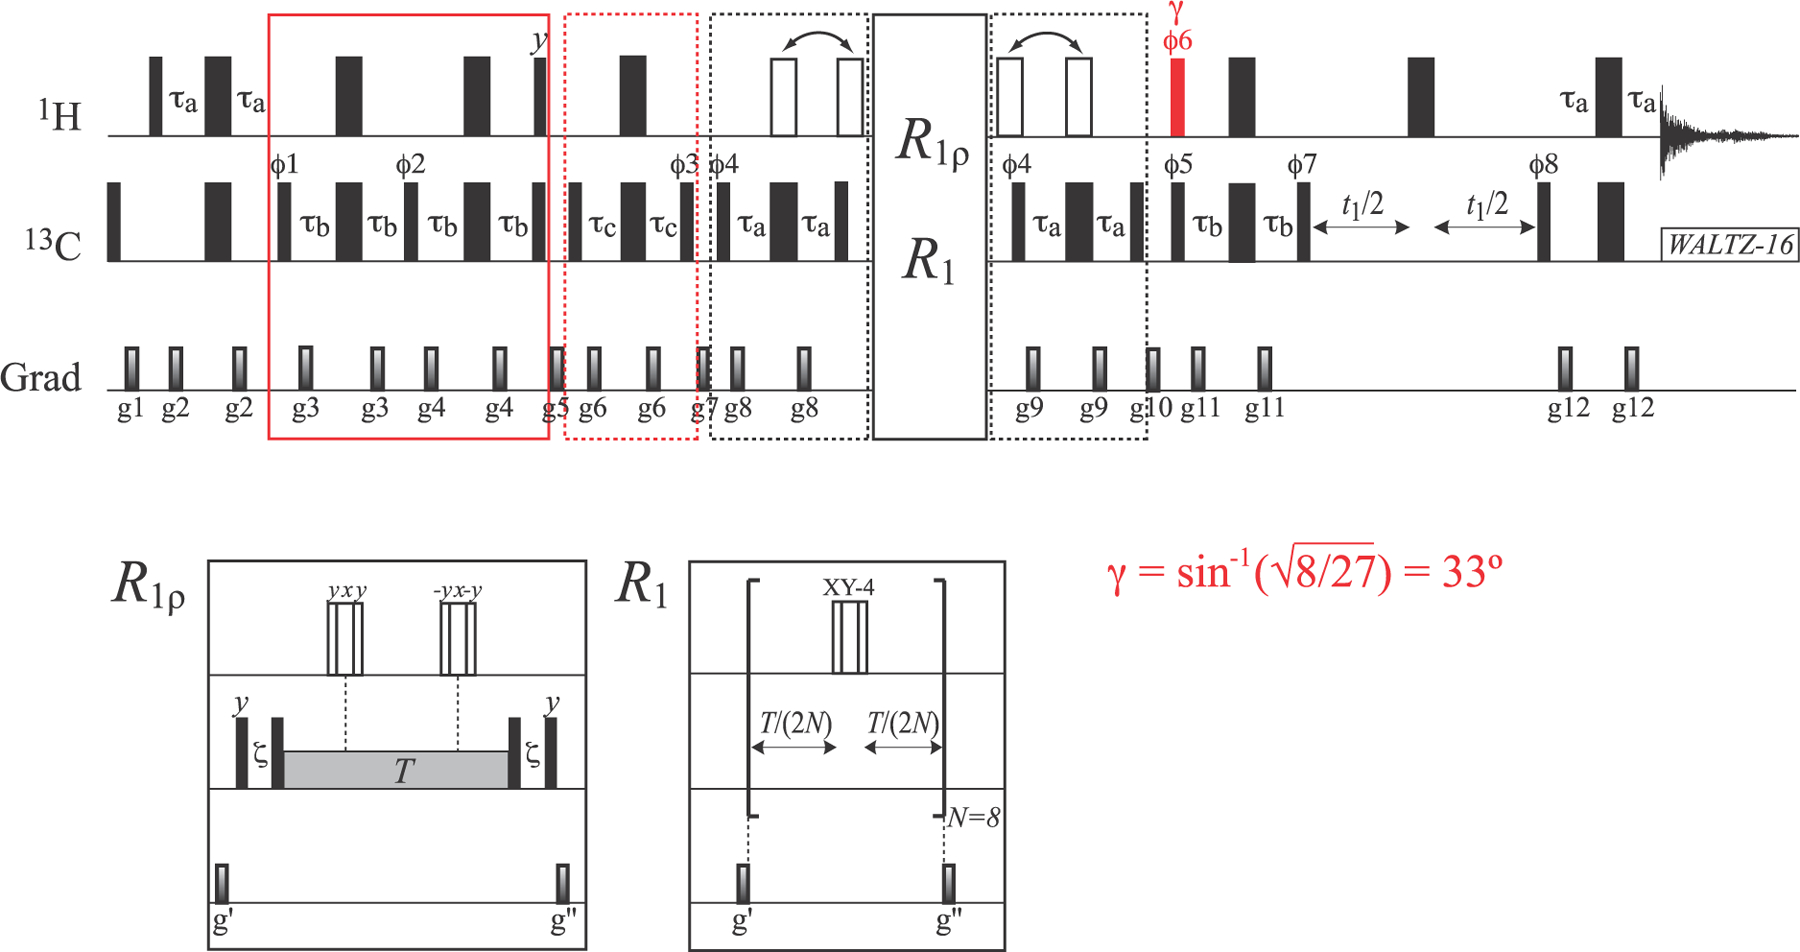
Pulse scheme for the measurement of the R1ρ and R1 relaxation rates of the inner 13C magnetization mode of the I = 3/2 manifold (L2 ± L3). All the parameters of the scheme (including delays) are the same as in Figure 2. The 1H pulse shown in red is applied with flip angle γ = sin−1(√8/27) = 33°. “Open” 1H 180° pulses of the main scheme (in the elements enclosed in dashed black boxes before and after the relaxation delays) are applied either simultaneously with 13C 180° pulses (for in-phase measurements; L2 + L3) or outside the 2τa elements (for antiphase measurements; L2 − L3) as indicated by arrows above the scheme. “Open” 1H pulses in the R2 and R1 measurements are composites pulses of the 90°–240°–90° variety29 that are applied using the phase-cycling indicated in the figure for the R1ρ measurements, and XY-4 phase-cycling30,31 for R1 measurements. Note that a total of eight 1H π-pulses (N = 8) is used for R1 measurements to avoid artifacts due to fast pulsing. The durations and strengths of pulsed-field gradients (ms; G/cm) are as follows: g1 = (1.0; 25), g2 = (0.4; 15), g3 = (0.3; 20), g4 = (0.35; 25), g5 = (1.4; 12), g6 = (0.2; 20), g7 = (0.8; 20), g8 = (0.5; 20), g9 = (0.4; 20), g10 = (1.0; 20), g11 = (0.3; 12), g12 = (0.5; 15), g′ = (0.8; 25), and g″ = (0.6; 20). The phase cycle is as follows: ϕ1 = 2(x), 2(−x); ϕ2 = x, −x; ϕ3 = 2(x), 2(−x); ϕ4 = 2(x), 2(−x) for antiphase (L2 − L3) measurements and 2(y), 2(−y) for in-phase (L2 + L3) measurements; ϕ5 = x, −x; ϕ6 = 4(x), 4(−x); ϕ7 = y, −y; ϕ8 = x; and receiver phase = (x,−x,−x,x, −x,x,x,−x). Quadrature detection in t1 is achieved via the States32 incrementation of ϕ8.
It is worth emphasizing that relaxation measurements of the (L1 ± L4) and (L2 ± L3) magnetization modes (Figures 5 and 6, respectively) are more technically demanding by far than those of the (L5 ± L6) magnetization mode in Figure 2. One of the underlying difficulties arises from cross-relaxation between the (L1 ± L4) and (L2 ± L3) modes, which is induced by spin-flips (eq 2) that make the relaxation decay of these terms non-single-exponential for at least some methyl sites. Although perdeuteration of NMR samples mitigates this effect, it cannot be eliminated completely. Therefore, care should be exercised not to extend relaxation delays to excessively large values. Further, in the measurement of (L1 ± L4) R2 rates (Figure 5), we have chosen not to apply a spin-lock RF field to (1) avoid problems associated with large values of the 1H–13C scalar couplings operative for the outer (fast-relaxing) 13C transitions (31JCH ~ 380 Hz; the 2 kHz spin-lock field, typically employed in other experiments, may be only marginally sufficient for couplings of this magnitude; note that the “free-precession” R2 values should not be affected by the differences between in-phase (L1 + L4) and antiphase (L1 − L4) R2 rates as these are predicted to be very small in deuterated proteins); and (2) mitigate the effect of spin flips, which are expected to be reduced as the cross-relaxing components of the magnetization are secular in the absence of the RF field. In addition, 1H 180° pulses applied during relaxation delays to eliminate methyl 13C CSA and 13C–1H dipolar cross correlations in the measurements involving antiphase magnetization, i.e., (L1 − L4) or (L2 − L3), have to be implemented as composite pulses with the phase cycling as described in Figures 5 and 6. Using the pulse scheme in Figure 5, average (L1 ± L4) R2 rates of 12.5 and 24.3 s−1 were obtained for ILV-{13CH3}-labeled ubiquitin at 25 and 5 °C, respectively, while the corresponding average R1 rates were 3.8 and 4.2 s−1, respectively. The average (L2 + L3) R2 and R1 rates were 4.3 and 3.3 s−1, respectively, at 25 °C, and 7.0 and 6.0 s−1 at 5 °C, while their antiphase counterparts (L2 − L3) had average values of 6.4 and 5.4 s−1, respectively, at 25 °C and 11.4 and 10.3 s−1, respectively, at 5 °C. The (L1 ± L4) R2 and R1 rates of all methyl sites were corrected (on a site-specific basis) by the experimental value of , where Δ is the difference between the R2/R1 rates of the antiphase (L2 − L3) and in-phase (L2 + L3) modes as described above. The average corrections employed for the R2 and R1 rates were 0.79 and 0.78 s−1, respectively, at 25 °C, and 1.64 and 1.62 s−1, respectively, at 5 °C.
By themselves, the thus-corrected relaxation rates of the (L1 ± L4) modes are not (on average) as good measures of methyl-axis dynamics as those of the (L5 + L6) 13C magnetization. Although it may be tempting to include the (corrected) (L1 ± L4) relaxation rates in the analysis only for those methyl sites that show the worst agreement between the two sets of dynamics parameters in Figure 3, we prefer to do so for all ILV methyl groups of ubiquitin since in the absence of the “benchmark” set of 13CHD2-derived parameters [; τf] it would not be possible to know a-priori which methyl sites are compromised (where is anticorrelated with τf). Note that the (L2 + L3) rates are not included in the analysis directly as, in the absence of spin flips, the (L2 + L3) relaxation rates are very similar (to within experimental errors) to those of the (L5 + L6) mode and, therefore, are not expected to provide additional information on methyl-axis dynamics.
Figure 7 shows correlation plots comparing methyl-axis dynamics parameters derived from 13C relaxation of the (L5 + L6) mode (I = 1/2 manifold) complemented with the R2/R1 rates of (L1 ± L4) in 13CH3 methyl groups with those derived from 13C relaxation in 13CHD2 isotopomers of ubiquitin. A notable improvement is observed in the quality of the correlations for at both temperatures (Figures 7A and C) compared to the plots where only the (L5 + L6) data are used (cf. Figures 3A and C). The agreement in τf is likewise ameliorated for the four methyl sites with the highest τf values (Figures 7B and D). Note that inclusion of the (L1 ± L4) R2/R1 data in the analysis (see SI “Materials and Methods”), increases the number of degrees of freedom in the fit from zero to two, providing additional information content that at least partially overcomes correlations between and τf.
Figure 7.
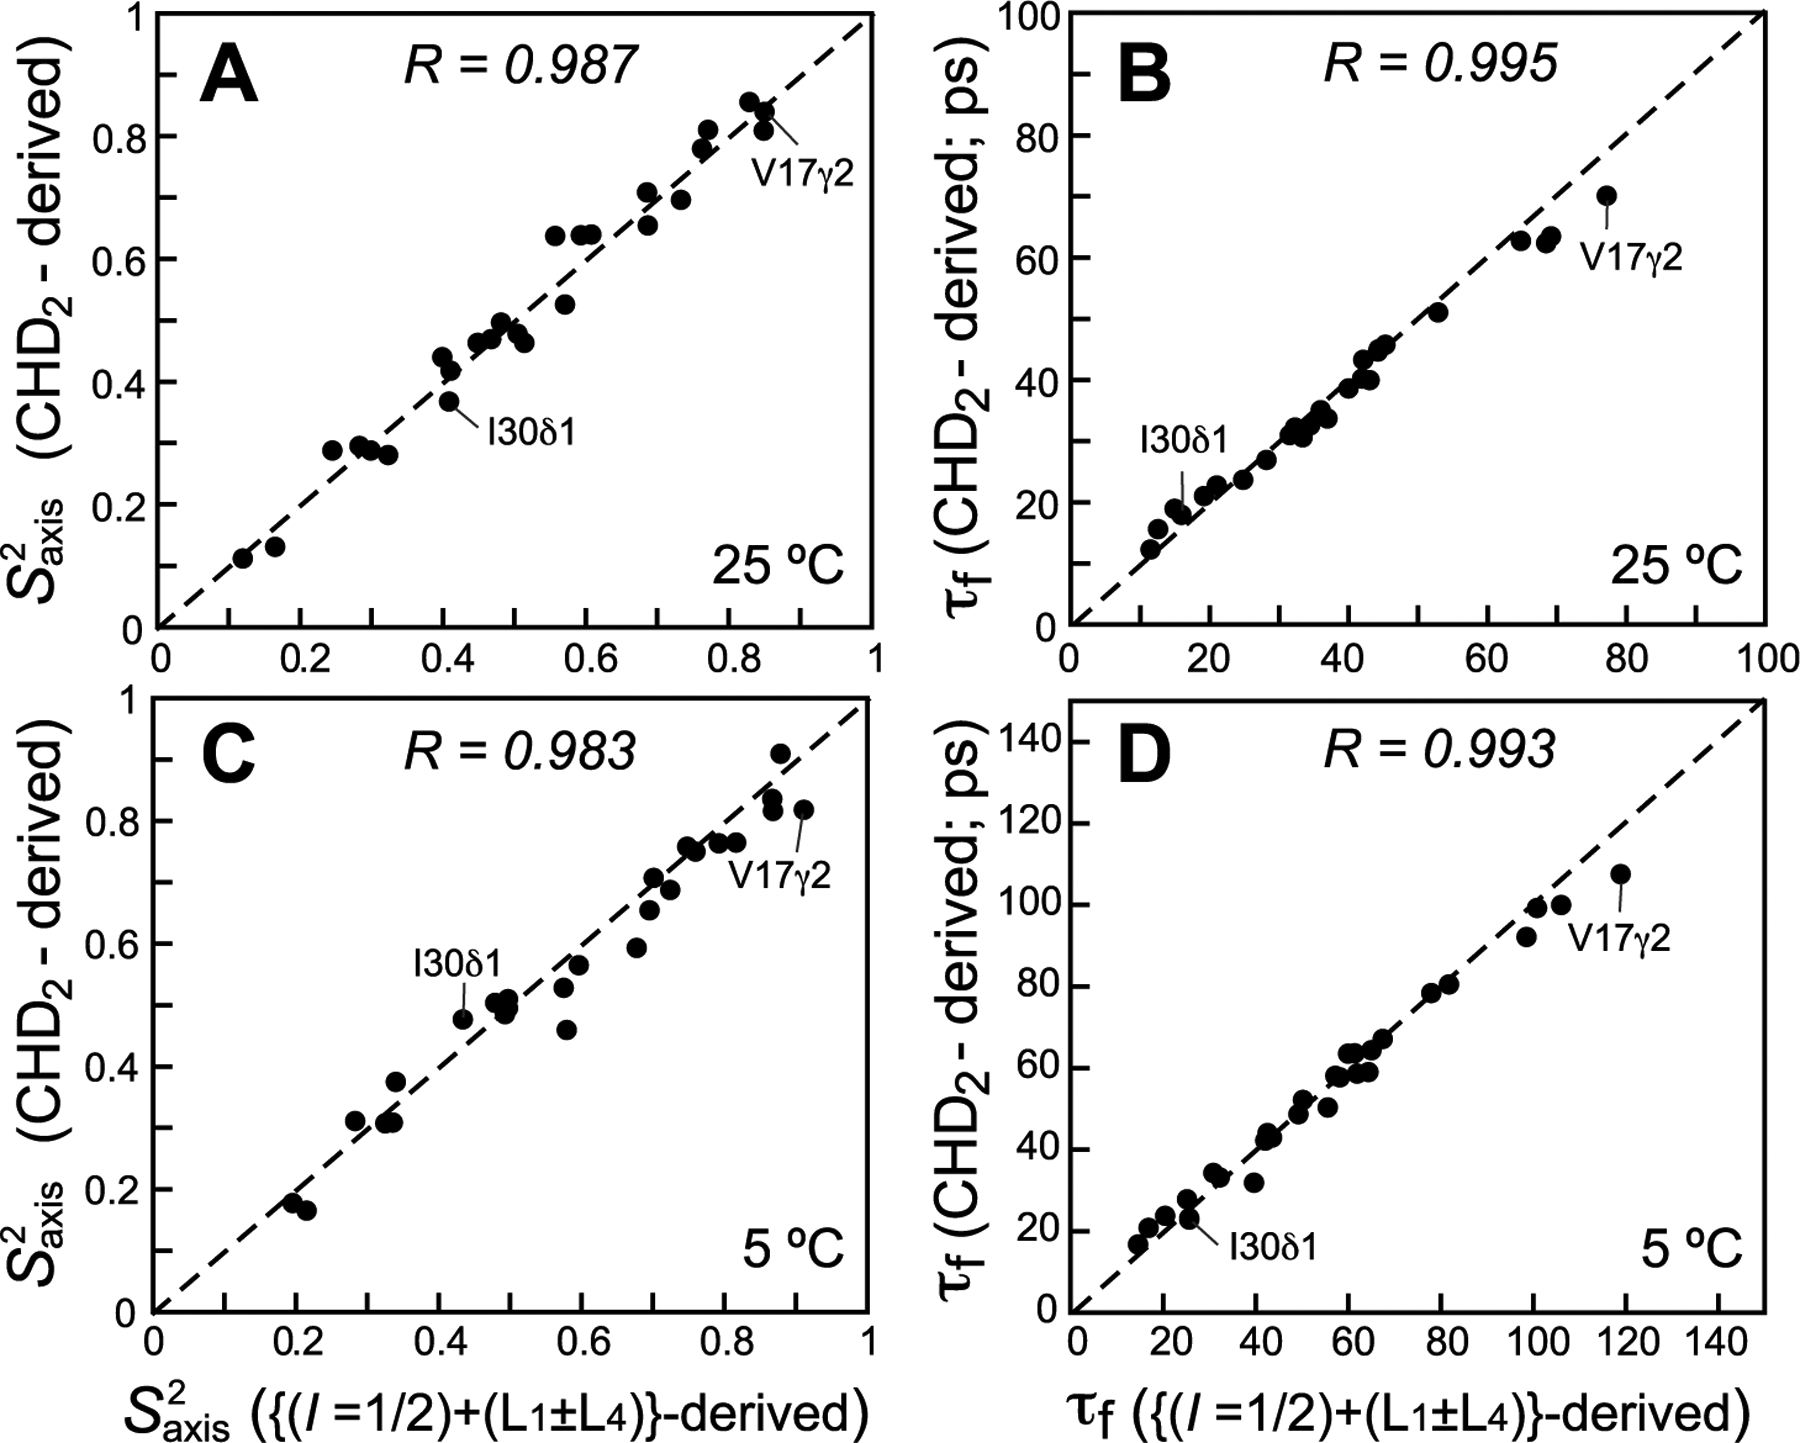
Correlation plots comparing methyl-axis dynamics parameters derived from 13C relaxation of the (L5 + L6) mode complemented with 13C relaxation of (L1 ± L4) in 13CH3 methyls (x-axes) with those derived from the 13C relaxation in 13CHD2 methyls (y-axes) for an ILV-labeled sample of ubiquitin at 25 °C (upper row; (A) and (B) τf; 29 correlations) and 5 °C (lower row; (C) and (D) τf; 30 correlations). All data were collected at 600 MHz. Linear correlation coefficients are shown at the top of each plot. Dashed lines are drawn at y = x.
In the absence of relaxation, experiments for the measurement of R1ρ and R1 relaxation rates of the (L5 + L6) magnetization mode (Figure 2) are predicted to be around threefold less sensitive than the experiments designed for relaxation measurements in 13CHD2 methyl isotopomers.17 As discussed previously, transverse relaxation during the 4τb and 2τa periods in the pulse scheme of Figure 2, and slower longitudinal 1H relaxation in 13CHD2 methyls during recovery delays, can increase or reduce this factor, respectively.17 These predictions are borne out in this work, with sensitivity ratios for the two types of experiments of 0.42 and 0.38 measured for ubiquitin and MSG, respectively, for the first point of the relaxation series (T = 0) when using a recovery delay of 1.5 s. In the absence of relaxation, the sensitivity of the experiments selecting for the (L1 ± L4) and (L2 ± L3) magnetization modes in Figures 5 and 6, respectively, is related to that selecting for the (L5 + L6) mode in Figure 2 in a ratio of 2.68:1.04:1.0, where the sensitivity enhancement of the experiment in Figure 2 by √2 is taken into account. However, as both experiments that target the I = 3/2 manifold modes (Figures 5 and 6) start with the selection of the fast-relaxing methyl coherences and, in the case of the experiment in Figure 5, the fast-relaxing 1H coherences are included during signal detection (the acquisition period), these experiments are less tolerant to transverse relaxation. While the measured ratio of sensitivities is 1.95:0.88:1.0 for ubiquitin at 5 °C, we predict that the sensitivity of both experiments in Figures 5 and 6 will be significantly lower for much larger proteins than that of the experiment in Figure 2.
Numerical simulations of sensitivity of the relaxation rates obtained in the experiments described here to mis-settings of the 1H acute-angle pulses show that R2(R1ρ) relaxation rates measured in the experiment in Figure 2 (the selection of the (L5 + L6) magnetization modes) are quite sensitive to inaccuracies of the pulse with flip angle α. The relative sensitivity of the extracted R2 rates is predicted to be inversely proportional to the global molecular correlation time τC; changes of ~1.5% in the R2 rate per one degree of α-angle mis-setting are obtained for MSG (τC ~ 46 ns), and values of ~2.5% and ~2.8% per degree are obtained for ubiquitin at 25 and 5 °C, respectively (τC ~ 5 and 11 ns, respectively). R1 rates obtained in the same experiment (Figure 2) are relatively less sensitive to the mis-calibration of the α-pulse, with values of less than ~0.5% per degree predicted for the whole range of τC values studied here. It is worth noting that the 1H 90° “purging” pulse applied to “in-phase” magnetization (L5 + L6) immediately before the relaxation delay (the inset in Figure 2) substantially mitigates these effects. In contrast, both R2 and R1 relaxation rates of the (L1 ± L4) magnetization modes (pulse scheme in Figure 5) are quite insensitive to the mis-setting of the β-angle, with relative sensitivities of only ~0.2% and ~0.1% per degree obtained for R2 and R1 rates in ubiquitin (5 °C), respectively. Note that relaxation rates of the (L2 ± L3) magnetization modes (pulse scheme in Figure 6) should not depend on the mis-setting of angle γ, as this angle is not used for the selection proper of the (L2 ± L3) modes and is optimized solely to improve the sensitivity of the experiment.
CONCLUSIONS
In summary, we have described the dynamics of methyl-bearing side-chains in proteins by 13C relaxation measurement of a number of modes (classes) of 13C magnetization in selectively 13CH3-labeled methyl groups of otherwise deuterated proteins. We first show how the 13C magnetization modes whose NMR relaxation properties, transverse (R2) and longitudinal (R1) spin relaxation rates, bear information on the methyl-axis dynamics in 13CH3 methyl groups, can be isolated using acute-angle 1H RF pulses. The parameters of methyl-axis dynamics (, a measure of the amplitudes of the methyl-axis motions, and τf, the correlation time of the fast local methyl-axis motions) derived from 13C relaxation in 13CH3 methyls are compared with their counterparts derived from 13C relaxation in 13CHD2 methyl isotopomers. We show that excellent correlations between the [13CHD2]-derived values and those extracted from relaxation of 13C magnetization of the I = 1/2 manifold in 13CH3 methyls can be obtained in larger proteins. In 13CH3 methyls of smaller proteins, a certain degree of anti-correlation is observed between and τf values obtained from 13C relaxation of the I = 1/2 manifold magnetization. This correlation can be (partially) removed by inclusion in the analysis of 13C relaxation data acquired on the I = 3/2 manifold magnetization modes.
Supplementary Material
ACKNOWLEDGMENTS
We are grateful to Prof. Lewis E. Kay for many useful discussions and productive suggestions. We also thank Drs. James Baber, Jinfa Ying, and Dan Garrett for technical support. This work was supported by the Intramural Program of the National Institute of Diabetes and Digestive and Kidney Diseases, National Institutes of Health (DK029023 to G.M.C.).
Footnotes
Supporting Information
The Supporting Information is available free of charge at https://pubs.acs.org/doi/10.1021/acs.jpcb.1c00989.
Relaxation matrices calculated in the basis set consisting of all 13C magnetization modes treated in this work, comparison of the contour plots of theoretical R2/R1 rates of a selected set of 13C magnetization modes with R2/R1 rates of 13C nuclei in 13CHD2 methyl groups, contributions of high frequency (ω > 0) terms to the differences Δ for R2/R1 relaxation rates as a function of the distance to a single external 1H spin, a single-transition operator-based explanation of the optimal choice of acute angle 1H RF pulses, NMR sample conditions and acquisition parameters, and details of relaxation data analysis (PDF)
Complete contact information is available at: https://pubs.acs.org/10.1021/acs.jpcb.1c00989
The authors declare no competing financial interest.
Contributor Information
Vitali Tugarinov, Laboratory of Chemical Physics, National Institute of Diabetes and Digestive and Kidney Diseases, National Institutes of Health, Bethesda, Maryland 20892-0520, United States.
Alberto Ceccon, Laboratory of Chemical Physics, National Institute of Diabetes and Digestive and Kidney Diseases, National Institutes of Health, Bethesda, Maryland 20892-0520, United States.
G. Marius Clore, Laboratory of Chemical Physics, National Institute of Diabetes and Digestive and Kidney Diseases, National Institutes of Health, Bethesda, Maryland 20892-0520, United States.
REFERENCES
- (1).Akke M; Brüschweiler R; Palmer AG NMR Order Parameters and Free Energy: An Analytic Approach and Application to Cooperative Calcium Binding by Calbindin D9k. J. Am. Chem. Soc 1993, 115, 9832–9833. [Google Scholar]
- (2).Igumenova TI; Frederick KK; Wand AJ Characterization of the Fast Dynamics of Protein Amino Acid Side Chains Using NMR Relaxation in Solution. Chem. Rev 2006, 106, 1672–1699. [DOI] [PMC free article] [PubMed] [Google Scholar]
- (3).Frederick KK; Marlow MS; Valentine KG; Wand AJ Conformational Entropy in Molecular Recognition by Proteins. Nature 2007, 448, 325–329. [DOI] [PMC free article] [PubMed] [Google Scholar]
- (4).Sprangers R; Kay LE Quantitative Dynamics and Binding Studies of the 20s Proteasome by NMR. Nature 2007, 445, 618–622. [DOI] [PubMed] [Google Scholar]
- (5).Rosenzweig R; Kay LE Bringing Dynamic Molecular Machines into Focus by Methyl-Trosy NMR. Annu. Rev. Biochem 2014, 83, 291–315. [DOI] [PubMed] [Google Scholar]
- (6).Schütz S; Sprangers R Methyl Trosy Spectroscopy: A Versatile NMR Approach to Study Challenging Biological Systems. Prog. Nucl. Magn. Reson. Spectrosc 2020, 116, 56–84. [DOI] [PubMed] [Google Scholar]
- (7).Kay LE; Bull TE; Nicholson LK; Griesinger C; Schwalbe H; Bax A; Torchia DA The Measurement of Heteronuclear Transverse Relaxation Times in AX3 Spin Systems Via Polarization Transfer Techniques. J. Magn. Reson 1992, 100 (3), 538–558. [Google Scholar]
- (8).Kay LE; Torchia DA The Effects of Dipolar Cross-Correlation on 13C Methyl-Carbon T1, T2, and NOE Measurements in Macromolecules. J. Magn. Reson 1991, 95 (3), 536–547. [Google Scholar]
- (9).Ishima R; Petkova AP; Louis JM; Torchia DA Comparison of Methyl Rotation Axis Order Parameters Derived from Model-Free Analyses of 2H and 13C Longitudinal and Transverse Relaxation Rates Measured in the Same Sample. J. Am. Chem. Soc 2001, 123, 6164–6171. [DOI] [PubMed] [Google Scholar]
- (10).Tugarinov V; Kay LE Quantitative 13C and 2H NMR Relaxation Studies of the 723-Residue Enzyme Malate Synthase G Reveal a Dynamic Binding Interface. Biochemistry 2005, 44, 15970–15977. [DOI] [PubMed] [Google Scholar]
- (11).Muhandiram DR; Yamazaki T; Sykes BD; Kay LE Measurement of Deuterium T1 and T1ρ Relaxation Times in Uniformly 13C Labeled and Fractionally Deuterium Labeled Proteins in Solution. J. Am. Chem. Soc 1995, 117, 11536–11544. [Google Scholar]
- (12).Millet O; Muhandiram DR; Skrynnikov NR; Kay LE Deuterium Spin Probes of Side-Chain Dynamics in Proteins. 1. Measurement of Five Relaxation Rates Per Deuteron in 13C-Labeled and Fractionally 2H-Enriched Proteins in Solution. J. Am. Chem. Soc 2002, 124, 6439–6448. [DOI] [PubMed] [Google Scholar]
- (13).Tugarinov V; Ollerenshaw JE; Kay LE Probing Side-Chain Dynamics in High Molecular Weight Proteins by Deuterium NMR Spin Relaxation: An Application to an 82-kDa Enzyme. J. Am. Chem. Soc 2005, 127, 8214–8225. [DOI] [PubMed] [Google Scholar]
- (14).Tugarinov V; Kay LEA 2H NMR Relaxation Experiment for the Measurement of the Time Scale of Methyl Side-Chain Dynamics in Large Proteins. J. Am. Chem. Soc 2006, 128, 12484–12489. [DOI] [PubMed] [Google Scholar]
- (15).Sheppard D; Sprangers R; Tugarinov V Experimental Approaches for NMR Studies of Side-Chain Dynamics in High-Molecular-Weight Proteins. Prog. Nucl. Magn. Reson. Spectrosc 2010, 56, 1–45. [DOI] [PubMed] [Google Scholar]
- (16).Ollerenshaw JE; Tugarinov V; Skrynnikov NR; Kay LE Comparison of 13CH3, 13CH2D, and 13CHD2 Methyl Labeling Strategies in Proteins. J. Biomol. NMR 2005, 33, 25–41. [DOI] [PubMed] [Google Scholar]
- (17).Tugarinov V; Karamanos TK; Ceccon A; Clore GM Optimized NMR Experiments for the Isolation of I = 1/2 Manifold Transitions in Methyl Groups of Proteins. ChemPhysChem 2020, 21, 13–19. [DOI] [PMC free article] [PubMed] [Google Scholar]
- (18).Tugarinov V; Karamanos TK; Clore GM Magic-Angle-Pulse Driven Separation of Degenerate 1H Transitions in Methyl Groups of Proteins: Application to Studies of Methyl Axis Dynamics. ChemPhysChem 2020, 21, 1087–1091. [DOI] [PMC free article] [PubMed] [Google Scholar]
- (19).Morris GA; Freeman R Enhancement of Nuclear Magnetic Resonance Signals by Polarization Transfer. J. Am. Chem. Soc 1979, 101, 760–762. [Google Scholar]
- (20).Tugarinov V; Karamanos TK; Clore GM Optimized Selection of Slow-Relaxing 13C Transitions in Methyl Groups of Proteins: Application to Relaxation Dispersion. J. Biomol. NMR 2020, 74, 673–680. [DOI] [PMC free article] [PubMed] [Google Scholar]
- (21).Carr HY; Purcell EM Effects of Diffusion on Free Precession in Nuclear Magnetic Resonance Experiments. Phys. Rev 1954, 94, 630–638. [Google Scholar]
- (22).Meiboom S; Gill D Modified Spin-Echo Method for Measuring Nuclear Relaxation Times. Rev. Sci. Instrum 1958, 29, 688–691. [Google Scholar]
- (23).Shaka AJ; Keeler J; Frenkiel T; Freeman R An Improved Sequence for Broadband Decoupling: Waltz-16. J. Magn. Reson 1983, 52 (2), 335–338. [Google Scholar]
- (24).Griesinger C; Ernst RR Frequency Offset Effects and Their Elimination in NMR Rotating-Frame Cross-Relaxation Spectroscopy. J. Magn. Reson 1987, 75 (2), 261–271. [Google Scholar]
- (25).Yamazaki T; Muhandiram R; Kay LE NMR Experiments for the Measurement of Carbon Relaxation Properties in Highly Enriched, Uniformly 13C, 15N Labeled Proteins: Application to 13Cα Carbons. J. Am. Chem. Soc 1994, 116, 8266–8278. [Google Scholar]
- (26).Kay LE; Keifer P; Saarinen T Pure Absorption Gradient Enhanced Heteronuclear Single Quantum Correlation Spectroscopy with Improved Sensitivity. J. Am. Chem. Soc 1992, 114, 10663–10665. [Google Scholar]
- (27).Schleucher J; Sattler M; Griesinger C Coherence Selection by Gradients without Signal Attenuation: Application to the Three-Dimensional HNCO Experiment. Angew. Chem. Int. Ed. Engl 1993, 32, 1489–1491. [Google Scholar]
- (28).Marion D; Ikura M; Tschudin R; Bax A Rapid Recording of 2D NMR Spectra without Phase Cycling. Application to the Study of Hydrogen Exchange in Proteins. J. Magn. Reson 1989, 85, 393–399. [Google Scholar]
- (29).Levitt MH Symmetrical Composite Pulse Sequences for NMR Population Inversion. II. Compensation of Resonance Offset. J. Magn. Reson 1982, 50, 95–110. [Google Scholar]
- (30).Gullion T; Baker DB; Conradi MS New, Compensated Carr-Purcell Sequences. J. Magn. Reson 1990, 89, 479–484. [Google Scholar]
- (31).Yuwen T; Huang R; Vallurupalli P; Kay LE A Methyl-Trosy-Based 1H Relaxation Dispersion Experiment for Studies of Conformational Exchange in High Molecular Weight Proteins. Angew. Chem. Int. Ed 2019, 58, 6250–6254. [DOI] [PubMed] [Google Scholar]
- (32).States DJ; Haberkorn RA; Ruben DJ A Two-Dimensional Nuclear Overhauser Experiment with Pure Absorption Phase in Four Quadrants. J. Magn. Reson 1982, 48 (2), 286–292. [Google Scholar]
Associated Data
This section collects any data citations, data availability statements, or supplementary materials included in this article.


