


Abstract
For many RNA molecules, the secondary structure is essential for the correct function of the RNA. Predicting RNA secondary structure from nucleotide sequences is a long-standing problem in genomics, but the prediction performance has reached a plateau over time. Traditional RNA secondary structure prediction algorithms are primarily based on thermodynamic models through free energy minimization, which imposes strong prior assumptions and is slow to run. Here, we propose a deep learning-based method, called UFold, for RNA secondary structure prediction, trained directly on annotated data and base-pairing rules. UFold proposes a novel image-like representation of RNA sequences, which can be efficiently processed by Fully Convolutional Networks (FCNs). We benchmark the performance of UFold on both within- and cross-family RNA datasets. It significantly outperforms previous methods on within-family datasets, while achieving a similar performance as the traditional methods when trained and tested on distinct RNA families. UFold is also able to predict pseudoknots accurately. Its prediction is fast with an inference time of about 160 ms per sequence up to 1500 bp in length. An online web server running UFold is available at https://ufold.ics.uci.edu. Code is available at https://github.com/uci-cbcl/UFold.
INTRODUCTION
The biology of RNA is diverse and complex. Aside from its conventional role as an intermediate between DNA and protein, cellular RNA consists of many other functional classes, including ribosomal RNA (rRNA), transfer RNA (tRNA), small nuclear RNA (snRNA), microRNA and other noncoding RNAs (1–4). Some RNAs possess catalytic functionality, playing a role similar to protein enzymes. The spliceosome, which performs intron splicing, is assembled from several snRNAs. The microRNAs are abundant in many mammalian cell types, targeting ∼60% of genes (5), and are often regarded as biomarkers for diverse diseases (6).
Cellular RNA is typically single-stranded. RNA folding is in large part determined by nucleotide base pairing, including canonical base pairing—A–U, C–G and non-Watson–Crick pairing G-U, and non-canonical base pairing (7,8). The base-paired structure is often referred to as the secondary structure of RNA (9). For many RNA molecules, the secondary structure is essential for the correct function of the RNA, in many cases, more than the primary sequence itself. As evidence of this, many homologous RNA species demonstrate conserved secondary structures, although the sequences themselves may diverge (10).
RNA secondary structure can be determined from atomic coordinates obtained from X-ray crystallography, nuclear magnetic resonance (NMR), or cryogenic electron microscopy (11–13). However, these methods have low throughput. Only a tiny fraction of RNAs have experimentally determined structures. To address this limitation, experimental methods have been proposed to infer base paring by using probes based on enzymes, chemicals, and cross-linking techniques coupled with high throughput sequencing (14–17). Although promising, these methods are still at the early stage of development, unable to provide precise base-pairing at a single nucleotide solution.
Computationally predicting the secondary structure of RNA is a long-standing problem in genomics and bioinformatics. Many methods have been proposed over the past two decades. They can be broadly classified into two categories: (i) single sequence prediction methods and (ii) comparative methods. In the first category, the most common method is to search for thermodynamically stable states through free energy minimization. If the secondary structure contains only nested base pairing, the energy minimization can be efficiently solved through dynamic programming, such as those implemented in Vienna RNAfold (18), MFold (19), RNAstructure (20) and CONTRAfold (21). Faster implementations that try to improve the speed of dynamic programming include Rfold (22), Vienna RNAplfold (23), LocalFold (24) and LinearFold (25). Efficient dynamic programming algorithms that sample suboptimal secondary structures from the Boltzmann ensembles of structures have also been proposed, for example, CentroidFold (26). However, some dynamic programming-based methods break down when base pairs contain non-nested patterns, called pseudoknots, which include two stem–loop structures with half of one stem intercalating between the two halves of another stem. Predicting secondary structures with pseudoknots is hard and has shown to be NP-complete under the energy minimization framework (27). Methods in the secondary category utilize covariance methods by aligning related RNA sequences and identifying correlated compensatory mutations. The second category of methods such as (28–30) analyze multiple sequences to determine points of base covariance within the sequences to help infer base pair positions, and try to predict conserved structures. Although the list of proposed methods in each of the two categories is long and diverse (31), the performance of these methods has not been significantly improved over time, reaching a performance ceiling of about 80% (32). It is possible because they fail to account for base pairing resulting from tertiary interactions (33), unstacked base pairs, pseudoknot, noncanonical base pairing, or other unknown factors (8).
Recently deep learning techniques have started to emerge as an alternative approach to functional structure prediction problems including RNA secondary structure prediction problems (34–38). Compared to the thermodynamic model-based approaches, the learning-based methods benefit from making few assumptions, allowing pseudoknots, and accounting for tertiary interactions, noncanonical base pairing, or other previously unrecognized base-pairing constraints. Existing deep learning methods differ in model architectural design and their choices of model input and output. These methods either treat the input as a sequence, utilizing LSTM (39) or transformer encoder (40) to capture long-range interactions between nucleotides (37,41,42). Other methods aim to integrate deep learning techniques with dynamic programming or thermodynamic methods to alleviate prediction biases (34,35,41). However, existing deep learning approaches still face several challenges: First, both LSTM and transformer encoder modules involve a huge number of model parameters, which lead to high computational cost and low efficiency. Second, integrating with thermodynamic optimization methods will push the models to assume the assumptions underlying traditional methods, which can hinder the model performance. Third, because the performance of deep learning models depends heavily on the distribution of training data, we need to think about how to improve the performance of these models on previously unseen classes of RNA structures (41). Because many new RNA families have yet to be discovered, it would be important for the learning-based models to have a good generalization ability.
Instead of using the nucleotide sequence itself, the input of our model consists of all possible base-pairing maps within the input sequence. Each map, first represented by a square matrix of the same dimension as the input sequence length, denotes the occurrences of one of the 16 possible base pairs between the input nucleotides. Under this new representation, the input is treated as a 2D ‘image’ with 16 channels, allowing the model to explicitly consider all long-range interactions and all possible base pairing, including non-canonical ones. We include one additional channel to store the pairing probability between input base pairs calculated based on three paring rules (34) and concatenate it with the previous 16 channel representation. So, an overall 17 channel 2D map is used as our model input. We use an encoder-decoder framework to extract multi-scale long- and short-range interaction features of the input sequence, implemented in a U-Net model (43). For this reason, we will refer to our method as UFold (stands for U-Net based on RNA folding). The output of UFold is the predicted contact score map between the bases of the input sequence. UFold is fully convolutional, and as such, it can readily handle input sequences with variable lengths.
We conduct experiments on both known family RNA sequences and cross family RNA sequences to compare the performance of UFold against both the traditional energy minimization-based methods and recent learning-based methods. We show that UFold yields substantial performance gain over previous methods on within-family datasets, highlighting its promising potential in solving the RNA secondary structure prediction problem. We also show how to use synthetic data to improve the generalization of UFold on the more challenging cases of cross-family RNA structure prediction.
UFold is fast with an inference time of an average of 160 ms per sequence for RNA sequences with lengths of up to 1500 bp. We have developed an online web server running UFold RNA secondary structure prediction. The server is freely available, allowing users to enter sequences and visualize predicted secondary structures.
MATERIALS AND METHODS
Datasets
Several benchmark datasets are used in this study: (a) RNAStralign (44), which contains 30 451 unique sequences from 8 RNA families; (b) ArchiveII (45), which contains 3975 sequences from 10 RNA families and is the most widely used dataset for benchmarking RNA structure prediction performance; (c) bpRNA-1m (46), which contains 102 318 sequences from 2588 families and is one of the most comprehensive RNA structure datasets available and (d) bpRNA-new, derived from Rfam 14.2 (41,47), containing sequences from 1500 new RNA families. RNA families occurring in bpRNA-1m or any other dataset are excluded from bpRNA-new. e) PDB dataset from bpRNA and PDB database (46,48), which contains high-resolution (<3.5 Å) RNA X-ray structures, we also manually downloaded sequences that were submitted to PDB from July 2017 to October 2020. In this work, the bpRNA-new dataset is treated as a cross-family dataset to assess cross-family model generalization.
The RNAStralign dataset is randomly split into training and test sets, with 24 895 and 2854 samples, respectively. Redundant sequences between test and training are removed in the same way as processed in e2efold (36) and MXFold2 (41). For the bpRNA-1m dataset, we followed the same processing procedure used in MXfold2 (41) by using the CD-HIT program (49) to remove redundant sequences and randomly split the dataset into two sub-datasets for training and testing, named TR0 and TS0, respectively. Redundancy removed ArchiveII and bpRNA-new are used only for testing. As for the PDB dataset, we used PDB sequences retrieved from bpRNA database and PDB database as training data, and then referred to the name of datasets TS1, TS2, TS3 from (50) as test set and manually collect their high-quality RNA secondary structure from the PDB file using RNApdbee 2.0 (51). Sequences with similarity scores of greater than 80% to the training data were discarded using CD-HIT-EST. Details of statistics of the datasets are listed in Supplementary Tables S1 and S2. In addition, we also include data augmentation strategy to enlarge the training set, which is detailed in Results section. All in all, the training datasets we used in the paper are RNAStralign training dataset, TR0, augmented training data, and PDB training data. The test datasets are ArchiveII, TS0, bpRNA-new and PDB test data (TS1, TS2 and TS3).
Input and output representation
The general problem of the RNA secondary structure prediction is to predict base pairing patterns given an input sequence. Let  with
with  be an input sequence of length L. The goal is to predict the secondary structure of
  , represented by a contact matrix
  with
with  denoting a base pairing between bases
  and
and  , and 0 otherwise. UFold utilizes a deep neural network to predict the contact matrix given the input. Next, we describe several design choices behind UFold (Figure 1).
Figure 1.

The overall architecture of UFold. (A) The input sequence is first converted into one-hot representation. A novel representation of the sequence is then introduced by taking outer product of all combinations of base pair channels, resulting in an image-like representation with 16 channels and with the same size as the contact map. We calculate a paring possibilities matrix according to three paring rules and concatenate this extra matrix with previous feature to obtain the final 17 channel input. (B) Detailed architecture of our framework. The input is a  tensor representation of the original sequence. The U-Net takes the
  tensor as input and outputs an
  symmetric score matrix Y. After postprocessing, matrix
  is the final prediction of the contact map.
Most existing learning-based methods treat the input as a sequence and use recurrent neural nets (RNNs) to model the interaction between different bases. Gated RNNs, such as LSTMs and GRUs, are often the method of choice for dealing with sequential data because of their ability to model long-range dependencies. However, RNN models need to be run sequentially, causing issues in both training and inference. Newer RNA structure prediction models based on transformers, which do not require the sequential data to be processed in order, have also been proposed (36).
Unlike the previous models, UFold converts the input sequence directly into an ‘image’. This is done by first encoding  with one-hot representation, representing the sequence with an
  binary matrix
  .
.  is then transformed into a
  tensor through a Kronecker product between
  and itself, followed by reshaping dimensions (Figure 1a),
 |
(1) |
In this representation, input  can be understood as an image of size
  with 16 color channels. Each channel specifies one of the 16 possible base-pairing rules;
  denotes whether bases
  and
and  are paired according to the i-th base-pairing rule (e.g. i = 2 for A–C pairing).
To overcome the sparsity bringing by converting sequencing into 16 channels, we also adopt an extra channel used in CDPFold (34), which reflects the implicit matching between bases (more details in Supplementary notes section 1 and Figure S1). We calculate the paring possibilities between each nucleotide and others from one sequence according to three paring rules (34), using these rules we could calculate the specific values of each nucleotide position with other nucleotides. These non-binary values may help alleviate the sparsity of the model and provide more information on paring bases. The calculated matrix  is then concatenated with
  along the first dimension to get the final UFold input
  of dimension
  .
.
UFold takes  as input and computes
  with a deep convolutional neural net (Figure 1b). The output
  is a
is a matrix, with
  denoting the probability score of nucleotides bases
  and
and  being paired.
The new input representation taken by UFold has several advantages: first, using an image representation allows it to model all possible long-range interactions explicitly. Base pairing between distant sequence segments shows up locally in the image representation. Second, it considers all possible base pairing patterns, making no distinction between canonical and non-canonical base pairs. Third, it allows us to implement a fully convolutional neural model that can handle variable sequence length, eliminating the need of padding the input sequence to a fixed length.
Input and scoring network architecture
UFold uses an encoder-decoder architecture for computing the predicted contact score matrix Y (Figure 1). The model consists of a sequence of down-sampling layers (encoder) to derive increasingly complex semantic representations of the input, followed by a sequence of up-sampling layers (decoder), with lateral connections from the encoder to fill in contextual information. The overall design follows the U-Net model, widely used in the field of image segmentation. More detail on the framework is illustrated in Supplementary file (Section 2).
All operations in UFold are fully convolutional. Thus, the input sequence can be of variable length, with the output matrix changing correspondingly. This feature is especially beneficial for RNA secondary structure as the range of the input sequence length is very large, from tens of nucleotides for small RNAs to thousands of nucleotides for large RNAs. Padding input sequences to the same length as done in other methods would have significantly impacted the efficiency of the algorithm.
UFold is trained by minimizing the cross-entropy between the predicted probability contact matrix Y and the true contact matrix A, using stochastic gradient descent. The predicted matrix of pairs represents the base-pairing probabilities, which are strictly positive in our model. Our final layer of activation function takes the form of a sigmoid activation  , where x is an unbounded output from the previous layer. A positive weight
  of 300 is added to leverage the imbalanced 0/1 distribution to derive the loss function as below.
 |
(2) |
where  is used to represent all parameters in the neural network.
Postprocessing
After the symmetric contact scoring matrix Y is computed by UFold, we use a postprocessing procedure to derive the final secondary structure. The postprocessing procedure takes into account four hard constraints in the secondary structure: (i) the contact matrix should be symmetric; (ii) only canonical plus U–G paring rules are allowed (this can be relaxed by including other non-canonical base pairs); (iii) no sharp loops are allowed, for which we set  and (iv) no overlapping pairs are allowed, that is,
  . We follow the steps used in e2efold by encoding constraints (ii) and (iii) into a matrix
  , defined as M(x):=1 if nucleotides
  and
and can be paired under constraints (ii) and (iii) and equals to 0 otherwise.
To address the first two constraints, we transform Y according to
 |
(3) |
where  denotes element-wise multiplication. It ensures that the transformed Y is symmetric and satisfies constraints (i), (ii) and (iii).
To address the last constraint, we relax it into a linear programming problem,
 |
(4) |
which tries to find an optimal scoring matrix  that is most similar to
  while at the same time satisfying the nonoverlapping pair constraint. The similarity is measured in terms of the inner product between
  and
and  .
.  is a hyperparameter controlling the sparsity of the final output.
The final predicted binary contact map is taken to be  after thresholding it with an offset, which is chosen through a grid search.
Training and evaluation
During training, stratified sampling (36) is applied to the training set to balance the number of training samples from each RNA family. The hyperparameters of UFold are tuned based on the validation set. The number of parameters is listed in Supplementary Table S3.
To improve model transferability on previously unseen RNA families, we augment the training set with synthetic data to train UFold. The synthetic data are generated by randomly mutating sequences in the bpRNA-new dataset (previously unseen RNA families). We then use Contrafold to generate predicted structures on the synthetic data and treat them as ground truth.
Precision is defined as  , evaluated on all predicted base pairs. Recall is defined as
  . And F1 score is the harmonic mean of precision and recall, defined as
  . We use CPU version of Intel(R) Xeon(R) CPU E5-2690 v4 @ 2.60GHz, and for the GPU version we are choosing is Nvidia Titan Xp.
RESULTS
To benchmark the performance of different models, we first conduct three experimental studies: (a) train models on the RNAStralign training set and evaluate on the RNStralign test set and ArchiveII; and (b) train the exact same model on the bpRNA-1m training set (TR0) and evaluate on the bpRNA-1m test set (TS0) as well as on bpRNA-new(bpnew). (c) fine-tune previous model on PDB training dataset and evaluate on a standalone test set. Published deep learning models usually report results from either Study A or Study B. To have a fair and direct comparison with previous models, we report results from both, following the same data splitting, preprocessing, and evaluation protocols.
In comparing the results from different models, we treat within- versus cross-family results separately. In both studies, the test sets, except bpRNA-new(bpnew), contain mostly within family RNA species, that is, RNA species from a similar family occurring in the training set. By contrast, the bpRNA-new dataset contains only cross-family RNA species, that is, none of them shares the same RNA family as those in the training set. Although RNAs that are from a known family are easier digging into, their folding patterns can provide more useful information of formation secondary structure, which it is helpful for the model's performance on previously unseen families to assess its model transferability.
Experimental results on within family datasets
In this section, we report the results of our model on within-family test sets. Figure 2 and Supplementary Table S4 summarizes the evaluation results of UFold on the ArchieveII test set (from Study A), together with the results of a collection of traditional energy-based, including Contextfold (52), Contrafold (21), Linearfold (25), Eternafold (53), RNAfold (18), RNAStructure (Fold) (54), RNAsoft (55) and Mfold (19), and recent learning-based methods MXfold2 (41), SPOT-RNA (37) and e2efold (36). The traditional methods achieve an F1 score in the range of 0.55–0.84. A recent state-of-the-art learning-based method improves the F1 score to 0.77 (MXfold2). UFold can further improve the performance, achieving an F1 score of 0.91. Compared with MXfold2, UFold achieves an 18% increase in F1 score, a 22% increase in recall, and a 13% increase in precision.
Figure 2.
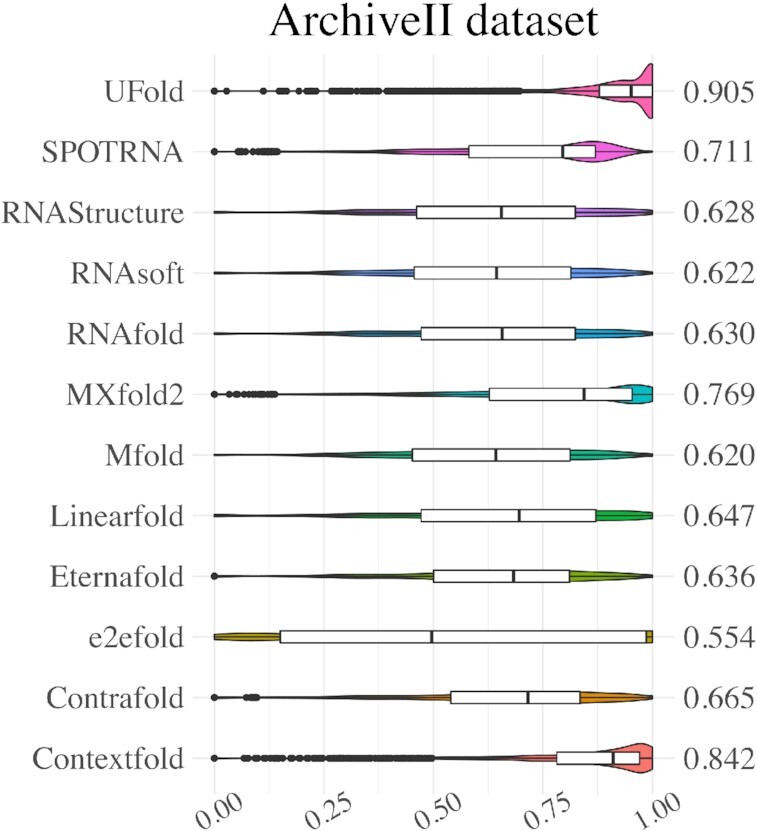
Violin plot on the ArchiveII dataset. Visualization of F1 value of UFold versus other 11 RNA secondary structure predictions methods.
Figure 3 and Supplementary Table S5 summarizes the evaluation results on the TS0 test set (from Study B). Since this dataset was also used in two other deep learning-based methods—SPOT-RNA and MXfold2, we compare UFold with these two methods along with other energy-based methods. Again, UFold outperforms both the deep learning-based and the energy-based methods. UFold achieves a mean F1 score of 0.654 on this dataset, corresponding to a 5.7% improvement over SPOT-RNA, the state-of-the-art method on this dataset, and 15% improvement over traditional methods. Improvements in recall and precision also surpass all other methods.
Figure 3.
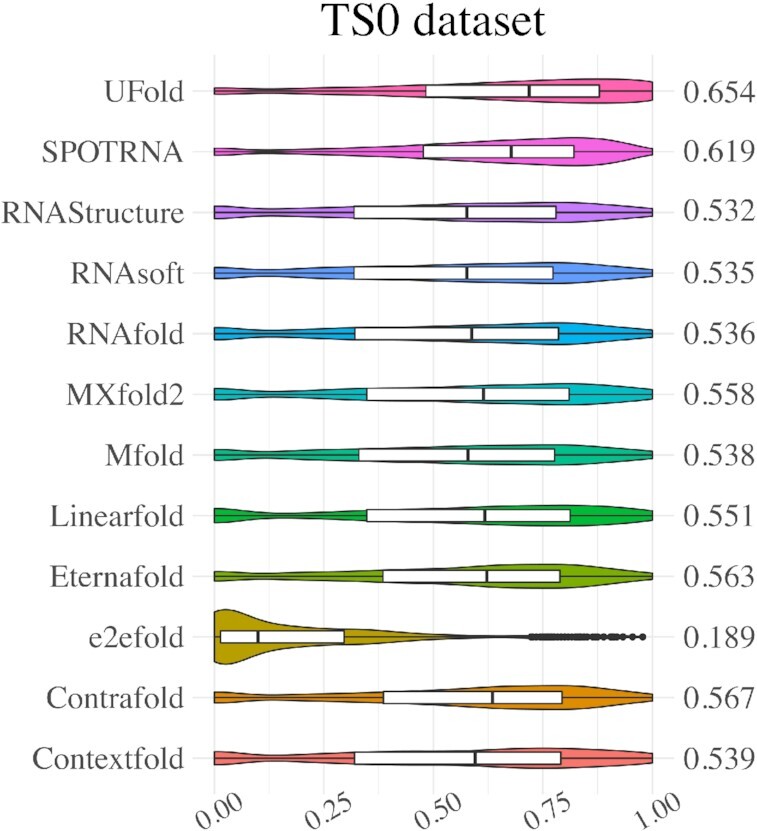
Violin plot on the TS0 dataset. Visualization of F1 value of UFold versus other 11 RNA secondary structure predictions methods.
We conduct an experiment to demonstrate whether the ‘image-like’ encoding of sequences helps improve the prediction of long-range interactions. For this experiment, we use the TS0 dataset as a test dataset since it contains more versatile sequences of different length and various RNA families. For each sequence of length L, we define the paired and unpaired bases with intervals longer than L/2 as long-range base pairing. We then calculate the precision, recall as well as F1 score of UFold on these long-range pairing predictions and compare them to other methods. The results are reported in Supplementary Figure S2 and Supplementary Table S6. We find that UFold achieves significantly better results than other methods on these long-range pairing predictions. Moreover, the results also show that the performance of UFold on long-range base pairing prediction is similar to its performance on short-range base pairings (Figure 2). By contrast, the performances of all other methods significantly deteriorate when evaluated on long-range interactions. These results demonstrate the ‘image-like’ encoding facilitates the prediction of long-range interactions.
Predicting secondary structures with pseudoknots is especially challenging for thermodynamic models. We also validate the performance of UFold on predicting base pairing in the presence of pseudoknots. For this purpose, we use all RNA structures in the RNAStralign test set, on which we then benchmark UFold against other methods that can predict pseudoknots, including SPOT-RNA, e2efold, RNAstructure(ProbKnot) (56), NuPack (57) and HotKnots (58). We examined whether ground truth and predictions have pseudoknot respectively and summarized results in Table 1. As shown in Table 1, all other methods tend to predict pseudoknot structures for normal sequences. The number of the pseudoknot pairs of different types is listed in Supplementary Table S7 and accuracy of the pseudoknotted pairs is also measured. The result is shown in Table 1 as well. By contrast, UFold still achieves higher recall, precision and specificity values, while maintaining the highest pseudoknotted pairs prediction accuracy compared with others, highlighting the robustness of UFold predictions in the presence of pseudoknots.
Table 1.
Evaluation results of RNA structures with pseudoknots on the RNAStralign test dataset
| Method | Recall | Precision | Specificity | Accuracy |
|---|---|---|---|---|
| UFold | 99% | 96.2% | 96.8% | 87.5% |
| SPOT-RNA | 97.8% | 67.7% | 61.8% | 31.4% |
| E2Efold | 99% | 84.4% | 84.0% | 78.8% |
| RNAstructure (ProbKnot) | 76.1% | 77.8% | 81.5% | 38.5% |
| NuPack | 93.3% | 72.4% | 72.2% | 51.4% |
| HotKnotsa | 56.5% | 50% | 83.1% | 42.7% |
aThe sequence number here is 2021, the rest sequence number is 2826.
Experimental results on cross family datasets
In this section, we evaluate the performance of UFold on previously unseen RNA families. We expect learning-based methods do poorly on these RNAs since they are not represented in the training set as shown in Supplementary Table S8. To address this problem, methods integrating free energy minimization with deep learning methods have been proposed, like MXfold2 (41). However, these methods inadvertently introduce biases into the prediction model and likely lead to reduced performance on within family RNAs.
Although UFold does not involve any energy minimization term in its original design, it uses data augmentation to improve the performance on cross-family RNAs with the help of another model Contrafold (21), a probabilistic model which generalizes upon stochastic context-free grammars (SCFGs) by using discriminative training and feature-rich scoring found in typical thermodynamic models. Specifically, for each sequence we randomly choose 20–30% present of single nucleotides to perform random mutation. For each real sequence, we first generate 3 synthetic sequences to create a pool of synthetic sequences. We then use CD-HIT 80 to remove any sequences that have similarity over 80% to real sequences. The resulting synthetic sequence pool is then used for generating synthetic data with size 2000. The synthetic ground truth labels are generated with Contrafold, which then use to train UFold. Those data are then merged with the TR0 training set for model training.
Figure 4 and Supplementary Table S8 show the evaluation results of UFold using the previously pre-trained model on the bpRNA-new dataset, containing about 1500 previously unseen RNA families. Note that here UFold is trained only once based on all the training data for the three testing experiments including ArchiveII, TS0 and bpRNA-new datasets. UFold can achieve a similar performance on bpRNA-new dataset as other methods like MXfold2, all of which involve thermodynamic terms or constraints in their objectives. By contrast, UFold is a pure learning-based method. Through data augmentation, it can learn to predict the structures of RNAs not represented in the training set and further improved the performance on previously unseen family sequences (i.e. bpnew dataset).
Figure 4.
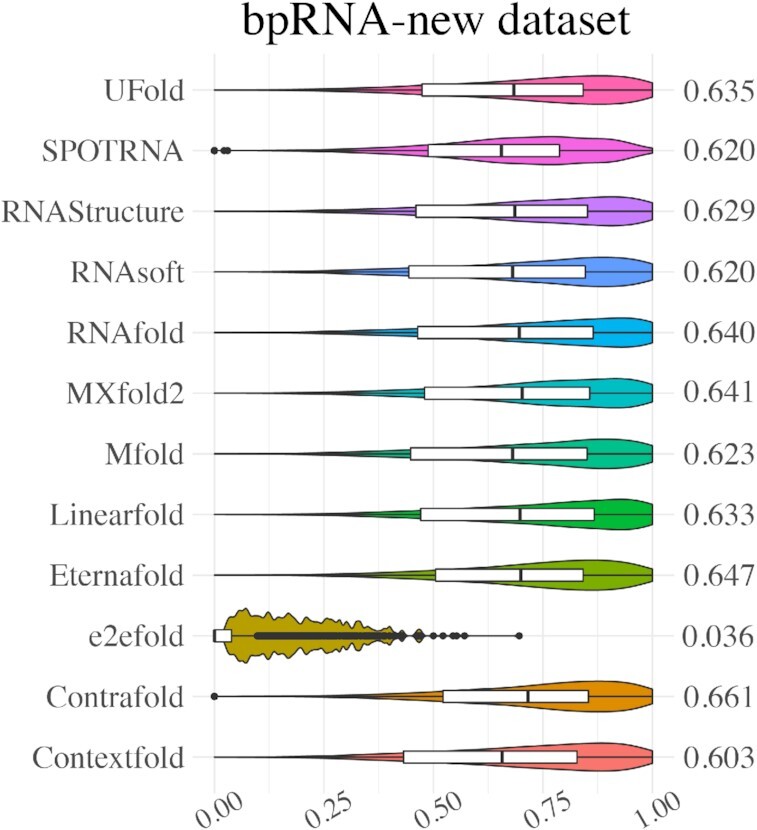
Violin plot on the bpRNA-new dataset. Visualization of F1 value of UFold versus other 11 RNA secondary structure predictions methods.
Furthermore, UFold is also benchmarked on high-resolution based RNA secondary structures derived from the PDB dataset, whose secondary structures have been experimentally validated. We used pretrained model and fine-tuned it on PDB sequences retrieved from bpRNA database and PDB database. Following the partition used in SPOT-RNA2 (50), we divided the PDB sequences into three subsets: TS1, TS2 and TS3. The overall result is reported in Figure 5, more detailed results are presented in Supplementary Table S9-S11. Based on the results, UFold is dealing well in recognizing these dense pairing RNA secondary structures compared with others on this high-quality experimentally validated dataset. We also notice another recent model SPOT-RNA2 (50) which incorporates evolutionary-based features besides sequence features, but all the compared models in our results are all only sequence based so we do not include it in our summarized results. The results of splitting these datasets (TS1, TS2 and TS3) are shown in Supplementary Supplementary Figure S3 and Supplementary Table S9-S11. In addition, we benchmarked 6 RNAs from PDB dataset, which is measured in SPOT-RNA paper. We confirmed that none of these sequences appeared in our training dataset. As shown in Supplementary Figure S4, UFold produced consistently better results than SPOT-RNA and other predictors on these 6 RNAs. Since PDB dataset contains multiple non-canonical pairs, so we systematically measured the performance of UFold against SPOT-RNA which is also capable of predicting non-canonical pairs. The higher mean F1 value in three datasets indicates the superior ability of predicting non-canonical pairs of UFold as shown in Supplementary Table S12. These findings support the effectiveness of UFold in handling non-canonical pairs. We also explored how the UFold performs on different Rfam families. We mapped all the sequences from PDB dataset to Rfam families using Rfam webserver (https://rfam.xfam.org), during which we found 34 RNA families matched to Rfam families, covering 47 of the sequences in the test set. Among those, we found 26 RNA families (including 39 sequences) that are overlapped with training families. We then evaluated the performance of F1 value on two groups: no_Rfam_family which contains sequences that do not match any Rfam or other families in the training set, and within-family which contains sequences matching a family in the training set. As reported the results in Supplementary Figure S5, the sequences that do not match to any Rfam families even achieve higher mean F1 value as it is shown in Supplementary Figure S6. This further demonstrates UFold's robust performance.
Figure 5.
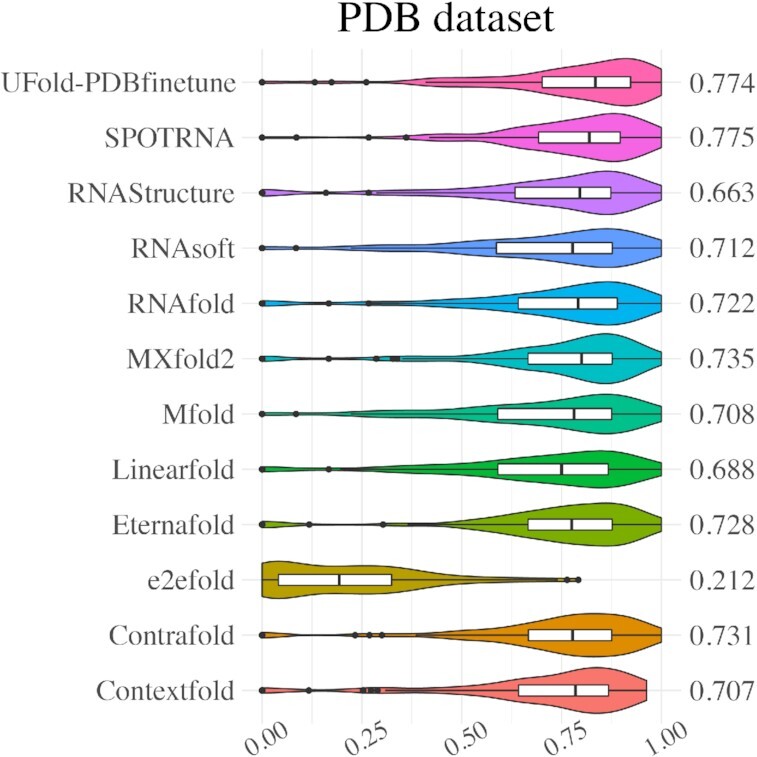
Violin plot on the PDB dataset. Visualization of F1 value of UFold versus other 11 RNA secondary structure predictions methods.
In order to further validate the effectiveness of UFold prediction, we include the assessment of the statistical significance on the performance comparisons between UFold and other methods. Two types of statistical significance measures are calculated: one based on paired t-tests and the other based on bootstrapping. The paired t-test P-value results are shown in Supplementary Table S13, which shows that UFold performs better than the other methods in a statistically significant way, with most P-values less than 0.05.
For the PDB dataset, because its three subsets (TS1, TS2 and TS3) have limited number of sequences, we used bootstrapping strategy on these datasets to estimate the statistical significance. The results are summarized in Supplementary Figure S7, which shows that the performance of UFold is significantly better than nearly all other methods. For bootstrapping, margins of improvements reside outside the 95% confidence intervals with steady interval width (Supplementary Figure S8 and Supplementary Table S14). Altogether, our results support previous conclusions and the performance improvements of UFold over previous methods are statistically significant.
Another point worth noting is that, since UFold chooses Kronecker product to construct the input, in order to validate whether this is a good choice compared to other concatenation such as outer concatenation adopted in SPOT-RNA (37). We added one additional ablation study, in which we replace the Kronecker product with outer concatenation by first extending the one-hots column wise and row wise and then concatenating them together to create a new input matrix. We retrain the whole UFold model with this input while keeping the rest the same. We use ArchiveII and bpnew dataset to test the performance in our ablation study. As it is shown in Supplementary Figure S9, on both datasets we tested, the Kronecker product design yields better results. We think the reason is that the Kronecker product design provides a more direct representation of base-pairing information. On the other hand, outer concatenation design in theory contains the same information encoded in the Kronecker product, but requires more complicated modellings to process this information.
Visualization
After quantitively evaluating the prediction performance, we visualize the RNA secondary structures predicted by UFold to check the pairing details of each nucleotide. For this purpose, the predicted contact maps were first converted to a bpseq format according to base pair positions. Raw sequences with the corresponding predicted structures were fed into the VARNA tool (59) to obtain the visualization result. As a comparison, we also show the predicted structures from the other three best-performed methods, MXfold2, SPOT-RNA and e2efold as well as the ground-truth structures. Two examples are from the Aspergillus fumigatus species and Alphaproteobacteria subfamily 16S rRNA, their RNA IDs are GSP-41122, as recorded in SRPDB database (60) and U13162 as recorded in RNAStralign database (http://rna.urmc.rochester.edu), respectively. They are drawn and shown in Figure 6. In both cases, UFold generates RNA secondary structures more similar to the ground-truth when compared with other state-of-the-art methods like MXfold2, SPOT-RNA and E2Efold, showing the closest secondary structure to the ground truth structure. In addition, we also visualized more examples from PDB database, whose sequences are retrieved from 2019 to 2021. As the results shown in Supplementary Figures S10 and S11, UFold is capable of predicting those structures including pseudoknots and non-canonical pairs more resemble to ground truth structures.
Figure 6.

Visualization of two example UFold RNA secondary structure predictions. From top to bottom: ground truth, UFold prediction, and E2Efold prediction. Two RNA sequences are (A) Aspergillus fumigatus species, the RNA ID is GSP-41122, as recorded in SRPDB database. and (B) Alphaproteobacteria subfamily 16S rRNA sequence whose database ID is U13162, as recorded in RNAStralign database(http://rna.urmc.rochester.edu). Non-canonical base pairs are colored in light green. In both cases, UFold produces predictions more aligned with the ground-truth.
Inference time
The speed of the prediction algorithm is an important factor in RNA secondary structure prediction, especially for multiple sequences predicting simultaneously. Traditional energy minimization-based methods tend to be slow because of the time complexity of the minimization algorithm. Deep learning-based methods like MXfold2 and SPOT-RNA utilize LSTM structure, which require significantly more parameters than UFold, resulting in low efficiency. UFold inference, on the other hand, runs on feedforward neural nets only. Specifically, it is comprised of a fully connected convolutional neural network, which greatly reduces the running time since all operations are readily parallelizable. It can also handle multiple sequences at once, leading to significantly higher throughput.
The average inference time per sequence of UFold on the RNAStralign test set (containing sequences longer than 1000 bp) is reported in Table 2, together with the average running times of other methods. UFold is much faster than both learning-based and energy-based methods. UFold is nearly two times faster than MXfold2, and orders-of-magnitude faster than RNAstruture (Fold), another popular energy-based method. The running times of UFold and three other recent deep learning-based methods are also shown in Table 2. All these methods are implemented in PyTorch (61) and thus it allows us to compare their model efficiency directly. Our model is still the fastest one among all the other deep learning methods, further demonstrating the efficiency of UFold. To study the effect of sequence length on runtime, we demonstrated two scatter plots of runtime versus length of the sequences. Most computations of UFold are performed on GPU. We first plotted the running time cost on GPU calculation which is shown in Supplementary Figure S12, the runtime is not significantly affected by sequences length since GPUs have efficient parallelization supported by modern deep learning libraries. We then calculated the total runtime (with contact map inference and postprocessing) and compared with two other fastest methods, RNAfold and Linearfold, which can deal with variable sequence length of up to 1500 bp. As shown in Supplementary Figure S13, UFold is almost 5 times faster than the other two methods on the most common length sequence (∼600 bp) and is at least two times faster in longer sequences (up to 1500 bp).
Table 2.
Inference time on the RNAStralign test set
| Method | Time per seq |
|---|---|
| UFold (Pytorch) | 0.16 s (GPU) |
| MXfold2(Pytorch) | 0.31 s (GPU) |
| E2Efold (Pytorch) | 0.40 s (GPU) |
| SPOT-RNA(Pytorch) | 77.80 s (GPU) |
| CDPfold (tensorflow) | 300.107 s |
| LinearFold (C++) | 0.43 s |
| Eternafold (C++) | 6.42 s |
| RNAsoft (C++) | 4.58 s |
| Mfold (C) | 7.65 s |
| RNAstructure (C) | 142.02 s |
| RNAfold (C) | 0.55 s |
| CONTRAfold (C++) | 30.58 s |
Web server
To facilitate the accessibility of UFold, we developed a web server running UFold on the backend and made it freely available. Users can type in or upload RNA sequences in FASTA format. Our server predicts RNA secondary structures using the pre-trained UFold model (trained on all the datasets) and stores predicted structures in a dot-bracket file or bpseq file for end-users to download. Users may also choose to predict non-canonical pairs or not directly in the option panel. The server further provides an interface connection to the VARNA tool (59) for visualizing predicted structures. Most existing RNA prediction servers only permit predicting one RNA sequence at a time, such as RNAfold, MXfold2 and SPOT-RNA, and restrict the length of the input sequence. Our server does not have such limitations. Its main functionality differences compared to other servers are highlighted in Table 3. The interface of our web server is shown in Figure 7.
Table 3.
Functionality comparison of different RNA structure prediction web servers
| Servers | ||||||||
|---|---|---|---|---|---|---|---|---|
| Supported functions | UFold | SPOT-RNA | RNAfold | MXfold2 | Linearfold | Contextfold | RNAsoft | Contrafold |
| Sequence type-in | Yes | Yes | Yes | Yes | Yes | Yes | Yes | Yes |
| Fasta file | Yes | No | Yes | No | Yes | Yes | Yes | Yes |
| Length >600 bp | Yes | Yes | No | No | Yes | Yes | No | Yes |
| Online visualization | Yes | Yes | Yes | Yes | Yes | N/A | No | N/A |
| Support multi-samples | Yes | No | No | No | No | No | No | No |
Figure 7.

UFold web server interface (available at https://ufold.ics.uci.edu). UFold web server allows users to type in or upload their own fasta file with multiple sequences (no number limits) and the backend pretrained model will predict the corresponding RNA secondary structures and provide users either ct or bpseq file to download or directly visualize them online.
DISCUSSION
In this study, we present UFold, a new deep learning-based model for RNA secondary structure prediction. We benchmark UFold on both within- and cross-family RNA datasets and demonstrate that UFold significantly outperforms previous methods on within-family datasets, achieving 10–30% performance improvement over traditional thermodynamic methods, and 5–27% improvement in F1 score over the state-of-the-art learning-based method, bringing in substantial gains in RNA secondary prediction accuracy. In the meantime, it achieves a similar performance as the traditional methods when trained and tested on distinct RNA families. In addition, UFold is fast, being able to generate predictions at roughly 160ms per sequence.
A key difference between UFold and previous learning-based methods is its architectural design. Instead of using raw sequences as input, UFold converts sequences into ‘images’, explicitly modeling all possible base pairing between the nucleotides of the input sequence. This choice of input representation has several important implications: First, base pairing patterns between distant sequence segments show up locally in the image representation, making the detection and learning of these distant base pairing patterns easier. Second, all base pairing patterns are explicitly represented in the input, allowing the model to pick up all potential base pairing rules that might contribute to the formation of the secondary structure. Lastly, but perhaps most importantly, the image representation allows us to implement a fully convolutional model to pick up base-pairing features across multiple scales through an encoder-decoder architecture. This implementation is not only efficient, with operations highly parallelable and allowing for variable input sequence length, but also highly effective in combining both local and global features for the final prediction.
Although UFold demonstrates great potential in solving the RNA secondary structure prediction problem, as a learning-based method, its performance is inevitably closely attached to the quality of training data. Unfortunately, the number of experimentally resolved RNA secondary structures through X-ray crystallography or NMR remains small. Many secondary structures in the RNAStralign dataset are computationally generated by aligning homologous sequences. Fortunately, high-throughput methods for determining or constraining the secondary structures of RNAs are starting to emerge (62,63). We should also mention that UFold currently predicts RNA structures only based on sequences. It is well-known that RNA structures also depend on other factors, such as temperature and salt concentration. How to take these factors into account in deep learning models remains an open question. Because UFold uses a flexible network architecture, we expect it to be able to incorporate the high-throughput data and specific factors to improve model training and inference.
We should note that the method presented here can potentially be applied for protein structure prediction as well. The number of amino acids is much higher than the number of bases. It is worth exploring whether all amino acid pairs, which have 400 pairs, or a subset of them should be considered in the input representation.
In summary, we show the promising potential of deep learning in solving the long-standing RNA secondary structure problem. The new framework presented here brings in a significant performance gain. We expect the prediction accuracy to be further improved as more and higher quality training data are becoming available.
DATA AVAILABILITY
An online web server running UFold is available at https://ufold.ics.uci.edu. Code is available at https://github.com/uci-cbcl/UFold.
Supplementary Material
ACKNOWLEDGEMENTS
We acknowledge helpful discussions with MH Celik and members of the Xie lab.
Contributor Information
Laiyi Fu, Systems Engineering Institute, School of Electronic and Information Engineering, Xi’an Jiaotong University, Xi’an, Shaanxi 710049, China; Department of Computer Science, University of California, Irvine, CA 92697, USA.
Yingxin Cao, Department of Computer Science, University of California, Irvine, CA 92697, USA; Center for Complex Biological Systems, University of California, Irvine, CA 92697, USA; NSF-Simons Center for Multiscale Cell Fate Research, University of California, Irvine, CA 92697, USA.
Jie Wu, Department of Biological Chemistry, University of California, Irvine, CA 92697, USA.
Qinke Peng, Systems Engineering Institute, School of Electronic and Information Engineering, Xi’an Jiaotong University, Xi’an, Shaanxi 710049, China.
Qing Nie, Department of Mathematics, University of California, Irvine, CA 92697, USA; Center for Complex Biological Systems, University of California, Irvine, CA 92697, USA; NSF-Simons Center for Multiscale Cell Fate Research, University of California, Irvine, CA 92697, USA.
Xiaohui Xie, Department of Computer Science, University of California, Irvine, CA 92697, USA.
SUPPLEMENTARY DATA
Supplementary Data are available at NAR Online.
FUNDING
NSF [IIS-1715017]; NSF [DMS-1763272]; NIH [U54-CA217378]; Simons Foundation [594598]. Funding for open access charge: NSF [IIS-1715017]; NSF [DMS-1763272]; NIH [U54-CA217378].
Conflict of interest statement. None declared.
REFERENCES
- 1. Noller H.F. Structure of ribosomal RNA. Annu. Rev. Biochem. 1984; 53:119–162. [DOI] [PubMed] [Google Scholar]
- 2. Rich A., RajBhandary U.. Transfer RNA: molecular structure, sequence, and properties. Annu. Rev. Biochem. 1976; 45:805–860. [DOI] [PubMed] [Google Scholar]
- 3. Allmang C., Kufel J., Chanfreau G., Mitchell P., Petfalski E., Tollervey D. Functions of the exosome in rRNA, snoRNA and snRNA synthesis. EMBO J. 1999; 18:5399–5410. [DOI] [PMC free article] [PubMed] [Google Scholar]
- 4. Geisler S., Coller J.. RNA in unexpected places: long non-coding RNA functions in diverse cellular contexts. Nat. Rev. Mol. Cell Biol. 2013; 14:699–712. [DOI] [PMC free article] [PubMed] [Google Scholar]
- 5. Gebert L.F., MacRae I.J.. Regulation of microRNA function in animals. Nat. Rev. Mol. Cell Biol. 2019; 20:21–37. [DOI] [PMC free article] [PubMed] [Google Scholar]
- 6. Fu L., Peng Q.. A deep ensemble model to predict miRNA-disease association. Sci. Rep. 2017; 7:14482. [DOI] [PMC free article] [PubMed] [Google Scholar]
- 7. Fallmann J., Will S., Engelhardt J., Grüning B., Backofen R., Stadler P.F.. Recent advances in RNA folding. J. Biotechnol. 2017; 261:97–104. [DOI] [PubMed] [Google Scholar]
- 8. Westhof E., Fritsch V.. RNA folding: beyond Watson–Crick pairs. Structure. 2000; 8:R55–R65. [DOI] [PubMed] [Google Scholar]
- 9. Fox G.E., Woese C.R.. 5S RNA secondary structure. Nature. 1975; 256:505–507. [DOI] [PubMed] [Google Scholar]
- 10. Mathews D.H., Moss W.N., Turner D.H.. Folding and finding RNA secondary structure. Cold Spring Harb. Perspect. Biol. 2010; 2:a003665. [DOI] [PMC free article] [PubMed] [Google Scholar]
- 11. Fürtig B., Richter C., Wöhnert J., Schwalbe H.. NMR spectroscopy of RNA. ChemBioChem. 2003; 4:936–962. [DOI] [PubMed] [Google Scholar]
- 12. Cheong H.-K., Hwang E., Lee C., Choi B.-S., Cheong C.. Rapid preparation of RNA samples for NMR spectroscopy and X-ray crystallography. Nucleic Acids Res. 2004; 32:e84. [DOI] [PMC free article] [PubMed] [Google Scholar]
- 13. Fica S.M., Nagai K.. Cryo-electron microscopy snapshots of the spliceosome: structural insights into a dynamic ribonucleoprotein machine. Nat. Struct. Mol. Biol. 2017; 24:791. [DOI] [PMC free article] [PubMed] [Google Scholar]
- 14. Ehresmann C., Baudin F., Mougel M., Romby P., Ebel J.-P., Ehresmann B.. Probing the structure of RNAs in solution. Nucleic Acids Res. 1987; 15:9109–9128. [DOI] [PMC free article] [PubMed] [Google Scholar]
- 15. Knapp G. [16]Enzymatic approaches to probing of RNA secondary and tertiary structure. Methods Enzymol. 1989; 180:192–212. [DOI] [PubMed] [Google Scholar]
- 16. Bevilacqua P.C., Ritchey L.E., Su Z., Assmann S.M.. Genome-wide analysis of RNA secondary structure. Annu. Rev. Genet. 2016; 50:235–266. [DOI] [PubMed] [Google Scholar]
- 17. Underwood J.G., Uzilov A.V., Katzman S., Onodera C.S., Mainzer J.E., Mathews D.H., Lowe T.M., Salama S.R., Haussler D. FragSeq: transcriptome-wide RNA structure probing using high-throughput sequencing. Nat. Methods. 2010; 7:995–1001. [DOI] [PMC free article] [PubMed] [Google Scholar]
- 18. Lorenz R., Bernhart S.H., Zu Siederdissen C.H., Tafer H., Flamm C., Stadler P.F., Hofacker I.L.. ViennaRNA Package 2.0. Algorith. Mol. Biol. 2011; 6:26. [DOI] [PMC free article] [PubMed] [Google Scholar]
- 19. Zuker M. Mfold web server for nucleic acid folding and hybridization prediction. Nucleic Acids Res. 2003; 31:3406–3415. [DOI] [PMC free article] [PubMed] [Google Scholar]
- 20. Mathews D.H., Turner D.H.. Prediction of RNA secondary structure by free energy minimization. Curr. Opin. Struct. Biol. 2006; 16:270–278. [DOI] [PubMed] [Google Scholar]
- 21. Do C.B., Woods D.A., Batzoglou S.. CONTRAfold: RNA secondary structure prediction without physics-based models. Bioinformatics. 2006; 22:e90–e98. [DOI] [PubMed] [Google Scholar]
- 22. Kiryu H., Kin T., Asai K.. Rfold: an exact algorithm for computing local base pairing probabilities. Bioinformatics. 2008; 24:367–373. [DOI] [PubMed] [Google Scholar]
- 23. Bernhart S.H., Hofacker I.L., Stadler P.F.. Local RNA base pairing probabilities in large sequences. Bioinformatics. 2006; 22:614–615. [DOI] [PubMed] [Google Scholar]
- 24. Lange S.J., Maticzka D., Möhl M., Gagnon J.N., Brown C.M., Backofen R.. Global or local? Predicting secondary structure and accessibility in mRNAs. Nucleic Acids Res. 2012; 40:5215–5226. [DOI] [PMC free article] [PubMed] [Google Scholar]
- 25. Huang L., Zhang H., Deng D., Zhao K., Liu K., Hendrix D.A., Mathews D.H.. LinearFold: linear-time approximate RNA folding by 5′-to-3′dynamic programming and beam search. Bioinformatics. 2019; 35:i295–i304. [DOI] [PMC free article] [PubMed] [Google Scholar]
- 26. Sato K., Hamada M., Asai K., Mituyama T.. CENTROIDFOLD: a web server for RNA secondary structure prediction. Nucleic Acids Res. 2009; 37:W277–W280. [DOI] [PMC free article] [PubMed] [Google Scholar]
- 27. Wang X., Tian J.. Dynamic programming for NP-hard problems. Procedia Eng. 2011; 15:3396–3400. [Google Scholar]
- 28. Gardner P.P., Giegerich R.. A comprehensive comparison of comparative RNA structure prediction approaches. BMC Bioinformatics. 2004; 5:140. [DOI] [PMC free article] [PubMed] [Google Scholar]
- 29. Havgaard J.H., Gorodkin J.. RNA structural alignments. Part I. Sankoff-based approaches for structural alignments. RNA Sequence, Structure, and Function: Computational and Bioinformatic Methods. 2014; Springer; 275–290. [DOI] [PubMed] [Google Scholar]
- 30. Washietl S., Bernhart S.H., Kellis M.. Energy-based RNA consensus secondary structure prediction in multiple sequence alignments. RNA Sequence, Structure, and Function: Computational and Bioinformatic Methods. 2014; [DOI] [PubMed] [Google Scholar]
- 31. Kings Oluoch I., Akalin A., Vural Y., Canbay Y.. A review on RNA secondary structure prediction algorithms. 2018 International Congress on Big Data, Deep Learning and Fighting Cyber Terrorism (IBIGDELFT). 2018; ANKARA, Turkey: IEEE; 18–23. [Google Scholar]
- 32. Seetin M.G., Mathews D.H.. RNA structure prediction: an overview of methods. Bacterial Regulatory RNA. 2012; Springer; 99–122. [DOI] [PubMed] [Google Scholar]
- 33. Nowakowski J., Tinoco I. Jr. RNA structure and stability. Seminars in Virology. 1997; 8:Elsevier; 153–165. [Google Scholar]
- 34. Zhang H., Zhang C., Li Z., Li C., Wei X., Zhang B., Liu Y.. A new method of RNA secondary structure prediction based on convolutional neural network and dynamic programming. Front. Genet. 2019; 10:467. [DOI] [PMC free article] [PubMed] [Google Scholar]
- 35. Wang L., Liu Y., Zhong X., Liu H., Lu C., Li C., Zhang H.. DMFold: A novel method to predict RNA secondary structure with pseudoknots based on deep learning and improved base pair maximization principle. Front. Genet. 2019; 10:143. [DOI] [PMC free article] [PubMed] [Google Scholar]
- 36. Chen X., Li Y., Umarov R., Gao X., Song L.. RNA secondary structure prediction by learning unrolled algorithms. International Conference on Learning Representations. 2019; [Google Scholar]
- 37. Singh J., Hanson J., Paliwal K., Zhou Y.. RNA secondary structure prediction using an ensemble of two-dimensional deep neural networks and transfer learning. Nat. Commun. 2019; 10:5407. [DOI] [PMC free article] [PubMed] [Google Scholar]
- 38. Wang S., Peng J., Ma J., Xu J.. Protein secondary structure prediction using deep convolutional neural fields. Sci. Rep. 2016; 6:18962. [DOI] [PMC free article] [PubMed] [Google Scholar]
- 39. Hochreiter S., Schmidhuber J.. Long short-term memory. Neural Comput. 1997; 9:1735–1780. [DOI] [PubMed] [Google Scholar]
- 40. Cer D., Yang Y., Kong S., Hua N., Limtiaco N., John R.S., Constant N., Guajardo-Céspedes M., Yuan S., Tar C.et al.. Universal sentence encoder. 2018; arXiv doi:13 April 2018, preprint: not peer reviewedhttps://arxiv.org/abs/1803.11175v1.
- 41. Sato K., Akiyama M., Sakakibara Y.. RNA secondary structure prediction using deep learning with thermodynamic integration. Nat. Commun. 2021; 12:941. [DOI] [PMC free article] [PubMed] [Google Scholar]
- 42. Chen X., Li Y., Umarov R., Gao X., Song L.. RNA secondary structure prediction by learning unrolled algorithms. International Conference on Learning Representations. 2019; [Google Scholar]
- 43. Ronneberger O., Fischer P., Brox T.. U-net: convolutional networks for biomedical image segmentation. International Conference on Medical Image Computing and Computer-Assisted Intervention. 2015; 234–241. [Google Scholar]
- 44. Tan Z., Fu Y., Sharma G., Mathews D.H.. TurboFold II: RNA structural alignment and secondary structure prediction informed by multiple homologs. Nucleic Acids Res. 2017; 45:11570–11581. [DOI] [PMC free article] [PubMed] [Google Scholar]
- 45. Sloma M.F., Mathews D.H.. Exact calculation of loop formation probability identifies folding motifs in RNA secondary structures. 2016; 22:1808–1818. [DOI] [PMC free article] [PubMed] [Google Scholar]
- 46. Danaee P., Rouches M., Wiley M., Deng D., Huang L., Hendrix D. bpRNA: large-scale automated annotation and analysis of RNA secondary structure. Nucleic Acids Res. 2018; 46:5381–5394. [DOI] [PMC free article] [PubMed] [Google Scholar]
- 47. Kalvari I., Nawrocki E.P., Ontiveros-Palacios N., Argasinska J., Lamkiewicz K., Marz M., Griffiths-Jones S., Toffano-Nioche C., Gautheret D., Weinberg Z.et al.. Rfam 14: expanded coverage of metagenomic, viral and microRNA families. Nucleic Acids Res. 2021; 49:D192–D200. [DOI] [PMC free article] [PubMed] [Google Scholar]
- 48. Rose P.W., Prlić A., Altunkaya A., Bi C., Bradley A.R., Christie C.H., Costanzo L.D., Duarte J.M., Dutta S., Feng Z.et al.. The RCSB protein data bank: integrative view of protein, gene and 3D structural information. Nucleic Acids Res. 2016; 45:D271–D281. [DOI] [PMC free article] [PubMed] [Google Scholar]
- 49. Li W., Godzik A.. Cd-hit: a fast program for clustering and comparing large sets of protein or nucleotide sequences. Bioinformatics. 2006; 22:1658–1659. [DOI] [PubMed] [Google Scholar]
- 50. Singh J., Paliwal K., Zhang T., Singh J., Litfin T., Zhou Y.. Improved RNA secondary structure and tertiary base-pairing prediction using evolutionary profile, mutational coupling and two-dimensional transfer learning. Bioinformatics. 2021; 37:2589–2600. [DOI] [PubMed] [Google Scholar]
- 51. Zok T., Antczak M., Zurkowski M., Popenda M., Blazewicz J., Adamiak R.W., Szachniuk M.. RNApdbee 2.0: multifunctional tool for RNA structure annotation. Nucleic Acids Res. 2018; 46:W30–W35. [DOI] [PMC free article] [PubMed] [Google Scholar]
- 52. Zakov S., Goldberg Y., Elhadad M., Ziv-Ukelson M.. Rich parameterization improves RNA structure prediction. J. Comput. Biol. 2011; 18:1525–1542. [DOI] [PubMed] [Google Scholar]
- 53. Wayment-Steele H.K., Kladwang W., Participants E., Das R.. RNA secondary structure packages ranked and improved by high-throughput experiments. 2020; bioRxiv doi:31 May 2020, preprint: not peer reviewed 10.1101/2020.05.29.124511. [DOI] [PMC free article] [PubMed]
- 54. Reuter J.S., Mathews D.H.. RNAstructure: software for RNA secondary structure prediction and analysis. BMC Bioinformatics. 2010; 11:129. [DOI] [PMC free article] [PubMed] [Google Scholar]
- 55. Andronescu M., Aguirre-Hernandez R., Condon A., Hoos H.H.. RNAsoft: a suite of RNA secondary structure prediction and design software tools. Nucleic Acids Res. 2003; 31:3416–3422. [DOI] [PMC free article] [PubMed] [Google Scholar]
- 56. Bellaousov S., Mathews D.H.. ProbKnot: fast prediction of RNA secondary structure including pseudoknots. RNA. 2010; 16:1870–1880. [DOI] [PMC free article] [PubMed] [Google Scholar]
- 57. Zadeh J.N., Steenberg C.D., Bois J.S., Wolfe B.R., Pierce M.B., Khan A.R., Dirks R.M., Pierce N.A.. NUPACK: analysis and design of nucleic acid systems. J. Comput. Chem. 2011; 32:170–173. [DOI] [PubMed] [Google Scholar]
- 58. Ren J., Rastegari B., Condon A., Hoos H.H.. HotKnots: heuristic prediction of RNA secondary structures including pseudoknots. RNA. 2005; 11:1494–1504. [DOI] [PMC free article] [PubMed] [Google Scholar]
- 59. Darty K., Denise A., Ponty Y.. VARNA: Interactive drawing and editing of the RNA secondary structure. Bioinformatics. 2009; 25:1974. [DOI] [PMC free article] [PubMed] [Google Scholar]
- 60. Andersen E.S., Rosenblad M.A., Larsen N., Westergaard J.C., Burks J., Wower I.K., Wower J., Gorodkin J., Samuelsson T., Zwieb C.. The tmRDB and SRPDB resources. Nucleic Acids Res. 2006; 34:D163–D168. [DOI] [PMC free article] [PubMed] [Google Scholar]
- 61. Paszke A., Gross S., Massa F., Lerer A., Bradbury J., Chanan G., Killeen T., Lin Z., Gimelshein N., Antiga L.et al.. Wallach H., Larochelle H., Beygelzimer A., dAlché-Buc F., Fox E., Garnett R.. PyTorch: An imperative style, high-performance deep learning library. Advances in Neural Information Processing Systems 32. 2019; Curran Associates, Inc; 8024–8035. [Google Scholar]
- 62. Strobel E.J., Yu A.M., Lucks J.B.. High-throughput determination of RNA structures. Nat. Rev. Genet. 2018; 19:615–634. [DOI] [PMC free article] [PubMed] [Google Scholar]
- 63. Lusvarghi S., Sztuba-Solinska J., Purzycka K.J., Rausch J.W., Le Grice S.F. RNA secondary structure prediction using high-throughput SHAPE. JoVE (J. Visual. Exp.). 2013; e50243. [DOI] [PMC free article] [PubMed] [Google Scholar]
Associated Data
This section collects any data citations, data availability statements, or supplementary materials included in this article.
Supplementary Materials
Data Availability Statement
An online web server running UFold is available at https://ufold.ics.uci.edu. Code is available at https://github.com/uci-cbcl/UFold.