

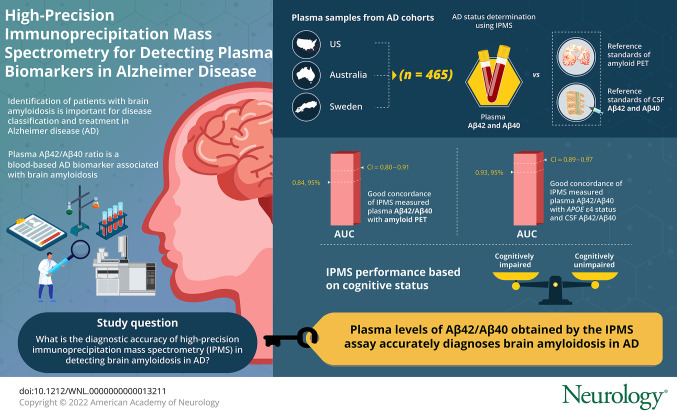
Abstract
Background and Objectives
To determine the diagnostic accuracy of a plasma Aβ42/Aβ40 assay in classifying amyloid PET status across global research studies using samples collected by multiple centers that utilize different blood collection and processing protocols.
Methods
Plasma samples (n = 465) were obtained from 3 large Alzheimer disease (AD) research cohorts in the United States (n = 182), Australia (n = 183), and Sweden (n = 100). Plasma Aβ42/Aβ40 was measured by a high precision immunoprecipitation mass spectrometry (IPMS) assay and compared to the reference standards of amyloid PET and CSF Aβ42/Aβ40.
Results
In the combined cohort of 465 participants, plasma Aβ42/Aβ40 had good concordance with amyloid PET status (receiver operating characteristic area under the curve [AUC] 0.84, 95% confidence interval [CI] 0.80–0.87); concordance improved with the inclusion of APOE ε4 carrier status (AUC 0.88, 95% CI 0.85–0.91). The AUC of plasma Aβ42/Aβ40 with CSF amyloid status was 0.85 (95% CI 0.78–0.91) and improved to 0.93 (95% CI 0.89–0.97) with APOE ε4 status. These findings were consistent across the 3 cohorts, despite differences in protocols. The assay performed similarly in both cognitively unimpaired and impaired individuals.
Discussion
Plasma Aβ42/Aβ40 is a robust measure for detecting amyloid plaques and can be utilized to aid in the diagnosis of AD, identify those at risk for future dementia due to AD, and improve the diversity of populations enrolled in AD research and clinical trials.
Classification of Evidence
This study provides Class II evidence that plasma Aβ42/Aβ40, as measured by a high precision IPMS assay, accurately diagnoses brain amyloidosis in both cognitively unimpaired and impaired research participants.
Alzheimer disease (AD) brain pathology, which is characterized by amyloid plaques and neurofibrillary tangles, accumulates in the brain for 1 to 2 decades before most individuals develop dementia symptoms.1-3 In cognitively unimpaired individuals, biomarkers of AD pathology are used to identify persons at risk of AD dementia for enrollment in prevention trials designed to delay or prevent the development of AD dementia symptoms.4 In cognitively impaired individuals, AD biomarkers are used to evaluate whether AD is a potential cause of dementia symptoms.5,6 With the Food and Drug Administration approval of the anti-amyloid monoclonal antibody Aduhelm, the first putative disease-modifying treatment for AD, one of the major challenges is efficiently identifying patients with amyloid plaques. Although both amyloid PET and CSF biomarkers of AD accurately detect amyloid plaques, the high cost, limited availability, and perceived invasiveness of these methods limit their use and may extend the time until biomarker-confirmed AD diagnosis.7,8
The recent rapid development of blood-based AD biomarkers promises to accelerate clinical trials and broaden the availability of biomarker testing in the clinic. Plasma Aβ42 and Aβ40 as measured by conventional techniques like ELISA have relatively high variance and typically perform poorly in distinguishing amyloid-positive and amyloid-negative individuals.9,10 However, several groups have reported that high-precision assays of plasma Aβ42/Aβ40 accurately detect brain amyloidosis.11-15 Some longitudinal studies found that plasma Aβ42/Aβ40 became abnormal even before amyloid PET.13,16 The performance reported for mass spectrometry–based assays has been superior to that of other assays, with receiver operating characteristic area under the curve (ROC AUC) for amyloid PET status of 0.80–0.89 compared to around 0.68 for ELISA and 0.40–0.77 for Simoa assays (eTable 1, links.lww.com/WNL/B715).17-19 Recent independent studies comparing the performance of different mass spectrometry and immunologic assays found that our immunoprecipitation mass spectrometry (IPMS) assay had the highest concordance with amyloid PET status, while several other assays performed no better than a model with age and APOE ε4 carrier status.20,21 The accuracy of the IPMS plasma Aβ42/Aβ40 assay as a biomarker of brain amyloidosis needs to be validated in multiple cohorts to establish its accuracy and robustness. Furthermore, differences in studies, such as preanalytical factors, may affect measurement of Aβ, and it is unknown whether plasma Aβ42/Aβ40 can be measured consistently at different centers and cohorts with different collection methods. It also remains unclear whether plasma Aβ42/Aβ40 is a reliable measure of brain amyloidosis in both cognitively unimpaired and impaired individuals.
We sought to determine the performance of the IPMS plasma Aβ42/Aβ40 assay in 3 different cohorts in the United States, Europe, and Australia. Using samples from 3 major AD studies with different blood collection and processing protocols, we examined whether plasma Aβ42/Aβ40 is an accurate measure of brain amyloidosis in cognitively unimpaired and cognitively impaired individuals. Because this assay has been developed further commercially (PrecivityAD by C2N Diagnostics) and is now being used by physicians in the clinic to detect amyloid plaques and assist in diagnosis of AD dementia, these studies help inform about the properties of a clinically relevant blood test for amyloid plaques.
Methods
Participants
The study participants represent a convenience sample. Study participants were selected from the Alzheimer’s Disease Neuroimaging Initiative (ADNI), the Australian Imaging, Biomarkers and Lifestyle Study (AIBL), and the Swedish BioFINDER study. Participants with at least one stored plasma sample and an amyloid PET scan within 1 year of the plasma sample collection were considered for inclusion regardless of their cognitive status. Plasma samples with relatively large volume available as determined by the biorepository core leader of each study were selected. To maximize the statistical power for precisely estimating of the diagnostic accuracy of plasma Aβ42/Aβ40 while limiting the sample number, a similar number of amyloid PET positive and negative participants were selected from each study.
Details of the 3 studies and the diagnostic criteria can be found in previous publications.22-24 The ADNI cohort included 3 diagnostic categories: cognitively unimpaired (CN), significant memory concern (SMC), and mild cognitive impairment (MCI). The AIBL cohort included 3 diagnostic categories: CN, MCI, and AD dementia. The BioFINDER cohort included 3 diagnostic categories: CN, subjective cognitive decline (SCD), and MCI. To combine these different diagnostic classification systems for this study, cognitive impairment was defined by objective evidence of cognitive impairment, rather than by subjective symptoms. This approach is in alignment with National Institute on Aging–Alzheimer’s Association criteria.25 Individuals with SMC and SCD were included in the cognitively unimpaired category. The cognitively impaired category included MCI and AD dementia.
Standard Protocol Approvals, Registrations, and Patient Consents
Written informed consent was obtained from all participants or legally authorized representatives. For ADNI, the protocol and informed consent forms were approved by the institutional review board at each participating site. For AIBL, all procedures were approved by the institutional human research ethics committees of Austin Health, St Vincent's Health, Hollywood Private Hospital, and Edith Cowan University. For BioFINDER, ethics approval was given by the Regional Ethical Committee of Lund University. PET imaging approval was obtained from the Swedish Medical Products Agency and the local Radiation Safety Committee at Skåne University Hospital.
Amyloid PET Imaging
Amyloid PET was used as a primary reference standard for amyloidosis because it is a well-established biomarker that is widely used in clinical trials and observational studies to determine brain amyloid plaque burden.
In the ADNI cohort, amyloid PET was performed with [18F]-florbetapir according to standardized protocols.26 A global standardized uptake value ratio (SUVR) was computed using a composite of middle frontal, anterior cingulate, posterior cingulate, inferior parietal, precuneus, supramarginal, middle temporal, and superior temporal. An established threshold of SUVR ≥1.11 was used to determine the amyloid PET positivity.27 Centiloid was calculated based on the standardized ADNI PET protocol.28
In the AIBL cohort, amyloid PET was performed with 3 different radiotracers: 11C-Pittsburgh compound B, [18F]-flutemetamol, and [18F]-florbetapir. Methods for all 3 tracers can be found in previous publications.29-31 A global SUVR was computed using the mean SUVR of the frontal, superior parietal, lateral temporal, lateral occipital, and anterior and posterior cingulate regions. Method for Centiloid was as previously described.32 Amyloid PET positivity was defined a priori with the established cut-off of Centiloid >25.
In the BioFINDER cohort, amyloid PET was performed with [18F]-flutemetamol as described previously.33 A composite SUVR was computed using the prefrontal, parietal, temporal lateral, anterior cingulate, posterior cingulate, and precuneus region.33 An established threshold of SUVR ≥1.42 was used to determine the amyloid PET positivity.33 [18F]flutemetamol SUVR values were converted to Centiloid using the Computational Analysis of PET from AIBL (CapAIBL) pipeline.32 Centiloid data were available for 96 BioFINDER participants at the time of analysis.
CSF Collection and Immunoassay
In ADNI, lumbar puncture was performed as described in the ADNI procedures manual.28 In AIBL and BioFINDER, CSF was collected as previously described.34,35 CSF Aβ42 and Aβ40 were measured with the corresponding Elecsys immunoassays on a Roche cobas e601 analyzer. CSF Aβ42/Aβ40 positivity was defined a priori with the established cut-off of ≤0.064 for ADNI36 and ≤0.066 for BioFINDER. CSF was not evaluated in the AIBL cohort because only 9 participants had available data for CSF Aβ42/Aβ40.
Plasma Collection and Processing
In ADNI, plasma was collected according to the ADNI procedures manual.28 In AIBL and BioFINDER, plasma was collected based on their standardized protocols as described before.23,37,38 Table 1 summarizes the plasma collection and processing protocols for the 3 studies, including the participant fasting state, anticoagulant used, centrifuge conditions, and number of freeze–thaw cycles.
Table 1.
Participant Characteristics, Amyloid PET Tracer, Plasma Collection, and Processing Protocols by Study

Liquid Chromatography–Mass Spectrometry Measurement of Plasma Aβ42/Aβ40
The measurement laboratory remained blinded to all sample information until after lockdown and submission of measurement results to the clinical study team. The simultaneous immunoprecipitation of Aβ38, Aβ40, and Aβ42 from human plasma was performed as previously described13 with minor modifications. Briefly, Aβ isoforms were immunoprecipitated from 0.45 mL of plasma on a KingFisher sample processing deck (Thermo Fisher) via a monoclonal anti-Aβ mid-domain antibody (HJ5.1, anti-Aβ13-28) that was conjugated to M-270 Epoxy Dynabeads (Invitrogen). Prior to immunoprecipitation, samples were spiked with a known amount of 15N-Aβ38, 15N-Aβ40, and 15N-Aβ42 for use as analytical reference standards. Enriched proteins were subsequently digested into peptides using LysN endoprotease (Pierce). Liquid chromatography–tandem mass spectrometry was performed as previously described.11 All analyses were performed on an Orbitrap Fusion Lumos Tribrid mass spectrometer (Thermo Fisher) operated in-line with an M-class nanoAcquity chromatography system (Waters). The precursor and product ion pairs utilized for parallel reaction monitoring analysis of Aβ species were chosen as previously described.11,39 Finally, the derived integrated peak areas were analyzed using the Skyline software package.40 Analysis of mass spectrometry data and quality control were performed prior to data unblinding and were as previously described.13 Values that failed quality control were not used for further data analysis. Of note, the immunoprecipitation–mass spectrometry assay allows analysis of Aβ42 and Aβ40 on the same sample simultaneously with stable isotope internal standards, which enables greater precision in measuring the ratio of Aβ42 to Aβ40 (average 2% coefficient of variation) compared to methods in which Aβ42 and Aβ40 are measured with different assays or antibodies.
Statistical Analyses
Differences in participant characteristics among the ADNI, AIBL, and BioFINDER cohorts were compared using 1-way analysis of variance F tests for continuous variables and χ2 tests or Fisher exact test (as appropriate) for categorical variables. Participant characteristics by amyloid PET status were compared using 2-sample t tests for continuous variables and χ2 tests or Fisher exact test (as appropriate) for categorical variables. The performance of plasma Aβ42/Aβ40 in predicting amyloid PET status was evaluated using ROC curve analysis. The relationships between plasma Aβ42/Aβ40, Centiloid, and age, APOE ε4 status (categorized as ε4 carriers or noncarriers), and cognitive status (cognitively unimpaired, cognitively impaired) were assessed using linear regressions. The effect of relevant biological variables, age, sex, APOE ε4 status, and cognitive status were evaluated using logistic regression for each study and generalized (logistic) linear mixed effects (LME) models for the pooled cohort. The generalized LME models included a random intercept for each study. The AUC and the PET-positive probability were estimated from the logistic regressions and generalized LME models. AUCs were compared using the DeLong test and p values were Bonferroni-corrected if multiple comparisons were performed within each cohort. Positive percent agreement (PPA) was defined as the percentage of amyloid PET-positive participants who were plasma Aβ42/Aβ40 positive. Negative percent agreement (NPA) was defined as the percentage of amyloid PET-negative participants who were plasma Aβ42/Aβ40 negative. Cut-offs for plasma Aβ42/Aβ40 and PET-positive probability were derived based on the maximum of Youden index (PPA + NPA – 1). Statistical analyses were performed using SAS 9.4. Plots were created using R 3.6.1. All tests were 2-sided and p < 0.05 was considered statistically significant.
Data Availability
For ADNI and AIBL, data are available upon approved request. For BioFINDER, anonymized data will be shared by request from a qualified academic investigator for the sole purpose of replicating procedures and results presented in the article and as long as data transfer is in agreement with EU legislation on the general data protection regulation and decisions by the ethical review board of Sweden and Region Skåne, which should be regulated in a material transfer agreement.
Results
Participants
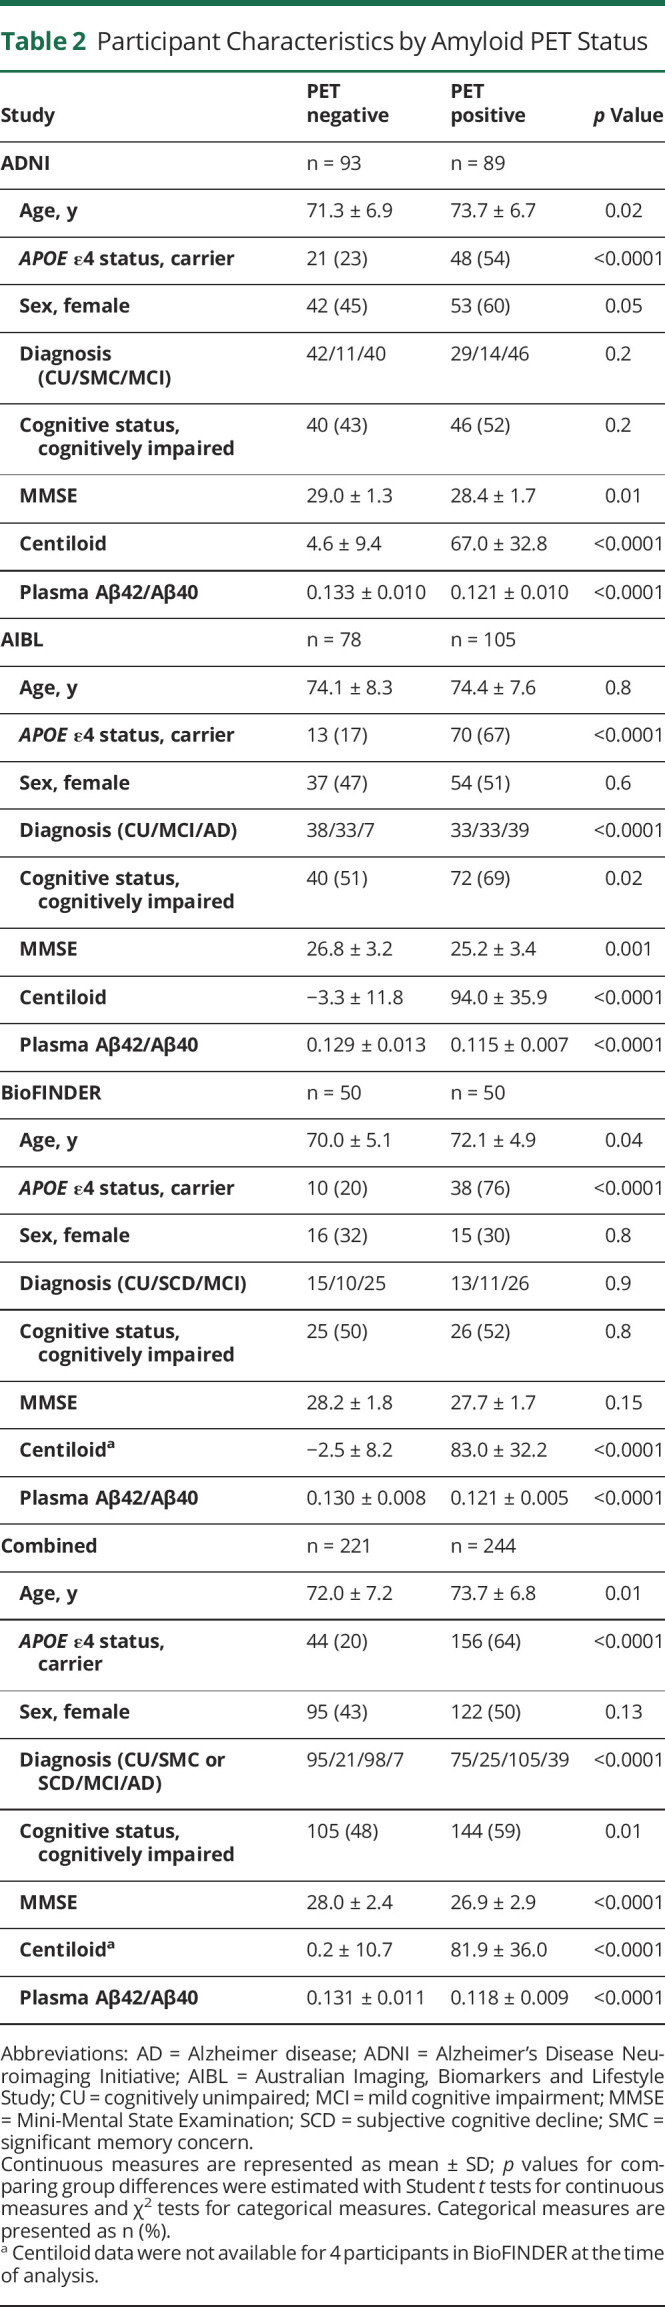
The characteristics of the 3 cohorts and combined cohort are shown in Table 1. Participants in the AIBL cohort (74.2 ± 7.9 years [mean ± SD]) were slightly older than those in the ADNI (72.5 ± 6.9 years) or BioFINDER cohorts (71.1 ± 5.1 years) (p = 0.0009). There were fewer women in the BioFINDER cohort (31%) than in the ADNI (52%) or AIBL cohorts (50%) (p = 0.002). There were more cognitively impaired participants in the AIBL cohort (61%) than in the BioFINDER (51%) or ADNI (47%) cohorts (p = 0.02). The proportion of individuals who were APOE ε4 carriers or amyloid PET positive were not significantly different among the 3 cohorts. Participant characteristics by amyloid PET status are shown in Table 2. In the combined cohort, amyloid PET-positive participants were older (73.7 ± 6.8 vs 72.0 ± 7.2 years, p = 0.01), were more likely to carry an APOE ε4 allele (64% vs 20%, p < 0.0001), and were more likely to be cognitively impaired (59% vs 48%, p = 0.01) compared to amyloid PET-negative individuals.
Table 2.
Participant Characteristics by Amyloid PET Status
Relationship Between Plasma Aβ42/Aβ40 and Amyloid PET Status
In each of the cohorts (eFigure 1, upper panels, links.lww.com/WNL/B715), as well as the combined cohort (Figure 1A), the amyloid PET-positive group had lower plasma Aβ42/Aβ40 compared to the amyloid PET-negative group (p all < 0.0001) (Table 2). ROC analyses demonstrated that plasma Aβ42/Aβ40 alone predicted amyloid PET status with an AUC ranging from 0.82 in ADNI to 0.84 in AIBL; the AUC in the combined cohort was 0.84 (95% confidence interval [CI] 0.80–0.87) (Table 3 and Figure 2). The optimal plasma Aβ42/Aβ40 cutoff for distinguishing amyloid PET status based on the Youden index was similar across the 3 cohorts, ranging from 0.123 for AIBL and BioFINDER to 0.125 for ADNI (eTable 2). In the combined cohort, a cut-off of 0.123 had a PPA of 0.77 (95% CI 0.71–0.82), an NPA of 0.78 (95% CI 0.72–0.83), and accuracy of 0.80 (95% CI 0.76–0.84) with amyloid PET status. Assuming a rate of amyloid positivity of 37.5% in a population, the estimated positive predictive value (PPV) and negative predictive value (NPV) were 0.68 (95% CI 0.62–0.74) and 0.85 (95% CI 0.82–0.88), respectively.
Figure 1. Plasma Aβ42/Aβ40 and PET-Positive Probability by Amyloid PET Status for the Combined Cohort.

(A and B) The probability of amyloid PET positivity was estimated from a logistic regression model with amyloid PET status (positive or negative) as the outcome and plasma Aβ42/Aβ40 and APOE ε4 status as the predictors (see eTable 4, links.lww.com/WNL/B715, for parameter estimates). Filled circles represent cognitively unimpaired participants; open triangles represent cognitively impaired participants. Dashed gray lines represent the cut-off values shown in eTable 2, links.lww.com/WNL/B715.
Table 3.
Models of Amyloid PET Status

Figure 2. Receiver Operating Characteristic Curves for Distinguishing Amyloid PET Status.

Blue = plasma Aβ42/Aβ40 only; red = plasma Aβ42/Aβ40 and age; black = plasma Aβ42/Aβ40 and APOE ε4 status. ADNI = Alzheimer’s Disease Neuroimaging Initiative; AIBL = Australian Imaging, Biomarkers and Lifestyle Study; AUC = area under the curve.
Influence of Relevant Biological Variables (APOE ε4 Status, Age, Sex, and Cognitive Status)
For the combined cohort, older age, carrying an APOE ε4 allele, and male sex were associated with lower plasma Aβ42/Aβ40 (p < 0.0001, p < 0.0001, and p = 0.003, respectively). Conditional on age, APOE ε4 status, and sex, plasma Aβ42/Aβ40 was not associated with cognitive status (p = 0.11) (eTable 3, links.lww.com/WNL/B715). After consideration of age and APOE ε4 status, amyloid PET Centiloid did not differ by sex (p = 0.21), but did differ by cognitive status (p < 0.0001) (eTable 3).
A combination of plasma Aβ42/Aβ40 and APOE ε4 status improved prediction of amyloid PET status in the 3 cohorts compared to plasma Aβ42/Aβ40 alone (AUC 0.88 vs 0.84, respectively, for the combined cohort, p < 0.0001) (Table 3). After accounting for plasma Aβ42/Aβ40 and APOE ε4 status, the addition of age, sex, or cognitive status (separately or in combination) did not significantly improve prediction of amyloid PET status. There was no significant interaction between plasma Aβ42/Aβ40 and APOE ε4 status (p = 0.5) and the AUCs of plasma Aβ42/Aβ40 did not differ between APOE ε4 status and noncarriers (0.83 vs 0.81, p = 0.7). Therefore, models including only plasma Aβ42/Aβ40 and APOE ε4 status were used to predict amyloid PET status (eFigure 1, lower panels, links.lww.com/WNL/B715; Figure 1B; eTable 4). In the combined cohort, a predicted probability of 0.5 for amyloid PET positivity had a maximum Youden index, with a PPA of 0.83 (95% CI 0.77–0.87), NPA of 0.79 (95% CI 0.73–0.84), and accuracy of 0.81 (95% CI 0.77–0.85) with amyloid PET status (eTable 2). The corresponding PPV and NPV in a population with a 37.5% rate of amyloid positivity was 0.70 (95% CI 0.65–0.75) and 0.89 (95% CI 0.86–0.92).
The explanation for improved prediction of amyloid PET status by plasma Aβ42/Aβ40 and APOE ε4 status, relative to plasma Aβ42/Aβ40 alone, was examined. In the combined cohort, plasma Aβ42/Aβ40 levels were lower in APOE ε4 carriers compared to noncarriers (p < 0.0001), even after adjusting for age and sex. However, after adjusting for amyloid PET status, plasma Aβ42/Aβ40 was not different between APOE ε4 carriers and noncarriers (p = 0.21). Among amyloid PET negative participants who had a positive blood test (false positive) and amyloid PET negative participants who had a positive blood test (false negative), APOE ε4 carriers were more likely to be amyloid PET positive than noncarriers (75% vs 38%, p = 0.0002). That is, for those participants who were misclassified by blood test, APOE ε4 status can still provide extra information to improve the classification accuracy. Notably, at the same plasma Aβ42/Aβ40 value, APOE ε4 carriers were more likely to have a positive amyloid PET scan (eTable 4, links.lww.com/WNL/B715); this explains why inclusion of APOE ε4 carrier status improves prediction of amyloid PET status.
Association Between Plasma Aβ42/Aβ40 and APOE ε4 Status With Amyloid PET by Cognitive Status
Plasma Aβ42/Aβ40 and APOE ε4 status distinguished amyloid PET status consistently in both cognitively unimpaired and impaired individuals. In cognitively unimpaired individuals, plasma Aβ42/Aβ40 and APOE ε4 status predicted amyloid PET status with an AUC ranging from 0.84 in ADNI to 0.95 in AIBL (eTable 5, links.lww.com/WNL/B715); the AUC in the combined cohort was 0.89 (95% CI 0.84–0.93) (Table 4). In cognitively impaired individuals, plasma Aβ42/Aβ40 and APOE ε4 status predicted amyloid PET status with an AUC ranging from 0.85 in ADNI to 0.91 in BioFINDER (eTable 5); the AUC in the combined cohort was 0.87 (95% CI 0.82–0.92) (Table 4). Addition of age and sex did not significantly improve prediction of amyloid PET status in either cognitively unimpaired individuals or cognitively impaired individuals. There are no significant differences in the AUCs between cognitively unimpaired and cognitively impaired subcohorts. PPA, NPA, accuracy, PPV, and NPV based on the cut-offs from the combined cohort (0.123 for plasma Aβ42/Aβ40, 0.5 for the predicted probability of amyloid PET positivity) for cognitively unimpaired and cognitively impaired subcohorts are shown in eTable 6. PPV and NPV were calculated based on amyloid positivity rates of 25% in cognitively unimpaired participants and 75% in cognitively impaired participants.
Table 4.
Models of Amyloid PET Status in Cognitively Unimpaired and Cognitively Impaired Individuals

Correlations Between Plasma Aβ42/Aβ40, Amyloid PET Centiloid, and CSF Aβ42/Aβ40
Spearman correlations between plasma Aβ42/Aβ40 and amyloid PET Centiloid ranged from −0.52 (95% CI −0.65 to −0.35) in BioFINDER to −0.57 (95% CI −0.66 to −0.46) in ADNI (eFigure 2, left panel, links.lww.com/WNL/B715). Spearman correlations between plasma Aβ42/Aβ40 and CSF Aβ42/Aβ40 were 0.60 (95% CI 0.31–0.79) in ADNI and 0.59 (95% CI 0.45–0.71) in BioFINDER (eFigure 2, right panel). The correlation between plasma and CSF Aβ42/Aβ40 were not evaluated in the AIBL cohort because only 9 participants had CSF Aβ42/Aβ40 data available. The AUCs of plasma Aβ42/Aβ40 in classifying CSF amyloid status (positive or negative) were 0.92 (95% CI 0.84–1) for ADNI and 0.81 (95% CI 0.73–0.89) for BioFINDER. Including the effect of APOE ε4 status in the logistic regressions improved AUC to 1.00 for ADNI and 0.90 (95% CI 0.84–0.96) for BioFINDER. In the combined cohort, the AUC of plasma Aβ42/Aβ40 with CSF amyloid status was 0.85 (95% CI 0.78–0.91) and improved to 0.93 (95% CI 0.89–0.97) with APOE ε4 status. As in the models for amyloid PET status, age, sex, and cognitive status were not significant predictors of CSF amyloid status in the combined cohort.
Utility of Plasma Aβ42/Aβ40 as a Screening Test for Brain Amyloidosis
The number of participants and amyloid PET scans needed to identify 1,000 amyloid PET positive participants, with and without prescreening with a blood test, were estimated (Figure 3A). For cognitively unimpaired individuals, prescreening with a blood test can reduce the number of amyloid PET scans required by 59% (prescreen with plasma Aβ42/Aβ40 alone) or 62% (prescreen with plasma Aβ42/Aβ40 and APOE ε4 status). For cognitively impaired individuals, prescreening reduces the number of amyloid PET scans required by approximately 19%. The amyloid PET positive rate was assumed to be 25% for the cognitively unimpaired group and 75% for the cognitively impaired group. Data provided in eTable 6, links.lww.com/WNL/B715, were used as the sensitivity and specificity of plasma Aβ42/40 test.
Figure 3. Plasma Aβ42/Aβ40 as a Prescreening Test for Brain Amyloidosis.

(A) The number of participants and amyloid PET scans needed to identify 1,000 amyloid PET–positive participants, with and without prescreening with a blood test. The amyloid PET positive rate was assumed to be 25% for the cognitively unimpaired group and 75% for the cognitively impaired group. Data provided in eTable 6, links.lww.com/WNL/B715, were used as the sensitivity and specificity of plasma Aβ42/40 test. (B) The time and cost savings associated with prescreening for brain amyloidosis with plasma Aβ42/Aβ40 were evaluated for an Alzheimer disease prevention trial similar to the Anti-Amyloid Treatment in Asymptomatic Alzheimer's Disease (A4) Study. In the A4 study, amyloid PET scans were performed in 4,487 participants over a 3-year period, and 1,323 participants (30%) were classified as amyloid PET positive. The sensitivity of 0.80 and specificity of 0.83 based on cognitively unimpaired participants as shown in eTable 6, links.lww.com/WNL/B715, were used for the accuracy of the blood test. Costs were assumed to be $5,000–$8,000 per amyloid PET scan and $500 per blood test.
The time and cost savings associated with prescreening for brain amyloidosis with a blood test were evaluated for an AD prevention trial similar to the Anti-Amyloid Treatment in Asymptomatic Alzheimer's Disease (A4) study (Figure 3B). In the A4 study, amyloid PET scans were performed in 4,487 participants over a 3-year period, and 1,323 of participants (30%) were classified as amyloid PET positive. Prescreening with the blood test reduced the time for enrollment and screening costs (amyloid PET scans + blood test) by half. Screening with blood test alone could be completed in less than 6 months, compared to 3 years with screening with amyloid PET scan alone, and cut costs by 10-fold or more. The blood test was assumed to have a sensitivity of 0.80 and specificity of 0.83 in cognitively unimpaired participants (eTable 6, links.lww.com/WNL/B715). Costs were assumed to be $5,000–$8,000 per amyloid PET scan and $500 per blood test.
Given uncertainty in the amyloid PET positivity rate in the general population, eFigure 3, A and B (links.lww.com/WNL/B715), provide the number of participants and amyloid PET scans needed to identify 1,000 amyloid PET positive participants, with and without prescreening with a blood test, based on a series of amyloid PET positive rate, sensitivity, and specificity values. These figures demonstrated that prescreening with a blood test was more effective when the amyloid PET positivity rate was low in a population (e.g., cognitively unimpaired group), and an assay with high sensitivity and specificity was much more efficient in reducing both the number of participants to be screened and the number of confirmatory PET scans needed.
Discussion
In the 3 independent cohorts that used different protocols for blood collection and processing, as well as multiple amyloid PET radioligands, there was good and consistent correspondence between plasma Aβ42/Aβ40 and amyloid PET status. The good performance of the test in the BioFINDER cohort, in which blood was collected from nonfasting participants, demonstrates this test may be useful in routine clinical settings, where blood is usually drawn under nonfasting conditions. Similar cut-offs between different cohorts and studies suggest that plasma Aβ42/Aβ40 measurements are consistent across blood collection and processing protocols that use different anticoagulants and centrifugation conditions. Furthermore, plasma Aβ42/Aβ40 and APOE ε4 were able to distinguish amyloid PET status similarly in cognitively impaired and cognitively unimpaired individuals. These results suggest that plasma Aβ42/Aβ40 with APOE ε4 status would be helpful for both screening cognitively unimpaired individuals for potential enrollment in AD secondary prevention clinical trials and testing cognitively impaired individuals in the clinic to determine whether AD is the probable etiology.
For this study, amyloid PET status and CSF Aβ42/Aβ40 status were defined based on the cut-offs provided by each study. To account for potential methodologic differences between cohorts, for the combined cohort analyses we used mixed effects models with random intercepts for each cohort. Overall, the correlations between plasma Aβ42/Aβ40, Centiloid, and CSF Aβ42/Aβ40 observed in this study were similar to those reported by other studies.12,13 Although the correlations were strong, they are not close to 1.0, suggesting these 3 measures do not provide identical information. The differences and relationships over time between plasma Aβ42/Aβ40, CSF Aβ42/Aβ40, and amyloid PET need to be evaluated further in future studies.
This study had several limitations. More than half of the participants were cognitively impaired (n = 249), including 46 AD cases and 203 MCI cases, providing sufficient numbers to address whether cognitive status had an effect on plasma amyloid 42/40 detection of amyloid plaques. However, although there were small numbers (8%–10%) of symptomatic participants with AD dementia in ADNI and BioFINDER, they were not selected for this study because the selection criteria for this study were availability of the plasma samples and amyloid PET data within 1 year, not dementia status. Second, in this study, a similar number of plasma samples were selected from amyloid PET positive and negative groups, so the amyloid PET positive rates may not represent those in the ADNI, AIBL, and BioFINDER cohorts, but may be more typical of an early AD or MCI population.41 As PPV and NPV are influenced by amyloid positive rate, the PPV and NPV provided in this research were calculated using an assumed amyloid positive rate (37.5% overall, 25% for cognitively unimpaired, and 75% for cognitively impaired) in the general population instead of using the amyloid PET positive rate observed in the 3 cohorts. Third, ADNI, AIBL, and BioFINDER cohorts have low diversity; therefore it is unclear whether the performance of plasma Aβ42/Aβ40 differs by racial and ethnic groups. Several studies have found that African Americans have significantly lower levels of CSF t-tau and p-tau181 compared to non-Hispanic Whites even after adjusting for age, sex, APOE ε4 status, and cognitive status42,43; however, there is very limited information available on racial or ethnic differences in plasma Aβ42/Aβ40. Further studies to evaluate racial or ethnic differences in plasma Aβ42/Aβ40 are underway.
In clinical trials, AD biomarker testing is used to screen cognitively unimpaired individuals for potential enrollment in trials that aim to evaluate treatments that may prevent or slow the onset of AD dementia symptoms.4 Amyloid PET has been used to screen potential participants for secondary prevention clinical trials,44 but because of cost and limited availability, enrollment is costly and slow. Participants in AD research cohorts including ADNI, AIBL, and BioFINDER are more likely to be healthy, well-educated, and White than the overall population with AD.45 Recruitment of racial minority groups is more difficult for studies that include testing with unfamiliar techniques like amyloid PET and CSF biomarkers.46,47 In contrast, blood tests are relatively well-accepted by most individuals. It seems likely that use of an AD blood test, rather than amyloid PET or CSF biomarkers, may facilitate recruitment of more representative research cohorts and enable development of therapies that are likely to be effective in all groups.
In the clinic, AD biomarker testing is used to determine whether the etiology of cognitive impairment is likely to be AD. Appropriate use criteria for amyloid PET and CSF biomarkers typically recommend testing only for patients with significant diagnostic uncertainty, largely because of the cost, limited availability, and perceived risks or invasiveness of these methods.5,6 Appropriate use criteria for blood-based biomarkers have not yet been formulated, but the drawbacks of blood-based biomarkers are reduced. Given the relatively high rate of AD misdiagnosis even by AD research centers,48 broad-based testing of individuals presenting with cognitive concerns to a dementia specialty clinic may be warranted, especially if out-of-pocket costs to patients are reasonable.
Over the past 3 years, there has been rapid development of multiple blood-based biomarkers, with studies reporting that different phosphorylated tau (p-tau) species, particularly p-tau181 and p-tau217, are highly concordant with amyloid PET status as well as cognitive status.38,49,50 Levels of these p-tau isoforms may reflect both brain amyloidosis and the neuronal damage that results in cognitive impairment.38 Further studies are needed to explore the correlation between plasma p-tau isoforms and Aβ42/Aβ40 at different stages of the AD time course. Recent findings indicate that the region of tau that aggregates in tau tangles, the microtubule binding region, can be accurately measured in CSF and correlates well with tau PET.51 Evaluating combinations of biomarkers that reflect multiple AD-related related processes, including amyloidosis, tauopathy, neurodegeneration, and inflammation, will improve our understanding of AD and aid in accurate diagnosis and prediction of AD risk.13,52
Acknowledgment
The authors thank ADNI, AIBL, and BioFINDER for providing the plasma samples and data and the research volunteers who participated in the ADNI, AIBL, and BioFINDER studies from which these data were obtained and their families.
Glossary
- A4
Anti-Amyloid Treatment in Asymptomatic Alzheimer's Disease
- ADNI
Alzheimer’s Disease Neuroimaging Initiative
- AIBL
Australian Imaging, Biomarkers and Lifestyle Study
- AD
Alzheimer disease
- AUC
area under the curve
- CI
confidence interval
- CN
cognitively normal
- IPMS
immunoprecipitation mass spectrometry
- LME
linear mixed effects
- MCI
mild cognitive impairment
- NPA
negative percent agreement
- NPV
negative predictive value
- p-tau
phosphorylated tau
- PPA
positive percent agreement
- PPV
positive predictive value
- ROC
receiver operating characteristic
- SCD
subjective cognitive decline
- SMC
significant memory concern
- SUVR
standardized uptake value ratio
Appendix. Authors
Footnotes
Class of Evidence: NPub.org/coe
Infographic: links.lww.com/WNL/B764
Study Funding
This study was supported by NIH RF1AG061900 (R.J. Bateman, PI), R56AG061900 (R.J. Bateman, PI), and an anonymous Foundation (R.J. Bateman, PI). S.E.S. is supported by K23AG053426 (S.E. Schindler, PI). ADNI is supported by NIH grant 5U19AG024904-14, the National Institute of Biomedical Imaging and Bioengineering, and through contributions from the following: AbbVie; Alzheimer's Association; Alzheimer's Drug Discovery Foundation; Araclon Biotech; BioClinica, Inc.; Biogen; Bristol-Myers Squibb Co.; CereSpir, Inc.; Cogstate; Eisai Inc.; Elan Pharmaceuticals, Inc.; Eli Lilly and Co.; EuroImmun; F. Hoffmann-La Roche Ltd. and its affiliated company Genentech, Inc.; Fujirebio; GE Healthcare; IXICO Ltd.; Janssen Alzheimer Immunotherapy Research & Development, LLC; Johnson & Johnson Pharmaceutical Research & Development LLC; Lumosity; Lundbeck; Merck & Co., Inc.; Meso Scale Diagnostics, LLC; NeuroRx Research; Neurotrack Technologies; Novartis Pharmaceuticals Corp.; Pfizer Inc.; Piramal Imaging; Servier; Takeda Pharmaceutical Co.; and Transition Therapeutics. The Canadian Institutes of Health Research provided funds to support ADNI clinical sites in Canada. Private sector contributions were facilitated by the Foundation for the National Institutes of Health (fnih.org). The grantee organization is the Northern California Institute for Research and Education and the study is coordinated by the Alzheimer's Disease Cooperative Study at the University of California, San Diego. ADNI data are disseminated by the Laboratory for Neuroimaging at the University of Southern California. A complete listing of ADNI investigators can be found at adni.loni.usc.edu/wp-content/uploads/how_to_apply/ADNI_Acknowledgement_List.pdf. L.M.S. is supported by the ADNI3 grant AG024904 to provide QC oversight on biomarker analyses and the ADNI BioBank at UPenn. The AIBL study (aibl.csiro.au/) is a consortium among Austin Health, CSIRO, Edith Cowan University, and the Florey Institute, The University of Melbourne. Partial financial support was provided by the Alzheimer's Association, the Alzheimer's Drug Discovery Foundation, an anonymous foundation, the Cooperative Research Centre for Mental Health, CSIRO Science and Industry Endowment Fund, the Dementia Collaborative Research Centres, the Victorian Government Operational Infrastructure Support program, the McCusker Alzheimer's Research Foundation, the National Health and Medical Research Council, and the Yulgilbar Foundation. The BioFINDER study was supported by the Knut and Alice Wallenberg Foundation (2017-0383), the Marianne and Marcus Wallenberg Foundation (2015.0125), the Strategic Research Area MultiPark (Multidisciplinary Research in Parkinson's Disease) at Lund University, the Swedish Alzheimer Foundation (AF-939932), the Swedish Brain Foundation (FO2021-0293), The Parkinson Foundation of Sweden (1,280/20), the Konung Gustaf V:s och Drottning Victorias Frimurarestiftelse, the Skåne University Hospital Foundation (2020-O000028), Regionalt Forskningsstöd (2020-0314), and the Swedish federal government under the ALF agreement (2018-Projekt0279). Doses of 18F-flutemetamol injection in BioFINDER were sponsored by GE Healthcare.
Disclosure
Y. Li and S.E. Schindler report no disclosures. J.G. Bollinger, V. Ovod, and K.G. Mawuenyega have submitted the US provisional patent application “Plasma Based Methods for Detecting CNS Amyloid Deposition” as coinventors and may receive royalty income based on technology (stable isotope labeling kinetics and blood plasma assay) licensed by Washington University to C2N Diagnostics. L.M. Shaw reports no disclosures. M.W. Weiner has served on the Advisory Boards for Cerecin/Accera, Alzheon, Inc., Nestle/Nestec, PCORI/PPRN, Dolby Family Ventures, National Institute on Aging (NIA), Boston University Alzheimer's Disease and CTE Center, MIRIADE at VUmc for Amsterdam UMC, Cytox, Indiana University, Acumen, Brain Health Registry, and ADNI; serves on the editorial boards for Alzheimer's & Dementia, TMRI, and MRI; has provided consulting and/or acted as a speaker for Cerecin Inc., Alzheimer's Drug Discovery Foundation (ADDF), BioClinica, The Buck Institute for Research on Aging, FUJIFILM-Toyama Chemical (Japan), Garfield Weston, Baird Equity Capital, University of Southern California, Guidepoint Insights, T3D Therapeutics, Cytox, and Japanese Organization for Medical Device Development, Inc. (JOMDD); and holds stock options with Alzheon, Inc., Alzeca, and Anven. C.L. Masters serves as ad hoc consultant with Actinogen, Acumen, Alterity/Prana, Biogen, Eisai, Lilly, and Roche. C.J. Fowler, J.Q. Trojanowski, M. Korecka, R. Martin, and S. Janelidze reports no disclosures. O. Hansson has acquired research support (for the institution) from AVID Radiopharmaceuticals, Biogen, Eli Lilly, Eisai, GE Healthcare, Pfizer, and Roche; and in the past 2 years, he has received consultancy/speaker fees from AC Immune, Alzpath, Biogen, Cerveau, and Roche. R.J. Bateman co-founded C2N Diagnostics. Washington University and R.J. Bateman have equity ownership interest in C2N Diagnostics and receive royalty income based on technology (stable isotope labeling kinetics and blood plasma assay) licensed by Washington University to C2N Diagnostics. He receives income from C2N Diagnostics for serving on the scientific advisory board and consults for Roche, Genentech, AbbVie, Pfizer, Boehringer-Ingelheim, and Merck. Go to Neurology.org/N for full disclosures.
References
- 1.Jack CR Jr, Knopman DS, Jagust WJ, et al. Hypothetical model of dynamic biomarkers of the Alzheimer's pathological cascade. Lancet Neurol. 2010;9(1):119-128. [DOI] [PMC free article] [PubMed] [Google Scholar]
- 2.Sperling RA, Aisen PS, Beckett LA, et al. Toward defining the preclinical stages of Alzheimer's disease: recommendations from the National Institute on Aging-Alzheimer's Association workgroups on diagnostic guidelines for Alzheimer's disease. Alzheimers Dement. 2011;7(3):280-292. [DOI] [PMC free article] [PubMed] [Google Scholar]
- 3.Bateman RJ, Xiong C, Benzinger TL, et al. Clinical and biomarker changes in dominantly inherited Alzheimer's disease. N Engl J Med. 2012;367(9):795-804. [DOI] [PMC free article] [PubMed] [Google Scholar]
- 4.Sperling RA, Rentz DM, Johnson KA, et al. The A4 study: stopping AD before symptoms begin? Sci Transl Med. 2014;6(228):228fs213. [DOI] [PMC free article] [PubMed] [Google Scholar]
- 5.Johnson KA, Minoshima S, Bohnen NI, et al. Appropriate use criteria for amyloid PET: a report of the amyloid imaging task force, the society of nuclear medicine and molecular imaging, and the Alzheimer's association. Alzheimers Dement. 2013;9(1):e1-16. [DOI] [PMC free article] [PubMed] [Google Scholar]
- 6.Shaw LM, Arias J, Blennow K, et al. Appropriate use criteria for lumbar puncture and cerebrospinal fluid testing in the diagnosis of Alzheimer's disease. Alzheimers Dement. 2018;14(11):1505-1521. [DOI] [PMC free article] [PubMed] [Google Scholar]
- 7.Witte MM, Foster NL, Fleisher AS, et al. Clinical use of amyloid-positron emission tomography neuroimaging: practical and bioethical considerations. Alzheimers Dement. 2015;1(3):358-367. [DOI] [PMC free article] [PubMed] [Google Scholar]
- 8.Duits FH, Martinez-Lage P, Paquet C, et al. Performance and complications of lumbar puncture in memory clinics: results of the multicenter lumbar puncture feasibility study. Alzheimers Dement. 2016;12(2):154-163. [DOI] [PubMed] [Google Scholar]
- 9.Olsson B, Lautner R, Andreasson U, et al. CSF and blood biomarkers for the diagnosis of Alzheimer's disease: a systematic review and meta-analysis. Lancet Neurol. 2016;15(7):673-684. [DOI] [PubMed] [Google Scholar]
- 10.Lovheim H, Elgh F, Johansson A, et al. Plasma concentrations of free amyloid beta cannot predict the development of Alzheimer's disease. Alzheimers Dement. 2017;13(7):778-782. [DOI] [PubMed] [Google Scholar]
- 11.Ovod V, Ramsey KN, Mawuenyega KG, et al. Amyloid beta concentrations and stable isotope labeling kinetics of human plasma specific to central nervous system amyloidosis. Alzheimers Dement. 2017;13(8):841-849. [DOI] [PMC free article] [PubMed] [Google Scholar]
- 12.Nakamura A, Kaneko N, Villemagne VL, et al. High performance plasma amyloid-beta biomarkers for Alzheimer's disease. Nature. 2018;554(7691):249-254. [DOI] [PubMed] [Google Scholar]
- 13.Schindler SE, Bollinger JG, Ovod V, et al. High-precision plasma beta-amyloid 42/40 predicts current and future brain amyloidosis. Neurology. 2019;93(17):e1647-e1659. [DOI] [PMC free article] [PubMed] [Google Scholar]
- 14.Tosun D, Veitch D, Aisen P, et al. Detection of beta-amyloid positivity in Alzheimer's Disease Neuroimaging Initiative participants with demographics, cognition, MRI and plasma biomarkers. Brain Commun. 2021;3(2):fcab008. [DOI] [PMC free article] [PubMed] [Google Scholar]
- 15.West T, Kirmess KM, Meyer MR, et al. A blood-based diagnostic test incorporating plasma Abeta42/40 ratio, ApoE proteotype, and age accurately identifies brain amyloid status: findings from a multi cohort validity analysis. Mol Neurodegener. 2021;16(1):30. [DOI] [PMC free article] [PubMed] [Google Scholar]
- 16.Burnham SC, Fandos N, Fowler C, et al. Longitudinal evaluation of the natural history of amyloid-beta in plasma and brain. Brain Commun. 2020;2(1):fcaa041. [DOI] [PMC free article] [PubMed] [Google Scholar]
- 17.de Rojas I, Romero J, Rodriguez-Gomez O, et al. Correlations between plasma and PET beta-amyloid levels in individuals with subjective cognitive decline: the Fundacio ACE Healthy Brain Initiative (FACEHBI). Alzheimer's Res Ther. 2018;10(1):119. [DOI] [PMC free article] [PubMed] [Google Scholar]
- 18.Brickman AM, Manly JJ, Honig LS, et al. Plasma p-tau181, p-tau217, and other blood-based Alzheimer's disease biomarkers in a multi-ethnic, community study. Alzheimers Dement. 2021;17(8):1353-1364. [DOI] [PMC free article] [PubMed] [Google Scholar]
- 19.Verberk IMW, Slot RE, Verfaillie SCJ, et al. Plasma amyloid as prescreener for the earliest Alzheimer pathological changes. Ann Neurol. 2018;84(5):648-658. [DOI] [PMC free article] [PubMed] [Google Scholar]
- 20.Janelidze S, Palmqvist S, Leuzy A, et al. Detecting Amyloid Positivity in Early Alzheimer Disease Using Plasma Biomarkers. Presentation at Alzheimer's Association International Conference; 2021.
- 21.Zicha S, Bateman RJ, Shaw LM, et al. Comparative analytical performance of multiple plasma Aβ42 and Aβ40 assays and their relationship to amyloid positron emission tomography (PET). Presented at Alzheimer's Association International Conference; 2021.
- 22.Petersen RC, Aisen PS, Beckett LA, et al. Alzheimer's Disease Neuroimaging Initiative (ADNI): clinical characterization. Neurology. 2010;74(3):201-209. [DOI] [PMC free article] [PubMed] [Google Scholar]
- 23.Ellis KA, Bush AI, Darby D, et al. The Australian Imaging, Biomarkers and Lifestyle (AIBL) study of aging: methodology and baseline characteristics of 1112 individuals recruited for a longitudinal study of Alzheimer's disease. Int Psychogeriatr. 2009;21(4):672-687. [DOI] [PubMed] [Google Scholar]
- 24.Janelidze S, Stomrud E, Palmqvist S, et al. Plasma beta-amyloid in Alzheimer's disease and vascular disease. Scientific Rep. 2016;6:26801. [DOI] [PMC free article] [PubMed] [Google Scholar]
- 25.Jack CR Jr, Bennett DA, Blennow K, et al. NIA-AA Research Framework: toward a biological definition of Alzheimer's disease. Alzheimer's Demen. 2018;14(4):535-562. [DOI] [PMC free article] [PubMed] [Google Scholar]
- 26.Alzheimer's Disease Neuroimaging Initiative. PET Acquisition. Available at: adni.loni.usc.edu/methods/pet-analysis-method/pet-analysis/.
- 27.Landau SM, Breault C, Joshi AD, et al. Amyloid-β imaging with Pittsburgh compound B and florbetapir: comparing radiotracers and quantification methods. J Nucl Med. 2013;54(1):70-77. [DOI] [PMC free article] [PubMed] [Google Scholar]
- 28.Alzheimer’s Disease Neuroimaging Initiative. Study Documents. Available at: adni.loni.usc.edu/methods/documents/.
- 29.Clark CM, Schneider JA, Bedell BJ, et al. Use of florbetapir-PET for imaging beta-amyloid pathology. JAMA. 2011;305(3):275-283. [DOI] [PMC free article] [PubMed] [Google Scholar]
- 30.Rowe CC, Ellis KA, Rimajova M, et al. Amyloid imaging results from the Australian Imaging, Biomarkers and Lifestyle (AIBL) study of aging. Neurobiol Aging. 2010;31(8):1275-1283. [DOI] [PubMed] [Google Scholar]
- 31.Vandenberghe R, Van Laere K, Ivanoiu A, et al. 18F-flutemetamol amyloid imaging in Alzheimer disease and mild cognitive impairment: a phase 2 trial. Ann Neurol. 2010;68(3):319-329. [DOI] [PubMed] [Google Scholar]
- 32.Bourgeat P, Dore V, Fripp J, et al. Implementing the Centiloid transformation for (11)C-PiB and beta-amyloid (18)F-PET tracers using CapAIBL. NeuroImage. 2018;183:387-393. [DOI] [PubMed] [Google Scholar]
- 33.Palmqvist S, Zetterberg H, Blennow K, et al. Accuracy of brain amyloid detection in clinical practice using cerebrospinal fluid beta-amyloid 42: a cross-validation study against amyloid positron emission tomography. JAMA Neurol. 2014;71(10):1282-1289. [DOI] [PubMed] [Google Scholar]
- 34.Li QX, Villemagne VL, Doecke JD, et al. Alzheimer's disease normative cerebrospinal fluid biomarkers validated in PET amyloid-beta characterized subjects from the Australian imaging, biomarkers and lifestyle (AIBL) study. J Alzheimer's Dis. 2015;48(1):175-187. [DOI] [PubMed] [Google Scholar]
- 35.Blennow K, Hampel H, Weiner M, Zetterberg H. Cerebrospinal fluid and plasma biomarkers in Alzheimer disease. Nat Rev Neurol. 2010;6(3):131-144. [DOI] [PubMed] [Google Scholar]
- 36.Doecke JD, Ward L, Burnham SC, et al. Elecsys CSF biomarker immunoassays demonstrate concordance with amyloid-PET imaging. Alzheimers Res Ther. 2020;12(1):36. [DOI] [PMC free article] [PubMed] [Google Scholar]
- 37.O'Bryant SE, Gupta V, Henriksen K, et al. Guidelines for the standardization of preanalytic variables for blood-based biomarker studies in Alzheimer's disease research. Alzheimers Dement. 2015;11(5):549-560. [DOI] [PMC free article] [PubMed] [Google Scholar]
- 38.Palmqvist S, Janelidze S, Quiroz YT, et al. Discriminative accuracy of plasma phospho-tau217 for Alzheimer disease vs other neurodegenerative disorders. JAMA. 2020;324(8):772-781. [DOI] [PMC free article] [PubMed] [Google Scholar]
- 39.Mawuenyega KG, Kasten T, Sigurdson W, Bateman RJ. Amyloid-beta isoform metabolism quantitation by stable isotope-labeled kinetics. Anal Biochem. 2013;440(1):56-62. [DOI] [PMC free article] [PubMed] [Google Scholar]
- 40.Pino LK, Searle BC, Bollinger JG, Nunn B, MacLean B, MacCoss MJ. The Skyline ecosystem: informatics for quantitative mass spectrometry proteomics. MA Spectrom Rev. 2020;39(3):229-244. [DOI] [PMC free article] [PubMed] [Google Scholar]
- 41.Jansen WJ, Ossenkoppele R, Knol DL, et al. Prevalence of cerebral amyloid pathology in persons without dementia: a meta-analysis. JAMA. 2015;313(19):1924-1938. [DOI] [PMC free article] [PubMed] [Google Scholar]
- 42.Morris JC, Schindler SE, McCue LM, et al. Assessment of racial disparities in biomarkers for Alzheimer disease. JAMA Neurol. 2019;76(3):264-273. [DOI] [PMC free article] [PubMed] [Google Scholar]
- 43.Schindler SE, Cruchaga C, Joseph A, et al. African Americans have differences in CSF soluble TREM2 and associated genetic variants. Neurol Genet. 2021;7(2):e571. [DOI] [PMC free article] [PubMed] [Google Scholar]
- 44.Sperling RA, Donohue MC, Raman R, et al. Association of factors with elevated amyloid burden in clinically normal older individuals. JAMA Neurol. 2020;77(6):735-745. [DOI] [PMC free article] [PubMed] [Google Scholar]
- 45.Gilmore-Bykovskyi AL, Jin Y, Gleason C, et al. Recruitment and retention of underrepresented populations in Alzheimer's disease research: a systematic review. Alzheimers Dement. 2019;5:751-770. [DOI] [PMC free article] [PubMed] [Google Scholar]
- 46.Blazel MM, Lazar KK, Van Hulle CA, et al. Factors associated with lumbar puncture participation in Alzheimer's disease research. J Alzheimers Dis. 2020;77(4):1559-1567. [DOI] [PMC free article] [PubMed] [Google Scholar]
- 47.Howell JC, Parker MW, Watts KD, Kollhoff A, Tsvetkova DZ, Hu WT. Research lumbar punctures among African Americans and Caucasians: perception predicts experience. Front Aging Neurosci. 2016;8:296. [DOI] [PMC free article] [PubMed] [Google Scholar]
- 48.Gauthreaux K, Bonnett TA, Besser LM, et al. Concordance of clinical Alzheimer diagnosis and neuropathological features at autopsy. J Neuropathol Exp Neurol. 2020;79(5):465-473. [DOI] [PMC free article] [PubMed] [Google Scholar]
- 49.Janelidze S, Mattsson N, Palmqvist S, et al. Plasma P-tau181 in Alzheimer's disease: relationship to other biomarkers, differential diagnosis, neuropathology and longitudinal progression to Alzheimer's dementia. Nat Med. 2020;26(3):379-386. [DOI] [PubMed] [Google Scholar]
- 50.Mattsson-Carlgren N, Janelidze S, Palmqvist S, et al. Longitudinal plasma p-tau217 is increased in early stages of Alzheimer's disease. Brain. 2020;143(11):3234-3241. [DOI] [PMC free article] [PubMed] [Google Scholar]
- 51.Horie K, Barthelemy NR, Sato C, Bateman RJ. CSF tau microtubule binding region identifies tau tangle and clinical stages of Alzheimer's disease. Brain. 2021;144(2):515-527. [DOI] [PMC free article] [PubMed] [Google Scholar]
- 52.Cullen NC, Leuzy A, Palmqvist S, et al. Individualized prognosis of cognitive decline and dementia in mild cognitive impairment based on plasma biomarker combinations. Nat Aging. 2021;1(3):114-123. [DOI] [PubMed] [Google Scholar]
Associated Data
This section collects any data citations, data availability statements, or supplementary materials included in this article.
Data Availability Statement
For ADNI and AIBL, data are available upon approved request. For BioFINDER, anonymized data will be shared by request from a qualified academic investigator for the sole purpose of replicating procedures and results presented in the article and as long as data transfer is in agreement with EU legislation on the general data protection regulation and decisions by the ethical review board of Sweden and Region Skåne, which should be regulated in a material transfer agreement.