

Abstract
Recent studies have reported dysbiotic oral microbiota and tumor-resident bacteria in human head and neck squamous cell carcinoma (HNSCC). We aimed to identify and validate oral microbial signatures in treatment-naïve HNSCC patients compared with healthy control subjects. We confirm earlier reports that the relative abundances of Lactobacillus spp. and Neisseria spp. are elevated and diminished, respectively, in human HNSCC. In parallel, we examined the disease-modifying effects of microbiota in HNSCC, through both antibiotic depletion of microbiota in an induced HNSCC mouse model (4-Nitroquinoline 1-oxide, 4NQO) and reconstitution of tumor-associated microbiota in a germ-free orthotopic mouse model. We demonstrate that depletion of microbiota delays oral tumorigenesis, while microbiota transfer from mice with oral cancer accelerates tumorigenesis. Enrichment of Lactobacillus spp. was also observed in murine HNSCC, and activation of the aryl-hydrocarbon receptor was documented in both murine and human tumors. Together, our findings support the hypothesis that dysbiosis promotes HNSCC development.
Introduction
An estimated 65,000 new cases of head and neck squamous cell carcinoma (HNSCC) are diagnosed in the U.S. each year, with 5-year survival rates below 50%.[1, 2] HNSCC comprises a heterogeneous group of cancers derived from oral cavity, pharynx (naso-, oro-, hypo-), and larynx subsites, that are further classified based on human papillomavirus (HPV) infection status. HPV(−) oral SCC is the most common HNSCC and has worse clinical outcomes than HPV(+) HNSCC (mostly oropharyngeal SCC). The environmental factors most closely linked to HNSCC are smoking, alcohol consumption, and human papillomavirus (HPV) infection.[2] However, current knowledge is insufficient to fully understand the onset, progression, and therapeutic response of HNSCC. Mounting evidence suggests that altered human microbiota are associated with human cancer development and progression. Microorganisms cause an estimated 20% of cancers in humans.[3–5] For decades, epidemiological studies have shown that poor oral hygiene, periodontitis/tooth loss, and infection of Candida species (fungi associated with the precancerous lesion, leukoplakia) are significantly associated with development and/or progression of HNSCC.[6–9] Together, these results suggest that altered oral microbiota may contribute to HNSCC pathogenesis.
Early evidence of association between oral microbiota and HNSCC came from detection of bacteria such as Fusobacterium nucleatum and Prophyromonas gingivalis in tumor tissues through culture-based methods.[10] However, the oral microbiota is complex, encompassing more than 700 bacterial species.[11, 12] The advance of culture-independent technologies leveraging next generation sequencing has revolutionized the study of microbial communities. Microbial profiling of diverse human cancers has been extensively reported, including studies examining microbiota of saliva or oral rinse.[13–18] However, in HNSCC, different oral microbial signatures have been reported.[13–18] More importantly, current reports on human oral microbiota are limited by their descriptive nature, and therefore, little data exist concerning the functional role(s) of altered oral microbiota in HNSCC pathogenesis.
In this study, we aimed to identify and validate oral microbial signatures in saliva of treatment-naïve HNSCC patients vs. control subjects without HNSCC. Microbial signatures were then correlated with clinical pathological and demographic information of patients. Furthermore, we report the first in vivo studies testing the functional role of oral microbiota in HNSCC, through both antibiotic depletion of microbiota in a 4NQO induced HNSCC mouse model and reconstitution of tumor-associated microbiota in a germ-free HNSCC mouse model. The microbiome can act through myriad mechanisms to alter nutritional, physiological, and immunological processes involved in tumorigenesis. Activation of the aryl hydrocarbon receptor (AhR) pathway[19, 20] by xenobiotic chemicals[19, 21–23] and commensal bacterial metabolites[24–27] has emerged as an important modulator of both autoimmune disease and cancers, through its immunosuppressive activity.[19–21, 28, 29] Indeed, elevated AhR mRNA has been documented in 320 primary OSCCs in the TCGA database.[30] AhR responds to microbially generated tryptophan (TRP) metabolites, such as indole species produced by Lactobacillus spp., which were elevated in relative abundance in HNSCC cases. Because altered microbiota may contribute to HNSCC through activation of AhR and promotion of an immunosuppressive tumor microenvironment, we examined AhR expression in human HNSCC tumor specimens and controls and also assessed the effects of antibiotic exposure on AhR expression in a murine model of HNSCC.
Results
Subject characteristics.
We conducted a cross-sectional study of saliva-associated microbiota in previously-archived specimens. As summarized in Table 1, saliva samples were collected from 78 healthy controls (CON), along with treatment-naïve cases of oral squamous cell carcinoma (OSCC, n = 19), oropharyngeal squamous cell carcinoma (OPSCC, n = 15), and laryngeal squamous cell carcinoma (LSCC, n = 7); two additional cases were lacking information on tumor location. Bacteria were profiled in saliva samples by broad-range 16S rRNA gene PCR amplification and Illumina amplicon sequencing of the V1V2 variable region. The Goods coverage index was ≥ 99.9% for all samples, indicating excellent depth of sequence coverage.
Table 1.
Demographic and clinical/pathological information for study participants
| CONTROLS | CASES | ||||
|---|---|---|---|---|---|
| ALL CASES | OSCC | OPSCC | LSCC | ||
| N | 78 | 43 | 19 | 15 | 7 |
| Age (mean±sd; yrs) | 51.9 ±15.9 | 61.2 ±11.4 | 62.0 ±12.8 | 57.3 ±7.3 | 63.6 ±9.1 |
| Male | 28/76 (36.8%) | 28/43 (74.4%) | 11/19 (57.9%) | 13/15 (86.7%) | 6/7 (85.7%) |
| Never Drinker | 26/77 (33.8%) | 10/42 (23.8%) | 7/18 (38.9%) | 2/15 (13.3%) | 0/7 (0.0%) |
| Never Smoker | 44/77 (57.1%) | 8/43 (18.6%) | 3/19 (15.8%) | 3/15 (20.0%) | 1/7 (14.3%) |
| OSCC | na1 | 19/41 (46.3%) | 19/19 (100%) | 0/15 (0%) | 0/7 (0%) |
| OPSCC | na | 15/41 (36.6%) | 0/19 (0%) | 15/15 (100%) | 0/7 (0%) |
| LSCC | na | 7/41 (17.1%) | 0/19 (0%) | 0/15 (0%) | 7/7 (100%) |
| HPV Pos. | na | 13/35 (37.1%) | 3/14 (214%) | 8/14 (57.1%) | 2/6 (33.3%) |
| Node Stage | na | ||||
| N3: 1/41 (2.4%) | N3: 0/17 (0.0%) | N3: 0/15 (0.0%) | N3: 1/7 (14.3%) | ||
| Tumor Size | na | ||||
| T4: 8/40 (20.0%) | T4: 5/17 (29.4%) | T4: 1/15 (6.7%) | T4: 2/7 (28.6%) | ||
na: not applicable
Human HNSCC cases and non-HNSCC controls differ in oral microbiota.
Oral microbiota of both HNSCC cases and controls (Fig. 1) were dominated by diverse bacteria belonging to the phyla Actinobacteria (e.g., Actinomyces), Bacteroidetes (e.g., Prevotella), Firmicutes (e.g., Streptococcus, Veillonella), Fusobacteria (e.g., Leptotrichia), and Proteobacteria (e.g., Neisseria). Initial univariable PERMANOVA tests (Table 2) found significant associations between overall oral microbiota composition (i.e., beta-diversity) and HNSCC occurrence (CON vs HNSCC; p ≤ 1e-06), tumor location (CON vs. OSCC vs. OPSCC vs. LSCC; p ≤ 1e-06), age (stratified by decade; p = 5.1e-05), biological sex (p = 0.077), and smoking history (never vs. ever smokers; p = 8.0e-05). Drinking history was not significant (p = 0.64). Multivariable models indicated that both HNSCC occurrence and tumor location were highly significant (p ≤ 1e-06 for each variable) after adjusting for age, biological sex, and smoking history (Fig. 1A). Age also remained significant in these models (p < 0.05), while biological sex (p = 0.96) and smoking history (p = 0.26) did not reach significance. Finally, among HNSCC cases, no associations were noted between HPV status (p = 0.50), node stage (p = 0.55), or tumor size (p = 0.40) with beta-diversity (Table 2). Consequently, the subsequent analyses were adjusted for age but not for other variables such as HPV status, biological sex, or smoking history.
Figure 1. Oral microbiotas differ between HNSCC cases and non-HNSCC controls.
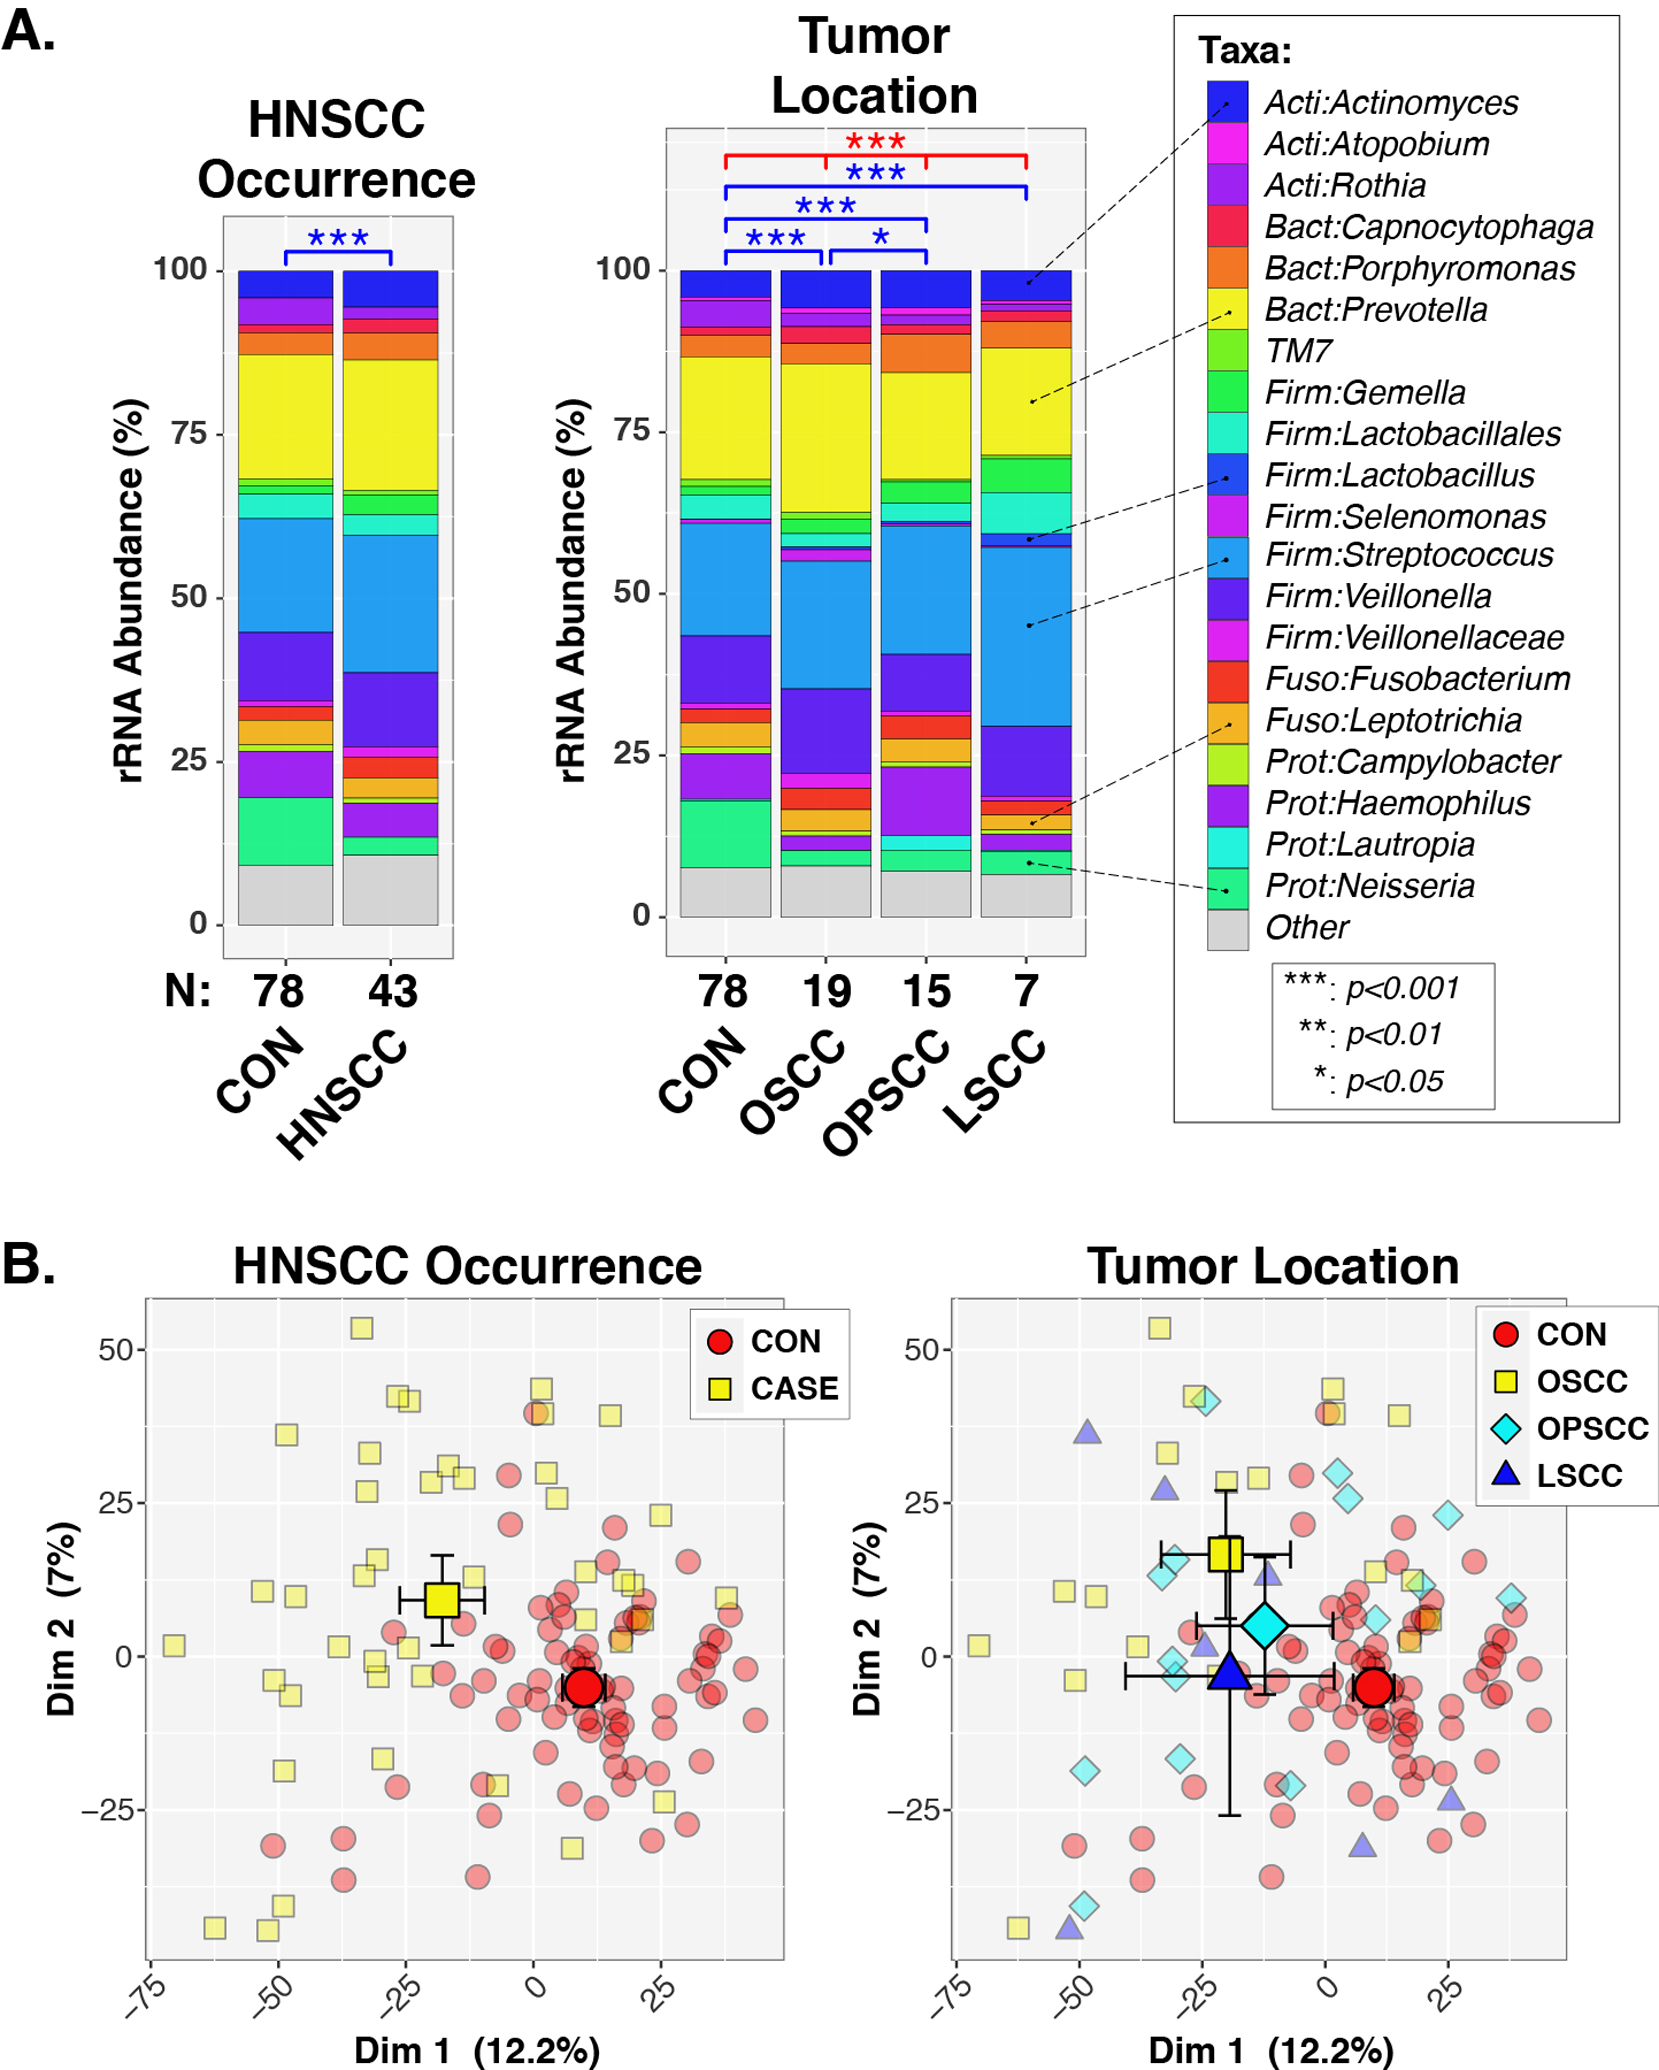
Panel A. Percent relative abundance (%RA) of genus-level taxa, stratified by HNSCC occurrence and tumor location. Taxa with %RA less than 1% were collapsed into the “Other” category. Results of PERMANOVA tests are summarized above each plot for tests across all groups (red lines/symbols) and pairwise tests (blue lines/symbols). Panel B. Principal coordinates analysis. Individual subjects are indicated by smaller symbols (circles/squares/diamonds/triangles), with group affiliations designated by symbol shapes and color-coding. Mean PC values for each group along the x- and y-axes are indicated by larger shapes, with 95% confidence intervals about the means marked by whiskers.
Table 2.
Associations (PERMANOVA tests) between clinical variables and oral microbiota composition in treatment naïve HNSCC cases and controls
| ALL SUBJECTS n = 121 |
CONTROLS n = 78 |
CASES1 | |||||
|---|---|---|---|---|---|---|---|
| ALL n = 43 |
OSCC n = 19 |
OPSCC n = 15 |
LSCC n = 7 |
NOTES | |||
| HNSCC STATUS | 1.00E-062 | na3 | na | 1.00E-06 | 5.00E-06 | 0.00029 | CONTROL vs HNSCC |
| CANCER LOCATION | 1.00E-06 | na | 0.11 | na | na | na | CON, OSCC, OPSCC, LSCC |
| AGE | 5.10E-05 | 0.058 | 0.096 | 0.037 | 0.47 | 0.019 | Categorized by Decade |
| SEX | 0.077 | 0.59 | 0.46 | 0.099 | 0.78 | 0.71 | Female, Male |
| DRINKING HISTORY | 0.64 | 0.087 | 0.20 | 0.31 | 0.86 | na4 | Never, Ever Drinker |
| SMOKING HISTORY | 8.00E-05 | 0.26 | 0.71 | 0.72 | 0.69 | 0.86 | Never, Ever Smoker |
| HPV | na | na | 0.50 | 0.54 | 0.62 | 0.40 | No, Yes |
| NODE STAGE | na | na | 0.55 | 0.053 | 0.47 | 0.81 | N0, N1, N2, N3 |
| TUMOR SIZE | na | na | 0.40 | 0.70 | 0.072 | 0.52 | T1, T2, T3, T4 |
OSCC: oropharyngeal squamous cell carcinoma (SCC). OPSCC: oropharyngeal SCC. LSCC: laryngeal SCC
P-values are from univariable PERMANOVA tests
na: not applicable
All LSCC subjects were Ever Drinkers
Analysis of HNSCC cases stratified by tumor location revealed significant differences in beta-diversity between controls and each tumor location (p < 0.001; Fig. 1A). In contrast, only OSCC and OPSCC groups differed (p = 0.050) in pairwise comparisons of the three tumor sites. When HPV, tumor stage, and node stage were analyzed stratified by tumor location, the only significant finding was that OSCC cases differed in beta-diversity by node stage (unadjusted p = 0.053; age adjusted p = 0.034; Table 2).
In support of the PERMANOVA results, principal coordinates analysis (PCoA) indicated that controls clustered separately from cases, regardless of tumor location (Fig. 1B). Qualitatively, the PCoA plots indicated a greater spread of datapoints across the cases, compared to controls. Consequently, we next tested the multivariate dispersion (variance) of the microbiota data. Case and control groups differed significantly in intra-group dispersion (BETADISPER p < 0.001), with cases exhibiting greater heterogeneity (i.e., elevated beta-diversity) than cases (Suppl. Fig. 1).
Among indices of alpha-diversity, ANOVA results indicated that evenness and Shannon diversity were significantly decreased in cases, compared with controls, while no differences were observed in richness (Fig. 2). Similar to the heterogeneity observed in beta-diversity, we noted significantly greater variability in evenness (p = 0.00088) and Shannon diversity (p =0.0054) scores of cases compared to controls (evaluated by Levene’s test). When cases were stratified by tumor location, only LSCC and controls differed significantly in evenness and Shannon diversity. Although OSCC and OPSCC cases exhibited reduced diversity compared with controls, the differences did not reach statistical significance (Fig. 2).
Figure 2. Alpha-diversity indices differ between HNSCC cases and non-HNSCC controls.

Boxplots show distributions of alpha-diversity indices by HNSCC occurrence (top panels) and tumor location (bottom panels). Results of ANOVA tests are summarized above each plot for tests across all groups (red lines/symbols) and pairwise tests (blue lines/symbols).
Individual taxa differ by HNSCC occurrence and tumor location.
To identify individual taxa differing in relative abundance between subject groups, we used the ANOVA-like differential expression (ALDEx2) R package,[31, 32] which considers the compositional nature of microbiota datasets. Of the 104 genus-level taxa included in the microbiome analysis, 20 differed significantly in relative abundance (FDR ≤0.05; Fold-change ≥2) between HNSCC cases and controls (Fig. 3A). Eleven of these taxa were more abundant in cases than in controls, with Lactobacillus, Ochrobactrum, and Parvimonas exhibiting the largest effect sizes (Fig. 3B). Eight taxa, including Neisseria, Phyllobacterium, and unclassified Neisseriaceae were of greater relative abundance in cases compared to controls (Fig. 3B). We confirmed these results using three complementary approaches: sparse partial least squares discriminant analysis (sPLS-DA[33, 34]), logistic regression with lasso (glmnet[35]), and random forest classification.[36, 37] Substantial overlap was observed between the sets of discriminatory taxa identified by these analyses, as well as the results of ALDEx2 (Fig. 3C, Suppl Fig. 2). Overall, these four analytic methods identified three taxa with increased abundance in cases (Lactobacillus, Mesorhizobium, and Ochrobactrum) and three taxa with reduced abundances in cases (Neisseria, Lautropia, and Phyllobacterium).
Figure 3. Differentially abundant taxa between HNSCC cases and non-HNSCC controls.
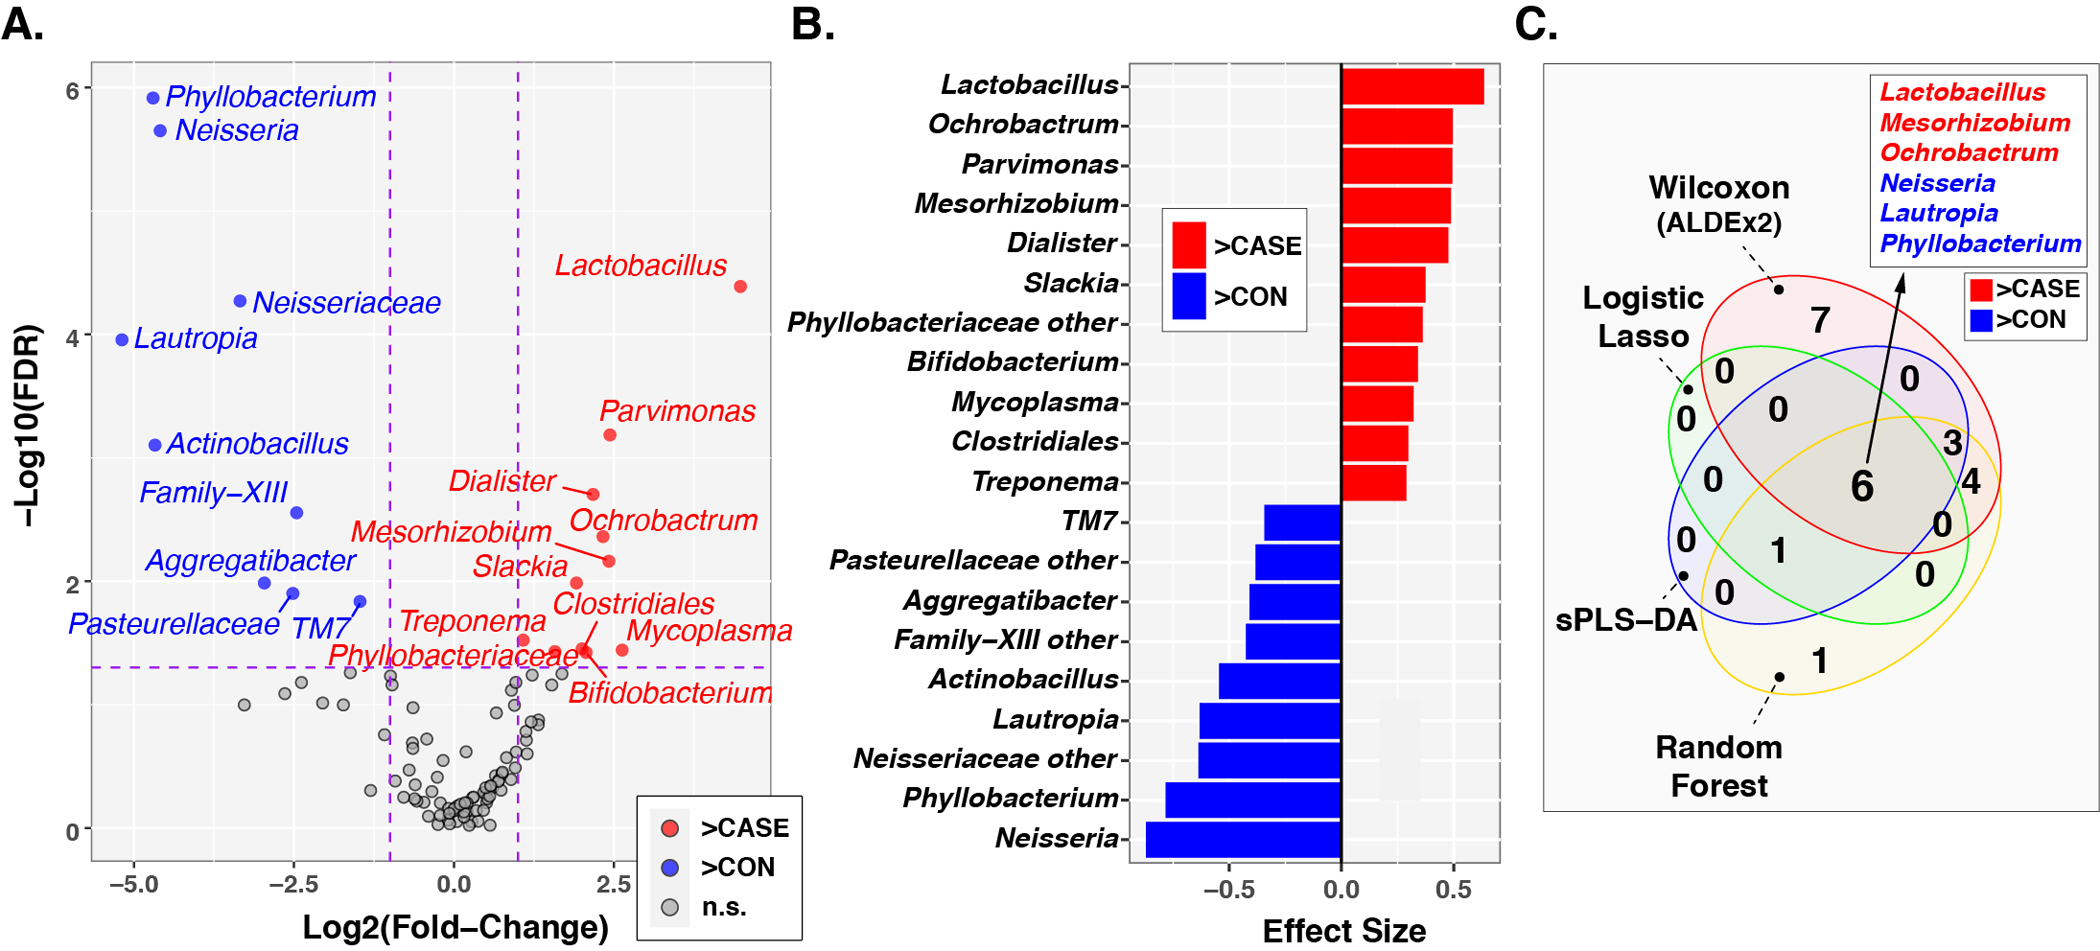
Panel A. Volcano plot of fold-change (FC; Log2 transformed) vs FDR-corrected p-values (-Log10 transformed) ascertained by ALDEx2 analysis Vertical and horizontal dashed lines represent cutoffs of FC ≥2 and FDR-corrected p-value ≤0.05, respectively. Panel B. ALDEx2-calculated effect sizes of taxa meeting FC and p-value cutoffs. Panel C. Overlap in influential taxa identified through multiple analytic methods. In all three panels, taxa enriched in cases compared to controls are highlighted in red with FC and effect sizes greater than zero, while taxa enriched in controls are highlighted in blue with FC and effect sizes less than zero.
Among OSCC and OPSCS cases, 20 and 4 taxa, respectively, were significantly altered in relative abundance (FDR ≤0.05; Fold-change ≥2) compared with controls (Suppl. Figs. 3 and 4). Although no taxa met the criterion of FDR ≤0.05 for LSCC vs. controls, Lactobacillus, Neisseria, Phyllobacterium, and unclassified Neisseriaceae all had nominal p-values ≤0.05 (Suppl. Figs. 3 and 4). Using a reduced stringency p-value cutoff of ≤0.05, 4 taxa were differentially abundant in all three tumor locations compared with controls: Lactobacillus, Neisseria, Phyllobacterium, and unclassified Neisseriaceae (Fig. 4).
Figure 4. Overlap in taxa differentially abundant between non-HNSCC controls and different tumor locations.

Taxa that were differentially abundant between each of the three tumor locations (i.e., OSCC, OPSCC, LSCC) and controls were identified through ALDEx2 analysis. The Venn diagram shows the overlap in taxa identified in the three analyses, including four taxa that were found in common (identified in the box). “Neisseriaceae other” represents taxa that could not be classified to the genus-level. Taxa enriched in cases compared to controls are colored red, while those enriched in controls are colored blue.
Consistent with the relatively small differences in beta-diversity observed between tumor locations, few taxa differed significantly (nominal p-values ≤0.05) in abundance between tumor locations (Suppl. Fig. 5). Nevertheless, sPLS-DA was able to discriminate between tumor locations on the basis of oral microbiota (Suppl Fig. 6). The first discriminant axis separated LSCC from OSCC and OPSCC cases, while the second and third axes further separated OPSCC from OSCC and LSCC cases. The relative abundances of numerous taxa were correlated with values along these axes. For instance, Acinetobacter was a key discriminator of LSCC cases along axis one. Similarly, Scardovia, Haemophilus, and Lautropia had the highest loadings along axis, separating OPSCC from the other tumor locations.
Species-level differences in oral microbiota among HNSCC cases and controls.
In concordance with our results, previous studies have identified enriched Lactobacillus[13, 14, 16, 38, 39] and diminished Neisseria[14, 15, 39, 40] as common changes in saliva or tissue of HNSCC patients compared with controls. Consequently, all 16S rRNA gene sequences that were classified as Lactobacillus or Neisseria were further differentiated into species-level clusters, as detailed in the Methods section. Multiple Lactobacillus species were of significantly greater relative abundance in HNSCC cases, including the L. johnsonii|gasseri complex, L. fermentum, L. rhamnosus, and L. vaginalis (Fig. 5). Conversely, N. subflava, N. oralis, and N. mucosa were elevated in relative abundance in the control group, compared to HNSCC cases. The relative abundances of L. johnsonii|gasseri and N. subflava were consistently observed to be elevated or diminished, respectively, in all three tumor locations compared to controls (Suppl. Fig. 7).
Figure 5. Differential abundance of Lactobacillus and Neisseria species in HNSCC cases and controls.
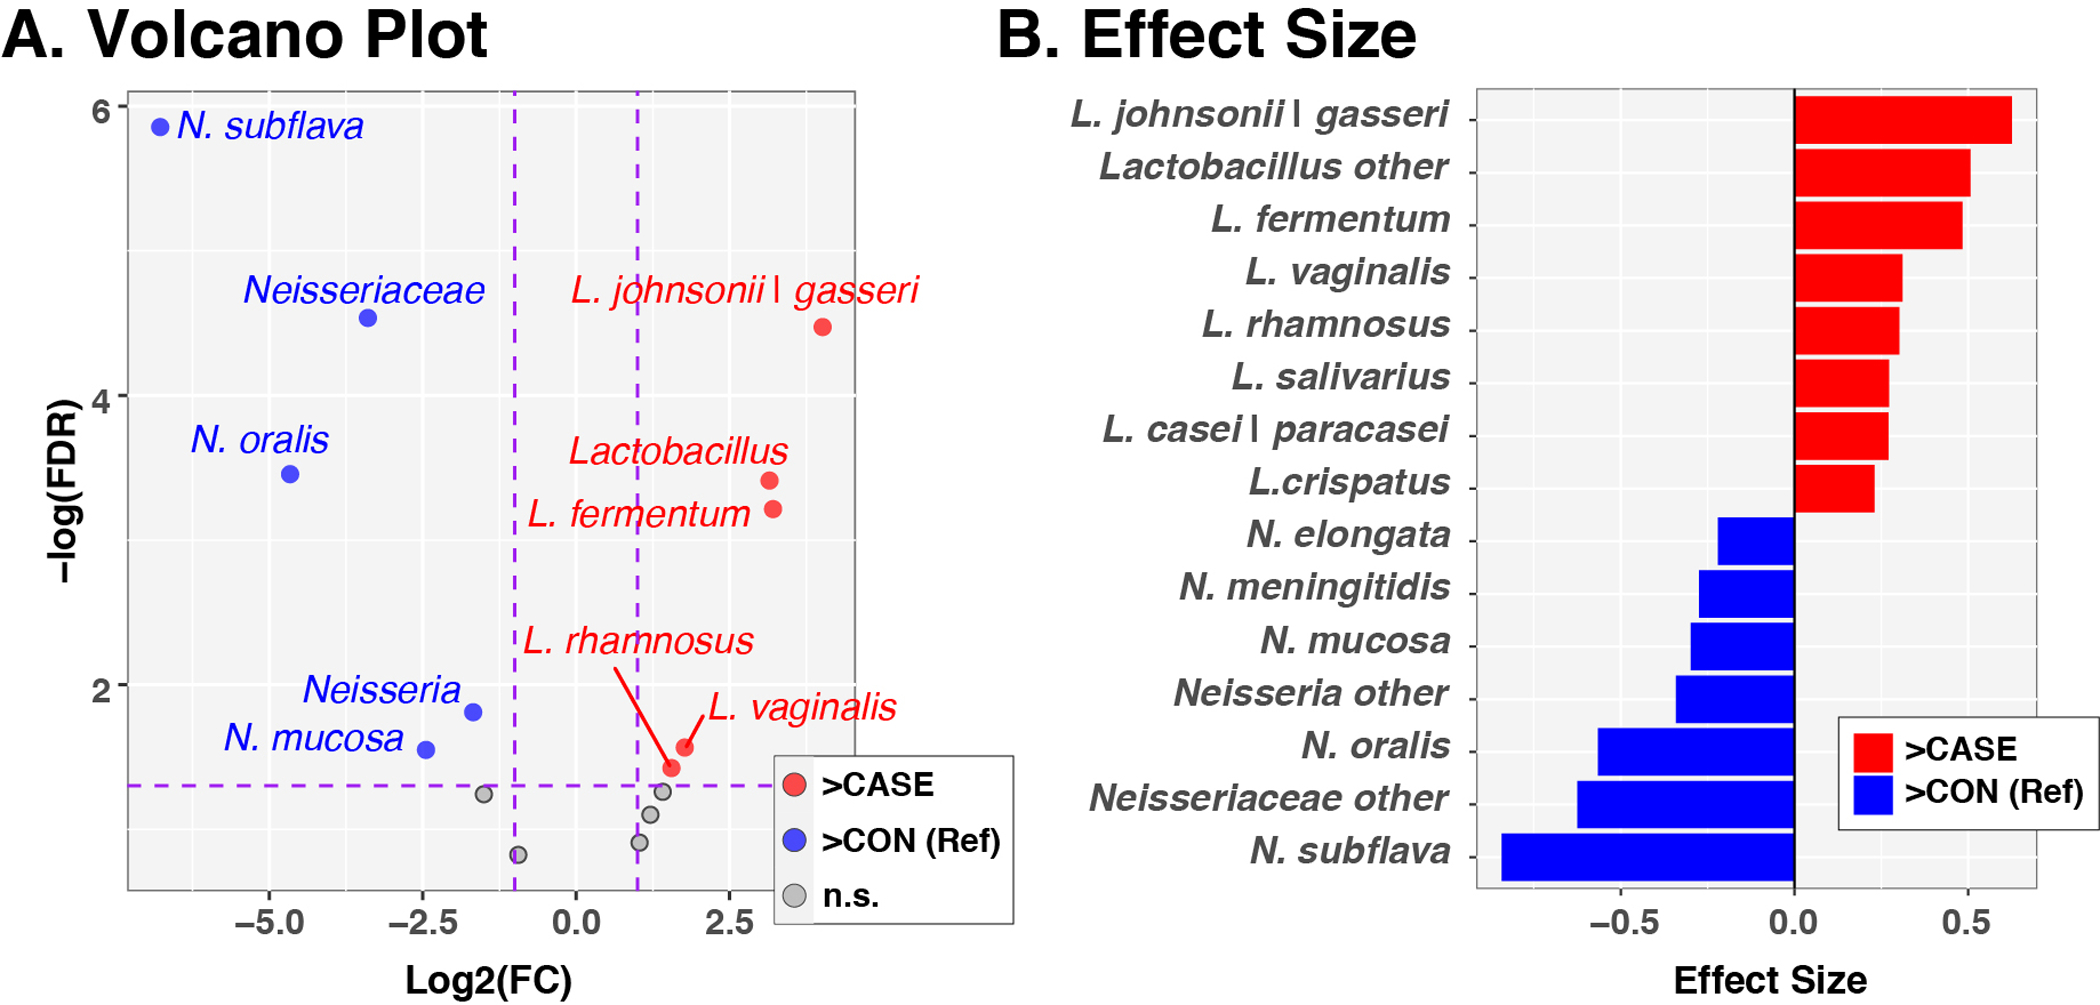
Panel A. Volcano plot of fold-change (FC; Log2 transformed) vs FDR-corrected p-values (-Log10 transformed) ascertained by ALDEx2 analysis Horizontal and vertical dashed lines represent cutoffs of FC ≥2 and FDR-corrected p-value ≤0.05, respectively. Panel B. ALDEx2-calculated effect sizes of taxa meeting FC and p-value cutoffs. In both panels, the control group served as the reference, such that taxa enriched in controls are assigned FC and effect sizes <0 and are displayed to the left and colored blue. Taxa enriched in cases have FC and effect sizes >0 and are displayed to the right and colored red.
Antibiotic treatment significantly reduces tumor development in mice.
To determine the functional consequences of the microbiome in HNSCC pathogenesis, we utilized a 4NQO-induced oral SCC (OSCC) mouse model (N=12), which produces a temporal pathogenesis that histopathologically and molecularly mimics human tobacco-related HPV(−) OSCC (Fig. 6A). We treated 4NQO-induced HNSCC mice (N=12) with an antibiotic (Abx) cocktail from 6–38 wks of age, when mice were euthanized. Reduced bacterial loads were confirmed by 16S bacteria PCR (Fig. 6B). Tumor formation and size were significantly reduced in the tongues of Abx-treated mice (Figs. 6C, D) and confirmed by histologic analysis of tumor sections (Fig. 6E). These results highlight the critical requirement of microbiota in HNSCC pathogenesis and allows for the interrogation of microbiome function in both the onset and promotion of HNSCC.
Fig. 6. Reduced tongue tumor formation and size upon antibiotic (Abx) treatment.
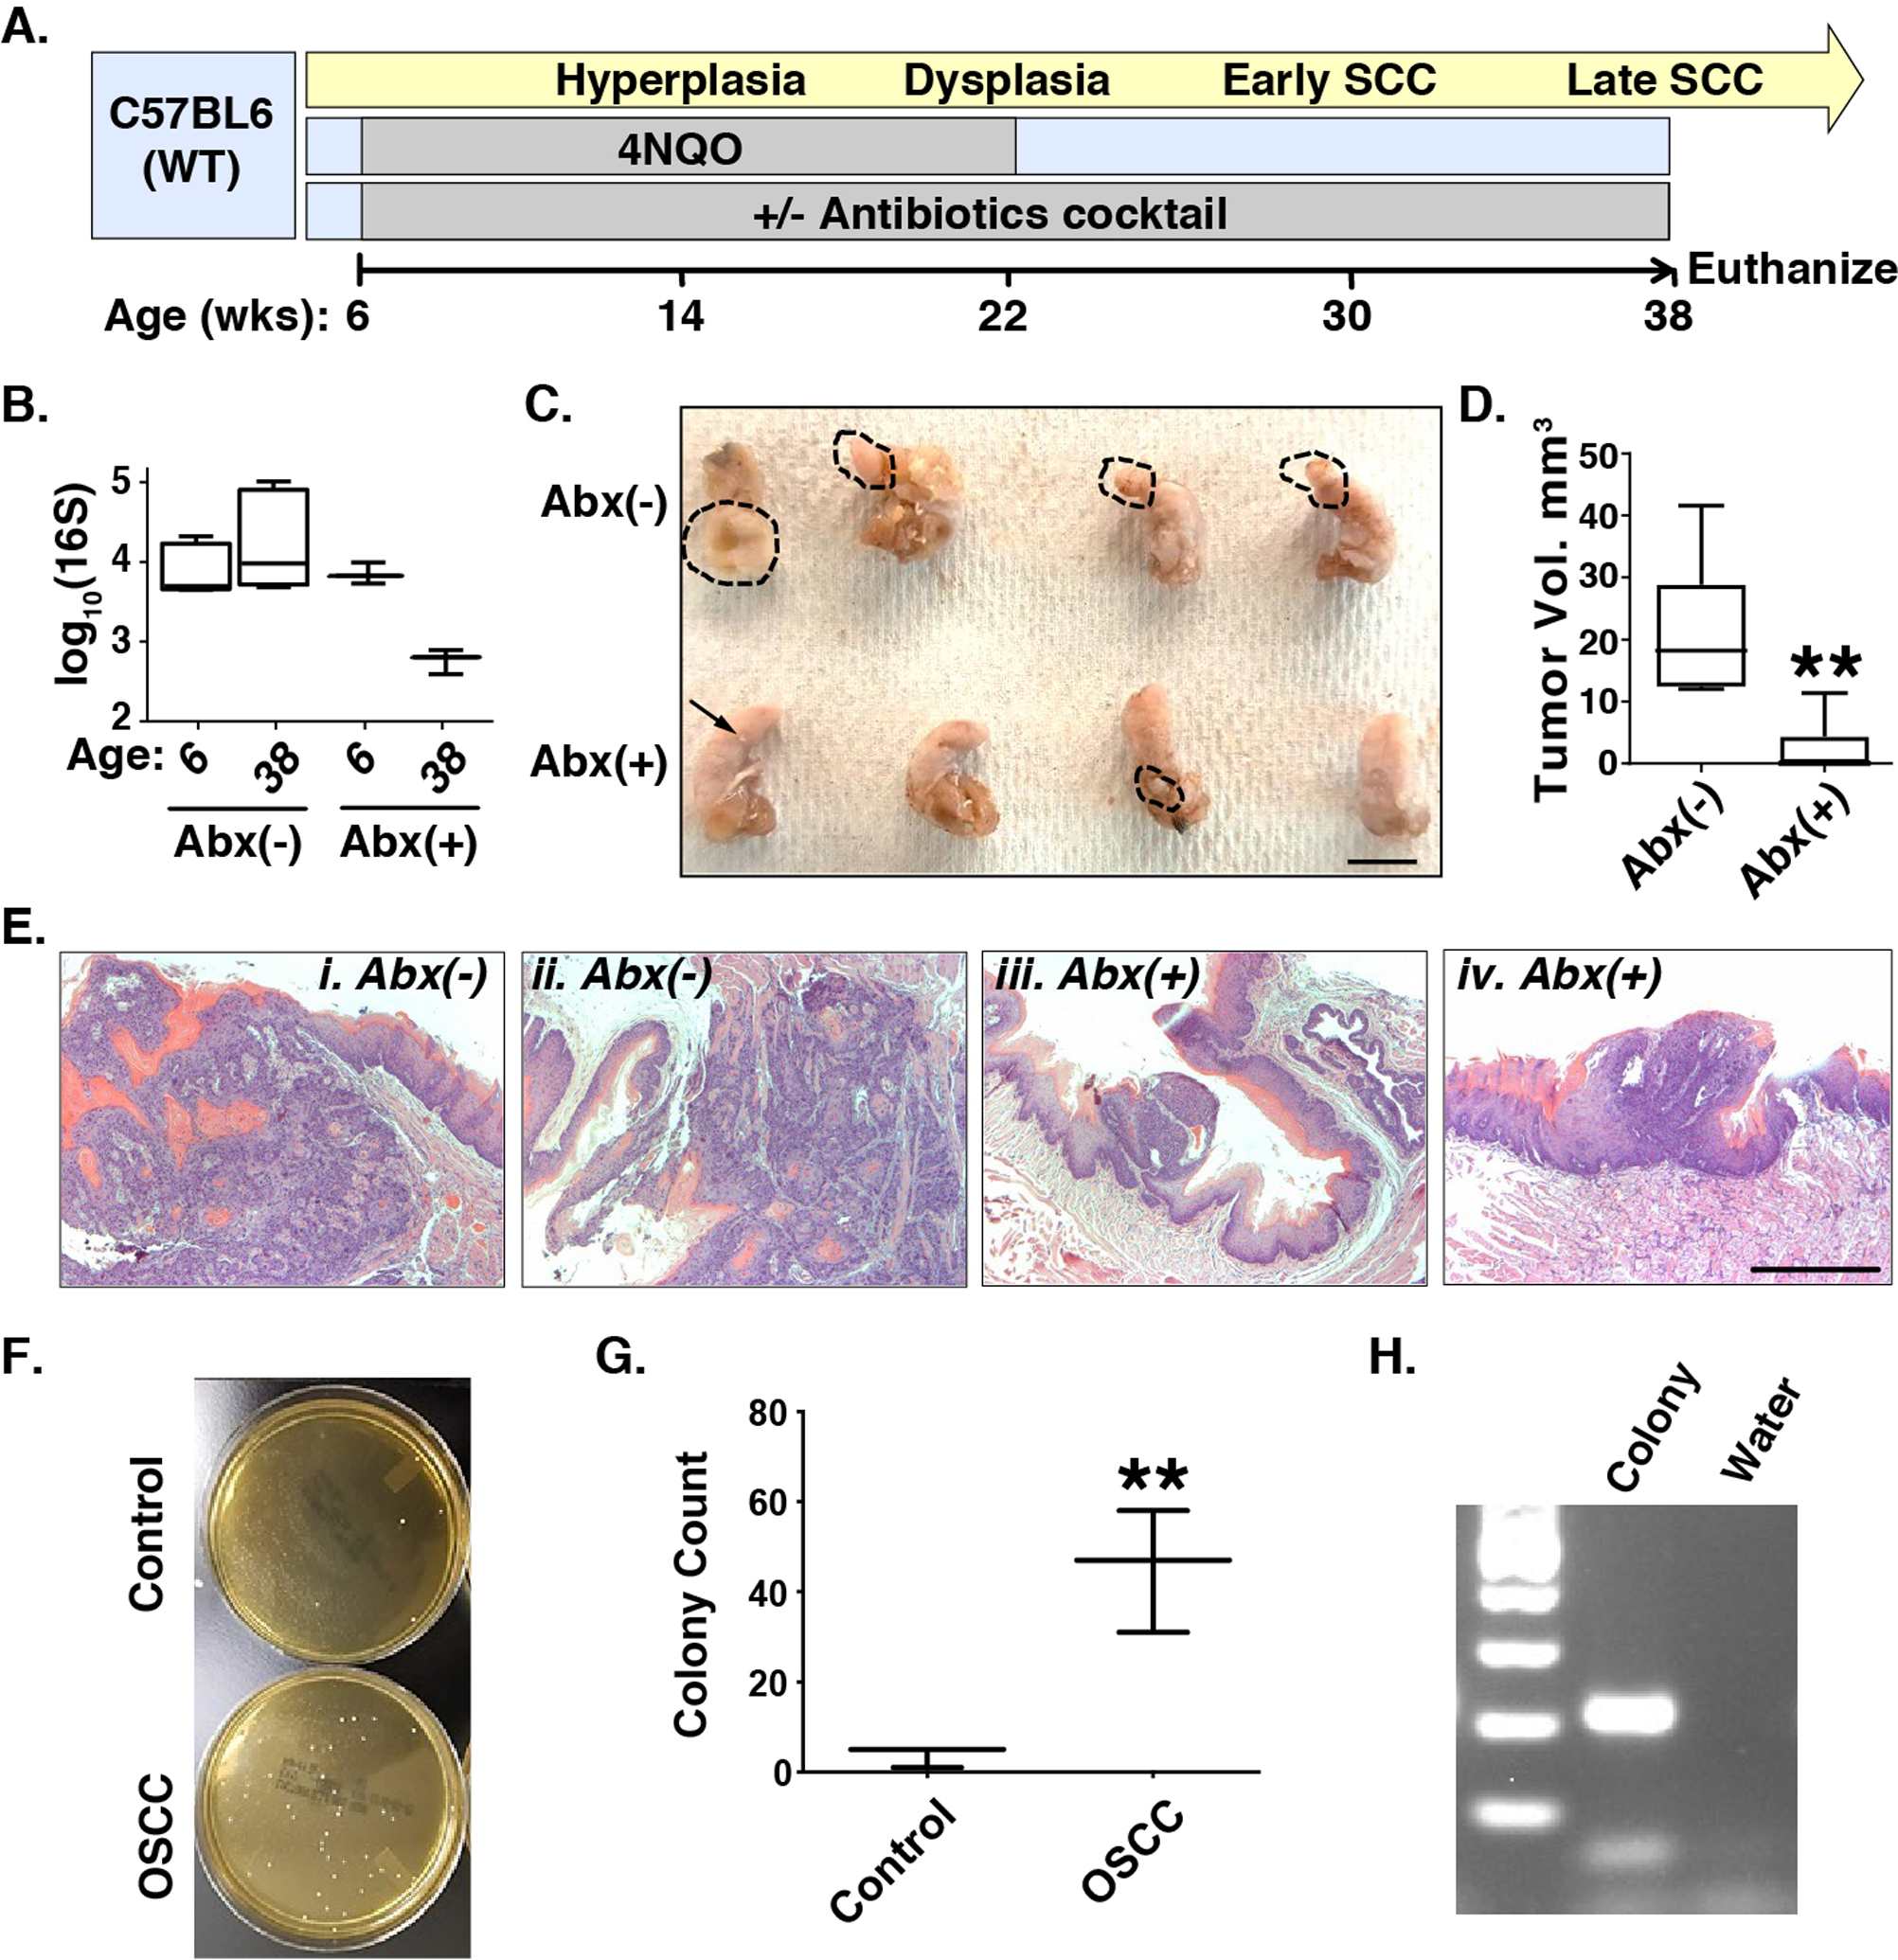
Panel A. Timeline of 4NQO-OSCC pathogenesis and Abx treatment. Panel B. 16S bacterial qPCR, Abx: antibiotics. Panels C and D. Ablation of microbiota by antibiotics (Abx) in the 4NQO model diminishes the size of tongue tumors. Dashed lines denote tumor margins. Scale bar: 10mm. **: p<0.01 for Student’s t-test. Panel E. H&E staining of tongue tumors without (i, ii) or with (iii, iv) Abx reveals decreased size and depth of invasion in Abx-treated mice. Scale bar: 50 μm. Panels F, G, H. Enrichment of lactic acid bacteria in saliva of 4NQO-OSCC mice compared to controls. F. Representative MRS agar plates showing more colonies in the OSCC saliva. G. Quantification of colonies (N=3). **: p<0.01 for Student’s t-test. Plot summarizes mean±s.d. values for each group. H. Representative figure of MRS colony validation using Lactobacillus PCR.
To test if the 4NQO-mouse model reflects the dysbiosis characteristic of human HNSCC, we plated saliva collected from 4NQO-tumor-bearing mice and non-tumor bearing, control mice on media selective for lactic acid bacteria (MRS). Colonies were more numerous in the tumor-bearing group compared to water controls (p = 0.0063; Fig. 6F, G). PCR validated these colonies as Lactobacillus spp. (Fig. 6H). Thus, the 4NQO-OSCC mouse model recapitulated a key microbiological feature discovered in our survey of human HNSCC.
Potential activation of AhR in human and murine HNSCC.
As introduced above, microbial Tryptophan metabolites produced by Lactobacillus and other gut microbes, can influence systemic immunity though AhR-mediated signaling. To examine AhR expression in HNSCC, we performed immunohistochemistry on 47 human HNSCC tumors (19 OSCCs, 18 OPSCCs, and 10 LSCCs) and 41 normal oral mucosa specimens. Activation of AhR (nuclear staining) was evident in 70.2% (33/47) of tumors (Fig. 7A), but only 12.2% (5/41) of controls (Chi-squared p<0.05). Positive cases were found in 73.7% (14/19) of OSCC, 72.2% (13/18) of OPSCC, and 60.0% (6/10) of LSCC. Although moderately higher in OSCC and OPSCC than in LSCC, the difference did not reach statistical significance. Similarly, activated AhR was observed in five out six 4NQO-OSCCs, but was significantly diminished in the four out of five tumors developed upon Abx treatment (Fig. 7B), suggesting that microbiota activate AhR (Chi-squared p<0.05).
Fig. 7. Aryl-hydrocarbon Receptor (AhR) expression in human and murine HNSCC.
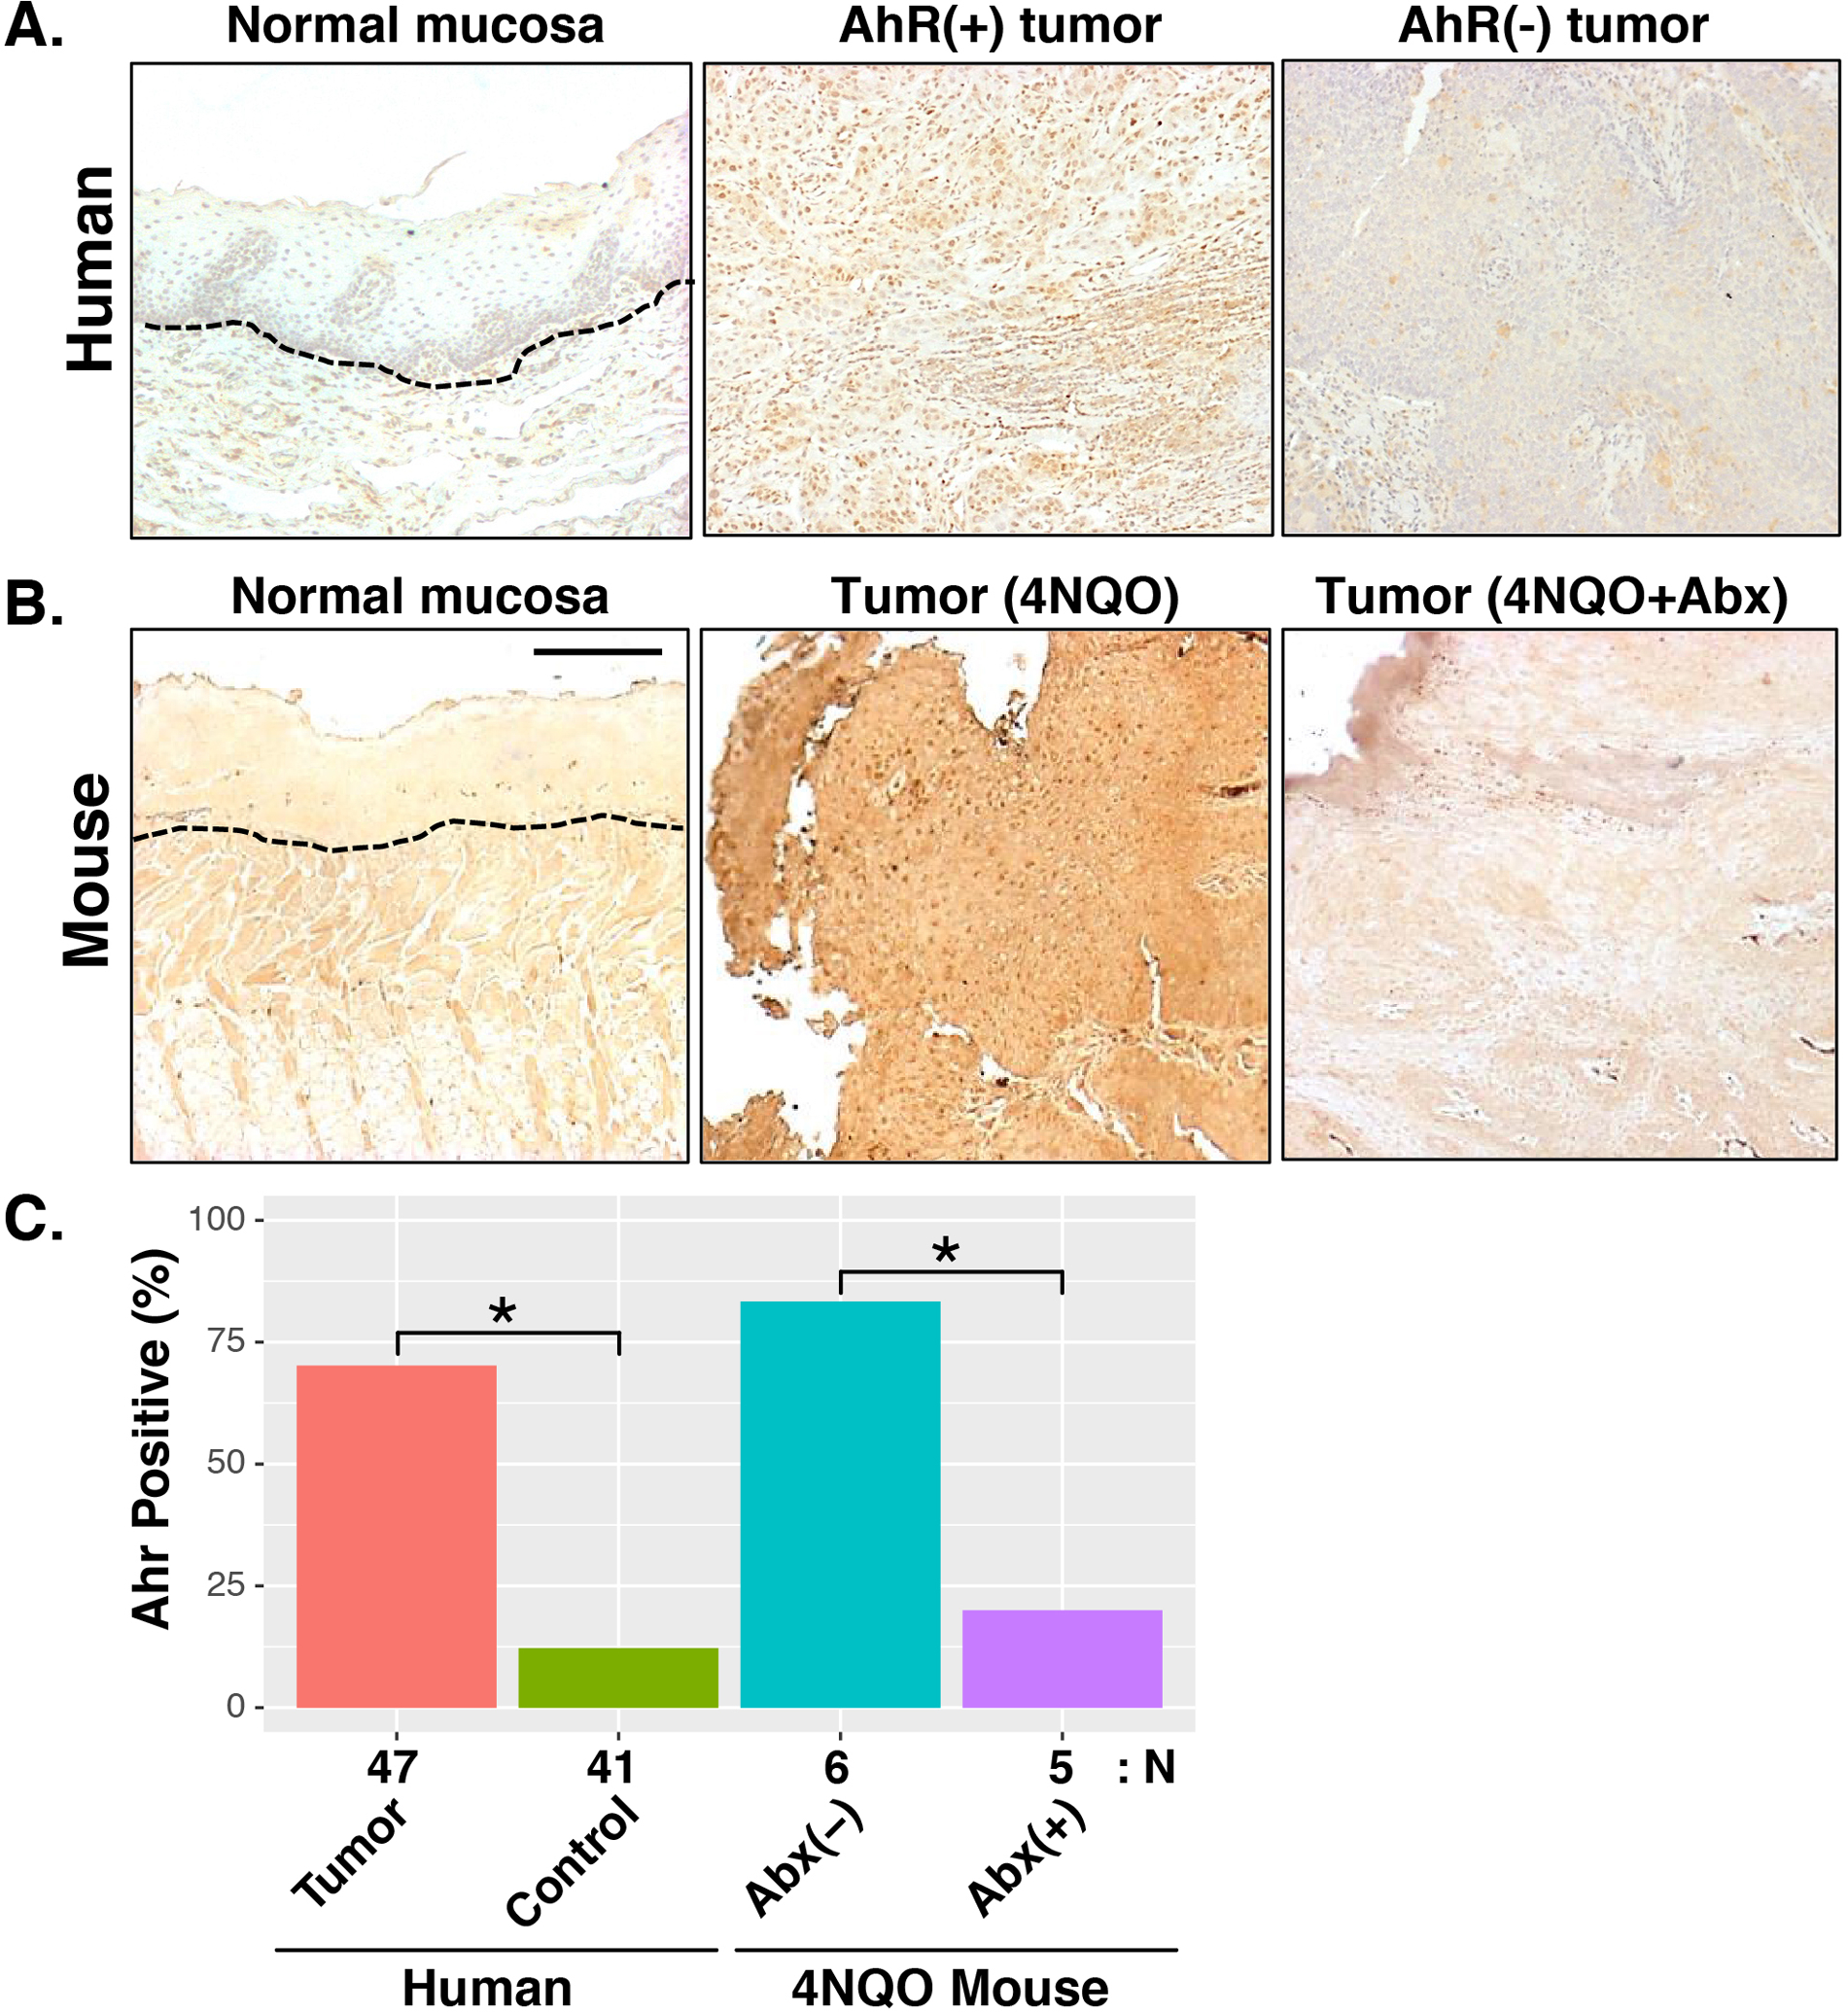
Immunohistochemical staining of AhR in human HNSCC (Panel A) and murine 4NQO-OSCC (Panel B) tumor tissues. Nuclear staining (dark brown) denotes AhR activation. Dashed lines delineate epithelial and stromal boundaries. Scale bar: 50 μm. Panel C. Summary of AhR staining results. Ahr positivity represents the percentage of tumors (human or murine) with detectable AhR staining. The number of specimens analyzed for each group is shown below the barchart. *: p<0.05 for Chi-squared test.
Tumor development is reduced in germ-free mice but promoted through reconstitution of OSCC-associated microbiota.
To further evaluate whether altered microbiota actively contribute to HNSCC pathogenesis, we compared HNSCC development and progression between germ-free (GF) mice and special pathogen-free (SPF). To shorten the time requirement for tumor development in the GF facility, we used a tongue SCC orthotopical mouse model by injection of murine tongue SCC cell line, Cu110, into the tongues of syngeneic C57BL6 mice.[41, 42] The first experiment included 8 SPF and 8 GF mice (each group included 4 males and 4 females). Equal numbers of Cu110 cells were injected on the same day into both GF and SPF mice. GF mice had a significantly prolonged survival compared with SPF mice (median survival of 17.5 vs. 8.5 days, p < 0.0001; Fig. 8A). In a second experiment, SPF (N = 10, 5 male, 5 female) and GF (N = 10, 5 male, 5 female) mice were again injected with equal numbers of Cu110 cells, but mice were euthanized on the same day (4 weeks post-injection) to compare tumor sizes. Tumors were visibly larger (Fig. 8B) and of significantly larger volume (Fig. 8C) in the SPF compared with the GF group.
Fig. 8. Effects of microbiome on tongue tumor development in germ-free and reconstitution conditions.
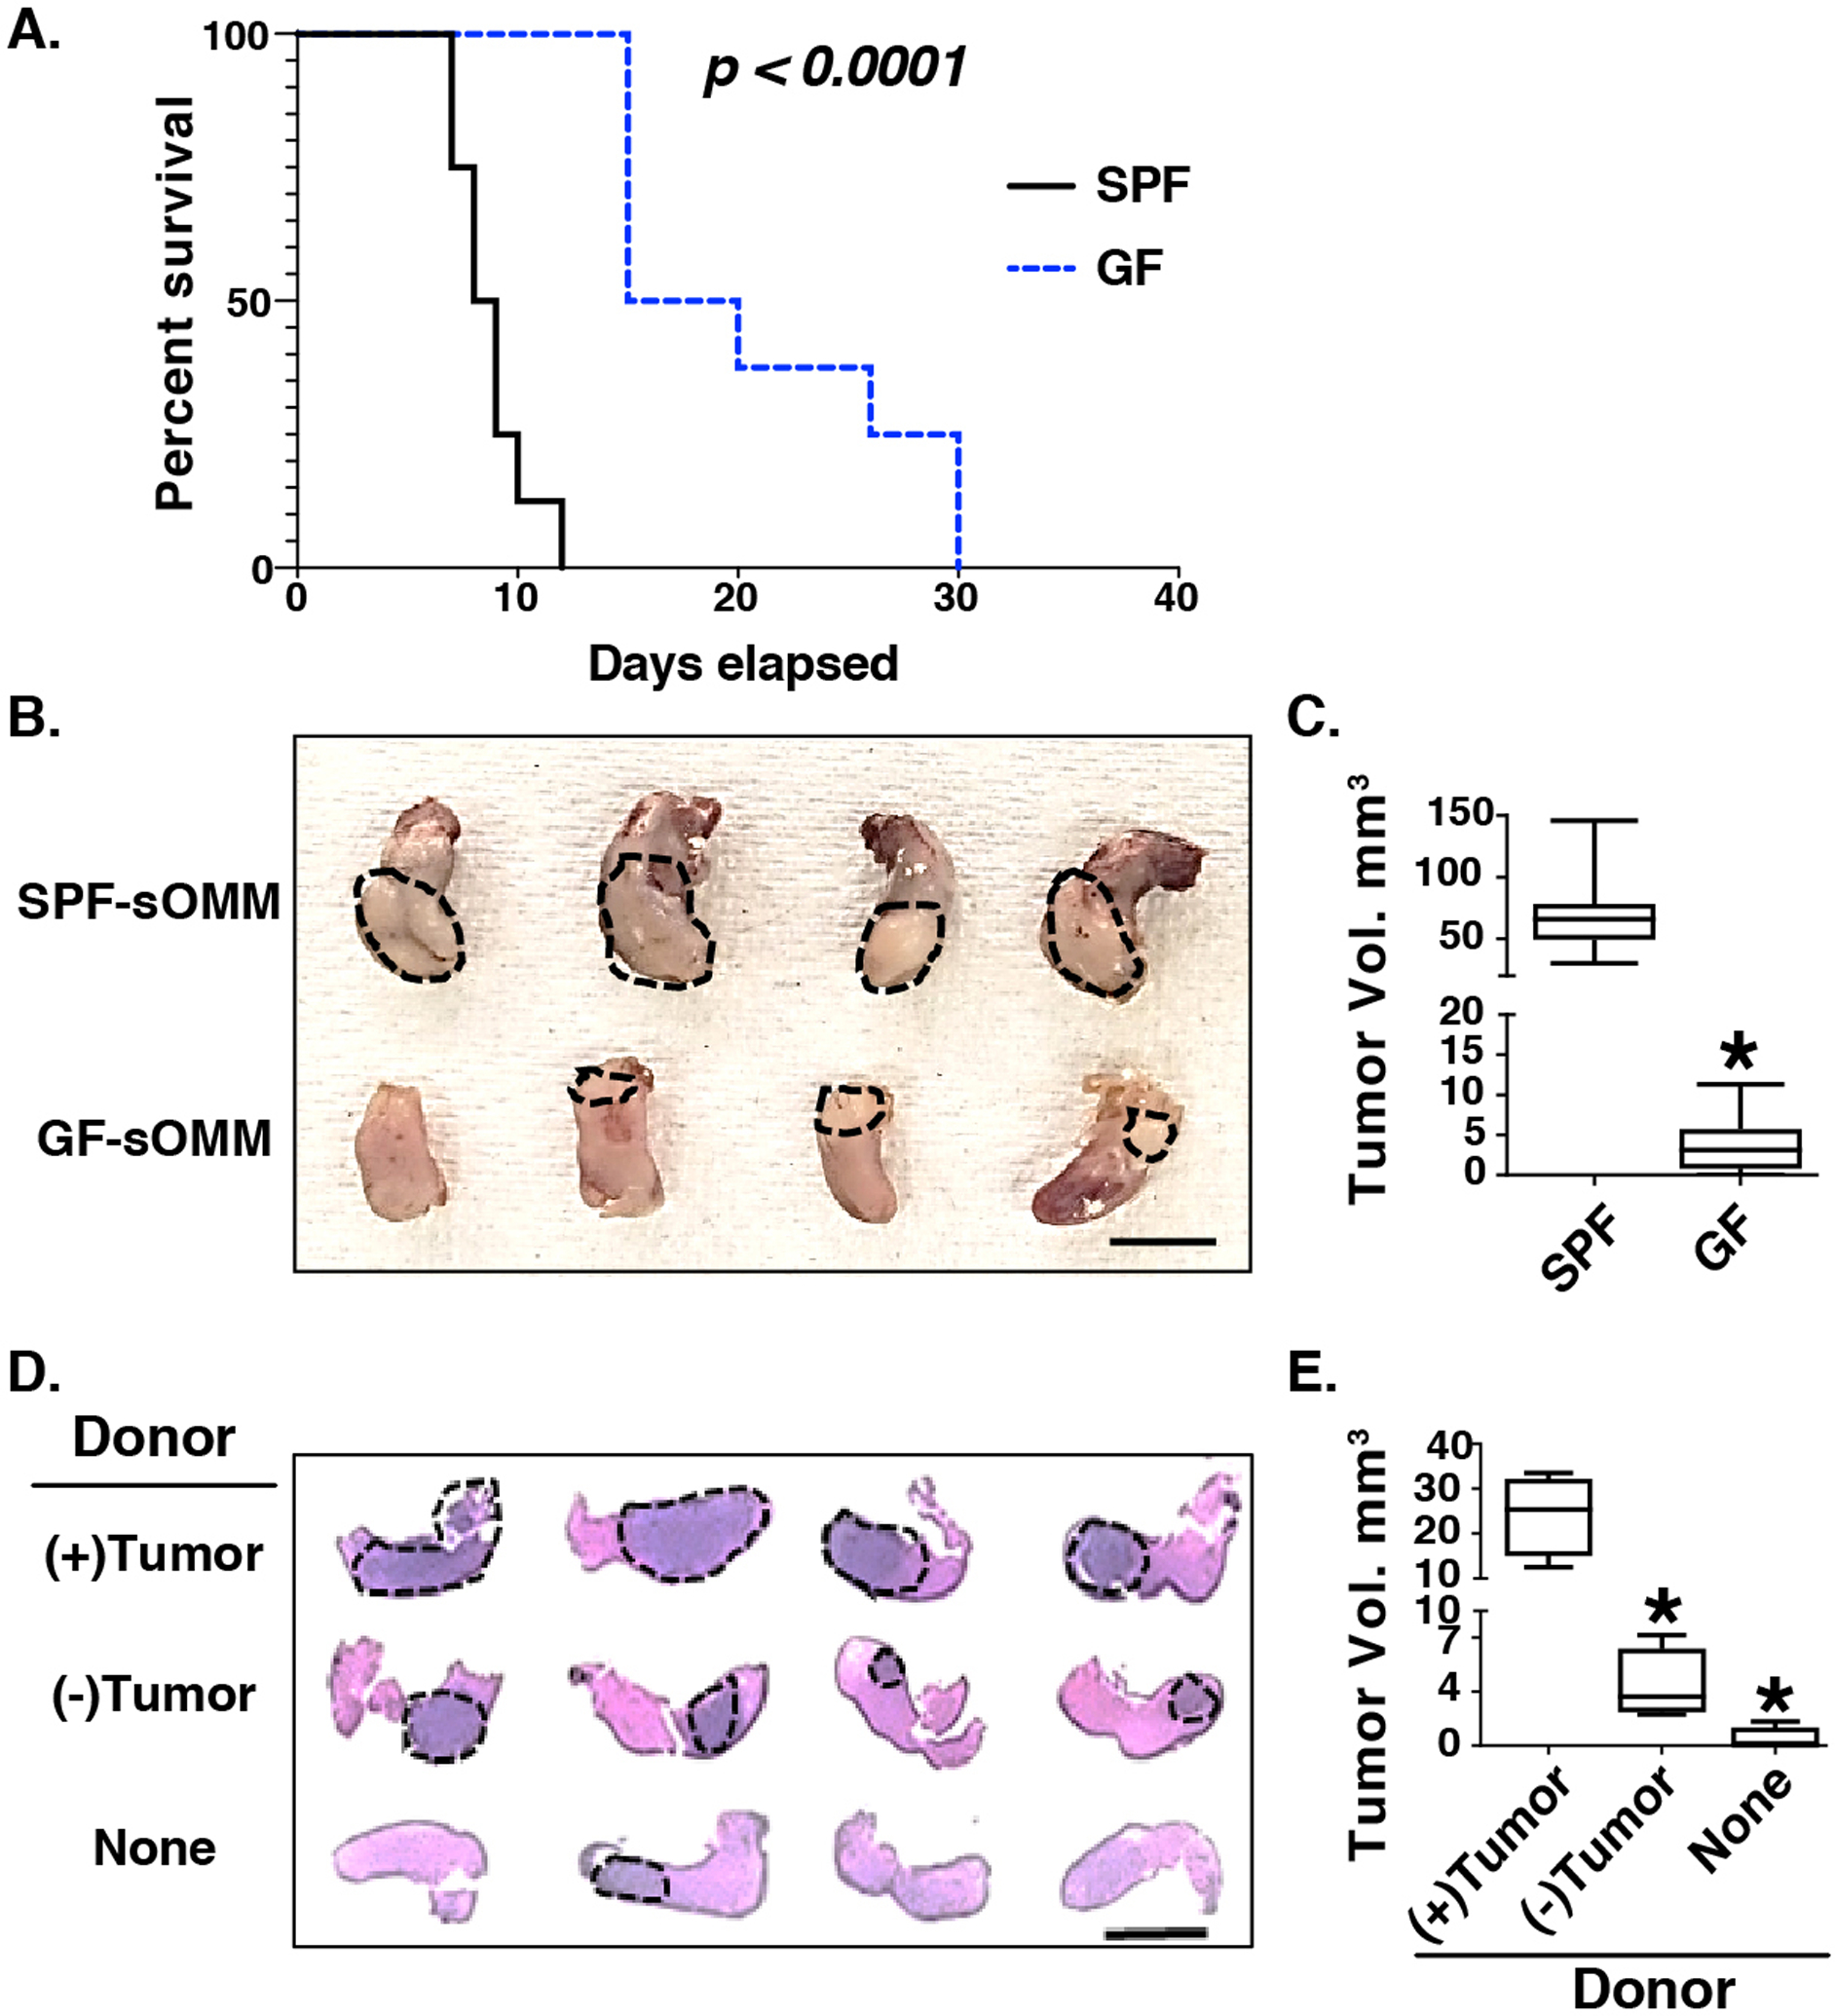
Panel A. Kaplan-Meier survival curve of SPF and GF mice receiving tongue injection of the murine Cu110 HNSCC cell line (n = 8 for each group). SPF: specific pathogen free, GF: germ free. P-value determined by Mantel-Cox test. Panel B. Gross pathology of tongue tumors in syngeneic orthotopic mouse model (sOMM) hosted in SPF and GF conditions (n = 10 for each group). Dotted circles and arrows indicate visible tongue tumors. Scale bar: 10 mm. Panel C. Quantification of tongue tumor volumes from the experiment in panel B. *: p<0.05 for Student’s t-test in comparison to SPF group. Panel D. H&E staining of tongue tumor development in GF mice reconstituted from tumor-bearing donor mice (upper row of tissues, n = 4 donor/recipient pairs) compared with reconstitution from tumor-free donor mice (middle row of tissues, n = 4 donor/recipient pairs) or non-reconstituted GF mice (lower panel of tissues, n = 4). Tumors are indicated by dashed oval lines. Scale bar: 5 mm. Panel E. Quantification of tongue tumor volumes from the experiment in panel D. *: p<0.05 for Student’s t-test comparisons to (+)Tumor donor group.
To explore the impact of microbiome reconstitution on tumor development, we orthotopically injected 105 Cu110 cells into SPF colonized mice. Saliva and cecal contents were harvested 4 weeks after injection when visible OSCCs developed. Saliva and cecal slurries were prepared from 4 tumor-bearing and 4 tumor-free mice (each group included 2 males and 2 females) and used to inoculate age- and gender-matched recipient GF mice (1::1 donor::recipient). One week later, 105 Cu110 cells were injected orthotopically into these ex-GF mice, along with 4 non-reconstituted GF mice (2 males and 2 females). Mice were harvested two weeks later when requested by IACUC due to cancer severity in some mice. Tumors were appreciably larger in recipient mice inoculated from tumor-bearing mice (Fig. 8D, upper row of stained tissues and Fig. 8E), compared to those inoculated from tumor-free (Fig. 8D, middle row and Fig. 8E) or control (Fig. 8D lower row and Fig. 8E) mice.
Discussion
Although smoking, alcohol intake, and human papillomavirus (HPV) infection are linked to HNSCC, only a small proportion of individuals exposed to these factors develop HNSCC and not all cases progress.[2] Additional environmental or host factors must also contribute to the risk and severity of HNSCC. Dysbiosis has been associated with pathogenesis in several cancer types.[5, 43–48] Recent findings have also demonstrated the influence of gut microbiota on the efficacy of immunotherapies.[49–51] In the case of HNSCC, poor oral hygiene may facilitate microbial overgrowth or alter the composition of oral microbiota, resulting in disruption of immune homeostasis. Inflammation may, in turn, alter the types of microbes inhabiting the oral niche and thereby perpetuate dysbiosis. Bacteria have been detected in HNSCC tissue through both microbiological culture[38] and 16S rRNA sequencing.[52] In addition, oral microbiota profiled in saliva of HNSCC patients have consistently demonstrated differences when compared to controls.[13–18] In this study we confirmed and extended these previously-reported associations between microbiota and human HNSCC, applying several machine-learning tools to fully mine the microbiome dataset. Furthermore, using murine HNSCC models we experimentally documented the functional importance of the microbiota in promoting HNSCC development and/or progression.
Our analyses of human saliva specimens found highly significant differences between the microbiotas of non-HNSCC controls and treatment-naïve HNSCC cases. HNSCC-associated dysbiosis was evident through analyses of beta-diversity, alpha-diversity, and differentially abundant taxa. Analyses of both alpha- and beta-diversity indicated that the oral microbiotas of HNSCC cases were significantly more variable than those of controls (e.g., Fig. 1B, Suppl Fig. 1). We interpret these results to indicate that, in cancer, the immune/physiological homeostatic processes that normally constrain the types of microorganisms inhabiting the oral cavity have been disrupted, thus resulting in greater person-to-person variability in bacterial profiles across HNSCC cases. Furthermore, significant dysbiosis was observed between controls and HNSCC cases stratified by tumor location (OSCC, OPSCC, LSCC). In contrast, differences in oral microbiota between cancer locations (i.e., OSCC vs. OPSCC vs. LSCC) were much less prominent, likely due, in part, to the small number of samples analyzed for each location (n = 7–19) in this convenience sample set. More robust sampling will be required to test the hypothesis that oral microbiotas differ by cancer location. Neither node stage nor tumor size was significantly associated with oral microbiota across all cases, although both variables trended towards significance in OSCC (p = 0.053) and OPSCC (p = 0.072) cases, respectively.
As has been previously reported, HNSCC occurrence was accompanied by elevated Lactobacillus species and diminished Neisseria species, compared with controls.[13–16, 18, 38–40] These two genera, along with Phylobacterium and an unclassified genus of the family Neisseriaceae were consistently found to be differentially abundant in comparison of controls to OSCC, OPSCC, and LSCC cases. Taxa that were positively associated with HNSCC represent potentially cancer-promoting microorganisms, while those that were negatively associated with HNSCC potentially are protective microbes. Overall, the consistency and reproducibility of results across multiple studies suggests that microbiota profiling of saliva may provide a robust means of detecting HNSCC cases through population-based screening. In contrast, few differences in oral microbiota were noted between tumor locations or in association with HPV status or tumor severity. As discussed below, these results may have been limited by the size of the patient population.
The mechanisms and specific HNSCC stage(s) at which the microbiome exerts cancer-promoting activities are unknown. Microbes are likely to promote carcinogenesis and progression through multiple mechanisms, including production of carcinogens and immunosuppressive metabolites.[5, 46, 53–56] A potential link between dysbiosis and HNSCC is suggested by our finding that antibiotic administration prevents or delays induction of the murine Ahr pathway.[19, 20] AhR activation is a critical pathway in both autoimmune disease and cancers,[19–21, 28, 29] including OSCC, that promotes migration and enrichment of cancer stem cells.[30, 57] Because AhR responds to microbial tryptophan (Trp) metabolites (e.g., indoles[25, 27, 58–61]), altered microbiota – such as elevated Lactobacillus spp. -- may promote HNSCC through AhR activation. Of note, the host-encoded enzyme indoleamine 2, 3-dioxygenase 1 (IDO1) not only is a potent activator of AhR, through its conversion of Trp to kynurenine, but also a target of AhR transcriptional activation, thus forming a positive feedback loop suppressing immunity. We hypothesize that enrichment of specific bacterial taxa, such as Lactobacillus spp., circumvents the effects of IDO1 inhibition by increasing circulation of microbially-produced Trp metabolites, which act as cancer-promoting AhR activators. Indeed, increased gut Lactobacillus spp. are associated with melanoma patients who do not respond to the PD-1 inhibitor Pembrolizumab.[62] Interestingly, Lactobacillus were enriched in the gut of IDO1−/− mice,[27] suggesting reciprocal interactions between the microbiota and the host Trp metabolism.
Several limitations to this current study should be noted. Analyses were performed on a convenience set of archived specimens and were thus limited by the patients represented by the available samples. The sample size allowed a detailed comparison of oral microbiota in human HNSCC cases and non-HNSCC controls but likely was too limited to perform more stratified analyses that would have uncovered features of saliva microbiota associated with specific tumor locations, HPV status, or other clinical/demographic variables (e.g., smoking and drinking histories). Furthermore, the cross-sectional study design used to analyze human subjects in this study limited our ability to distinguish potentially pathogenic changes in oral microbiota occurring prior to disease onset from those occurring subsequent to HNSCC development. Thus, the disease-modifying role of dysbiosis in human subjects remains to be determined.
Nevertheless, the results of our murine experiments, conducted in both 4NQO and sOMM models, clearly indicate that changes in the microbiome contribute to the kinetics or severity of HNSCC. The microbiome can impact upon myriad mechanisms, at both the local and systemic levels, to alter nutritional, physiological, and immunological processes involved in tumor initiation, progression, and response to therapy.[45, 63–69] However, both the antibiotic cocktail and germ-free conditions used in our study reduced or eliminated microbial burdens systemically, not just in the oral cavity. Consequently, we could not pinpoint the anatomic site(s) at which microbiota modified HNSCC risk in these mouse models. Furthermore, the temporal stage(s) at which dysbiosis contributed to HNSCC have not yet been precisely delineated. Our finding that microbiome ablation delayed tumor development in sOMM experiments, which entailed injection of pre-established tumor cells, implies that stages subsequent to tumor initiation can be modified by the microbiome (whether oral or extra-oral). Although the 4NQO model encompasses both tumorigenesis and tumor progression, antibiotics were administered throughout the experiment (Fig. 6), prohibiting our ability to differentiate the effects of the microbiome on HNSCC initiation vs. progression. Finally, we did not conduct a comprehensive analysis of murine microbiota in these studies because the relatively small number of co-housed animals included in each treatment group precluded a meaningful analysis. Efforts to characterize the occurrence, timing, and relevant anatomic site (i.e., oral vs. extra-oral) of dysbiosis more fully in association with cancer development in our mouse models are ongoing.
Despite the limitations of this study, we provide compelling evidence from both human patients and well-characterized mouse models that dysbiosis accompanies, and likely promotes, cancers of the head and neck. Additional studies are required to delineate precise mechanisms linking local and systemic changes in microbiota to HNSCC. Greater understanding of these mechanisms may lead to urgently needed prevention and treatment strategies to mitigate a disease of substantial worldwide burden.
Methods
Microbiota Profiling.
Microbiome profiling of human saliva was performed under protocol #16–1794 approved by the COMIRB. Informed consent was obtained from all subjects. DNA was prepared from human saliva using the QiaAmp DNA mini kit (Qiagen, Hilden, Germany). Bacterial 16S rRNA genes were amplified from saliva DNA samples using primers specific for the V1V2 region (27FYM 5’-AGAGTTTGATYMTGGCTCAG and 338R 5’-TGCTGCCTCCCGTAGGAGT), as previously described.[70, 71] PCR amplicons were normalized and pooled using a SequalPrep Normalization Plate Kit (Invitrogen) and pools quantified using a Qubit® 2.0 Fluorometer (Invitrogen, Waltham, MA, USA). Paired-end sequencing was conducted on the Illumina MiSeq platform using the 600 cycle v3 kit. Sequences were quality-filtered and classified using the SINA/SILVA platform[72–74] as previously described.[70, 71] This process generated a median of 145,160 sequences/sample (IQR: 129,733 – 162,230) for 121 human samples; in contrast, 8 negative control specimens generated a median of 184.5 sequences/control (IQR: 132 – 333). All libraries had a Goods coverage score ≥ 99% at the rarefaction point of 54,531 sequences (the read count of the smallest patient library).
To classify Lactobacillus and Neisseria sequences to the species level, we pre-computed within- and between-species distances for all Lactobacillus and Neisseria 16S rRNA gene sequences derived from genomic reference sequences available in SILVA,[74] using only the subsequences bounded by the V1V2 primer pair. Each sequence within the subject dataset was then aligned to this species-specific reference sequence dataset using SINA[72] and pairwise positional differences were enumerated. Any query sequence that fell within the intra-group distance cutoff defined for a given Lactobacillus or Neisseria species was operationally classified to that species. This conservative process required that the MiSeq-derived sequences were essentially exact matches to the genomic subsequences in order to achieve a given species-level attribution. For species such as L. gasseri and L. johnsonii, which could not be differentiated from each other based on this approach, we operationally collapsed taxa into species clusters (e.g., L. gasseri/johnsonii).
4NQO-OSCC mouse model and antibiotics treatment.
All animal experiments were performed in accordance with a protocol (#471) approved by the Institution Animal Cancer and Use Committee of University of Colorado Anschutz Medical Campus. Equal numbers of males and females were randomized to test groups. 6-weeks old C57BL6 mice (Jackson lab, Bar Harbor, ME USA) were treated with a final concentration of 50 ug/ml 4NQO (Sigma, St. Louis, MO USA) dissolved in propylene glycol and prepared in drinking water for 16 weeks as we previously described. Treatment of mice with antibiotics was done by placing 0.5 mg/ml vancomycin and 1 mg/ml each of ampicillin, metronidazole, and neomycin (Sigma, St. Louis, MO USA) ad libitum in drinking water supplemented with 20 mg/ml grape-flavored sugar-sweetened Kool-Aid (Kraft Foods, Deerfield, IL USA). Untreated mice were provided drinking water with Kool-Aid alone. Saliva was collected by i.p. injection of 1 mg/kg carbachol (Sigma, St. Louis, MO USA), and aspirated from the lower cheek punch using a suction device.[75] Tumor development was assessed grossly twice a week until sacrifice, as previously described.74,84−86 At sacrifice, tumor incidence, number, weight, and size were recorded. Tumor tissue, adjacent tongue, and buccal tissues were collected for histopathology. Tumor volume was calculated according to the formula: volume (mm3) = [length × (width ×2)])/2. The criteria for animal exclusion were: 1) Body loss over 20% and/or 2) Anergic or hunched position.
Bacterial Culture.
Saliva collected from tumor-bearing and control mice were plated on De Man, Rogosa, and Sharpe (MRS) agar (Thermo Fisher Scientific, Waltham, MA USA) and incubated overnight at 37C.
Bacterial Quantification.
Lactobacillus spp. and total bacterial loads were quantified by qPCR of DNA samples as described.[76] Lactobacillus quantification[77] used the primers LactoF (5’ TGGAAACAGRTGCTAATACCC) and LactoR (5’ GYCCATTGTGGAAGATTCCC). Total bacterial load quantification[78] used forward (5’ TCCTACGGGAGGCAGCAGT) and reverse (5’ GGACTACCAGGGTATCTAATCCTGTT) primers along with an internal probe (5’-FAM-CGTATTACC-ZEN-GCGGCKGCTGGCAC-IABkFQ). Oligonucleotides were purchased from Integrated DNA Technologies (Coralville, Iowa, USA).
Germ-free mouse and reconstitution experiment.
Orthotopic OSCC mouse model was applied to compare tumor development in mice hosted in germ-free (GF) and special pathogen free (SPF) facilities. In brief, 10^5 Cu110 cells (established from tumors of the PIK3CA transgenic mouse) as we described previously[41, 42] were orthotopically injected into tongues of 6–8-week-old C57BL6 mice. Equal numbers of males and females were randomized to test groups. For reconstitution experiment, Saliva and cecal contents were harvested 4 weeks after injection of CU110 cells in SPF mice when visible OSCCs developed. Saliva and cecal slurries were prepared from 4 tumor-bearing and 4 tumor-free mice in SPF mice and used to inoculate age and gender matched recipient GF mice (1::1 donor::recipient) once for three consecutive days. One week later, 10^5 Cu110 cells were injected orthotopically into these ex-GF mice, along with 4 non-reconstituted GF mice. Mice were harvested and tumor and control tissues collected at the end of study.
Immunohistochemistry.
Immunohistochemistry was performed on formalin-fixed paraffin-embedded tissue slides according to the protocol we described previously.[41] The primary antibody was anti-Ah Receptor antibody (#sc-133088, Santa Cruz Biotechnology, Dallas, TX, USA) at 1:100 dilution.
Statistical analysis.
The software packages R (v3.6.3),[79] Explicet (v2.10.5),[80] and GraphPad prism (v9.0.2) were used to analyze and visualize data. For microbiome analysis, differences in overall composition (i.e., beta-diversity) were assessed through permutational ANOVA (PERMANOVA[81, 82]) with the Aitchison dissimilarity index. PERMANOVA p-values were inferred through 106 label permutations and FDR-corrected[83] when multiple pairwise tests were performed. Between-group differences in the homogeneity of microbiotas were evaluated with the vegan betadisper and permutest functions[82] using the Aitchison dissimilarity index; p-values were derived using 106 label permutations, with the TukeyHSD test applied to variables with multiple levels. Alpha-diversity indices (i.e., Sobs, Shannon H, Shannon H/Hmax) were assessed by ANOVA; p-values were FDR-corrected[83] when multiple pairwise tests were performed. Between-group differences in the homogeneity of alpha-diversity values were evaluated by Levene’s test (R leveneTest function[84]). PERMANOVA and ANOVA were performed on the main outcomes (HNSCC occurrence and location) both as one-way tests and adjusting for age or sex. Individual taxa differing between treatment groups were identified using the ANOVA-like differential expression (ALDEx2) R package.[31, 32] The distribution of taxa in each sequence library was estimated through 1000 Dirichlet Monte Carlo re-samplings of sequence count data. To account for the compositional nature of microbiome sequence data, datasets were then subjected to a center log-ratio (CLR) transformation with all features used as the denominator. Either nominal or FDR-corrected p-values are reported, as indicated in the text and figures. Effect size plots are derived from the outputs of ALDEx2 and represent the median effect sizes, calculated as the median between-group difference in CLR values between groups divided by the largest within-group difference in CLR values.[31, 32] Principal coordinates analysis was carried out using Aitchison dissimilarities and the vegan wcmdscale function. Logistic regression, feature selection, and classification were performed using the R glmnet package [35] with alpha = 1 to select lasso variable selection and 10-fold cross-validation; center log-ratio transformed microbiota data were used for this analysis. Sparse partial least squares discriminant analysis (sPLS-DA) used the tune.splsda function of the R mixOmics package[34] with the logratio option set to “CLR” to center log-ratio transform count data. Random forest classification used the tuneRF function (ntreeTry=1000, stepFactor=1.5, improve=0.01) of the randomForest R package[37] applied to percent relative abundance microbiota data. Results of mouse experiments were evaluated by Student’s t-test (categorical vs. continuous variables), Chi-squared test (two categorical variables), or Mantel-Cox test (survival analysis) as indicated in the text. Investigators were not blinded to group allocations for either human subjects or animal studies.
Animal number justification.
Based on published reports[85] and our experience[41], we expected all animals to survive until the endpoint and that all 4NQO-treated mice or orthotopic OSCC mouse model would develop OSCCs. Congruent with published estimates for sample size in microbiome studies, eight mice per group allowed 90% power to detect an effect size of 5% explained variance across all omics (ω2 of 0.05). Thus, treatment groups initially included at least 8 animals.
Supplementary Material
Acknowledgements
This work was funded by grants from NIH-NIDCR (R56 DE028959; SLL & DNF), NIH-NIAMS (R01 AR075033; KAK), the Cancer League of Colorado (SLL & DNF), Golfers Against Cancer (SLL & DNF), and the University of Colorado Cancer Center (SLL & DNF). DNF, CER, and JMK were supported in part by the University of Colorado GI and Liver Innate Immunity Program. VRR was supported in part by a Career Development Grant from the University of Colorado Cancer Center and NIH-NIDCD K23 DC014747 (VRR). The content is solely the responsibility of the authors and does not necessarily represent the official views of the funding organizations.
Footnotes
Competing interests
The authors declare that the research was conducted in the absence of any commercial or financial relationships that could be construed as a potential conflict of interest.
Data availability.
Demultiplexed 16S rRNA paired-end sequence data and associated metadata were deposited in the NCBI Sequence Read Archive under BioProject ID PRJNA749451. All other data supporting the findings of this study are available within the paper and its supplementary files or are available from the corresponding authors upon reasonable request.
References
- 1.Pfister DG, Spencer S, Adelstein D, Adkins D, Anzai Y, Brizel DM et al. Head and Neck Cancers, Version 2.2020, NCCN Clinical Practice Guidelines in Oncology. J Natl Compr Canc Netw 2020; 18: 873–898. [DOI] [PubMed] [Google Scholar]
- 2.Chow LQM. Head and Neck Cancer. N Engl J Med 2020; 382: 60–72. [DOI] [PubMed] [Google Scholar]
- 3.Parkin DM. The global health burden of infection-associated cancers in the year 2002. Int J Cancer 2006; 118: 3030–3044. [DOI] [PubMed] [Google Scholar]
- 4.Blaser MJ. Understanding microbe-induced cancers. Cancer Prev Res (Phila) 2008; 1: 15–20. [DOI] [PubMed] [Google Scholar]
- 5.Schwabe RF, Jobin C. The microbiome and cancer. Nat Rev Cancer 2013; 13: 800–812. [DOI] [PMC free article] [PubMed] [Google Scholar]
- 6.Healy CM, Moran GP. The microbiome and oral cancer: More questions than answers. Oral oncology 2019; 89: 30–33. [DOI] [PubMed] [Google Scholar]
- 7.Ganly I, Yang L, Giese RA, Hao Y, Nossa CW, Morris LGT et al. Periodontal pathogens are a risk factor of oral cavity squamous cell carcinoma, independent of tobacco and alcohol and human papillomavirus. Int J Cancer 2019; 145: 775–784. [DOI] [PMC free article] [PubMed] [Google Scholar]
- 8.Hooper SJ, Wilson MJ, Crean SJ. Exploring the link between microorganisms and oral cancer: a systematic review of the literature. Head Neck 2009; 31: 1228–1239. [DOI] [PubMed] [Google Scholar]
- 9.Neville BW, Day TA. Oral cancer and precancerous lesions. CA Cancer J Clin 2002; 52: 195–215. [DOI] [PubMed] [Google Scholar]
- 10.Gholizadeh P, Eslami H, Yousefi M, Asgharzadeh M, Aghazadeh M, Kafil HS. Role of oral microbiome on oral cancers, a review. Biomed Pharmacother 2016; 84: 552–558. [DOI] [PubMed] [Google Scholar]
- 11.Jenkinson HF, Lamont RJ. Oral microbial communities in sickness and in health. Trends Microbiol 2005; 13: 589–595. [DOI] [PubMed] [Google Scholar]
- 12.Mager DL, Ximenez-Fyvie LA, Haffajee AD, Socransky SS. Distribution of selected bacterial species on intraoral surfaces. J Clin Periodontol 2003; 30: 644–654. [DOI] [PubMed] [Google Scholar]
- 13.Pushalkar S, Mane SP, Ji X, Li Y, Evans C, Crasta OR et al. Microbial diversity in saliva of oral squamous cell carcinoma. FEMS Immunol Med Microbiol 2011; 61: 269–277. [DOI] [PMC free article] [PubMed] [Google Scholar]
- 14.Guerrero-Preston R, Godoy-Vitorino F, Jedlicka A, Rodriguez-Hilario A, Gonzalez H, Bondy J et al. 16S rRNA amplicon sequencing identifies microbiota associated with oral cancer, human papilloma virus infection and surgical treatment. Oncotarget 2016; 7: 51320–51334. [DOI] [PMC free article] [PubMed] [Google Scholar]
- 15.Wolf A, Moissl-Eichinger C, Perras A, Koskinen K, Tomazic PV, Thurnher D. The salivary microbiome as an indicator of carcinogenesis in patients with oropharyngeal squamous cell carcinoma: A pilot study. Scientific reports 2017; 7: 5867. [DOI] [PMC free article] [PubMed] [Google Scholar]
- 16.Guerrero-Preston R, White JR, Godoy-Vitorino F, Rodriguez-Hilario A, Navarro K, Gonzalez H et al. High-resolution microbiome profiling uncovers Fusobacterium nucleatum, Lactobacillus gasseri/johnsonii, and Lactobacillus vaginalis associated to oral and oropharyngeal cancer in saliva from HPV positive and HPV negative patients treated with surgery and chemo-radiation. Oncotarget 2017; 8: 110931–110948. [DOI] [PMC free article] [PubMed] [Google Scholar]
- 17.Hayes RB, Ahn J, Fan X, Peters BA, Ma Y, Yang L et al. Association of Oral Microbiome With Risk for Incident Head and Neck Squamous Cell Cancer. JAMA oncology 2018; 4: 358–365. [DOI] [PMC free article] [PubMed] [Google Scholar]
- 18.Shay E, Sangwan N, Padmanabhan R, Lundy S, Burkey B, Eng C. Bacteriome and mycobiome and bacteriome-mycobiome interactions in head and neck squamous cell carcinoma. Oncotarget 2020; 11: 2375–2386. [DOI] [PMC free article] [PubMed] [Google Scholar]
- 19.Quintana FJ. The aryl hydrocarbon receptor: a molecular pathway for the environmental control of the immune response. Immunology 2013; 138: 183–189. [DOI] [PMC free article] [PubMed] [Google Scholar]
- 20.Quintana FJ, Sherr DH. Aryl hydrocarbon receptor control of adaptive immunity. Pharmacol Rev 2013; 65: 1148–1161. [DOI] [PMC free article] [PubMed] [Google Scholar]
- 21.Stockinger B, Di Meglio P, Gialitakis M, Duarte JH. The aryl hydrocarbon receptor: multitasking in the immune system. Annu Rev Immunol 2014; 32: 403–432. [DOI] [PubMed] [Google Scholar]
- 22.Zhang L, Wu R, Dingle RW, Gairola CG, Valentino J, Swanson HI. Cigarette smoke condensate and dioxin suppress culture shock induced senescence in normal human oral keratinocytes. Oral oncology 2007; 43: 693–700. [DOI] [PMC free article] [PubMed] [Google Scholar]
- 23.Chang H, Chang LW, Cheng YH, Tsai WT, Tsai MX, Lin P. Preferential induction of CYP1A1 and CYP1B1 in CCSP-positive cells. Toxicological sciences : an official journal of the Society of Toxicology 2006; 89: 205–213. [DOI] [PubMed] [Google Scholar]
- 24.Lanis JM, Alexeev EE, Curtis VF, Kitzenberg DA, Kao DJ, Battista KD et al. Tryptophan metabolite activation of the aryl hydrocarbon receptor regulates IL-10 receptor expression on intestinal epithelia. Mucosal Immunol 2017; 10: 1133–1144. [DOI] [PMC free article] [PubMed] [Google Scholar]
- 25.Rothhammer V, Mascanfroni ID, Bunse L, Takenaka MC, Kenison JE, Mayo L et al. Type I interferons and microbial metabolites of tryptophan modulate astrocyte activity and central nervous system inflammation via the aryl hydrocarbon receptor. Nat Med 2016. [DOI] [PMC free article] [PubMed] [Google Scholar]
- 26.Jin UH, Lee SO, Sridharan G, Lee K, Davidson LA, Jayaraman A et al. Microbiome-derived tryptophan metabolites and their aryl hydrocarbon receptor-dependent agonist and antagonist activities. Molecular pharmacology 2014; 85: 777–788. [DOI] [PMC free article] [PubMed] [Google Scholar]
- 27.Zelante T, Iannitti RG, Cunha C, De Luca A, Giovannini G, Pieraccini G et al. Tryptophan catabolites from microbiota engage aryl hydrocarbon receptor and balance mucosal reactivity via interleukin-22. Immunity 2013; 39: 372–385. [DOI] [PubMed] [Google Scholar]
- 28.Stange J, Veldhoen M. The aryl hydrocarbon receptor in innate T cell immunity. Semin Immunopathol 2013. [DOI] [PubMed] [Google Scholar]
- 29.Stockinger B, Hirota K, Duarte J, Veldhoen M. External influences on the immune system via activation of the aryl hydrocarbon receptor. Semin Immunol 2011; 23: 99–105. [DOI] [PubMed] [Google Scholar]
- 30.Stanford EA, Ramirez-Cardenas A, Wang Z, Novikov O, Alamoud K, Koutrakis P et al. Role for the Aryl Hydrocarbon Receptor and Diverse Ligands in Oral Squamous Cell Carcinoma Migration and Tumorigenesis. Molecular cancer research : MCR 2016; 14: 696–706. [DOI] [PMC free article] [PubMed] [Google Scholar]
- 31.Fernandes AD, Macklaim JM, Linn TG, Reid G, Gloor GB. ANOVA-like differential expression (ALDEx) analysis for mixed population RNA-Seq. PloS one 2013; 8: e67019. [DOI] [PMC free article] [PubMed] [Google Scholar]
- 32.Fernandes AD, Reid JN, Macklaim JM, McMurrough TA, Edgell DR, Gloor GB. Unifying the analysis of high-throughput sequencing datasets: characterizing RNA-seq, 16S rRNA gene sequencing and selective growth experiments by compositional data analysis. Microbiome 2014; 2: 15. [DOI] [PMC free article] [PubMed] [Google Scholar]
- 33.Le Cao KA, Boitard S, Besse P. Sparse PLS discriminant analysis: biologically relevant feature selection and graphical displays for multiclass problems. BMC bioinformatics 2011; 12: 253. [DOI] [PMC free article] [PubMed] [Google Scholar]
- 34.Rohart F, Gautier B, Singh A, Le Cao KA. mixOmics: An R package for ‘omics feature selection and multiple data integration. PLoS Comput Biol 2017; 13: e1005752. [DOI] [PMC free article] [PubMed] [Google Scholar]
- 35.Friedman J, Hastie T, Tibshirani R. Regularization Paths for Generalized Linear Models via Coordinate Descent. J Stat Softw 2010; 33: 1–22. [PMC free article] [PubMed] [Google Scholar]
- 36.Statnikov A, Henaff M, Narendra V, Konganti K, Li Z, Yang L et al. A comprehensive evaluation of multicategory classification methods for microbiomic data. Microbiome 2013; 1: 11. [DOI] [PMC free article] [PubMed] [Google Scholar]
- 37.Liaw A, Wiener M. Classification and Regression by randomForest. R News 2002; 2(3): 18–22. [Google Scholar]
- 38.Hooper SJ, Crean SJ, Lewis MA, Spratt DA, Wade WG, Wilson MJ. Viable bacteria present within oral squamous cell carcinoma tissue. J Clin Microbiol 2006; 44: 1719–1725. [DOI] [PMC free article] [PubMed] [Google Scholar]
- 39.Al-Hebshi NN, Nasher AT, Maryoud MY, Homeida HE, Chen T, Idris AM et al. Inflammatory bacteriome featuring Fusobacterium nucleatum and Pseudomonas aeruginosa identified in association with oral squamous cell carcinoma. Scientific reports 2017; 7: 1834. [DOI] [PMC free article] [PubMed] [Google Scholar]
- 40.Hayes RB, Ahn J, Fan X, Peters BA, Ma Y, Yang L et al. Association of Oral Microbiome With Risk for Incident Head and Neck Squamous Cell Cancer. JAMA Oncol 2018. [DOI] [PMC free article] [PubMed] [Google Scholar]
- 41.Du L, Chen X, Cao Y, Lu L, Zhang F, Bornstein S et al. Overexpression of PIK3CA in murine head and neck epithelium drives tumor invasion and metastasis through PDK1 and enhanced TGFbeta signaling. Oncogene 2016; 35: 4641–4652. [DOI] [PMC free article] [PubMed] [Google Scholar]
- 42.Chen X, Cao Y, Sedhom W, Lu L, Liu Y, Wang H et al. Distinct roles of PIK3CA in the enrichment and maintenance of cancer stem cells in head and neck squamous cell carcinoma. Mol Oncol 2019. [DOI] [PMC free article] [PubMed] [Google Scholar]
- 43.Alfano M, Canducci F, Nebuloni M, Clementi M, Montorsi F, Salonia A. The interplay of extracellular matrix and microbiome in urothelial bladder cancer. Nat Rev Urol 2016; 13: 77–90. [DOI] [PMC free article] [PubMed] [Google Scholar]
- 44.Bultman SJ. Emerging roles of the microbiome in cancer. Carcinogenesis 2014; 35: 249–255. [DOI] [PMC free article] [PubMed] [Google Scholar]
- 45.Ohtani N. Microbiome and cancer. Semin Immunopathol 2015; 37: 65–72. [DOI] [PubMed] [Google Scholar]
- 46.Brennan CA, Garrett WS. Gut Microbiota, Inflammation, and Colorectal Cancer. Annu Rev Microbiol 2016; 70: 395–411. [DOI] [PMC free article] [PubMed] [Google Scholar]
- 47.Fan X, Alekseyenko AV, Wu J, Peters BA, Jacobs EJ, Gapstur SM et al. Human oral microbiome and prospective risk for pancreatic cancer: a population-based nested case-control study. Gut 2016. [DOI] [PMC free article] [PubMed] [Google Scholar]
- 48.Yu G, Gail MH, Shi J, Klepac-Ceraj V, Paster BJ, Dye BA et al. Association between upper digestive tract microbiota and cancer-predisposing states in the esophagus and stomach. Cancer Epidemiol Biomarkers Prev 2014; 23: 735–741. [DOI] [PMC free article] [PubMed] [Google Scholar]
- 49.Gopalakrishnan V, Spencer CN, Nezi L, Reuben A, Andrews MC, Karpinets TV et al. Gut microbiome modulates response to anti-PD-1 immunotherapy in melanoma patients. Science 2018; 359: 97–103. [DOI] [PMC free article] [PubMed] [Google Scholar]
- 50.Matson V, Fessler J, Bao R, Chongsuwat T, Zha Y, Alegre ML et al. The commensal microbiome is associated with anti-PD-1 efficacy in metastatic melanoma patients. Science 2018; 359: 104–108. [DOI] [PMC free article] [PubMed] [Google Scholar]
- 51.Routy B, Le Chatelier E, Derosa L, Duong CPM, Alou MT, Daillere R et al. Gut microbiome influences efficacy of PD-1-based immunotherapy against epithelial tumors. Science 2018; 359: 91–97. [DOI] [PubMed] [Google Scholar]
- 52.Bebek G, Bennett KL, Funchain P, Campbell R, Seth R, Scharpf J et al. Microbiomic subprofiles and MDR1 promoter methylation in head and neck squamous cell carcinoma. Hum Mol Genet 2012; 21: 1557–1565. [DOI] [PMC free article] [PubMed] [Google Scholar]
- 53.Plottel CS, Blaser MJ. Microbiome and malignancy. Cell Host Microbe 2011; 10: 324–335. [DOI] [PMC free article] [PubMed] [Google Scholar]
- 54.Hold GL, Garrett WS. Gut microbiota. Microbiota organization--a key to understanding CRC development. Nat Rev Gastroenterol Hepatol 2015; 12: 128–129. [DOI] [PubMed] [Google Scholar]
- 55.Yu LX, Schwabe RF. The gut microbiome and liver cancer: mechanisms and clinical translation. Nat Rev Gastroenterol Hepatol 2017; 14: 527–539. [DOI] [PMC free article] [PubMed] [Google Scholar]
- 56.Sfanos KS, Yegnasubramanian S, Nelson WG, De Marzo AM. The inflammatory microenvironment and microbiome in prostate cancer development. Nat Rev Urol 2018; 15: 11–24. [DOI] [PubMed] [Google Scholar]
- 57.Liu Y, Liang X, Yin X, Lv J, Tang K, Ma J et al. Blockade of IDO-kynurenine-AhR metabolic circuitry abrogates IFN-gamma-induced immunologic dormancy of tumor-repopulating cells. Nat Commun 2017; 8: 15207. [DOI] [PMC free article] [PubMed] [Google Scholar] [Retracted]
- 58.Lamas B, Richard ML, Leducq V, Pham HP, Michel ML, Da Costa G et al. CARD9 impacts colitis by altering gut microbiota metabolism of tryptophan into aryl hydrocarbon receptor ligands. Nat Med 2016. [DOI] [PMC free article] [PubMed] [Google Scholar]
- 59.Alexeev EE, Lanis JM, Kao DJ, Campbell EL, Kelly CJ, Battista KD et al. Microbiota-Derived Indole Metabolites Promote Human and Murine Intestinal Homeostasis through Regulation of Interleukin-10 Receptor. Am J Pathol 2018; 188: 1183–1194. [DOI] [PMC free article] [PubMed] [Google Scholar]
- 60.Roager HM, Licht TR. Microbial tryptophan catabolites in health and disease. Nature communications 2018; 9: 3294. [DOI] [PMC free article] [PubMed] [Google Scholar]
- 61.Cervantes-Barragan L, Chai JN, Tianero MD, Di Luccia B, Ahern PP, Merriman J et al. Lactobacillus reuteri induces gut intraepithelial CD4(+)CD8alphaalpha(+) T cells. Science 2017; 357: 806–810. [DOI] [PMC free article] [PubMed] [Google Scholar]
- 62.Frankel AE, Coughlin LA, Kim J, Froehlich TW, Xie Y, Frenkel EP et al. Metagenomic Shotgun Sequencing and Unbiased Metabolomic Profiling Identify Specific Human Gut Microbiota and Metabolites Associated with Immune Checkpoint Therapy Efficacy in Melanoma Patients. Neoplasia 2017; 19: 848–855. [DOI] [PMC free article] [PubMed] [Google Scholar]
- 63.Cullin N, Azevedo Antunes C, Straussman R, Stein-Thoeringer CK, Elinav E. Microbiome and cancer. Cancer Cell 2021. [DOI] [PubMed] [Google Scholar]
- 64.Andreeva NV, Gabbasova RR, Grivennikov SI. Microbiome in cancer progression and therapy. Curr Opin Microbiol 2020; 56: 118–126. [DOI] [PMC free article] [PubMed] [Google Scholar]
- 65.Elinav E, Garrett WS, Trinchieri G, Wargo J. The cancer microbiome. Nat Rev Cancer 2019; 19: 371–376. [DOI] [PMC free article] [PubMed] [Google Scholar]
- 66.Zitvogel L, Ma Y, Raoult D, Kroemer G, Gajewski TF. The microbiome in cancer immunotherapy: Diagnostic tools and therapeutic strategies. Science 2018; 359: 1366–1370. [DOI] [PubMed] [Google Scholar]
- 67.Daniel CR, McQuade JL. Nutrition and Cancer in the Microbiome Era. Trends Cancer 2019; 5: 521–524. [DOI] [PMC free article] [PubMed] [Google Scholar]
- 68.Gopalakrishnan V, Helmink BA, Spencer CN, Reuben A, Wargo JA. The Influence of the Gut Microbiome on Cancer, Immunity, and Cancer Immunotherapy. Cancer Cell 2018; 33: 570–580. [DOI] [PMC free article] [PubMed] [Google Scholar]
- 69.Helmink BA, Khan MAW, Hermann A, Gopalakrishnan V, Wargo JA. The microbiome, cancer, and cancer therapy. Nat Med 2019; 25: 377–388. [DOI] [PubMed] [Google Scholar]
- 70.Frank DN, Giese APJ, Hafren L, Bootpetch TC, Yarza TKL, Steritz MJ et al. Otitis media susceptibility and shifts in the head and neck microbiome due to SPINK5 variants. J Med Genet 2020. [DOI] [PMC free article] [PubMed] [Google Scholar]
- 71.Vickery TW, Armstrong M, Kofonow JM, Robertson CE, Kroehl ME, Reisdorph NA et al. Altered tissue specialized pro-resolving mediators in chronic rhinosinusitis. Prostaglandins, leukotrienes, and essential fatty acids 2020; 164: 102218. [DOI] [PMC free article] [PubMed] [Google Scholar]
- 72.Pruesse E, Peplies J, Glockner FO. SINA: accurate high-throughput multiple sequence alignment of ribosomal RNA genes. Bioinformatics 2012; 28: 1823–1829. [DOI] [PMC free article] [PubMed] [Google Scholar]
- 73.Pruesse E, Quast C, Knittel K, Fuchs B, Ludwig W, Peplies J et al. SILVA: a comprehensive online resource for quality checked and aligned ribosomal RNA sequence data compatible with ARB. Nucleic Acids Res 2007; 35: 7188–7196. [DOI] [PMC free article] [PubMed] [Google Scholar]
- 74.Quast C, Pruesse E, Yilmaz P, Gerken J, Schweer T, Yarza P et al. The SILVA ribosomal RNA gene database project: improved data processing and web-based tools. Nucleic Acids Res 2013; 41: D590–596. [DOI] [PMC free article] [PubMed] [Google Scholar]
- 75.Wie SM, Wellberg E, Karam SD, Reyland ME. Tyrosine Kinase Inhibitors Protect the Salivary Gland from Radiation Damage by Inhibiting Activation of Protein Kinase C-delta. Mol Cancer Ther 2017; 16: 1989–1998. [DOI] [PMC free article] [PubMed] [Google Scholar]
- 76.Frank DN, Manigart O, Leroy V, Meda N, Valea D, Zhang W et al. Altered Vaginal Microbiota are Associated with Perinatal Mother-to-Child HIV Transmission in African Women from Burkina Faso. J Acquir Immune Defic Syndr 2012; 60: 299–306. [DOI] [PMC free article] [PubMed] [Google Scholar]
- 77.Frank JA, Reich CI, Sharma S, Weisbaum JS, Wilson BA, Olsen GJ. Critical evaluation of two primers commonly used for amplification of bacterial 16S rRNA genes. Appl Environ Microbiol 2008; 74: 2461–2470. [DOI] [PMC free article] [PubMed] [Google Scholar]
- 78.Nadkarni MA, Martin FE, Jacques NA, Hunter N. Determination of bacterial load by real-time PCR using a broad-range (universal) probe and primers set. Microbiology 2002; 148: 257–266. [DOI] [PubMed] [Google Scholar]
- 79.R Core Team. R: A Language and Environment for Statistical Computing, Vienna, Austria. R Foundation for Statistical Computing: Vienna, Austria, 2019. [Google Scholar]
- 80.Robertson CE, Harris JK, Wagner BD, Granger D, Browne K, Tatem B et al. Explicet: graphical user interface software for metadata-driven management, analysis and visualization of microbiome data. Bioinformatics 2013; 29: 3100–3101. [DOI] [PMC free article] [PubMed] [Google Scholar]
- 81.Anderson MJ, Crist TO, Chase JM, Vellend M, Inouye BD, Freestone AL et al. Navigating the multiple meanings of beta diversity: a roadmap for the practicing ecologist. Ecol Lett 2011; 14: 19–28. [DOI] [PubMed] [Google Scholar]
- 82.Oksanen J, Blanchet G, Friendly M, Kindt R, Legendre P, McGlinn D et al. Vegan: Community Ecology Package. R package version 2.5-7. http://vegan.r-forge.r-project.org, 2019.
- 83.Benjamini Y, Hochberg Y. Controlling the false discovery rate: a practical and powerful approach to multiple testing. J Roy Statist Soc Ser B 1995; 57: 2890300. [Google Scholar]
- 84.Fox J, Weisberg S. An R Companion to Applied Regression, second edn. SAGE Publications, Inc: Thousand Oaks, CA USA, 2019. [Google Scholar]
- 85.Vitale-Cross L, Czerninski R, Amornphimoltham P, Patel V, Molinolo AA, Gutkind JS. Chemical carcinogenesis models for evaluating molecular-targeted prevention and treatment of oral cancer. Cancer Prev Res (Phila) (Research Support, N.I.H., Intramural Review) 2009; 2: 419–422. [DOI] [PubMed] [Google Scholar]
Associated Data
This section collects any data citations, data availability statements, or supplementary materials included in this article.
Supplementary Materials
Data Availability Statement
Demultiplexed 16S rRNA paired-end sequence data and associated metadata were deposited in the NCBI Sequence Read Archive under BioProject ID PRJNA749451. All other data supporting the findings of this study are available within the paper and its supplementary files or are available from the corresponding authors upon reasonable request.