Abstract
The emerging technique of mid-infrared optical coherence tomography (MIR-OCT) takes advantage of the reduced scattering of MIR light in various materials and devices, enabling tomographic imaging at deeper penetration depths. Because of challenges in MIR detection technology, the image acquisition time is, however, significantly longer than for tomographic imaging methods in the visible/near-infrared. Here we demonstrate an alternative approach to MIR tomography with high-speed imaging capabilities. Through femtosecond nondegenerate two-photon absorption of MIR light in a conventional Si-based CCD camera, we achieve wide-field, high-definition tomographic imaging with chemical selectivity of structured materials and biological samples in mere seconds.
1. INTRODUCTION
Supplementing optical imaging with spectroscopic information enables the identification of objects based not only on their morphology but also on their chemical composition. The mid-infrared (MIR) region of the electromagnetic spectrum, which spans the 2–10 µm wavelength range, has been of particular interest. This range matches the energies of the fundamental vibrations of chemical bonds and moieties, and therefore constitutes a premier window for spectroscopic imaging [1,2]. For this reason, MIR radiation has been used for target discrimination in stand-off detection mode [3]. In addition, when combined with interferometric gating, MIR light has proven attractive for tomographic imaging, allowing the visualization and three-dimensional reconstruction of a variety of structured materials. In particular, compared to visible and near-IR (NIR) radiation, MIR light has a much higher penetration depth in highly scattering materials such as ceramics, paints, and printed electronics, which has prompted the development of MIR-based optical coherence tomography (MIR-OCT) techniques [4–12].
Although the unique imaging capabilities of MIR tomographic imaging, and MIR-OCT in particular, address an important need in the characterization of structured materials, its practical implementation is hampered by technical hurdles. For instance, fast and low-noise detection of MIR radiation, a prerequisite for rapid imaging, remains a challenge for existing detector technologies. MIR detectors, such as those based on low bandgap materials like InSb and HgCdTe, suffer from a high thermal background. Moreover, MIR detector arrays typically have fewer elements compared to their visible/NIR counterparts, thus limiting high-definition imaging capabilities. These obstacles have spurred many developments that aim to convert the information encoded in MIR light into vis/NIR radiation [13–20]. Such spectral conversion enables the use of mature detector technology based on Si or other wide bandgap semiconductor materials [21–27]. This strategy has been leveraged to improve the performance of MIR-OCT, using either nonlinear upconversion [28] or nonlinear interferometry with entangled photons [29–33]. MIR tomographic images have been recorded at sub-10 µm axial resolution and total acquisition times of minutes per volume.
Despite these important advances in MIR-OCT, the total acquisition time for volumetric images is still rather long and relies on lateral raster scanning of the beam, rendering current approaches less practical for time-sensitive applications. Furthermore, signal levels appear insufficient for examining weakly reflective interfaces of organic materials, nor do current OCT applications take clear advantage of the spectroscopic sensitivity afforded by MIR light. Here we develop a new, high-speed 3D imaging technique that overcomes these shortcomings in MIR tomographic imaging. Instead of relying on interferometric gating to achieve depth resolution, our approach uses a nonlinear optical gate provided by an additional femtosecond pulse through the process of nondegenerate two-photon absorption (NTA) in a wide bandgap semiconducting photodetector. This effect has been discussed in depth [15,22,34–37], and the possibility of using NTA for rapid 2D mid-IR imaging has been demonstrated [25]. In fact, the principle of NTA has recently been used to acquire tomographic images in the MIR range with the aid of a single pixel GaN photodiode [38]. To achieve 3D imaging, the object was raster scanned across a focused MIR beam, requiring multiple minutes to build up a volumetric dataset when using lock-in detection. In contrast, we apply this principle in a massively parallel fashion through the use of a 1.4 Mpx Si CCD camera, omitting the need for lateral scanning altogether and enabling the acquisition of 3D images in mere seconds or faster—acquisition rates that are up to 2 orders of magnitude higher than the present standard. This novel detection strategy permits 3D MIR imaging at high sensitivity. We show that NTA-enabled tomography allows background-free 3D MIR imaging of weakly reflective interfaces of organic materials, objects underneath a 3 mm thick GaAs wafer, and even targets hidden under a 190 µm layer of water, using an average power density for the MIR illumination as low as 0.4 mW/cm2. To emphasize the chemical selectivity of MIR tomography, we demonstrate 3D images of polymer structures and protein crystals with spectroscopic contrast based on fundamental vibrational transitions in the 2000‒3000 cm‒1 range.
2. METHODS
A. Fourier Transform Infrared Spectroscopy
MIR absorption of materials is measured with a commercial Fourier transform infrared (FTIR) spectrometer (Jasco 4700) either in transmission mode or by using an attenuated total reflection (ATR) accessory equipped with a diamond crystal.
B. MIR Femtosecond NTA Imaging System
The imaging system is schematically depicted in Fig. 1(a). A 1 kHz amplified femtosecond laser system (Spitfire Ace, Spectra Physics) is used to seed two optical parametric amplifiers (OPA, Topas Prime, Light Conversion). One OPA is used as a source of NIR gate radiation at 1200 nm. The signal and idler pulses from the second OPA system are used to generate MIR pulses (<3000 cm‒1) through the process of difference frequency generation in a nonlinear medium. Both MIR and NIR pulses are recombined on a 1 mm ZnSe window, which serves as dichroic mirror, after which the pulses are overlapped on a CCD camera (DR-328G-CO2-SIL Clara, Andor). Temporal overlap is controlled through a mechanical delay stage (GTS150, Newport). The MIR imaging system consists of two 100 mm CaF2 lenses, resulting in a 1:1 imaging system with NA = 0.015. The incident angle of the MIR beam on the sample is less than 5°, resulting in an error for z-height determination of less than a percent. All experiments are performed with fixed MIR and NIR irradiances of 3.5 GW/cm2 and 2.7 GW/cm2, respectively, on the camera chip. Further details can be found in Supplement 1 Table 1. For the given pulse spectral bandwidth and camera parameters, the NTA efficiency curve is flat for MIR tuning in the 2600‒3000 cm‒1 spectral range and decreases for lower energies beyond ~2500 cm‒1 because of MIR absorption by the camera’s protective window (Supplement 1 Fig. S2). On the higher energy side, the accessible spectral range is limited by the light source and the available photon energies through difference frequency mixing.
Fig. 1.
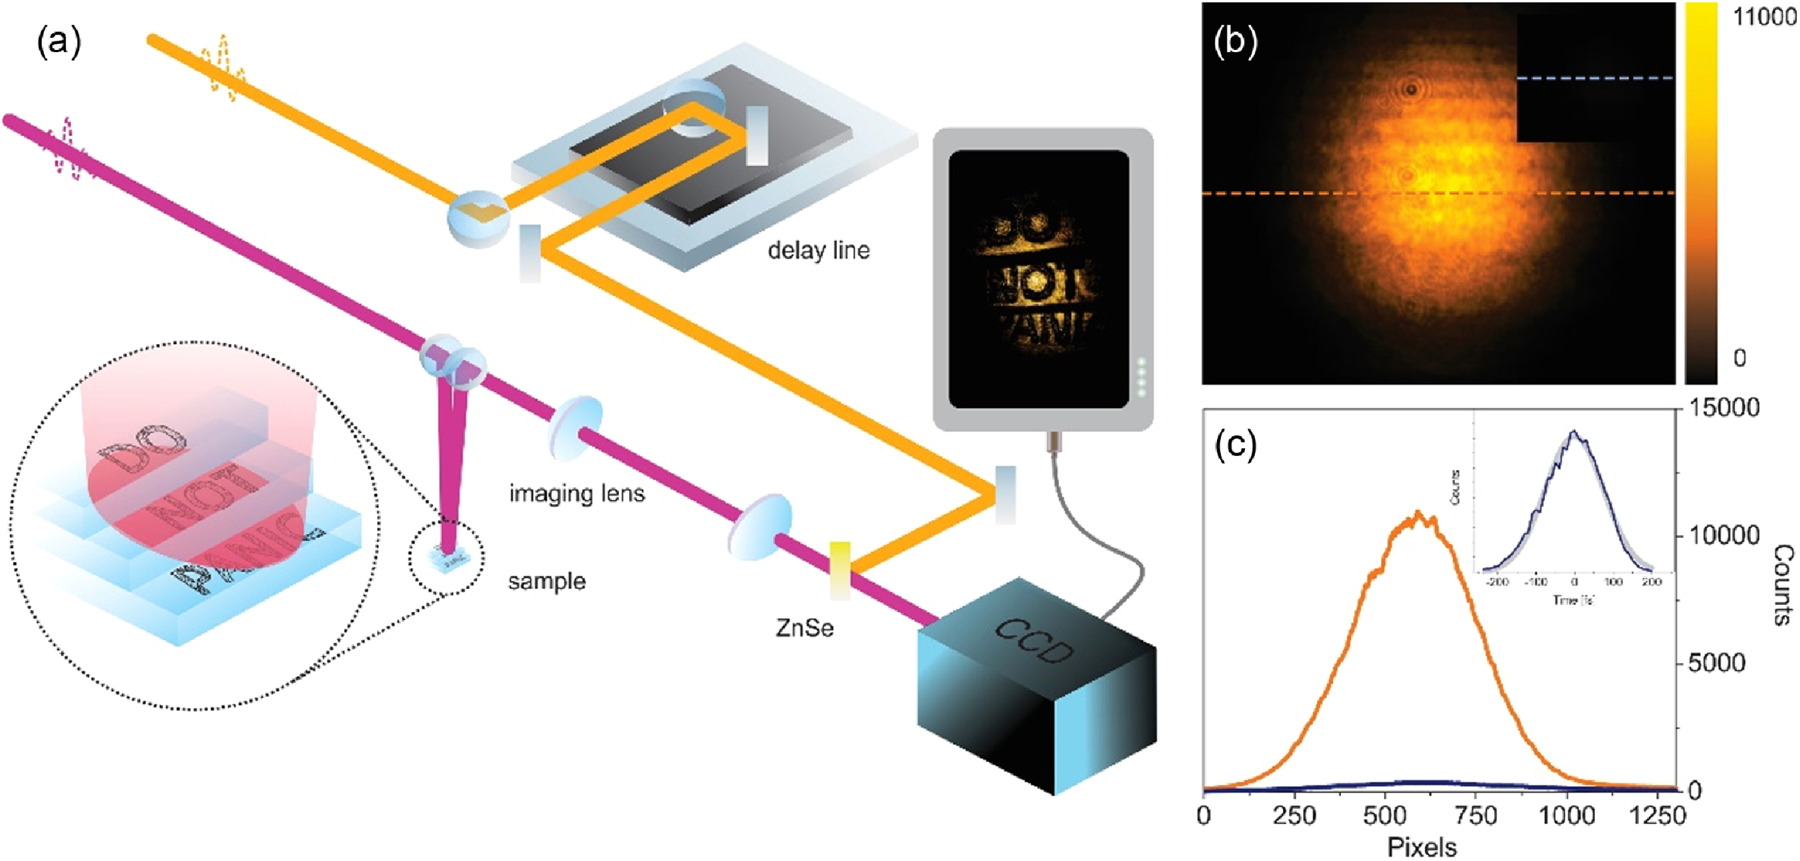
(a) Schematic representation of the setup. (b) Beam image on the CCD Si chip with MIR (2850 cm‒1, 3500 nm) and gate NIR pulses (8333 cm‒1, 1200 nm). The inset shows a gate pulse DTA image at the same scale. (c) Spatial cross section of the beam image on CCD Si chip with (NTA, orange line) and without MIR pulse (DTA, blue line). Inset: temporal cross-correlation of MIR and gate pulse, indicating a 110 fs pulse width (gray line—Gaussian fit).
C. Polymer Structure Fabrication
The computer-aided design models of the structures (SolidWorks) are virtually sliced into 2D layers with a slice thickness of 20 µm. Mask projection images are generated for each layer [39]. The exposure time of each layer is adjusted based on the light intensity and the photosensitivity of the printing material (ranging from 5 to 8 s) to improve the fabrication accuracy. The UV-curing photopolymer resin from Elegoo Inc. is used for structure fabrication due to its desired IR property. The resin is used directly without modification.
In the projection-based stereolithography process, the photocurable resin is deposited on the surface of a transparent resin tank. To generate the 2D patterned light beam, 405 nm wave-length light is reflected by a digital micromirror device (DMD) comprised of a 1920 × 1080 array of micromirrors, and the brightness of each pixel in the projected light beam is controlled by adjusting the angle of the corresponding micromirror in the DMD.
D. Confocal Imaging of Coin Structure
The 3D images are acquired with a Leica SP8 Dive microscope operated in the reflectance confocal imaging mode using a 532 nm light source and a 10 ×, 0.3 NA objective. The images are acquired as z-stacks of mosaics (adjacent fields of view stitched together). The area of each en-face mosaic frame is 13.5 × 9.3 mm, and the distance between the frames in the z-stack is 5 µm.
E. Lysozyme Crystals Growing and Handling
Hen egg white lysozyme is purchased from Fisher Scientific (ICN19530325). The lyophilized powder is dissolved to 20 mg/mL in 100 mM sodium acetate at pH 4.5. Batch crystallization is performed with the lysozyme solution in a 1:1 ratio with 1 M NaCl in 100 mM sodium acetate at pH 4.5.
3. RAPID MIR 3D IMAGING
Our experimental concept is schematically depicted in Fig. 1(a). Two 100 fs pulse trains, a tunable MIR beam, and a fixed 1200 nm (8333 cm‒1) NIR gate are spatially overlapped on the Si chip of a CCD camera. The MIR beam path passes onto the sample, and the reflected/scattered light is collected by a 100 mm CaF2 lens that projects an image of the sample onto the CCD in a 1:1 fashion (effective NA ~ 0.015). The lateral spatial resolution is characterized as 100 µm, which is diffraction limited for the effective NA of the imaging lens [25]. Note that the spatial resolution can be easily improved through the use of higher NA optics. An NTA signal is generated in the Si chip whenever the MIR temporally overlaps with the NIR gate pulse. The temporal gate, determined by the cross-correlation of the pulses, selectively registers MIR light that has traveled a preset path length. This allows depth-dependent detection of reflected/scattered light off the illuminated sample interface. In this wide-field imaging geometry, acquisition of a full 3D scan requires a single axis scan of the time delay. In principle, this strategy enables 3D imaging with volumetric acquisition rates limited only by the frame rate of the CCD camera.
Figure 1(b) shows an image of the MIR beam profile (2850 cm‒1, 3500 nm) acquired through NTA. Compared to previous work based on picosecond pulses [25], the increased irradiance of femtosecond pulses used here enables more efficient NTA detection. While the background contribution to the signal S from degenerate two-photon absorption (DTA) of the gate pulse is quadratic with gate irradiance Igate, the NTA contribution is linear in both MIR and gate pulse irradiance [15,22,25]:
where α2 is the nonlinear absorption coefficient given as
Here, Egap is the bandgap energy, ni is the refractive index at frequency ωi , and is the photon energy at ωi , normalized to the bandgap energy. The intensity ratio between the MIR and the gate pulse can be chosen such that the linear dependence dominates over the quadratic term, thus raising the NTA signal relative to the DTA background induced by the gate pulse. This is highlighted in the inset of Fig. 1(b), which shows the DTA background signal when the Si chip is exposed only to the gate pulse. The NTA to DTA background signal is 34 dB [10 * log10(SNTA/σDTA), standard deviation ~1%, 100 ms per frame, Supplement 1 Fig. S1] at the center of the beam profile, with a ratio up to 40 dB toward the wings of the intensity distribution. While the signal-to-background ratio [SBR 10 * log10(SNTA/SDTA)] is 15 dB, the signal-to-noise ratio determined through the mean power root [SNR=20 log10(SNTA/σDTA)] is estimated as 68 dB (80 dB toward the wings) [40]. The high signal-to-background ratio permits imaging without modulation/demodulation techniques, beam profile/intensity precharacterization, or postprocessing of the images.
Other than in MIR OCT, where the axial resolution is determined by the spectral width of the light source via interferometric gating, in NTA tomographic imaging the resolution is determined by the temporal cross-correlation of the MIR and gate pulses. The inset of Fig. 1(c) shows the cross-correlation of pulses at the camera chip, indicating a MIR pulse width of ~110 fs (FWHM) assuming a Gaussian pulse shape. This temporal pulse width corresponds to an axial resolution of ~15 µm (FWHM) or 12.7 µm (1/2e2) in vacuum (Supplement 1 Fig. S5). Note that the axial resolution is much higher than the resolution set by the Rayleigh range of the imaging system for the MIR beam (NA = 0.015, zR > 3 mm), and it is comparable to the confocal resolution offered by a NA > 0.65 lens.
We first perform 2D imaging to illustrate the image quality of the technique. In Visualization 1, we show a live recording of Tetramorium caespitum (pavement ant) moving freely on a glass microscope slide. At the low MIR illumination levels of 1 mW/cm2, the ant is active and appears unaffected by the radiation. It is interesting to observe that the chitin exoskeleton of the legs appears darker when the MIR is tuned to 2850 cm‒1, while it appears semitransparent when tuned to 2450 cm‒1. The different contrast reflects the differences in MIR absorption of chitin, a polysaccharide rich in CH2 groups (Supplement 1 Fig. S2).
We next study the 3D imaging capabilities of the wide-field NTA method by controlling the time delay between the MIR and NIR pulses. Figure 2(a) depicts a 3D image of a one cent US coin. This reconstruction is comprised of individual 2D wide-field images acquired at 100 ms/frame using 10 steps along the axial dimension, corresponding to a ~75 µm sample height and an effective total acquisition time of 1 s. Two optical slices of the data stack are shown in Figs. 2(b) and 2(c), depicting the rectangular pillars of the Union Shield at different heights. The axial difference between these 2D layers is 30 µm, which corroborates the height of the structures as revealed with confocal microscopy (Supplement 1 Fig. S3).
Fig. 2.
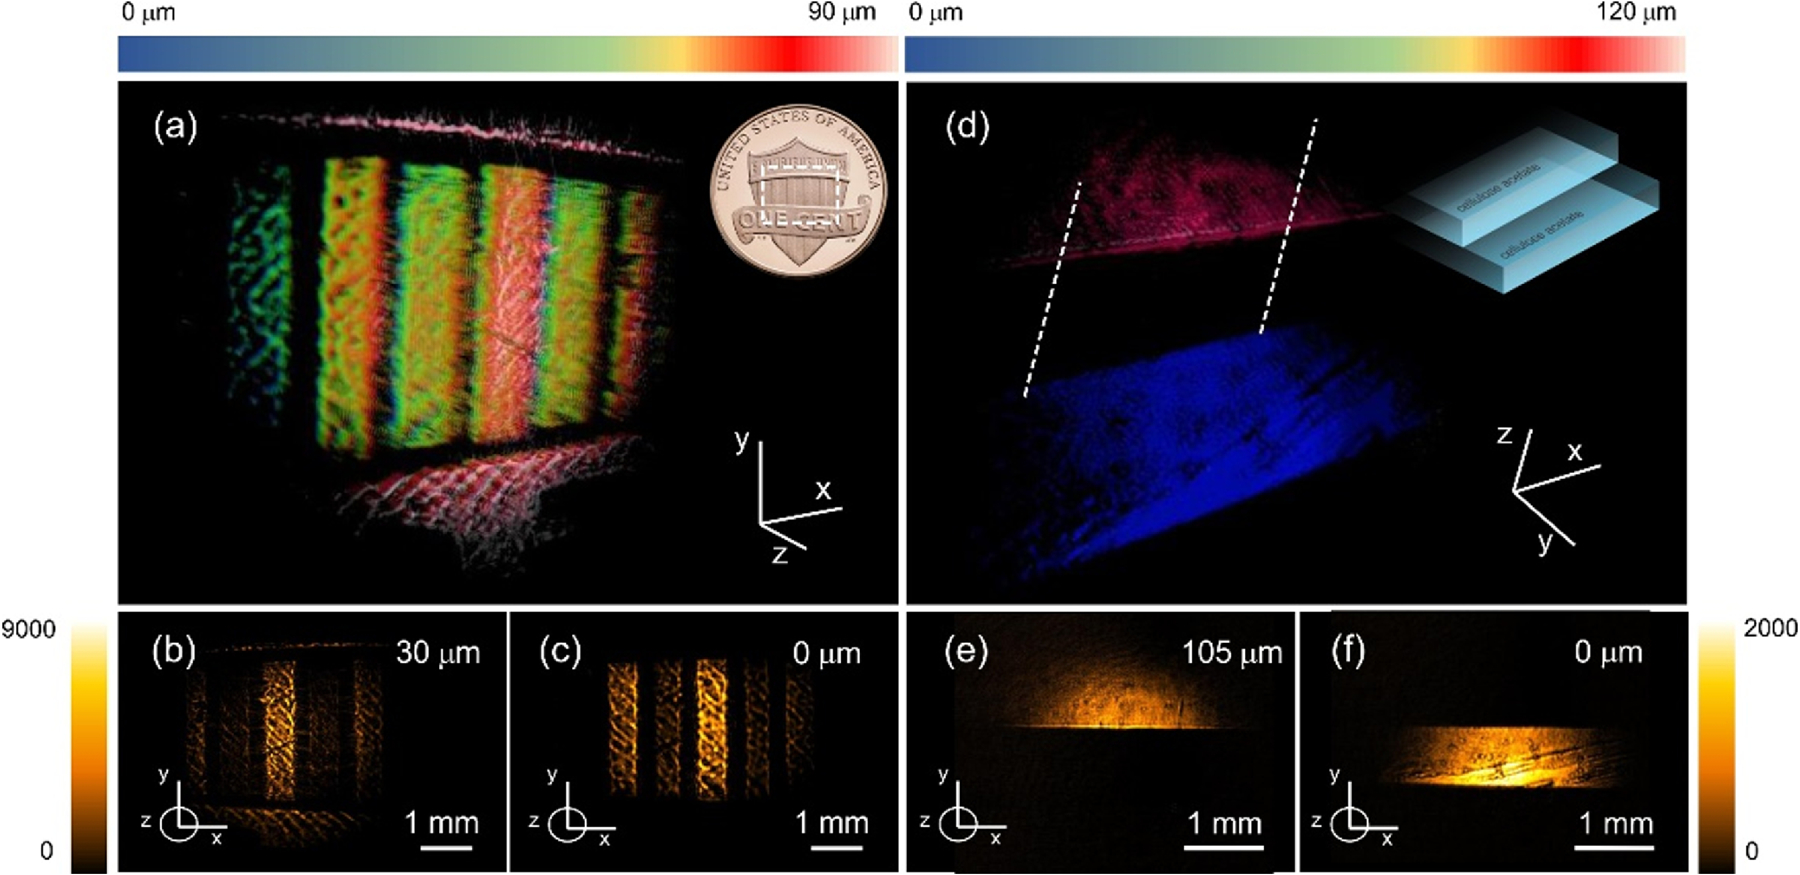
(a)–(c) Tomographic imaging of the structured metal surface of a one cent US coin (Union Shield). (a) 3D reconstruction; (b) and (c) frames measured at height h = 30 µm and h = 0 µm, respectively. (d)–(f) Tomographic imaging of stacked cellulose acetate sheets, a weakly reflecting polymer structure. (d) 3D reconstruction; (e) and (f ) 2D frames taken at the top of each sheet (∆h = 105 µm). Total 3D scan time is 1 s.
Whereas reflection/scattering off metal/air interfaces allows high-contrast imaging, in Fig. 2(c) we show that NTA-enabled detection also permits tomographic imaging of materials with a refractive index much closer to that of air. For this purpose, we used a polymer structure, consisting of a two-step ladder comprised of two 100 µm thick cellulose acetate sheets. The image reveals a~105 µm step size of the ladder, which closely matches the actual sheet thickness. The small difference between these values is attributed to flatness variations of the sheets, causing slight variations in the step size.
4. 3D IMAGING THROUGH TRANSPARENT AND HIGHLY ABSORBING MEDIA
Compared to tomographic imaging in the visible range, MIR-based tomography benefits from reduced light scattering in various solids, permitting imaging through thicker materials. To illustrate this point, we perform tomographic imaging of a coin hidden behind a 3 mm GaAs wafer, shown schematically in Fig. 3(a). Although GaAs shows minimal absorption at the 2850 cm‒1 energy of the MIR pulse, reflection at the wafer’s top and bottom surfaces reduces the overall transmission of MIR light by 75% in the double-pass configuration (Supplement 1 Fig. S4). Figure 3(b) shows that, despite these losses, tomographic images of the coin’s features can still be clearly distinguished. Moreover, the weak reflection off a three-step cellulose acetate ladder provides sufficient backscattered light for collecting a 3D image, depicted in Fig. 3(c), even though it is covered by a visibly opaque material of high refractive index.
Fig. 3.
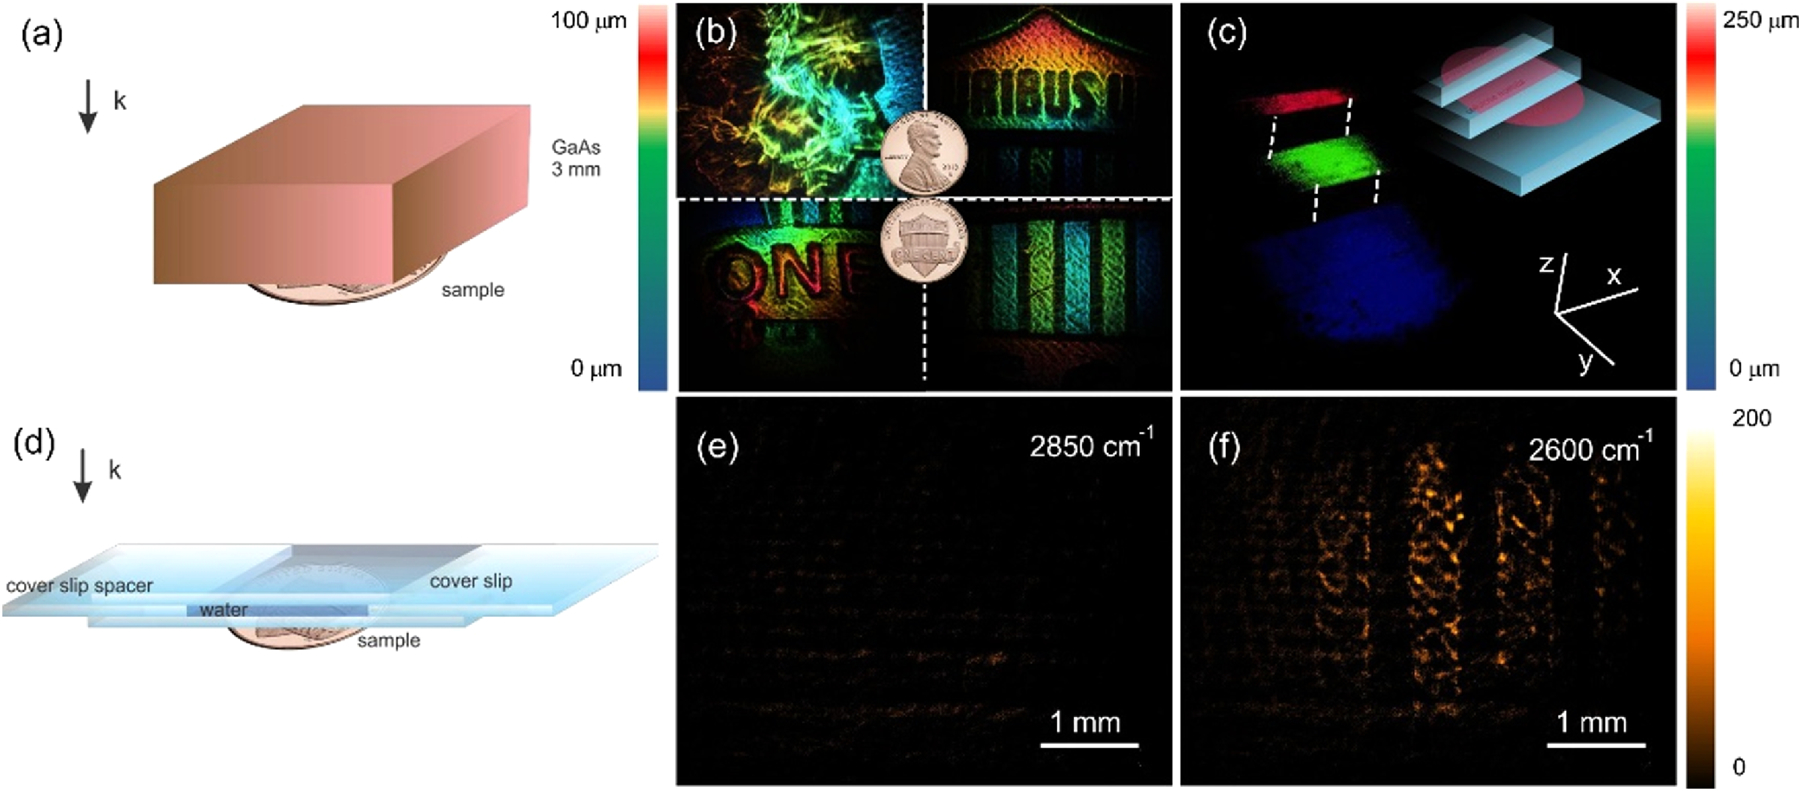
Sketch of penetration experiment arrangement through (a) 3 mm thick GaAs wafer and (d) 190 µm water layer. (b) 3D reconstruction of one cent US coin (Union Shield) through 3 mm GaAs wafer. (c) Tomographic imaging of stacked cellulose acetate sheets through 3 mm GaAs wafer. Imaging of one cent US coin (Union Shield) through 190 µm water layer (380 µm in double pass) at (e) 2850 cm‒1 and (f ) 2600 cm‒1.
The detection sensitivity afforded by femtosecond (fs)-NTA on the CCD camera also enables detection of objects placed under strongly absorbing materials. In Fig. 3(d), we covered the coin with a 190 µm layer of deionized water. Water displays a strong MIR absorption due to the OH-stretching modes, which peaks in the 3000‒3500 cm‒1 range, with broad wings that extend to lower energies beyond 2600 cm‒1. In Fig. 3(e), the coin is visualized when the MIR energy is set to 2850 cm‒1, showing low signal due to the strong water absorption. At this setting, a double pass through the water layer amounts to a MIR intensity loss of OD > 4 (Supplement 1 Fig. S5). When tuned to 2650 cm‒1, however, a two-dimensional image of the coin surface can be observed under the water at a 100 ms exposure time, despite a MIR transmission loss of OD > 2. Here, the much lower signal levels necessitate subtraction of the DTA background (~200 counts), yet the results underline that fs-NTA detection is sensitive enough to retrieve MIR images even in the presence of thick water layers.
5. CHEMICAL-SENSITIVE TOMOGRAPHIC IMAGING
One of the most promising aspects of MIR tomographic imaging is the possibility to generate chemically selective images of 3D objects. Using fs-NTA detection, we illustrate this principle by producing 3D images of the cellulose acetate ladder at different vibrational energies, shown in Fig. 4(a). To enhance contrast, letters have been printed on each layer using black ink. The FTIR spectrum of cellulose acetate is plotted in Fig. 4(b). Based on the theory of external MIR reflectance spectroscopy [41–43], we may expect strong reflection off cellulose acetate when tuning to the red side of the CH-stretching vibration, where the real part of the complex refractive index displays a local maximum. When tuning to 2875 cm‒1, near the peak of the CH-stretching band, a bright tomographic image is obtained as illustrated by the two projections in Figs. 4(c) and 4(d). At lower energies away from the resonance, the refractive index is expected to decrease, resulting in reduced reflection off the interface of the cellulose acetate material. This is indeed observed in Figs. 4(e) and 4(f), where the 3D image acquired at 2600 cm‒1 is now significantly less bright compared to the near-resonance condition at 2875 cm‒1.
Fig. 4.
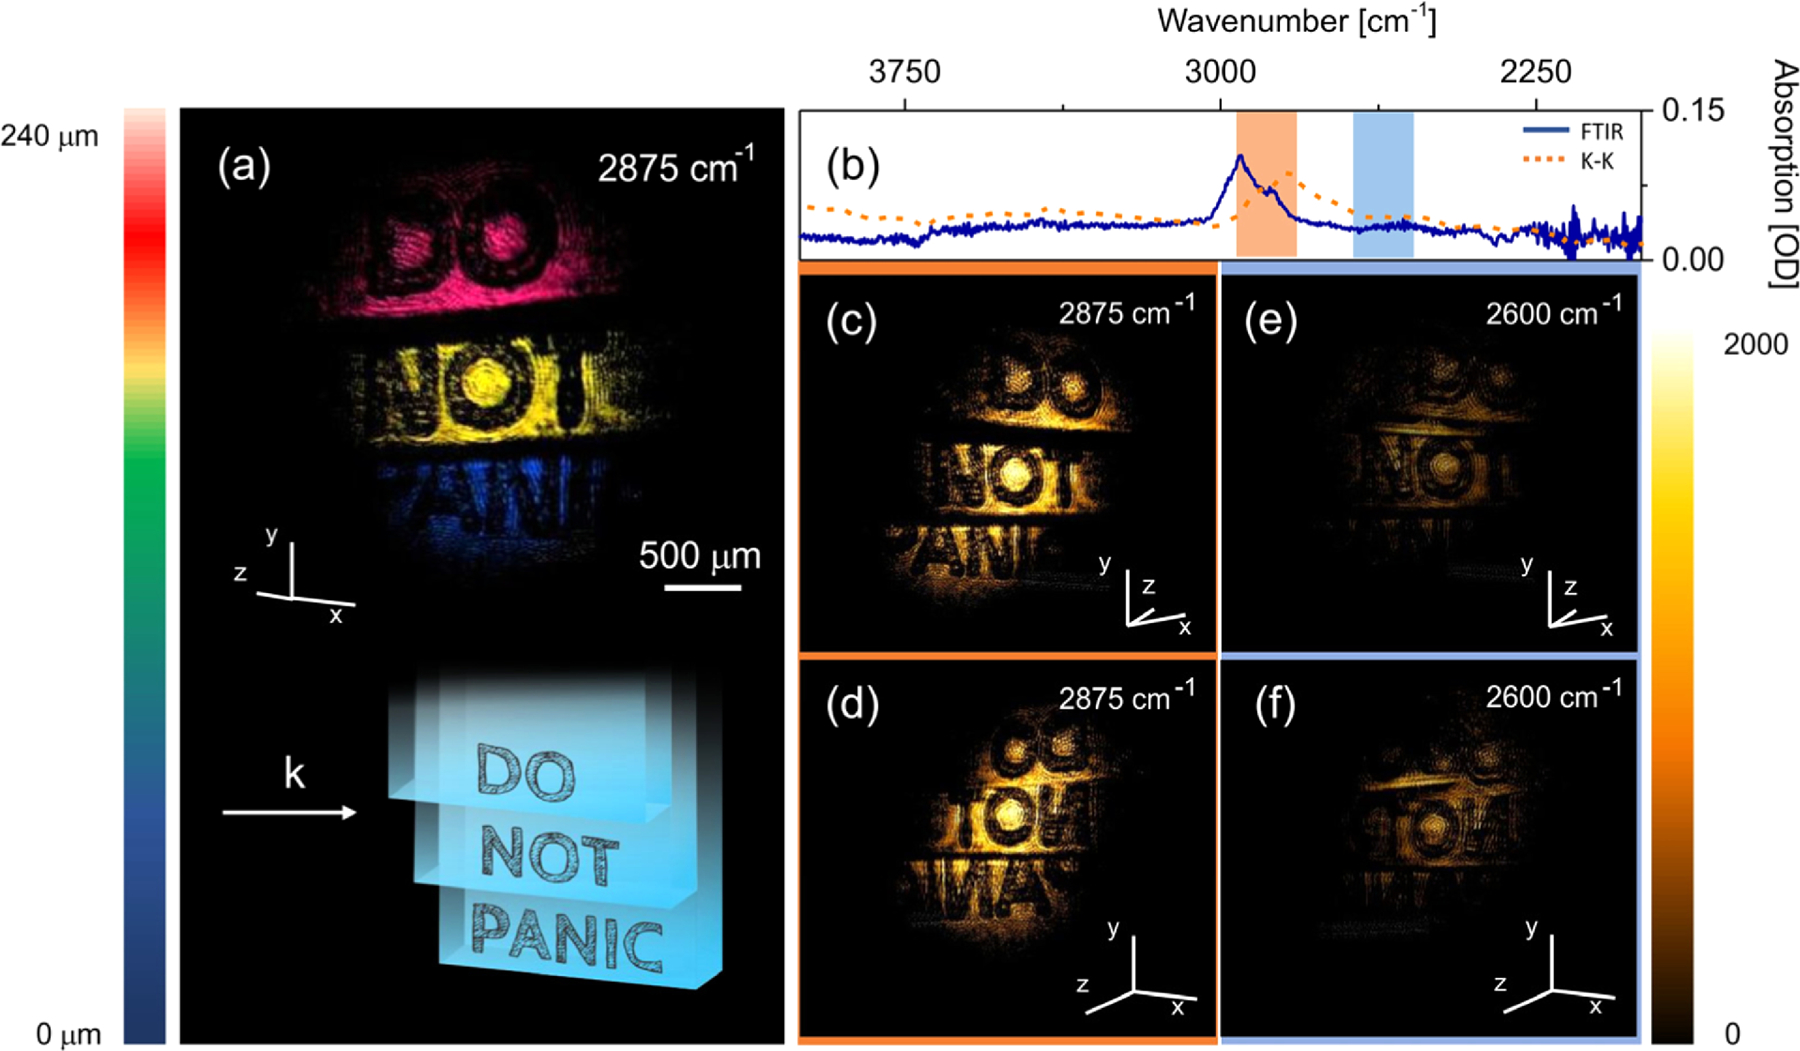
3D imaging of stacked cellulose acetate sheets with printed letters. (a) 3D reconstruction of the structure. (b) FTIR transmission spectrum of cellulose acetate (blue line) and real part of the refractive index obtained through a Kramers–Kronig transformation (orange dotted line). Rectangles represent Gaussian pulse width of ∼150 cm‒1. (c) and (d) 3D imaging at 2875 cm‒1; (e) and (f ) 3D imaging at 2600 cm‒1. Total image acquisition time is 1 s.
The reduced reflection at 2600 cm‒1 enhances light penetration in the sample, which allows collection of signal contributions from lower lying interfaces. As shown in Supplement 1 Fig. S5, signals from the buried interfaces (surface 2ʹ and 3ʹ in Fig. S6) are clearly observed in the off-resonance condition. Since the optical path length is determined by the refractive index of the material, the apparent depth of the buried interfaces differs from that of the corresponding air-exposed interfaces (surface 2 and 3 in Fig. S6). From this time/optical path difference, we estimate the refractive index of cellulose acetate to be ~1.5 at 2600 cm‒1, resulting in a 4% Fresnel reflection at the sheet/air interface.
We next show 3D images of polymer structures fabricated with a projection-based photolithography technique (see Section 2). A visible image of the structure is shown in the inset of Fig. 5(a), and the relevant part of the FTIR spectrum of the polymer is given in Fig. 5(b). We observe increased signals from the structure’s top surface when the MIR energy is tuned into near resonance with the material’s CH-stretching vibrational mode [Figs. 5(c) and 5(d)] and lower signals when the MIR energy is tuned off-resonance [Figs. 5(e) and 5(f)]. Due to the shape of the structure, significant light scattering occurs at angles beyond the collection NA of the imaging system, producing darker regions at curved surfaces.
Fig. 5.
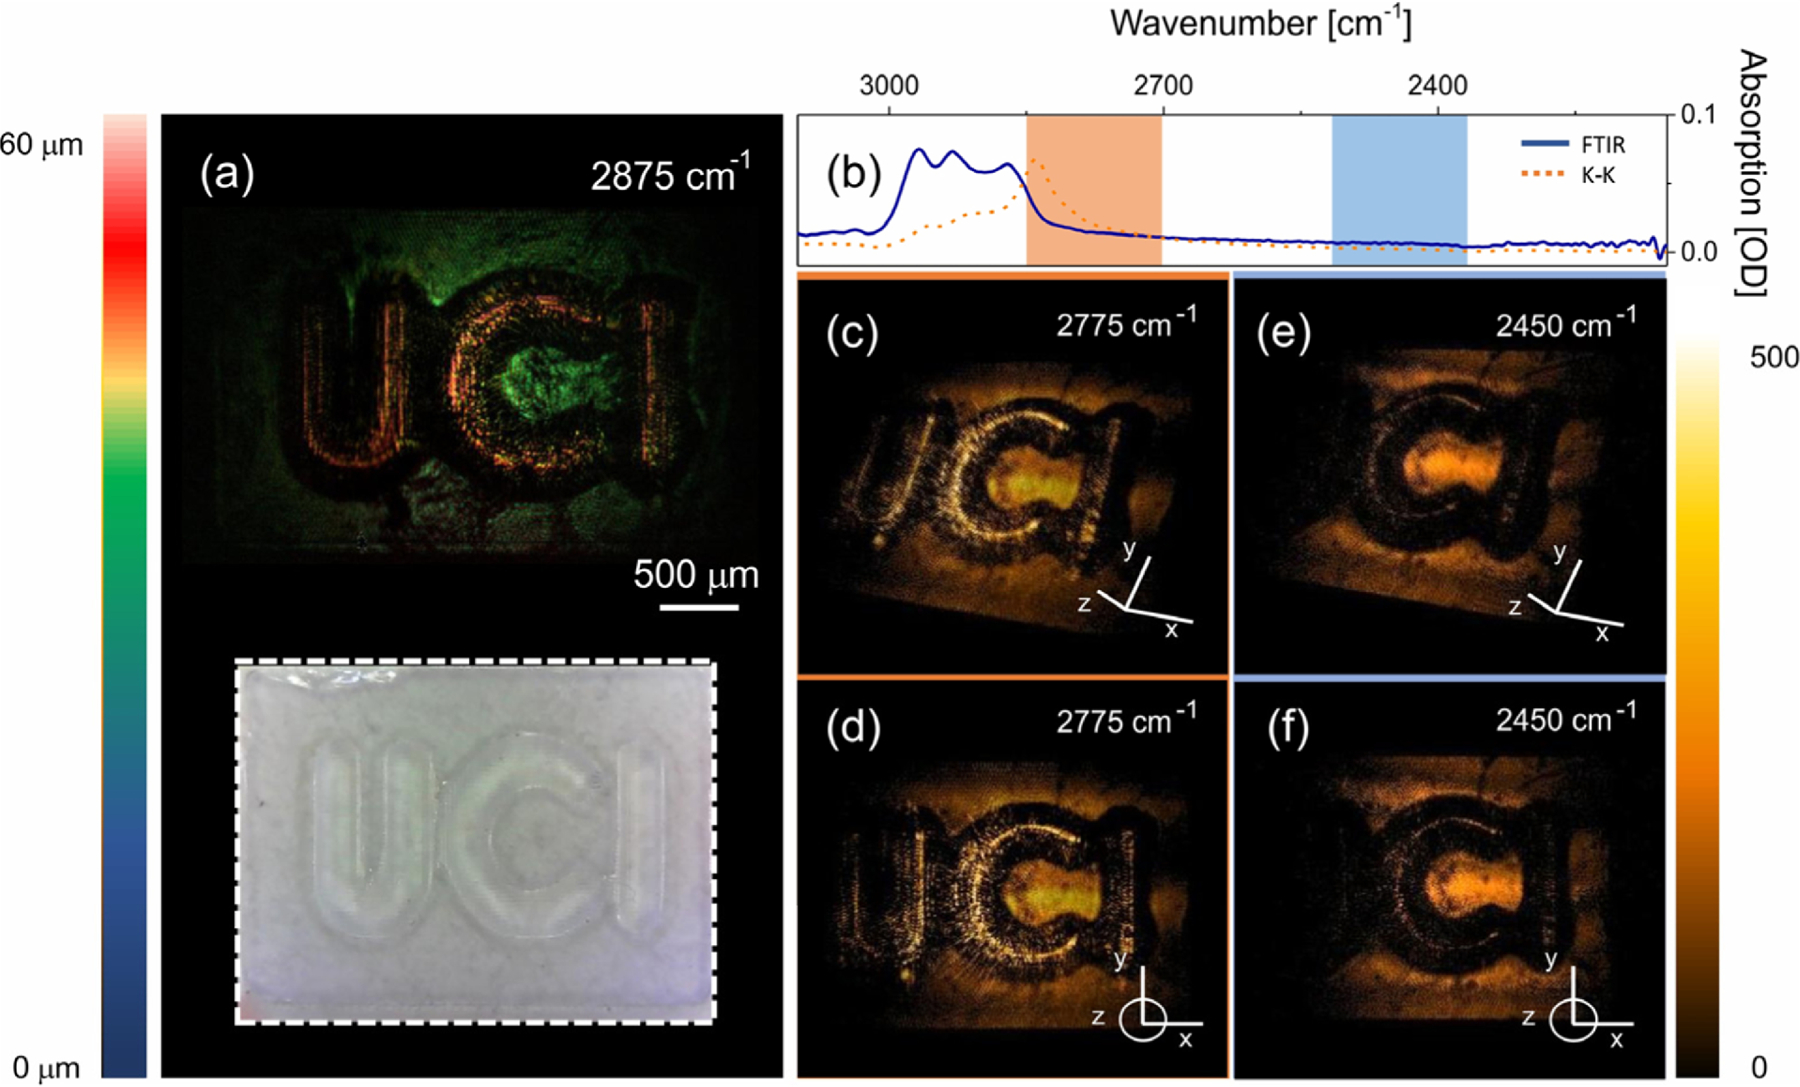
3D imaging of a resin structure manufactured through projection-based photolithography technique. (a) 3D reconstruction of resin structure. (b) FTIR absorption spectrum of the resin (blue line) and real part of the refractive index obtained through a Kramers–Kronig transformation (orange dotted line). Rectangles represent Gaussian pulse width of ~150 cm‒1. (c) and (d) 3D imaging at 2775 cm‒1; (e) and (f ) 3D imaging at 2450 cm‒1. Structure height is ~50 µm. Images have been corrected for non-spectroscopic, spectral NTA efficiency variations (see Supplement 1 Fig. S2). Total image acquisition time is 1 s.
Last, we perform MIR tomography of a hydrated protein crystal. In Fig. 6, we show a 3D reconstruction of lysozyme crystals. The lysozyme enzyme forms stable tetragonal crystals that can grow to millimeter scales. The structure visualized in Fig. 6(a) is composed of an aggregate of smaller crystals, while Fig. 6(b) shows a 3D image of a single crystal. The spectral dependence of the signal from a single surface is presented in Figs. 6(c)–6(e), confirming the chemical contrast encoded in the MIR light scattered onto the detector.
Fig. 6.
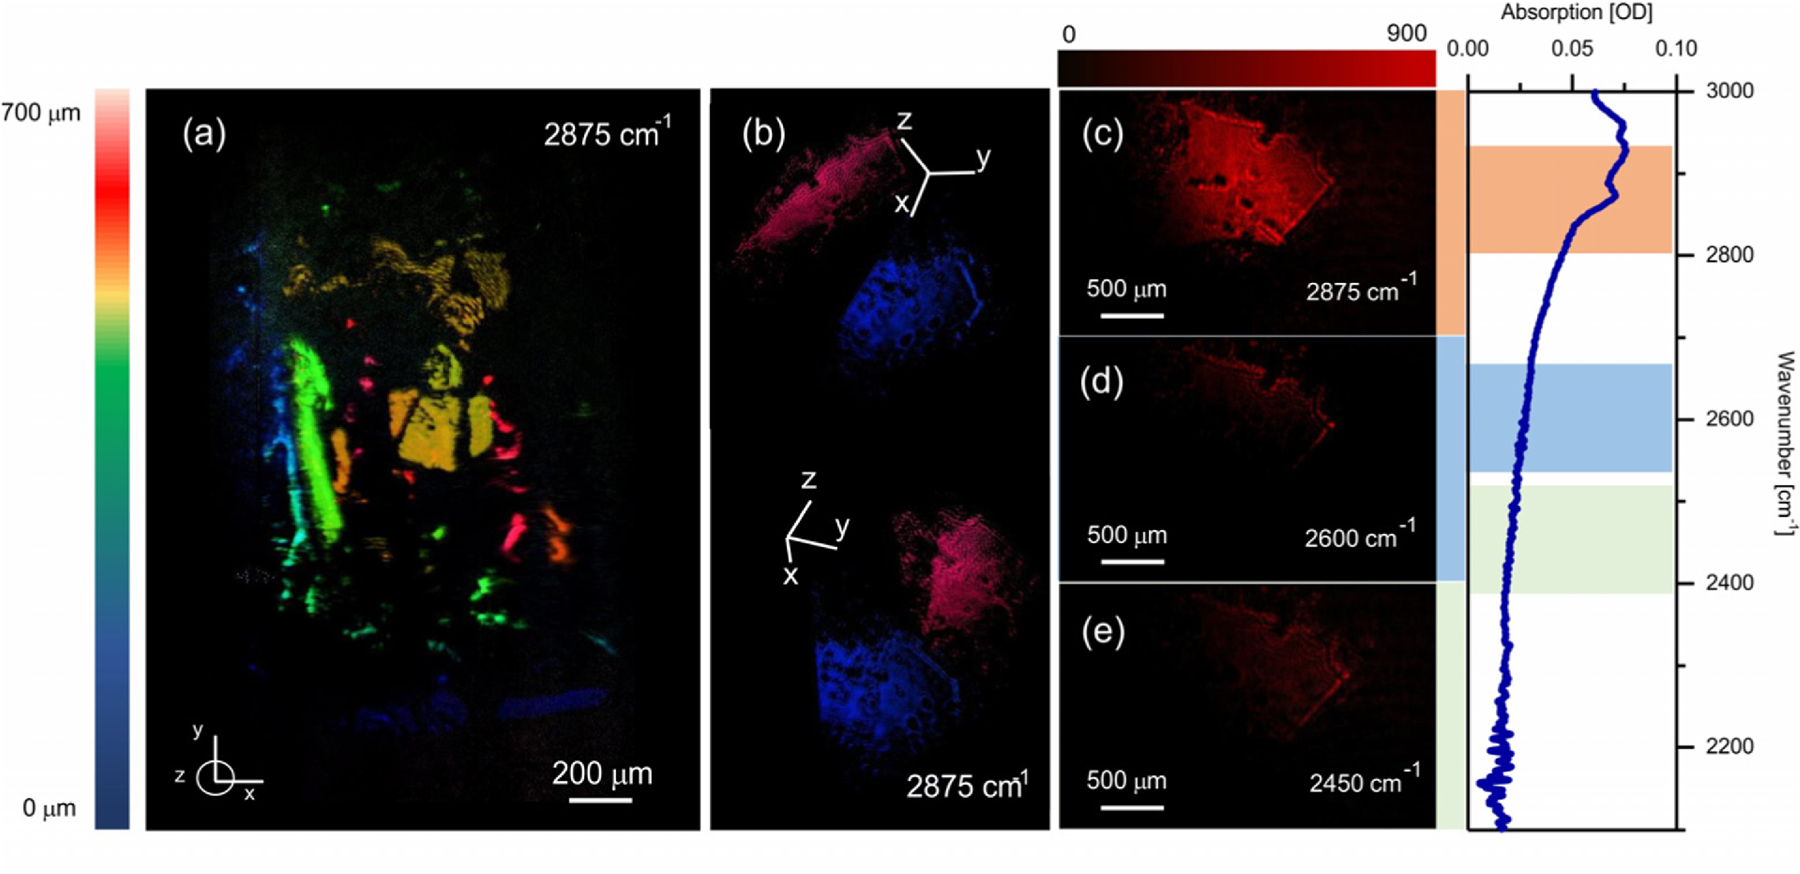
Imaging of different lysozyme crystals on mica glass. (a) 3D reconstruction of lysozyme crystal cluster at 2875 cm‒1. (b) 3D reconstruction of a single crystal. 2D image of the crystal’s top face taken at (c) 2875 cm‒1, (d) 2600 cm‒1, and (f ) 2450 cm‒1. Images have been corrected for non-spectroscopic, spectral NTA efficiency variations (see Supplement 1 Fig. S2). FTIR absorption spectrum of lysozyme is shown on the far right.
6. DISCUSSION
In this work, we have discussed wide-field fs-NTA detection in Si cameras for enabling high-definition MIR tomographic imaging at high acquisition rates. This development builds on the recent advance of wide-field NTA-enabled MIR imaging by extending this detection principle to 3D imaging mapping, optimally leveraging the time-gating property of fs-NTA. Our technology is fundamentally different from existing OCT techniques that operate in the MIR. The most promising MIR-OCT approaches are currently based on the Fourier-domain OCT (FD-OCT) [44,45], which accomplishes depth scans (A-scan) or cross-sectional scans (B-scans) on a time scale set by the spectral acquisition time of the detector. This detection strategy has been successfully translated to MIR-OCT using both classical [12] or quantum [29] light, with A-scans acquired in just under 10 ms. However, in combination with lateral raster scanning, such imaging conditions translate into rather long total volume acquisition times of minutes/volume, extended further in duration by necessary referencing and postprocessing.
In contrast, volumetric imaging through fs-NTA uses different mechanisms for capturing information along the lateral and axial dimensions. First, fs-NTA uses a wide-field detection approach, which allows detection of both lateral dimensions in a single shot. The massively parallel detection enabled by Mpx camera chips provides a dramatic gain of the effective acquisition rate. We have used an off-the-shelf CCD camera, with an effective readout time of 10 Hz. However, by using modern sCMOS cameras, which feature higher quantum yields and faster readout times, the image acquisition time can easily be improved by another 2 orders of magnitude. Second, the axial information in fs-NTA tomography is retrieved through a scan of the time delay between the MIR and the gate pulses. Scanning along this dimension can be accomplished with automated translation stages over 1 mm distances, with 1.5 µm (6 fs) repeatability and 2 ms response times. Hence, the total 3D acquisition time is limited primarily by the 2D image acquisition time of the camera. While in this work we report a total effective acquisition time of 1 s (10 frames/s, 10 axial steps) for the 3D data stack, it is evident that selection of a better camera would allow for volumetric imaging at much higher rates.
Compared to spectral interferometry approaches, volumetric imaging with fs-NTA is significantly more robust. First, it is not vulnerable to spectral shifts associated with small temperature changes of external nonlinear media, which may require recurring acquisition of multiple reference spectra [29,46]. Second, in contrast to upconversion techniques, fs-NTA mapping avoids the practical complication of phase matching between the MIR and upconversion pulses within the nonlinear medium [16,24,28]. Wide-field fs-NTA requires no DTA-background subtraction nor multiple processing steps to retrieve the MIR signal. Instead, 2D images are acquired in single-shot mode, allowing rapid and unimpeded axial scans for collecting 3D data stacks. For our current imaging conditions, the signal-to-noise ratio (SNR) of each frame is 68 dB for a 100 ms integration time, determined by using a gold mirror as the sample. The NTA to DTA background ratio is 15 dB, which is sufficiently high for enabling imaging under virtually background-free conditions.
We have shown that MIR tomographic imaging enabled by fs-NTA exhibits chemical contrast based on vibrational resonances of the sample. Although the spectral resolution is limited by the band-width of the MIR pulse (<150 cm‒1), the spectroscopic contrast imparted by the sample’s vibrational modes is clearly observed. It is nontrivial to achieve similar contrast with conventional FD-OCT methods, where spectroscopic imprints are difficult to retrieve in the presence of the strong interferometric modulations of the detected spectrum. Therefore, although MIR-OCT is recognized for its greater penetration depth, chemically selective imaging has remained a challenge. As our experiments show, chemical contrast appears rather naturally when the fs-NTA detection approach is used.
Finally, we note that our current work utilizes a light source based on a low repetition rate amplified laser system. Such amplified pulses, however, are not a prerequisite for the demonstrated imaging capabilities. We have previously shown that a detection sensitivity of only a few femtojoule (fJ)/pulse per pixel can be achieved with picosecond (ps) pulses derived from a high repetition rate ps light source [25]. Similar experiments with shorter femtosecond (fs) pulses will require only a few attojoules (aJ) of MIR radiation on a single camera pixel. Emerging developments in ultrafast fiber-based lasers promise to provide such high repetition rate fs pulses, underlining the potential of rapid fs-NTA tomography with affordable and compact light sources.
Supplementary Material
Supplemental document. See Supplement 1 for supporting content.
Acknowledgment.
D.A.F. thanks Prof. Alexander Fishman for fruitful discussions and support. E.O.P. acknowledges NIH R01GM132506. R.W.M. and B.N.-B. would like to acknowledge NSF BMAT DMR-2002837 and the NSF GRFP. Y.C. would like to acknowledge the support of the NSF grant CMMI 1151191. A.D., A.F., and M.B. would like to acknowledge NIH award 1S10OD028698. We thank the Laser Spectroscopy Labs.
Funding. National Institutes of Health (1S10OD028698, R01GM132506); National Science Foundation (CMMI 1151191, GRFP, DMR-2002837).
Footnotes
Disclosures. The authors declare no conflicts of interest.
Data availability. Data underlying the results presented in this paper are not publicly available at this time but may be obtained from the authors upon reasonable request.
REFERENCES
- 1.Bhargava R, “Infrared spectroscopic imaging: the next generation,” Appl. Spectrosc 66, 1091–1120 (2012). [DOI] [PMC free article] [PubMed] [Google Scholar]
- 2.Wetzel DL and LeVine SM, “Imaging molecular chemistry with infrared microscopy,” Science 285, 1224 (1999). [DOI] [PubMed] [Google Scholar]
- 3.Wang Y, Wang Y, and Le HQ, “Multi-spectral mid-infrared laser stand-off imaging,” Opt. Express 13, 6572–6586 (2005). [DOI] [PubMed] [Google Scholar]
- 4.Cheung C, Daniel JMO, Tokurakawa M, Clarkson WA, and Liang H, “High resolution Fourier domain optical coherence tomography in the 2 µm wavelength range using a broadband supercontinuum source,” Opt. Express 23, 1992–2001 (2015). [DOI] [PubMed] [Google Scholar]
- 5.Colley CS, Hebden JC, Delpy DT, Cambrey AD, Brown RA, Zibik EA, Ng WH, Wilson LR, and Cockburn JW, “Mid-infrared optical coherence tomography,” Rev. Sci. Instrum 78, 123108 (2007). [DOI] [PubMed] [Google Scholar]
- 6.Guilhaumou N, Dumas P, Carr GL, and Williams GP, “Synchrotron infrared microspectrometry applied to petrography in micrometer-scale range: fluid chemical analysis and mapping,” Appl. Spectrosc 52, 1029–1034 (1998). [Google Scholar]
- 7.Ishida S and Nishizawa N, “Quantitative comparison of contrast and imaging depth of ultrahigh-resolution optical coherence tomography images in 800–1700 nm wavelength region,” Biomed. Opt. Express 3, 282–294 (2012). [DOI] [PMC free article] [PubMed] [Google Scholar]
- 8.Jamme F, Lagarde B, Giuliani A, Garcia GA, and Mercury L, “Synchrotron infrared confocal microscope: application to infrared 3D spectral imaging,” J. Phys. Conf. Ser 425, 142002 (2013). [Google Scholar]
- 9.Martin MC, Dabat-Blondeau C, Unger M, Sedlmair J, Parkinson DY, Bechtel HA, Illman B, Castro JM, Keiluweit M, Buschke D, and Ogle B, “3D spectral imaging with synchrotron Fourier transform infrared spectro-microtomography,” Nat. Methods 10, 861–864 (2013). [DOI] [PubMed] [Google Scholar]
- 10.Sharma U, Chang EW, and Yun SH, “Long-wavelength optical coherence tomography at 1.7 µm for enhanced imaging depth,” Opt. Express 16, 19712–19723 (2008). [DOI] [PMC free article] [PubMed] [Google Scholar]
- 11.Zorin I, Gattinger P, Brandstetter M, and Heise B, “Dual-band infrared optical coherence tomography using a single supercontinuum source,” Opt. Express 28, 7858–7874 (2020). [DOI] [PubMed] [Google Scholar]
- 12.Zorin I, Su R, Prylepa A, Kilgus J, Brandstetter M, and Heise B, “Mid-infrared Fourier-domain optical coherence tomography with a pyroelectric linear array,” Opt. Express 26, 33428–33439 (2018). [DOI] [PubMed] [Google Scholar]
- 13.Bai Y, Zhang D, Lan L, Huang Y, Maize K, Shakouri A, and Cheng JX, “Ultrafast chemical imaging by widefield photothermal sensing of infrared absorption,” Sci. Adv 5, eaav7127 (2019). [DOI] [PMC free article] [PubMed] [Google Scholar]
- 14.Cirloganu CM, “Experimental and theoretical approaches to characterization of electronic nonlinearities in direct-gap semiconductors,” Ph.D. dissertation (University of Central Florida, CREOL, 2010). [Google Scholar]
- 15.Cirloganu CM, Padilha LA, Fishman DA, Webster S, Hagan DJ, and Van Stryland EW, “Extremely nondegenerate two-photon absorption in direct-gap semiconductors [Invited],” Opt. Express 19, 22951–22960 (2011). [DOI] [PubMed] [Google Scholar]
- 16.Junaid S, Tomko J, Semtsiv MP, Kischkat J, Masselink WT, Pedersen C, and Tidemand-Lichtenberg P, “Mid-infrared upconversion based hyperspectral imaging,” Opt. Express 26, 2203–2211 (2018). [DOI] [PubMed] [Google Scholar]
- 17.Kviatkovsky I, Chrzanowski HM, Avery EG, Bartolomaeus H, and Ramelow S, “Microscopy with undetected photons in the mid-infrared,” Sci. Adv 6, eabd0264 (2020). [DOI] [PMC free article] [PubMed] [Google Scholar]
- 18.Paterova AV, Maniam SM, Yang H, Grenci G, and Krivitsky LA, “Hyperspectral infrared microscopy with visible light,” Sci. Adv 6, eabd0460 (2020). [DOI] [PMC free article] [PubMed] [Google Scholar]
- 19.Gilaberte Basset M, Hochrainer A, Töpfer S, Riexinger F, Bickert P, León-Torres JR, Steinlechner F, and Gräfe M, “Video-rate imaging with undetected photons,” Laser Photon. Rev 15, 2000327 (2021). [Google Scholar]
- 20.Paterova AV, Yang H, Toa ZS, and Krivitsky LA, “Quantum imaging for the semiconductor industry,” Appl. Phys. Lett 117, 054004 (2020). [Google Scholar]
- 21.Barh A, Rodrigo PJ, Meng L, Pedersen C, and Tidemand-Lichtenberg P, “Parametric upconversion imaging and its applications,” Adv. Opt. Photon 11, 952–1019 (2019). [Google Scholar]
- 22.Fishman DA, Cirloganu CM, Webster S, Padilha LA, Monroe M, Hagan DJ, and Van Stryland EW, “Sensitive mid-infrared detection in wide-bandgap semiconductors using extreme non-degenerate two-photon absorption,” Nat. Photonics 5, 561–565 (2011). [Google Scholar]
- 23.Johnson TA and Diddams SA, “Mid-infrared upconversion spectroscopy based on a Yb:fiber femtosecond laser,” Appl. Phys. B 107, 31–39 (2012). [Google Scholar]
- 24.Junaid S, Kumar SC, Mathez M, Hermes M, Stone N, Shepherd N, Ebrahim-Zadeh M, Tidemand-Lichtenberg P, and Pedersen C, “Video-rate, mid-infrared hyperspectral upconversion imaging,” Optica 6, 702–708 (2019). [Google Scholar]
- 25.Knez D, Hanninen AM, Prince RC, Potma EO, and Fishman DA, “Infrared chemical imaging through non-degenerate two-photon absorption in silicon-based cameras,” Light Sci. Appl 9, 125 (2020). [DOI] [PMC free article] [PubMed] [Google Scholar]
- 26.Hanninen AM and Potma EO, “Nonlinear optical microscopy with achromatic lenses extending from the visible to the mid-infrared,” APL Photon 4, 080801 (2019). [Google Scholar]
- 27.Hanninen AM, Prince RC, Ramos R, Plikus MV, and Potma EO, “High-resolution infrared imaging of biological samples with third-order sum-frequency generation microscopy,” Biomed. Opt. Express 9, 4807–4817 (2018). [DOI] [PMC free article] [PubMed] [Google Scholar]
- 28.Israelsen NM, Petersen CR, Barh A, Jain D, Jensen M, Hannesschläger G, Tidemand-Lichtenberg P, Pedersen C, Podoleanu A, and Bang O, “Real-time high-resolution mid-infrared optical coherence tomography,” Light Sci. Appl 8, 11 (2019). [DOI] [PMC free article] [PubMed] [Google Scholar]
- 29.Vanselow A, Kaufmann P, Zorin I, Heise B, Chrzanowski HM, and Ramelow S, “Frequency-domain optical coherence tomography with undetected mid-infrared photons,” Optica 7, 1729–1736 (2020). [Google Scholar]
- 30.Rojas-Santana A, Machado GJ, Lopez-Mago D, and Torres JP, “Frequency-correlation requirements on the biphoton wave function in an induced-coherence experiment between separate sources,” Phys. Rev. A 102, 053711 (2020). [Google Scholar]
- 31.Machado GJ, Frascella G, Torres JP, and Chekhova MV, “Optical coherence tomography with a nonlinear interferometer in the high parametric gain regime,” Appl. Phys. Lett 117, 094002 (2020). [Google Scholar]
- 32.Paterova AV, Yang H, An C, Kalashnikov DA, and Krivitsky LA, “Tunable optical coherence tomography in the infrared range using visible photons,” Quantum Sci. Technol 3, 025008 (2018). [Google Scholar]
- 33.Vallés A, Jiménez G, Salazar-Serrano LJ, and Torres JP, “Optical sectioning in induced coherence tomography with frequency-entangled photons,” Phys. Rev. A 97, 023824 (2018). [Google Scholar]
- 34.Bristow AD, Rotenberg N, and Van Driel HM, “Two-photon absorption and Kerr coefficients of silicon fro 850–2200 nm,” Appl. Phys. Lett 90, 191104 (2007). [Google Scholar]
- 35.Cox N, Hagan D, and Van Stryland E, “Extremely nondegenerate twophoton absorption in silicon (Conference Presentation),” Proc. SPIE 10916, 1091613 (2019). [Google Scholar]
- 36.Hutchings DC and Van Stryland EW, “Nondegenerate two-photon absorption in zinc blende semiconductors,” J. Opt. Soc. Am. B 9, 2065–2074 (1992). [Google Scholar]
- 37.Fang J, Wang Y, Yan M, Wu E, Huang K, and Zeng H, “Highly sensitive detection of infrared photons by nondegenerate two-photon absorption under midinfrared pumping,” Phys. Rev. Appl 14, 064035 (2020). [Google Scholar]
- 38.Pattanaik HS, Reichert M, Hagan DJ, and Van Stryland EW, “Three-dimensional IR imaging with uncooled GaN photodiodes using nondegenerate two-photon absorption,” Opt. Express 24, 1196–1205 (2016). [DOI] [PubMed] [Google Scholar]
- 39.Zhou C, Chen Y, and Waltz RA, “Optimized mask image projection for solid freeform fabrication,” J. Manuf. Sci. Eng 131, 061004 (2009). [Google Scholar]
- 40.Agrawal A, Pfefer TJ, Woolliams PD, Tomlins PH, and Nehmetallah G, “Methods to assess sensitivity of optical coherence tomography systems,” Biomed. Opt. Express 8, 902–917 (2017). [DOI] [PMC free article] [PubMed] [Google Scholar]
- 41.Yamamoto K and Ishida H, “Interpretation of reflection and transmission spectra for thin films: reflection,” Appl. Spectrosc 48, 775–787 (1994). [DOI] [PubMed] [Google Scholar]
- 42.Yamamoto K and Ishida H, “Optical theory applied to infrared spectroscopy,” Vib. Spectrosc 8, 1–36 (1994). [Google Scholar]
- 43.Yamamoto K, Masui A, and Ishida H, “Kramers–Kronig analysis of infrared reflection spectra with perpendicular polarization,” Appl. Opt 33, 6285–6293 (1994). [DOI] [PubMed] [Google Scholar]
- 44.Klein T and Huber R, “High-speed OCT light sources and systems [Invited],” Biomed. Opt. Express 8, 828–859 (2017). [DOI] [PMC free article] [PubMed] [Google Scholar]
- 45.Choma MA, Sarunic MV, Yang C, and Izatt JA, “Sensitivity advantage of swept source and Fourier domain optical coherence tomography,” Opt. Express 11, 2183–2189 (2003). [DOI] [PubMed] [Google Scholar]
- 46.Wojtkowski M, Srinivasan VJ, Ko TH, Fujimoto JG, Kowalczyk A, and Duker JS, “Ultrahigh-resolution, high-speed, Fourier domain optical coherence tomography and methods for dispersion compensation,” Opt. Express 12, 2404–2422 (2004). [DOI] [PubMed] [Google Scholar]
Associated Data
This section collects any data citations, data availability statements, or supplementary materials included in this article.
Supplementary Materials
Supplemental document. See Supplement 1 for supporting content.


