

Abstract
Background
Following COVID-19, patients often present with ongoing symptoms comparable to chronic fatigue and subjective deterioration of exercise capacity (EC), which has been recently described as postacute COVID-19 syndrome.
Objective
To objectify the reduced EC after COVID-19 and to evaluate for pathologic limitations.
Methods
Thirty patients with subjective limitation of EC performed cardiopulmonary exercise testing (CPET). If objectively limited in EC or deteriorated in oxygen pulse, we offered cardiac stress magnetic resonance imaging (MRI) and a follow-up CPET.
Results
Eighteen male and 12 female patients were included. Limited relative EC was detected in 11/30 (36.7%) patients. Limitation correlated with reduced body weight-indexed peak oxygen (O2) uptake (peakV̇O2/kg) (mean 74.7 (±7.1) % vs. 103.6 (±14.9) %, p < 0.001). Reduced peakV̇O2/kg was found in 18/30 (60.0%) patients with limited EC. Patients with reduced EC widely presented an impaired maximum O2 pulse (75.7% (±5.6) vs. 106.8% (±13.9), p < 0.001). Abnormal gas exchange was absent in all limited EC patients. Moreover, no patient showed signs of reduced pulmonary perfusion. Using cardiac MRI, diminished biventricular ejection fraction was ruled out in 16 patients as a possible cause for reduced O2 pulse. Despite noncontrolled training exercises, follow-up CPET did not reveal any exercise improvements.
Conclusions
Deterioration of EC was not associated with ventilatory or pulmonary vascular limitation. Exercise limitation was related to both reduced O2 pulse and peakV̇O2/kg, which, however, did not correlate with the initial severity of COVID-19. We hypothesize that impaired microcirculation or limited peripheral O2 utilization might be causative for prolonged deterioration of EC following acute COVID-19 infection.
1. Introduction
In late 2019, a novel SARS-associated coronavirus was identified as the cause of an increased incidence of pneumonia cases in Wuhan, Hubei Province of China [1]. In early 2020, the World Health Organization designated the disease as coronavirus disease 2019 (COVID-19) [2], caused by the enveloped, single-stranded RNA virus “severe acute respiratory syndrome coronavirus 2” (SARS-CoV-2). Ever since, the disease has developed into a global pandemic. Acute infection clinically presents from mild [3] to severe and critical forms. Severe forms included respiratory distress (respiratory rate ≥30/min) and/or oxygen saturation (SpO2) ≤ 93% at ambient air during rest. Moreover, critical courses were in need of ventilation and/or extracorporeal membrane oxygenation [4, 5].
Due to the global spread of coronavirus disease 2019 (COVID-19), the number of individuals recovering from acute SARS-CoV-2 infection is on the increase. A growing number of observational data suggest that patients may suffer from a wide range of symptoms after recovery from acute illness referred to by several terms such as “long COVID” or “postacute COVID-19 syndrome” [6–12]. However, postacute illness and persistent symptoms following COVID-19 show similar features of recovery from other viral diseases or sepsis [13–16].
After the acute and infectious COVID-19 phase, a so-called “long COVID syndrome” is thought to begin 3 to 4 weeks after the onset of acute symptoms in more than one-third of the patients [17, 18]. This syndrome manifests either as an acute thromboembolic complication with concomitant deterioration or as a long-term persistent symptom complex with no currently known clinical correlation [19, 20]. So far, fatigue and dyspnea have been mentioned as the most common symptoms in several observational studies [17–20]. The underlying causes of long COVID syndrome are not fully understood. Currently, it appears that several factors might be involved, such as cardiac sequelae, impairment of pulmonary blood flow and gas exchange, or restricted lung function [21].
To gain insight into the unspecific form of long COVID syndrome and to further analyze the pathophysiological background of persistent fatigue and dyspnea, we performed pulmonary function tests followed by bicycle-exhausting cardiopulmonary exercise testing (CPET) to evaluate for physical limitations caused by pulmonary, pulmonary vascular, cardiocirculatory, or gas exchange pathologies in patients with subjective deterioration in exercise capacity (EC) after COVID-19.
2. Methods
After approval of the study conducted by the local ethics committee (Ref. 2020-585-f-S), patients with persistent, subjective deterioration in EC or with symptoms consistent with dyspnea or fatigue at follow-up visits after COVID-19 were offered prospective follow-up bicycle-exhausting cardiopulmonary exercise testing (CPET) at our outpatient clinic. Each patient suffered from infection with the nonvariant SARS-CoV-2. According to the current World Health Organization guidance criteria [3–5], patients were categorized into mild/moderate disease, if pure outpatient treatment was performed. Severe illness was defined by inpatient care and/or oxygen supplementation. Critical illness included noninvasive and invasive ventilation due to acute respiratory failure.
As per protocol, we documented the modified medical research council (mMRC) severity of breathlessness score and evaluated spirometry and/or body plethysmography (JAEGER® MasterScreen Body, CareFusion Germany 234 GmbH, 97204 Höchberg, Germany, and SentrySuite, Vers-No. 2.19.4, CareFusion Germany 234 GmbH, 97204 Höchberg, Germany) before first bicycle CPET evaluation (CareFusion Type MasterScreen CPX and CareFusion Germany 234 GmbH, 97204 Höchberg, Germany). Every patient gave informed consent before CPET. Spirometry and/or body plethysmography were performed according to the harmonized European Respiratory Society (ERS) and American Thoracic Society (ATS) guidelines [22].
Exhausting CPET was performed via bicycle test (GE Healthcare ergometer eBike basic, GE Healthcare Germany, 79111 Freiburg, Germany), with baseline resistance (5; 10; 12.5; 25; 50 watts (W)) and individual, continuous increase in resistance by 5, 10, 12, 25, or 50 W over two minutes prior to CPET to best achieve exhaustion criteria within 12 minutes of exercise. Arterialized capillary blood gas analyses were sampled during CPET. Wasserman plots and raw data were documented.
Cessation criteria for CPET included respiratory exchange ratio (RER) ≥ 1.25, signs of ischemia or ventricular arrhythmia in the electrocardiogram, dizziness, cold sweat, and/or vertigo, unacceptable subjective shortness of breath or chest pain, a desaturation below 80%, muscular exhaustion, a systolic blood pressure >250 mmHg, a diastolic blood pressure >120 mmHg, and a clinically relevant blood pressure decrease (−20 mmHg) while at increasing resistance [23].
Physical limitation in exhausting CPET was considered a workload (watt) < 100% of age-, weight-, and size-adjusted required range. Standard values in CPET for all evaluated and predicted values included calculations based on Gläser et al. [24].
When indicated and consented, patients underwent cardiac magnetic resonance imaging (cMRI) after documentation of possible cardiocirculatory CPET limitation (i.e., deteriorated oxygen pulse, early oxygen pulse plateau, insufficient heart rate increase, abnormalities in electrocardiogram during EC, and blood pressure decline during EC).
After exclusion of organ function limitations, patients were recommended to increase exercise activities such as physical strength and endurance. Professional medical rehabilitation was not performed in any of the patients during the period of evaluation. Every patient was offered a CPET follow-up evaluation. Follow-up CPET was performed, if agreed and either objectively limited in EC, limited in oxygen pulse, or if still suffering from extensive subjective exercise limitation.
To describe the cohort, we used mean, standard deviation (SD), raw count, and frequencies. Twofold associations between categorical variables were analyzed via Fisher's exact test or chi-square test, if applicable. Continuous and ordinal variables were tested using either unpaired t-test or Mann-Whitney U-test depending on the normality of the data. As all measured and predicted values revealed a normal distribution, related variables between first and second CPET were analyzed via paired t-test.
Data collection and calculations and graphs were performed using IBM® SPSS® Statistics Version 27 (released 2020, IBM Corp., Armonk, NY, USA). The local significance level was set to 0.05. Due to the explorative character of the analysis, an adjustment to multiplicity was not determined.
3. Results
Baseline characteristics of the cohort can be found in Table 1. We included multiple CPET analyses of 18 male patients and 12 female patients, aged 51.5 (±14.1) years at COVID-19 diagnosis, with 21 patients undergoing inpatient care. The average time from COVID-19 diagnosis to first CPET was 4.3 months.
Table 1.
Cohort characteristics.
| # | Sex | Age (y) | CPET1 | CPET2 | |||||||||
|---|---|---|---|---|---|---|---|---|---|---|---|---|---|
| BMI (kg/m2) | FEV1 (%) | FVC (%) | COVID-19 severity | Time to CPET1 (m) | Workload max (%) | HF max (bpm) | O2 pulse max (%) | Peak V̇O2/kg (%) | RER max | ||||
| 1 | F | 57 | 32 | 94 | 91 | 1 | 4.7 | 179 | 95 | 111 | 125 | 1.27 | Y |
| 2 | M | 76 | 26 | 76 | 81 | 2 | 3.9 | 107 | 151 | 70 | 76 | 1.16 | Y |
| 3 | M | 56 | 23 | 90 | 99 | 2 | 4.0 | 138 | 169 | 114 | 113 | 1.17 | N |
| 4 | M | 44 | 29 | 96 | 86 | 2 | 2.8 | 71 | 151 | 74 | 71 | 1.11 | Y |
| 5 | M | 57 | 29 | 95 | 87 | 3 | 3.5 | 81 | 157 | 70 | 75 | 1.20 | Y |
| 6 | M | 65 | 27 | 99 | 104 | 2 | 3.7 | 104 | 113 | 113 | 89 | 1.14 | Y |
| 7 | M | 57 | 26 | 96 | 83 | 2 | 3.6 | 115 | 157 | 95 | 96 | 1.19 | Y |
| 8 | F | 30 | 32 | 109 | 102 | 2 | 3.3 | 90 | 176 | 72 | 76 | 1.18 | Y |
| 9 | M | 63 | 21 | 104 | 99 | 3 | 3.2 | 129 | 137 | 131 | 105 | 1.17 | Y |
| 10 | F | 54 | 25 | 86 | 84 | 1 | 3.6 | 99 | 164 | 79 | 80 | 1.25 | Y |
| 11 | M | 43 | 26 | 124 | 119 | 2 | 2.8 | 83 | 179 | 72 | 75 | 1.20 | Y |
| 12 | F | 30 | 20 | 91 | 103 | 1 | 2.8 | 116 | 179 | 113 | 103 | 1.02 | N |
| 13 | F | 61 | 24 | 82 | 84 | 2 | 1.9 | 128 | 129 | 110 | 90 | 1.18 | N |
| 14 | M | 50 | 29 | 110 | 95 | 2 | 3.9 | 93 | 173 | 71 | 80 | 1.12 | Y |
| 15 | M | 60 | 27 | 93 | 87 | 3 | 6.0 | 53 | 111 | 80 | 58 | 1.09 | Y |
| 16 | F | 53 | 24 | 118 | 120 | 2 | 6.4 | 129 | 164 | 104 | 103 | 1.20 | N |
| 17 | M | 57 | 25 | 98 | 101 | 2 | 5.7 | 125 | 171 | 101 | 107 | 1.20 | N |
| 18 | M | 23 | 29 | 94 | 108 | 1 | 5.7 | 81 | 179 | 83 | 85 | 1.00 | Y |
| 19 | M | 39 | 25 | 99 | 96 | 2 | 4.3 | 82 | 166 | 81 | 73 | 1.08 | Y |
| 20 | M | 38 | 24 | 82 | 89 | 2 | 2.7 | 100 | 181 | 95 | 94 | 1.09 | Y |
| 21 | M | 72 | 29 | 114 | 118 | 2 | 4.9 | 124 | 113 | 117 | 100 | 1.04 | N |
| 22 | F | 34 | 22 | 84 | 110 | 1 | 6.9 | 127 | 181 | 107 | 102 | 1.13 | N |
| 23 | M | 61 | 28 | 101 | 96 | 2 | 2.8 | 153 | 176 | 102 | 124 | 1.07 | Y |
| 24 | M | 53 | 33 | 97 | 91 | 2 | 2.3 | 90 | 157 | 68 | 79 | 1.18 | N |
| 25 | F | 32 | 52 | 98 | 126 | 1 | 4.0 | 146 | 153 | 99 | 112 | 1.06 | N |
| 26 | Ff | 45 | 29 | 88 | 81 | 1 | 1.3 | 72 | 139 | 83 | 70 | 1.20 | N |
| 27 | M | 42 | 25 | 92 | 143 | 2 | 7.8 | 134 | 179 | 113 | 115 | 1.19 | N |
| 28 | F | 82 | 24 | 147 | 130 | 2 | 3.6 | 122 | 114 | 98 | 81 | 1.00 | N |
| 29 | F | 54 | 19 | 80 | 80 | 1 | 8.6 | 211 | 171 | 101 | 99 | 1.17 | N |
| 30 | F | 57 | 26 | 106 | 103 | 1 | 8.7 | 199 | 157 | 134 | 135 | 1.07 | N |
| AVG | 52 | 27 | 98 | 100 | 4.3 | 116 | 155 | 95 | 93 | 1.14 | |||
# = patient number; sex F = female, m = male; age at COVID-19 diagnosis (in years); BMI = body mass index (in kilogram per square meter); FEV1 = forced expiratory volume in 1 second (in %); FVC = forced vital capacity (in %); COVID-19 severity: 1 = mild/moderate = outpatient treatment, 2 = severe = inpatient treatment, oxygen supplementation, 3 = critical = treatment at intensive care unit; time to CPET1 = time since positive SARS-CoV-2 PCR test to first CPET (in months); workload max = maximum work load (in %); HF max = maximum heart frequency (in beats per minute); O2 pulse max = maximum oxygen pulse (in %); peak V̇O2/kg = body weight-indexed peak oxygen uptake (in %); RER = respiratory exchange ratio; CPET2 y = yes, n = no, AVG = mean average.
Objective limitation in EC was present in 11/30 (36.6%) patients during the first and in 12/16 (75%) patients during the second CPET. In the observed cohort, all documented values and differences were normally distributed. Time from SARS-CoV-2-positive polymerase chain reaction testing to first CPET (CPET1) was 4.7 (±2.1) months in the nonlimited cohort and 3.6 (±1.4) months in the limited cohort (t-test p=0.079), and another 3.5 (±1.1) months in the nonlimited cohort and 3.4 (±1.4) months in the limited cohort to follow-up CPET (CPET2) (t-test p=0.943). In both cases, differences were not statistically significant.
Regarding CPET1, to further assess the cause of EC limitation, we first correlated non-CPET values between the subcohorts (Table 2). Here, neither gender nor body mass index significantly differed in distribution. Still, 63.3% of the patients revealed a body mass index (BMI) > 25 kg/m2 and most of the analyzed patients were men. However, with a mean BMI of 27 kg/m2, average weight and size distribution resulted in moderately increased overweight. Moreover, obesity was present in only 4 patients (1st-degree obesity in 3 patients and 3rd-degree obesity in one patient). Finally, there were no statistically significant differences in terms of BMI distribution (BMI ≤25 kg/m2 vs. BMI 25,1–30,0 kg/m2 vs. BMI >30,0 kg/m2, Mann-Whitney Up=0.064). However, with respect to age, the borderline significant occurrence of younger patients in the limited patient cohort was observed (p=0.05). Moreover, ventilatory parameters such as forced expiratory volume in one second (FEV1) and forced vital capacity (FVC) and subjective dyspnea grade, measured by modified medical research council (mMRC) scale, did not differ between nonlimited and limited individuals. Likewise, inpatient or outpatient care and COVID-19 severity presented in equal distribution between the two cohorts.
Table 2.
Comparators of non-CPET values.
| Variables | Overall cohort | In % | Nonlimited CPET1 | In % | Limited CPET1 | In % | p value |
|---|---|---|---|---|---|---|---|
| n = 30 | n = 19 | n = 11 | |||||
| Sex | 0.442a | ||||||
| Female | 12 | 40 | 9 | 47 | 3 | 27 | |
| Male | 18 | 60 | 10 | 53 | 8 | 73 | |
| Age | 0.050b | ||||||
| Mean (±SD) | 52 (±14) | 55 (±14) | 45 (±11) | ||||
| BMI | 0.263b | ||||||
| Mean (±SD) | 27 (±6) | 26 (±7) | 28 (±3) | ||||
| Patient care | 1.000a | ||||||
| Outpatient care | 9 | 30 | 6 | 32 | 3 | 27 | |
| Inpatient care | 21 | 70 | 13 | 68 | 8 | 73 | |
| COVID-19 severity | 0.582c | ||||||
| Mild/moderate | 9 | 30 | 6 | 32 | 3 | 27 | |
| Severe | 18 | 60 | 12 | 63 | 6 | 55 | |
| Critical | 3 | 10 | 1 | 5 | 2 | 18 | |
| Ventilatory support | 0.366a | ||||||
| Noninvasive vent. | 2 | 7 | 1 | 5 | 1 | 9 | |
| Invasive vent. | 1 | 3 | 0 | 0 | 1 | 9 | |
| mMRC dyspnea sc. | 0.497c | ||||||
| mMRC 0 | 8 | 27 | 6 | 32 | 2 | 18 | |
| mMRC 1 | 20 | 67 | 12 | 63 | 8 | 73 | |
| mMRC 2 | 2 | 7 | 1 | 5 | 1 | 9 | |
| mMRC 3-4 | 0 | 0 | 0 | 0 | 0 | 0 | |
| FEV1 | 0.746b | ||||||
| Mean (±SD) | 98 (±14) | 98 (±16) | 99 (±11) | ||||
| FVC | 0.106b | ||||||
| Mean (±SD) | 100 (±16) | 103 (±17) | 94 (±12) |
p values: a = Fisher's exact test, b = Student's t-test of unpaired values, c = Mann-Whitney U-test; mean (±SD) = mean ± standard deviation; mMRC = modified medical research council dyspnea scale; FEV1 = forced expiratory volume in one second; FVC = forced vital capacity.
Following this, we analyzed relevant CPET parameters between the cohorts (Table 3). With respect to gas exchange at rest and during exercise, no significant differences of oxygen partial pressure (pO2) and carbon dioxide partial pressure (pCO2) at rest could be documented between limited patients and nonlimited ones. However, with respect to exhaustion, gas exchange was the exercise-limiting factor for nonlimited patients, resulting in higher alveolar-arterial pressure gradients in comparison to the limited subjects (p=0.006). Yet, gas exchange was not a limiting factor in limited individuals with low workload (i.e., <100%) and low body weight-indexed oxygen uptake (alveolar-arterial oxygen gradient (AaDO2) mean 29.4 mmHg). Here, hypoxemia and hypercapnia could be excluded. Nevertheless, subjective dyspnea was equally prominent in both cohorts (c.f.,Table 2).
Table 3.
Comparators of CPET1 and CPET2 values.
| Variables | Overall cohort | Nonlimited CPET | Limited CPET | p value |
|---|---|---|---|---|
| CPET 1 | n = 30 | n = 19 | n = 11 | |
| Heart rate (bpm) | 155 (±25) | 152 (±27) | 159 (±20) | 0.421 |
| Max. systolic blood pressure (mmHg) | 172 (±18) | 176 (±16) | 165 (±19) | 0.147 |
| Max. diastolic blood pressure (mmHg) | 87 (±11) | 90 (±10) | 82 (±12) | 0.076 |
| Workload (watt) | 169 (±61) | 183 (±63) | 145 (±51) | 0.086 |
| Workload (%) | 116 (±37) | 136 (±30) | 81 (±13) | <0.001 |
| Anaerobic threshold (watt) | 97 (±41) | 107 (±43) | 79 (±31) | 0.049 |
| Max. O2 pulse (ml) | 13 (±4) | 14 (±4) | 12 (±3) | 0.135 |
| Max. O2 pulse (%) | 95 (±19) | 107 (±14) | 76 (±6) | <0.001 |
| Max. V̇E (l/min) | 83 (±30) | 86 (±33) | 78 (±24) | 0.463 |
| Max. V̇E (%) | 71 (±30) | 76 (±21) | 61 (±9) | 0.009 |
| Peak V̇O2/kg (ml/min/kg) | 24 (±7) | 26 (±7) | 21 (±5) | 0.047 |
| Peak V̇O2/kg (%) | 93 (±19) | 104 (±15) | 75 (±7) | <0.001 |
| BR (%) | 30 (±18) | 25 (±20) | 39 (±9) | 0.010 |
| RER | 1.14 (±0.07) | 1.13 (±0.07) | 1.15 (±0.07) | 0.623 |
| pO2 at rest (mmHg) | 81 (±9) | 80 (±7) | 83 (±11) | 0.452 |
| pCO2 at rest (mmHg) | 38 (±3) | 38 (±3) | 38 (±3) | 0.974 |
| pO2 at submax. load (mmHg) | 79 (±11) | 75 (±11) | 85 (±10) | 0.006 |
| pCO2 at submax. load (mmHg) | 35 (±4) | 36 (±4) | 34 (±4) | 0.351 |
| AaDO2 at submax. load (mmHg) | 35 (±9) | 38 (±8) | 29 (±8) | 0.006 |
| Lactate at submax. load (mmol/l) | 5.5 (±2.1) | 5.5 (±2.4) | 5.4 (±1.6) | 0.887 |
|
| ||||
| CPET 2 | n = 4 | n = 12 | ||
| Heart rate (bpm) | 158 (±20) | 161 (±20) | 156 (±21) | 0.693 |
| Max. systolic blood pressure (mmHg) | 169 (±16) | 176 (±9) | 167 (±18) | 0.226 |
| Max. diastolic blood pressure (mmHg) | 87 (±7) | 89 (±1) | 87 (±8) | 0.320 |
| Workload (watt) | 171 (±61) | 228 (±54) | 152 (±52) | 0.060 |
| Workload (%) | 100 (±34) | 153 (±21) | 83 (±11) | 0.005 |
| Anaerobic threshold (watt) | 96 (±44) | 142 (±54) | 80 (±28) | 0.104 |
| Max. O2 pulse (ml) | 13 (±4) | 16 (±4) | 13 (±4) | 0.222 |
| Max. O2 pulse (%) | 86 (±23) | 109 (±34) | 78 (±12) | 0.171 |
| Max. V̇E (l/min) | 85 (±23) | 103 (±17) | 79 (±29) | 0.079 |
| Max. V̇E (%) | 66 (±16) | 83 (±7) | 61 (±14) | 0.001 |
| Peak V̇O2/kg (ml/min/kg) | 23 (±7) | 28 (±8) | 22 (±6) | 0.268 |
| Peak V̇O2/kg (%) | 85 (±21) | 112 (±23) | 76 (±9) | 0.048 |
| BR (%) | 34 (±16) | 17 (±7) | 39 (±14) | 0.001 |
| RER | 1.13 (±0.08) | 1.12 (±0.08) | 1.13 (±0.08) | 0.875 |
| pO2 at rest (mmHg) | 81 (±6) | 75 (±5) | 83 (±6) | 0.049 |
| pCO2 at rest (mmHg) | 38 (±3) | 38 (±2) | 39 (±3) | 0.338 |
| pO2 at submax. load (mmHg) | 86 (±9) | 80 (±6) | 88 (±10) | 0.075 |
| pCO2 at submax. load (mmHg) | 34 (±5) | 32 (±1) | 35 (±6) | 0.084 |
| AaDO2 at submax. load (mmHg) | 29 (±8) | 35 (±12) | 27 (±5) | 0.235 |
| Lactate at submax. load (mmol/l) | 5.9 (±2.1) | 6.2 (±0.3) | 5.8 (±2.4) | 0.521 |
Bpm = beats per minute; mmHg = millimeter mercury column; ml = milliliter; V̇E = respiratory minute volume; peak V̇O2/kg = body weight-indexed peak oxygen uptake; BR = breathing reserve; RER = respiratory exchange ratio; pO2 = oxygen partial pressure in capillary blood gas analysis; pCO2 = carbon dioxide partial pressure in capillary blood gas analysis; AaDO2 = alveolar-arterial oxygen gradient; mmol/l = millimole per liter.
In association with reduced EC, body weight-indexed oxygen uptake (peak V̇O2/kg) was found to be 74.7 (±7.1) % in limited individuals and 103.6 (±14.9) % in nonlimited ones (p < 0.001). With respect to the cause of EC limitation, we found an insufficient O2 pulse increment, defined as maximum O2 pulse <84% of predicted normal range, in 12/30 (40%) participants within the first CPET performance (Fisher's exact test p < 0.001, data not shown). The average O2 pulse was 75.7 (±5.6) % in limited patients and 106.7 (±13.9) % in nonlimited patients (t-test p < 0.001), offering an indicator for cardiocirculatory limitation (c.f.,Table 3).
During the CPET phase of increasing resistance, nonlimited patients presented a better increment of their respiratory minute volume (V̇E) and fully used their breathing reserve. Yet, as mentioned before, in limited patients gas exchange impairment was not evident. Of further interest, none of the patients studied showed evidence of persistent pulmonary vascular disease (e.g., elevated respiratory equivalents).
Taken together, the presented data deduce a typical CPET pathology in post-COVID-19 patients with an insufficient O2 pulse increment and reduced oxygen uptake capacity, hinting at a cardiocirculatory EC limitation. A representative 9-panel display of Wasserman of a CPET analysis is shown in Figure 1. Here, striking features were the reduced oxygen uptake capacity (panel 3) and the insufficient O2 pulse increase (panel 2) during the exercise phase. Features of pulmonary(-vascular) limitations (panel 4 and 6) or gas exchange disorders (panel 9) were not prominent. The ventilatory reserve (panel 8) was not reached, but the level of performance, measured by the respiratory exchange rate, was sufficient.
Figure 1.
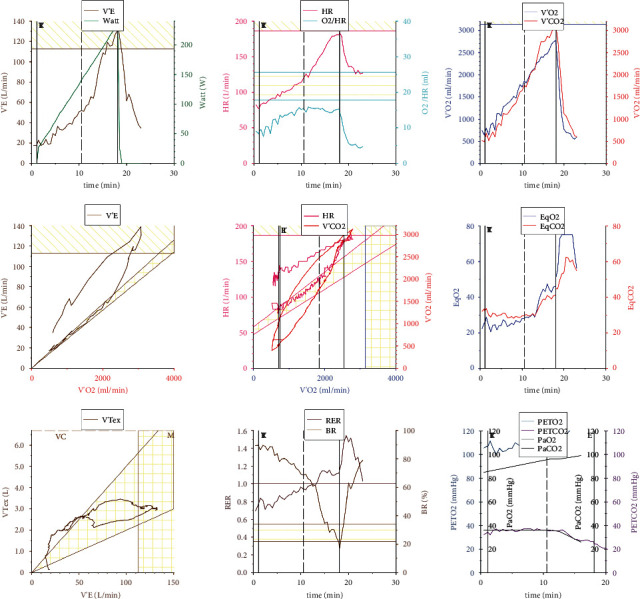
Representative 9-panel display of Wasserman of a limited post-COVID-19 patient. V'E: respiratory minute volume, HR: heart rate, O2/HR: oxygen pulse, V'O2: oxygen uptake capacity, V'CO2: carbon dioxide elimination capacity/carbon dioxide output, EqO2: oxygen ventilatory equivalents, EqCO2: carbon dioxide ventilatory equivalents, VTex: expiratory tidal volume, RER: respiratory exchange rate, BR: breathing reserve, PETO2: end-tidal partial pressure of oxygen, PETCO2: end-tidal partial pressure of carbon dioxide, PaO2: arterial/arterialized capillary oxygen partial pressure, and PaCO2: arterial/arterialized capillary carbon dioxide partial pressure.
Due to cardiocirculatory EC limitation in CPET, adenosine and/or dobutamine stress cardiac magnetic resonance imaging (cMRI) was performed after CPET1, to rule out myocardial pathologies, reduced left ventricular ejection fraction (LVEF), or underlying cardiocirculatory pathologies. Here, in sixteen patients cMRI was performed. None of these patients revealed a hemodynamically relevant ischemia, valve dysfunction, or LVEF reduction. While in thirteen patients the scan was completely unremarkable, one patient revealed focal, mid-ventricular to apical nonischemic myocardial contrast agent enhancement and another patient revealed a minimal basolateral edema. A third patient presented a pre-existing basoseptal contrast agent enhancement of unknown etiology. However, the significance of these changes remains unclear.
Follow-up CPET (CPET2) was performed in objectively limited patients (n = 11), in patients with limited oxygen pulse (n = 10), and/or in patients with extensive subjective exercise limitation (n = 4). Though offered, two patients with limited EC in CPET1 refused to perform CPET2. Three patients with EC ≥ 100% did not achieve a lower limit of normal in EC during the second CPET. With respect to O2 pulse, follow-up CPET revealed limited O2 pulse in 10/16 (62.5%) workload-limited participants (Fisher's exact test p=0.008, data not shown). However, the deteriorated parameters of O2 pulse (p=0.605), peak V̇O2/kg (p=0.549), and V̇E (p=0.428) in our objectively limited subcohort neither improved nor declined over a period of 2.9 months from first to second CPET analysis (c.f.Figure 2) despite increase in physical activity.
Figure 2.
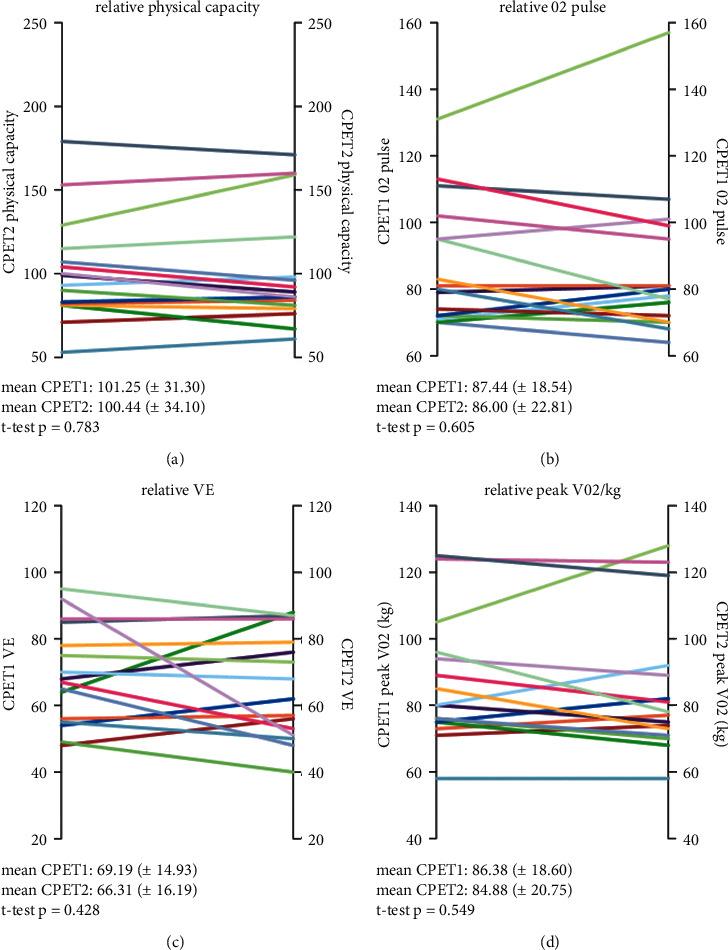
Physical capacity, O2 pulse, V̇E, and peak V̇O2/kg at first and second CPET (in %). Analysis performed with Student's t-test for related variables; mean value (±standard deviation). V̇E: respiratory minute volume and peak V̇O2/kg: body weight-indexed oxygen uptake.
4. Discussion
Cardiopulmonary exercise testing (CPET) is considered the gold standard for determining the degree of physical activity impairment [22, 25]. To the best of our knowledge, we are first in presenting data on sequential CPET in a patient cohort suffering from symptoms consistent with postacute COVID-19 syndrome. The majority of reports of health-related events following COVID-19 have been described after severe infection or hospitalization due to SARS-CoV-2 infection. Of interest, the ongoing presence of long-lasting symptoms such as shortness of breath and fatigue has also been recently reported in a significant number of nonhospitalized patients [26]. Likewise, our observations also refer to 9 patients, who showed a mild disease course and did not require hospitalization.
In our patient cohort, a typical pattern of reduced peak V̇O2 and reduced O2 pulse was identified as a possible pathognomonic pattern in objectifiable EC reduction. With respect to cardiocirculatory limitations, oxygen pulse indicates the capability of oxygen consumption of all body tissues per heartbeat and thus is a function of stroke volume and oxygen extraction by the cells. None of our patients had a known history of concomitant cardiovascular disease. Yet, considering the relevant differential diagnosis of impaired O2 uptake, deterioration of left ventricular ejection fraction, valve dysfunction, or impaired myocardial perfusion were widely excluded by stress cardiac MRI (cMRI) scans. With additional respect to the mean age of 52 years in this cohort, we assume that a possible influence of cardiovascular disease on the impaired EC in our patient population can be largely excluded. Contrary to our cMRI data, recent data on 26 college athletes with mild or asymptomatic SARS-CoV-2 infection described features consistent with persisting myocardial inflammation or previous myocardial injury in 15% and 30.8% of participants, respectively [27]. However, these data were sampled early after positive testing for COVID-19, i.e., subsequent to recommended quarantine (11–53 days), and thus can reasonably explain the different observations.
Possible causes of persistent myocardial damage in patients with COVID-19 include ischemic damage due to endotheliitis [28] or epicardial coronary artery disease, and myocarditis [29] and stress cardiomyopathy [30]. In addition, right heart strain [31, 32] and systemic inflammatory syndrome [33] may lead to myocardial sequelae. However, the contribution of each of these causes to myocardial damage and to the potential limitation of cardiovascular exercise capacity in this context remains to be elucidated. Furthermore, it is reasonable to speculate that cardiac sequelae are more likely to occur in elderly patients and patients with severe COVID-19 disease, both of which are not true for the majority of our patients.
Acute COVID-19 is known to cause impairment of the circulatory system, with endothelial cell damage and vascular occlusion being the major contributors leading to hypoxemia [34, 35]. In this context, SARS-CoV-2 was shown to induce vascular endothelial cell dysfunction with SARS-CoV-2 spike protein leading to ACE2 downregulation [36] and impaired mitochondrial function [37]. Moreover, mitochondrial damage might play a relevant role in COVID-19 pathogenesis, as SARS-CoV-2 interacts via mitochondrial antiviral signaling protein (MAVS), finally impairing type I interferon production and leading to reduced mitochondrial oxygen sensing, oxidative stress-associated thrombocyte dysfunction, and induction of hemostatic pathways [38]. Other than that, Rovas et al. analyzed the vascular density, red blood cell velocity, and glycocalyx dimensions in tongue base microvessels via intravital microscopy by sidestream dark-field imaging in healthy individuals, nonventilated and ventilated COVID-19 patients [39], allowing for conclusions of graduated microvascular dysfunction with regard to COVID-19 severity. Additionally, microvascular changes in the retina were still detected in patients after bilateral SARS-CoV-2 pneumonia at 6 months [40] suggesting the possibility of persistent vascular impairment following COVID-19. Moreover, after COVID-19, persistent alterations of erythrocytes and neutrophils were most recently described [41]. Kubánková et al. hypothesize that the persisting changes in blood cell physical phenotypes could contribute to the long-term impairment of circulation and peripheral oxygen delivery [41].
Interestingly, chronic fatigue syndrome (CFS), a debilitating disease also caused by viral infections [42], shows similar features to long COVID syndrome, such as exertional intolerance with postexertional malaise and chronic fatigue. In CFS, vascular dysfunction leading to impaired muscle perfusion and limited cerebral blood flow upon exertion is considered a key mechanism for symptomatic disease [43–46]. In addition, mitochondrial dysfunction has been considered in CFS [47, 48]. In this regard, previous studies with CPET demonstrated reduced peak oxygen consumption in the majority of CFS patients [49, 50], although peak V̇O2 was not attributed to reduced oxygen uptake and transport to the muscle [51]. Since we were able to exclude a cardiac genesis as the cause of limited oxygen pulse and peak V̇O2, we hypothesize, based on our observations, that persistent vascular dysfunction with reduced peripheral oxygen delivery and/or impaired peripheral oxygen consumption due to metabolic dysfunction may also be present in our patient collective.
It seems questionable to what extent persistent symptoms in patients with a mild course of COVID-19 can be explained by pulmonary or cardiac dysfunction at all. Here, we did not find any evidence of persistent pulmonary or cardiac impairment in our patient collective. In addition, we could not demonstrate evidence of pulmonary vascular dysfunction in any of our patients, although CPET is considered a very sensitive method to detect pulmonary perfusion deficits. Pulmonary vascular sequelae such as thromboembolism are considered a major cause of severe COVID-19 disease [52–56]. Nonetheless, thromboembolic complications have also been described in single case reports in patients with mild disease [57–59]. Our patient collective included mainly patients with a noncritical disease course, so persistent pulmonary vascular dysfunction seems rather unlikely considering current scientific evidence. The extent to which chronic pulmonary vascular changes play a role in patients with long COVID syndrome and the diagnostic value of CPET in this context remains unclear.
Noteworthy, over an average period of 2.9 months from first to second CPET analysis neither EC, O2 pulse, nor oxygen uptake capacity (peak V̇O2/kg) significantly improved in our cohort (all p > 0.05). Hence, recovery after initial confounding physical detraining associated with severe COVID-19 is unlikely. A relevant limitation of the study is the missing patient's CPET data before COVID-19 manifestation. Therefore, EC limitations can only be diagnosed by comparison with healthy individuals or lower limit of normal values but do not consider a diverging individual physical fitness before infection with SARS-CoV-2. In this context, Milovancev et al. evaluated professional volleyball players three weeks after convalescence of COVID-19. While this cohort is thought to be well trained before SARS-CoV-2 infection, peak V̇O2/kg was deteriorated likewise in CPET [60], allowing for a concept of EC limitation pathogenesis after COVID-19 beyond pre-existing mitochondrial density and physical training.
The limitations of our manuscript are mainly due to the retrospective character of our data analysis. In addition, follow-up data were only available in a subset of patients, and there are no comparable baseline values to the performance status of patients before COVID-19. Furthermore, we did not systematically screen our patients for concomitant diseases and, therefore, cannot safely exclude an influence of cardiovascular sequelae on impaired physical performance status. This also applies to cardiac MRI examinations, which were not regularly performed in our patient cohort. Our statements on limited exercise capacity should, therefore, be interpreted with caution and rather be classified as hypothesis generating.
However, the major strength of our study is that we were the first to perform serial CPET examinations and our data clearly add information to the analyses of Wu et al. presenting a cohort of residual impaired patients with primarily reduced diffusion capacity of the lungs for carbon monoxide (DLCO) at month 12 after COVID-19 [5]. While in our cohort, gas exchange, measured by AaDO2, did not relevantly impair EC in limited patients, other factors such as reduced O2 pulse and reduced oxygen uptake capacity were prominent here, suggesting impaired peripheral oxygen metabolization.
5. Conclusions
Taken together, our investigation suggests a post-COVID-19-specific pattern of EC limitation. This limitation was primarily identified by a reduced O2 pulse, possibly due to reduced oxygen utilization and/or impaired peripheral oxygen metabolism in the absence of macroscopic cardiocirculatory pathology, occurring in at least a subset of patients with long COVID syndrome. Cardiopulmonary exercise testing may help identify this group of patients and thus could be considered for implementation in an expanded diagnostic work-up of long COVID syndrome. Further research is needed to fully understand the role of mitochondria, endothelial dysfunction, and peripheral oxygen utilization and to evaluate the role of CPET in this patient cohort. Therefore, larger cohorts of patients with long COVID syndrome need to be studied to further verify our observation.
Acknowledgments
The authors thank Irmtraud Fruechte, Dagmar Grossmann, Hedda Knappe, and Leonie Schulz for their excellent work on performing cardiopulmonary exercise testing at our pulmonary outpatient clinic. The work was performed without any funding.
Data Availability
The datasets used and/or analyzed during the current study are available from the corresponding author on reasonable request.
Ethical Approval
The trial was performed in accordance with the local ethics committee (Ethik-Kommission Muenster, Gartenstraße 210–214, 48147 Muenster, Germany). Approval of the study conducted by the local ethics committee (Ref. 2020-585-f-S) was obtained. Each patient gave informed consent before the first CPET evaluation.
Conflicts of Interest
The authors have no conflicts of interest to declare.
Authors' Contributions
GE and MM designed the study. RV, PRT, and MM recruited the patients in post-COVID-19 outpatient care. Cardiopulmonary exercise testing was supervised by GE, MM, and ABS. Primary interpretation was performed by GE, MM, ABS, KH, and IO. Evaluation and discussion were performed in clinical context with RP and JRS. Data collection and evaluation were performed by ABS, GE, KH, and IO. AY performed cardiac magnetic resonance imaging and gave relevant input to the trial. RW, MB, RP, and JRS gave relevant input to the trial. The manuscript outline was written by GE and ABS. Georg Evers and Arik Bernard Schulze contributed equally as the first authors.
References
- 1.Ciotti M., Angeletti S., Minieri M., et al. COVID-19 outbreak: an overview. Chemotherapy . 2019;64(5-6):215–223. doi: 10.1159/000507423. [DOI] [PMC free article] [PubMed] [Google Scholar]
- 2.Adhanom T. Director-General’s Remarks at the Media Briefing on 2019-nCoV . Geneva, Switzerland: World Health Organization; 2020. https://www.who.int/dg/speeches/detail/who-director-general-s-remarks-at-the-media-briefing-on-2019-ncov-on-11-february-2020 . [Google Scholar]
- 3.Wiegele P. N., Kabar I., Kerschke L., et al. Symptom diary–based analysis of disease course among patients with mild coronavirus disease, Germany, 2020. Emerging Infectious Diseases . 2021;27:1353–1361. doi: 10.3201/eid2705.204507. [DOI] [PMC free article] [PubMed] [Google Scholar]
- 4.Wang F., Hou H., Luo Y., et al. The laboratory tests and host immunity of COVID-19 patients with different severity of illness. JCI Insight . 2020;5(10) doi: 10.1172/jci.insight.137799.e137799 [DOI] [PMC free article] [PubMed] [Google Scholar]
- 5.Wu X., Liu X., Zhou Y., et al. 3-month, 6-month, 9-month, and 12-month respiratory outcomes in patients following COVID-19-related hospitalisation: a prospective study. Lancet Respiratory Medicine . 2021;2600:1–8. doi: 10.1016/s2213-2600(21)00174-0. [DOI] [PMC free article] [PubMed] [Google Scholar]
- 6.Carfì A., Bernabei R., Landi F. Persistent symptoms in patients after acute COVID-19. JAMA . 2020;324:603–605. doi: 10.1001/jama.2020.12603. [DOI] [PMC free article] [PubMed] [Google Scholar]
- 7.Halpin S. J., McIvor C., Whyatt G., et al. Postdischarge symptoms and rehabilitation needs in survivors of COVID‐19 infection: a cross‐sectional evaluation. Journal of Medical Virology . 2021;93(2):1013–1022. doi: 10.1002/jmv.26368. [DOI] [PubMed] [Google Scholar]
- 8.Chopra V., Flanders S. A., O’Malley M., Malani A. N., Prescott H. C. Sixty-day outcomes among patients hospitalized with COVID-19. Annals of Internal Medicine . 2021;174(4):576–578. doi: 10.7326/m20-5661. [DOI] [PMC free article] [PubMed] [Google Scholar]
- 9.Arnold D. T., Hamilton F. W., Milne A., et al. Patient outcomes after hospitalisation with COVID-19 and implications for follow-up: results from a prospective UK cohort. Thorax . 2021;76(4):399–401. doi: 10.1136/thoraxjnl-2020-216086. [DOI] [PMC free article] [PubMed] [Google Scholar]
- 10.Moreno-Pérez O., Merino E., Leon-Ramirez J.-M., et al. Post-acute COVID-19 syndrome. Incidence and risk factors: a Mediterranean cohort study. Journal of Infection . 2021;82(3):378–383. doi: 10.1016/j.jinf.2021.01.004. [DOI] [PMC free article] [PubMed] [Google Scholar]
- 11.Huang C., Huang L., Wang Y., et al. 6-month consequences of COVID-19 in patients discharged from hospital: a cohort study. The Lancet . 2021;397(10270):220–232. doi: 10.1016/S0140-6736(20)32656-8. [DOI] [PMC free article] [PubMed] [Google Scholar]
- 12.Garrigues E., Janvier P., Kherabi Y., et al. Post-discharge persistent symptoms and health-related quality of life after hospitalization for COVID-19. Journal of Infection . 2020;81(6):e4–e6. doi: 10.1016/j.jinf.2020.08.029. [DOI] [PMC free article] [PubMed] [Google Scholar]
- 13.Prescott H. C., Angus D. C. Enhancing recovery from sepsis: a review. JAMA . 2018;319(1):62–75. doi: 10.1001/jama.2017.17687. [DOI] [PMC free article] [PubMed] [Google Scholar]
- 14.Ahmed H., Patel K., Greenwood D., et al. Long-term clinical outcomes in survivors of severe acute respiratory syndrome and Middle East respiratory syndrome coronavirus outbreaks after hospitalisation or ICU admission: a systematic review and meta-analysis. Journal of Rehabilitation Medicine . 2020;52(5) doi: 10.2340/16501977-2694.jrm00063 [DOI] [PubMed] [Google Scholar]
- 15.Hui D. S., Joynt G. M., Wong K. T., et al. Impact of severe acute respiratory syndrome (SARS) on pulmonary function, functional capacity and quality of life in a cohort of survivors. Thorax . 2005;60(5):401–409. doi: 10.1136/thx.2004.030205. [DOI] [PMC free article] [PubMed] [Google Scholar]
- 16.Lam M. H.-B., Wing Y.-K., Yu M. W.-M., et al. Mental morbidities and chronic fatigue in severe acute respiratory syndrome survivors: long-term follow-up. Archives of Internal Medicine . 2009;169(22):2142–2147. doi: 10.1001/archinternmed.2009.384. [DOI] [PubMed] [Google Scholar]
- 17.Datta S. D., Talwar A., Lee J. T. A proposed framework and timeline of the spectrum of disease due to SARS-CoV-2 infection: illness beyond acute infection and public health implications. JAMA . 2020;324(22):2251–2252. doi: 10.1001/jama.2020.22717. [DOI] [PubMed] [Google Scholar]
- 18.Greenhalgh T., Knight M., A’Court C., Buxton M., Husain L. Management of post-acute Covid-19 in primary care. BMJ . 2020;370 doi: 10.1136/bmj.m3026.m3026 [DOI] [PubMed] [Google Scholar]
- 19.Cabrera Martimbianco A. L., Pacheco R. L., Bagattini Â. M., Riera R. Frequency, signs and symptoms, and criteria adopted for long COVID-19: a systematic review. International Journal of Clinical Practice . 2021;75(10) doi: 10.1111/ijcp.14357.e14357 [DOI] [PMC free article] [PubMed] [Google Scholar]
- 20.Nalbandian A., Sehgal K., Gupta A., et al. Post-acute COVID-19 syndrome. Nature Medicine . 2021;27(4):601–615. doi: 10.1038/s41591-021-01283-z. [DOI] [PMC free article] [PubMed] [Google Scholar]
- 21.Dhawan R. T., Gopalan D., Howard L., et al. Beyond the clot: perfusion imaging of the pulmonary vasculature after COVID-19. The Lancet Respiratory Medicine . 2021;9(1):107–116. doi: 10.1016/s2213-2600(20)30407-0. [DOI] [PMC free article] [PubMed] [Google Scholar]
- 22.Graham B. L., Steenbruggen I., Miller M. R., et al. Standardization of spirometry 2019 update. An official American thoracic society and European respiratory society technical statement. American Journal of Respiratory and Critical Care Medicine . 2019;200(8):e70–e88. doi: 10.1164/rccm.201908-1590st. [DOI] [PMC free article] [PubMed] [Google Scholar]
- 23.Rassouli F., Thurnheer R. Spiroergometrie–indikation, durchführung und interpretation. Swiss Medical Forum . 2015;15:315–321. doi: 10.4414/smf.2015.02227. [DOI] [Google Scholar]
- 24.Gläser S., Ittermann T., Schäper C., et al. Referenzwerte für die spiroergometrie–ergebnisse der study of health in pomerania (SHIP) Pneumologie . 2012;67(1):58–63. doi: 10.1055/s-0032-1325951. [DOI] [PubMed] [Google Scholar]
- 25.Guazzi M., Adams V., Conraads V., et al. EACPR/AHA scientific statement. Clinical recommendations for cardiopulmonary exercise testing data assessment in specific patient populations. Circulation . 2012;126(18):2261–2274. doi: 10.1161/cir.0b013e31826fb946. [DOI] [PMC free article] [PubMed] [Google Scholar]
- 26.Augustin M., Schommers P., Stecher M., et al. Post-COVID syndrome in non-hospitalised patients with COVID-19: a longitudinal prospective cohort study. The Lancet Regional Health-Europe . 2021;6 doi: 10.1016/j.lanepe.2021.100122.100122 [DOI] [PMC free article] [PubMed] [Google Scholar]
- 27.Rajpal S., Tong M. S., Borchers J., et al. Cardiovascular magnetic resonance findings in competitive athletes recovering from COVID-19 infection. JAMA Cardiology . 2021;6(1):116–118. doi: 10.1001/jamacardio.2020.4916. [DOI] [PMC free article] [PubMed] [Google Scholar]
- 28.Fox S. E., Lameira F. S., Rinker E. B., Vander Heide R. S. Cardiac endotheliitis and multisystem inflammatory syndrome after COVID-19. Annals of Internal Medicine . 2020;173(12):1025–1027. doi: 10.7326/l20-0882. [DOI] [PMC free article] [PubMed] [Google Scholar]
- 29.Shi S., Qin M., Shen B., et al. Association of cardiac injury with mortality in hospitalized patients with COVID-19 in Wuhan, China. JAMA Cardiology . 2020;5(7):p. 802. doi: 10.1001/jamacardio.2020.0950. [DOI] [PMC free article] [PubMed] [Google Scholar]
- 30.Giustino G., Croft L. B., Oates C. P., et al. Takotsubo cardiomyopathy in COVID-19. Journal of the American College of Cardiology . 2020;76(5):628–629. doi: 10.1016/j.jacc.2020.05.068. [DOI] [PMC free article] [PubMed] [Google Scholar]
- 31.Creel-Bulos C., Hockstein M., Amin N., Melhem S., Truong A., Sharifpour M. Acute cor pulmonale in critically ill patients with Covid-19. New England Journal of Medicine . 2020;382(21):p. e70. doi: 10.1056/nejmc2010459. [DOI] [PMC free article] [PubMed] [Google Scholar]
- 32.Poissy J., Goutay J., Caplan M., et al. Pulmonary embolism in patients with COVID-19. Circulation . 2020;142(2):184–186. doi: 10.1161/CIRCULATIONAHA.120.047430. [DOI] [PubMed] [Google Scholar]
- 33.Zheng Y.-Y., Ma Y.-T., Zhang J.-Y., Xie X. COVID-19 and the cardiovascular system. Nature Reviews Cardiology . 2020;17(5):259–260. doi: 10.1038/s41569-020-0360-5. [DOI] [PMC free article] [PubMed] [Google Scholar]
- 34.Ackermann M., Verleden S. E., Kuehnel M., et al. Pulmonary vascular endothelialitis, thrombosis, and angiogenesis in Covid-19. New England Journal of Medicine . 2020;383(2):120–128. doi: 10.1056/nejmoa2015432. [DOI] [PMC free article] [PubMed] [Google Scholar]
- 35.Varga Z., Flammer A. J., Steiger P., et al. Endothelial cell infection and endotheliitis in COVID-19. The Lancet . 2020;395(10234):1417–1418. doi: 10.1016/S0140-6736(20)30937-5. [DOI] [PMC free article] [PubMed] [Google Scholar]
- 36.Lei Y., Zhang J., Schiavon C. R., et al. SARS-CoV-2 spike protein impairs endothelial function via downregulation of ACE2. bioRxiv: the Preprint Server for Biology . 2020;54:337–348. doi: 10.1101/2020.12.04.409144. [DOI] [Google Scholar]
- 37.Teuwen L.-A., Geldhof V., Pasut A., Carmeliet P. COVID-19: the vasculature unleashed. Nature Reviews Immunology . 2020;20(7):389–391. doi: 10.1038/s41577-020-0343-0. [DOI] [PMC free article] [PubMed] [Google Scholar]
- 38.Elesela S., Lukacs N. W. Role of mitochondria in viral infections. Life . 2021;11:1–15. doi: 10.3390/life11030232. [DOI] [PMC free article] [PubMed] [Google Scholar]
- 39.Rovas A., Osiaevi I., Buscher K., et al. Microvascular dysfunction in COVID-19: the MYSTIC study. Angiogenesis . 2021;24(1):145–157. doi: 10.1007/s10456-020-09753-7. [DOI] [PMC free article] [PubMed] [Google Scholar]
- 40.Bilbao-Malavé V., González-Zamora J., Saenz de Viteri M., et al. Persistent retinal microvascular impairment in COVID-19 bilateral pneumonia at 6-months follow-up assessed by optical coherence tomography angiography. Biomedicines . 2021;9(5):p. 502. doi: 10.3390/biomedicines9050502. [DOI] [PMC free article] [PubMed] [Google Scholar]
- 41.Kubánková M., Hohberger B., Hoffmanns J., et al. Physical phenotype of blood cells is altered in COVID-19. Biophysical Journal . 2021;120(14):2838–2847. doi: 10.1016/j.bpj.2021.05.025. [DOI] [PMC free article] [PubMed] [Google Scholar]
- 42.Carruthers B. M., Jain A. K., De Meirleir K. L., et al. Myalgic encephalomyelitis/chronic fatigue syndrome. Journal of Chronic Fatigue Syndrome . 2003;11(1):7–115. doi: 10.1300/j092v11n01_02. [DOI] [Google Scholar]
- 43.Bond J., Nielsen T., Hodges L. Effects of post-exertional malaise on markers of arterial stiffness in individuals with myalgic encephalomyelitis/chronic fatigue syndrome. International Journal of Environmental Research and Public Health . 2021;18(5) doi: 10.3390/ijerph18052366.2366 [DOI] [PMC free article] [PubMed] [Google Scholar]
- 44.Scherbakov N., Szklarski M., Hartwig J., et al. Peripheral endothelial dysfunction in myalgic encephalomyelitis/chronic fatigue syndrome. ESC Heart Failure . 2020;7(3):1064–1071. doi: 10.1002/ehf2.12633. [DOI] [PMC free article] [PubMed] [Google Scholar]
- 45.Wirth K., Scheibenbogen C. A unifying hypothesis of the pathophysiology of myalgic encephalomyelitis/chronic fatigue syndrome (ME/CFS): recognitions from the finding of autoantibodies against ß2-adrenergic receptors. Autoimmunity Reviews . 2020;19(6) doi: 10.1016/j.autrev.2020.102527.102527 [DOI] [PubMed] [Google Scholar]
- 46.van Campen C. M. C., Verheugt F. W. A., Rowe P. C., Visser F. C. Cerebral blood flow is reduced in ME/CFS during head-up tilt testing even in the absence of hypotension or tachycardia: a quantitative, controlled study using Doppler echography. Clinical Neurophysiology Practice . 2020;5:50–58. doi: 10.1016/j.cnp.2020.01.003. [DOI] [PMC free article] [PubMed] [Google Scholar]
- 47.Myhill S., Booth N. E., McLaren-Howard J. Chronic fatigue syndrome and mitochondrial dysfunction. International Journal of Clinical and Experimental Medicine . 2009;2(1):1–16. [PMC free article] [PubMed] [Google Scholar]
- 48.Booth N. E., Myhill S., McLaren-Howard J. Mitochondrial dysfunction and the pathophysiology of myalgic encephalomyelitis/chronic fatigue syndrome (ME/CFS) International Journal of Clinical and Experimental Medicine . 2012;5(3):208–220. [PMC free article] [PubMed] [Google Scholar]
- 49.Jammes Y., Steinberg J. G., Mambrini O., Bregeon F., Delliaux S. Chronic fatigue syndrome: assessment of increased oxidative stress and altered muscle excitability in response to incremental exercise. Journal of Internal Medicine . 2005;257(3):299–310. doi: 10.1111/j.1365-2796.2005.01452.x. [DOI] [PubMed] [Google Scholar]
- 50.Keller B. A., Pryor J., Giloteaux L. Inability of myalgic encephalomyelitis/chronic fatigue syndrome patients to reproduce VO2peak indicates functional impairment. Journal of Translational Medicine . 2014;12(1):p. 104. doi: 10.1186/1479-5876-12-104. [DOI] [PMC free article] [PubMed] [Google Scholar]
- 51.Vermeulen R. C., Vermeulen van Eck I. W. Decreased oxygen extraction during cardiopulmonary exercise test in patients with chronic fatigue syndrome. Journal of Translational Medicine . 2014;12:20–26. doi: 10.1186/1479-5876-12-20. [DOI] [PMC free article] [PubMed] [Google Scholar]
- 52.Helms J., Tacquard C., Tacquard C., et al. High risk of thrombosis in patients with severe SARS-CoV-2 infection: a multicenter prospective cohort study. Intensive Care Medicine . 2020;46(6):1089–1098. doi: 10.1007/s00134-020-06062-x. [DOI] [PMC free article] [PubMed] [Google Scholar]
- 53.Lax S. F., Skok K., Zechner P., et al. Pulmonary arterial thrombosis in COVID-19 with fatal outcome. Annals of Internal Medicine . 2020;173(5):350–361. doi: 10.7326/m20-2566. [DOI] [PMC free article] [PubMed] [Google Scholar]
- 54.Lax S. F., Skok K., Trauner M. Pulmonary arterial thrombosis as an important complication of COVID-19 pulmonary disease: letter to the editor. Virchows Archiv . 2020;477(3):467–468. doi: 10.1007/s00428-020-02896-4. [DOI] [PMC free article] [PubMed] [Google Scholar]
- 55.Merrill J. T., Erkan D., Winakur J., James J. A. Emerging evidence of a COVID-19 thrombotic syndrome has treatment implications. Nature Reviews Rheumatology . 2020;16(10):581–589. doi: 10.1038/s41584-020-0474-5. [DOI] [PMC free article] [PubMed] [Google Scholar]
- 56.Patel B. V., Arachchillage D. J., Ridge C. A., et al. Pulmonary angiopathy in severe COVID-19: physiologic, imaging, and hematologic observations. American Journal of Respiratory and Critical Care Medicine . 2020;202(5):690–699. doi: 10.1164/rccm.202004-1412OC. [DOI] [PMC free article] [PubMed] [Google Scholar]
- 57.Overstad S., Tjonnfjord E., Garabet L., et al. Venous thromboembolism and coronavirus disease 2019 in an ambulatory care setting-a report of 4 cases. Thrombosis Research . 2020;194:116–118. doi: 10.1016/j.thromres.2020.06.032. [DOI] [PMC free article] [PubMed] [Google Scholar]
- 58.Gervaise A., Bouzad C., Peroux E., Helissey C. Acute pulmonary embolism in non-hospitalized COVID-19 patients referred to CTPA by emergency department. European Radiology . 2020;30(11):6170–6177. doi: 10.1007/s00330-020-06977-5. [DOI] [PMC free article] [PubMed] [Google Scholar]
- 59.Uppuluri E. M., Shapiro N. L. Development of pulmonary embolism in a nonhospitalized patient with COVID-19 who did not receive venous thromboembolism prophylaxis. American Journal of Health-System Pharmacy . 2020;77(23):1957–1960. doi: 10.1093/ajhp/zxaa286. [DOI] [PMC free article] [PubMed] [Google Scholar]
- 60.Milovancev A., Avakumovic J., Lakicevic N., et al. Cardiorespiratory fitness in volleyball athletes following a COVID-19 infection: a cross-sectional study. International Journal of Environmental Research and Public Health . 2021;18(8) doi: 10.3390/ijerph18084059.4059 [DOI] [PMC free article] [PubMed] [Google Scholar]
Associated Data
This section collects any data citations, data availability statements, or supplementary materials included in this article.
Data Availability Statement
The datasets used and/or analyzed during the current study are available from the corresponding author on reasonable request.