Abstract
Studying cellular and developmental processes in complex multicellular organisms can require the non-destructive observation of thousands to billions of cells deep within an animal. DNA recorders address the staggering difficulty of this task by converting transient cellular experiences into mutations at defined genomic sites that can be sequenced later in high throughput. However, existing recorders act primarily by erasing DNA. This is problematic because, in the limit of progressive erasure, no record remains. We present a DNA recorder called CHYRON (Cell HistorY Recording by Ordered iNsertion) that acts primarily by writing new DNA through the repeated insertion of random nucleotides at a single locus in temporal order. To achieve in vivo DNA writing, CHYRON combines Cas9, a homing guide RNA, and the template-independent DNA polymerase TdT. We successfully applied CHYRON as an evolving lineage tracer and as a recorder of user-selected cellular stimuli.
Observation of living organisms as they develop is a cornerstone of biology. Over time, our ability to observe ever-smaller organisms, individual cells within multicellular organisms, and molecules within cells has improved with advances in microscopy and the continuing development of genetically encoded labels that can be imaged non-destructively (e.g., GFP). However, live imaging of single cells in intact organisms is still constrained by context and scale. Animals, for example, tend to be opaque and even when developmental processes are accessible to microscopy1, cell tracking poses significant computational and data management challenges when the number of cells under observation exceeds tens of thousands. An alternative paradigm to real-time observation is DNA recording. In DNA recording, transient cellular events are engineered to trigger permanent mutations in a cell’s own genome (Figure 1a–b). Since DNA is both durable and propagating and since the throughput of DNA sequencing is in the hundreds of millions of unique DNA molecules, the long-term behavior of cells could be stored as mutations and read out later at unprecedented depth. Although the reading step is destructive, recording is not, creating an effective alternative to real-time observation that can scale to millions of cells in opaque model animals such as mice.
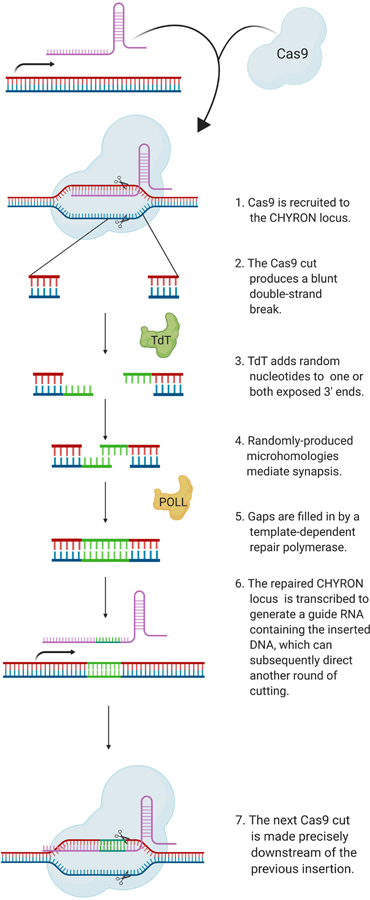
Figure 1. CHYRON: accumulation of insertion mutations in temporal order for the recording of cell history.
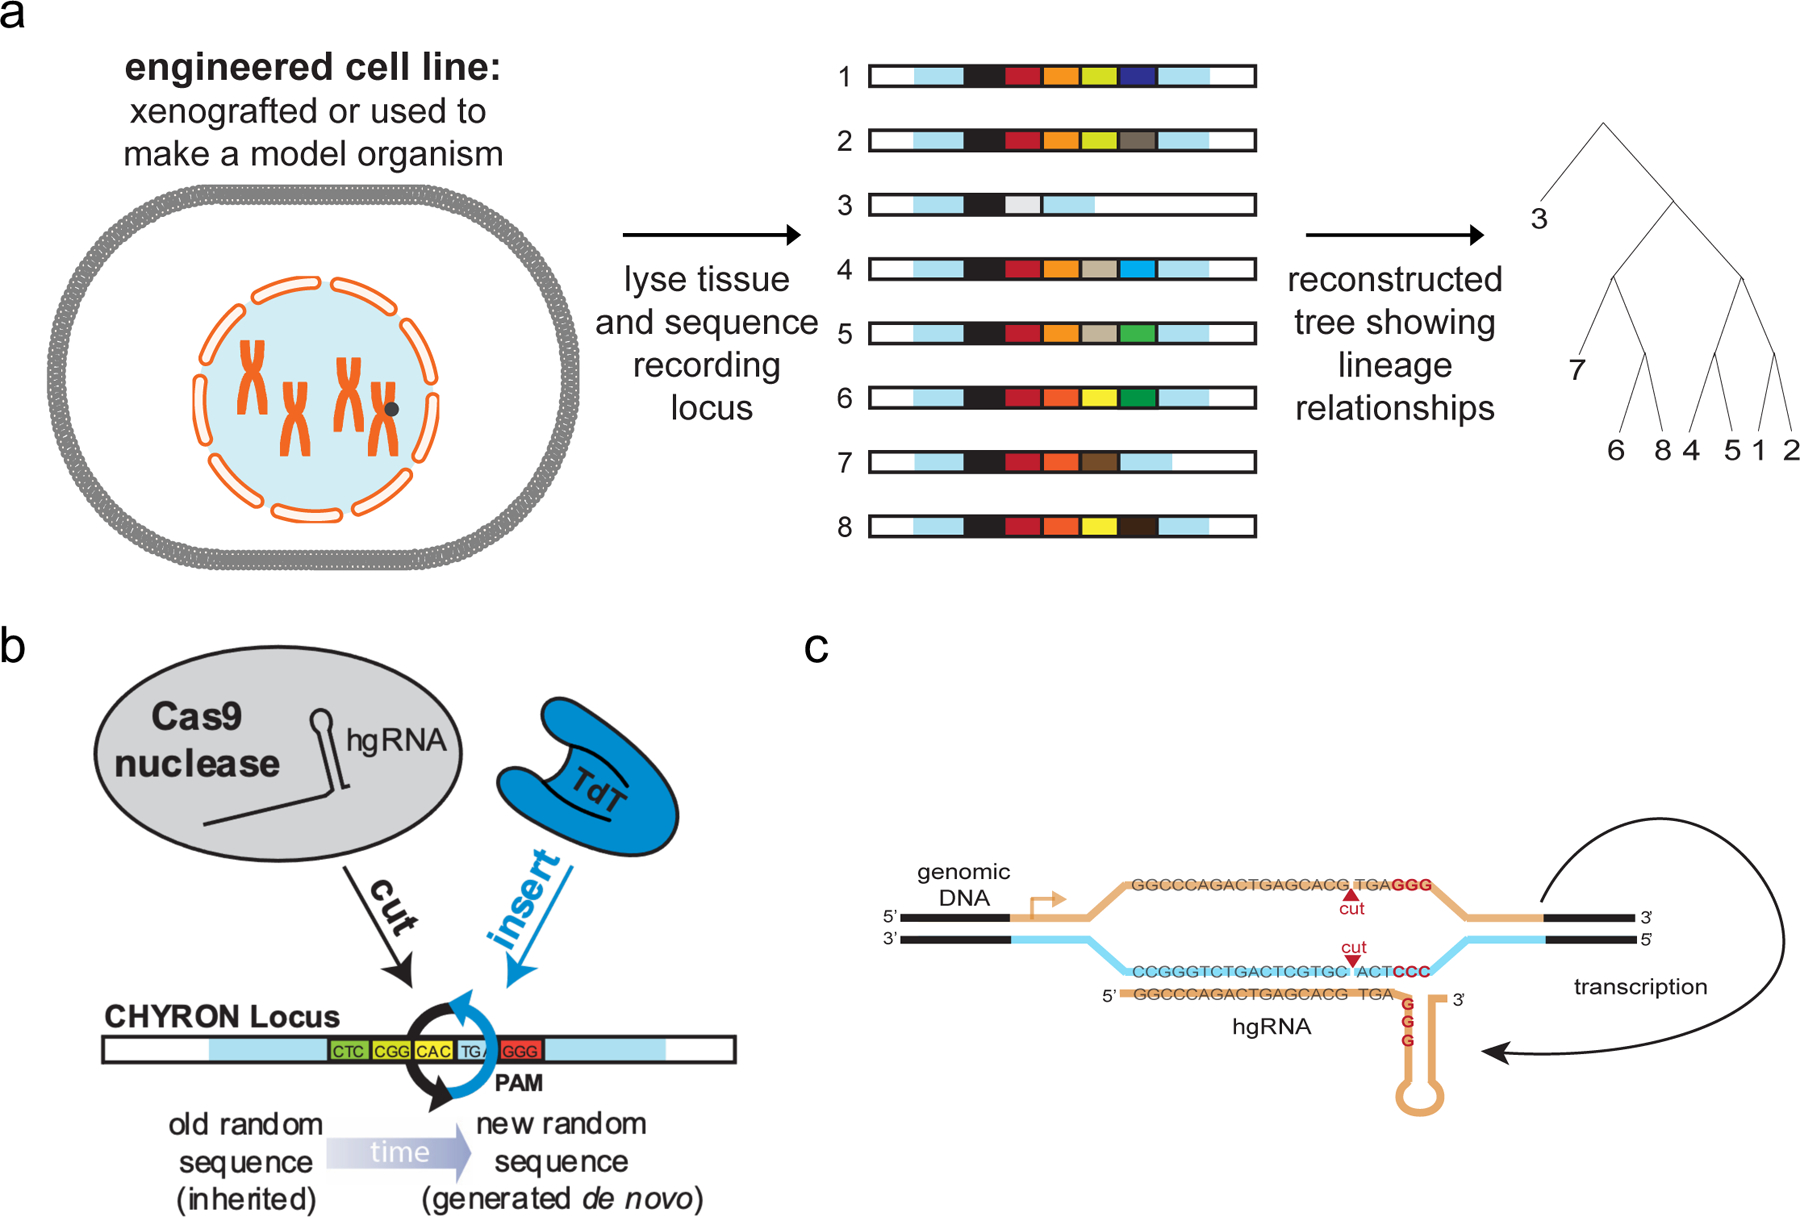
Model: the constitutive expression of Cas9 and TdT mediates the ordered acquisition of random insertion mutations, represented as differently-colored boxes, written by TdT. (a) Each cell is represented by one unique sequence, accumulated at the marked synthetic locus, which can be compared to other sequences to reconstruct the lineage of the cells. (b) The CHYRON locus is cut by Cas9, insertions are added by TdT, and the process repeats to generate a series of ordered insertions. (c) The CHYRON locus encodes a homing guide RNA, which directs Cas9 to the DNA that encodes it3–4.
DNA recording has recently been transformed by the development of genetically-encoded CRISPR-based systems that drive the rapid accumulation of mutations at neutral loci in cellular genomes2–17. When the activity of such systems is linked to the presence of an arbitrary biological stimulus, accumulated mutations become a record of the strength and duration of exposure to the stimulus3,5,7,8; when activity is constitutive, accumulated mutations capture lineage relationships among individual cells2,4,6,11–13,16–18. Two recent architectures for CRISPR-based recording systems are particularly amenable to recording at a single genomic locus in large numbers of mammalian cells. The first architecture relies on arrays of Streptococcus pyogenes Cas9 target sites2,12,13,17,18. Here, Cas9 targets random elements of the array to generate insertions and deletions (indels) at array elements such that the progressive accumulation of indels across the array marks cells with their lineage relationships or their history of exposure to a stimulus. The second architecture relies on a self-targeting3 or homing4,11 guide RNA (hgRNA) that directs Cas9 to the very locus from which the hgRNA is expressed (Figure 1c). The locus changes over time through a series of indels whose pattern reflects lineage information4,11 or exposure to stimuli3. These two types of DNA recording systems have been used to identify the early and late embryonic origin of thousands of cell lineages in adult zebrafish2,12,13,18, trace hematopoiesis in mice17, and record inflammation exposure in 293T cells implanted into mice treated with lipopolysaccharide3. However, since the progressive accumulation of deletions at a single site quickly corrupts or removes previous deletion patterns3,4, and continuous editing of an array of sites at a single locus can lead to multiple simultaneous cuts with loss of intervening indels2,17, these DNA recording systems are limited by their information-encoding capacity and durability. In other words, existing DNA recording systems erase DNA as their primary mode of recording information; although patterns of erasures contain new information, the inherent contradiction in removing DNA to add information creates fundamental challenges in the continued development of existing designs.
Ideally, a recorder would be capable of accumulating arbitrarily large amounts of new information through a series of updates that do not change or reverse previous updates. This could be accomplished by a DNA writing system in which insertions are sequentially added to a locus without disrupting previous insertions. We present a first version of such a recorder in CHYRON (Figure 1). CHYRON combines a Cas9 nuclease with an hgRNA and a template-independent DNA polymerase, terminal deoxynucleotidyl transferase (TdT)19,20, which we show can efficiently add random nucleotides (nts) at Cas9-induced DSBs (Figure 2). The newly added nts are then incorporated into the repaired DSB to produce a heritable insertion mutation consisting of random base pairs (bps). Since an hgRNA repeatedly directs Cas9 to cut the locus encoding the hgRNA at a defined location relative to the protospacer-adjacent motif (PAM)3,4, cycles of cutting, nt insertion by TdT, and repair result in progressive and ordered insertional mutagenesis (Figure 1 and Extended Data Figure 1). We describe the successful implementation of CHYRON and its application to lineage reconstruction and the recording of hypoxia. We find that the information generated at a single <100 bp CHYRON locus is sufficient to reconstruct the relatedness of populations containing hundreds of lineages as well as to report on the duration of exposure to a hypoxia mimic. This opens up the possibility of following development and profiling heterogeneous responses of cells to unevenly distributed or dynamic stresses at high cellular resolution in animals.
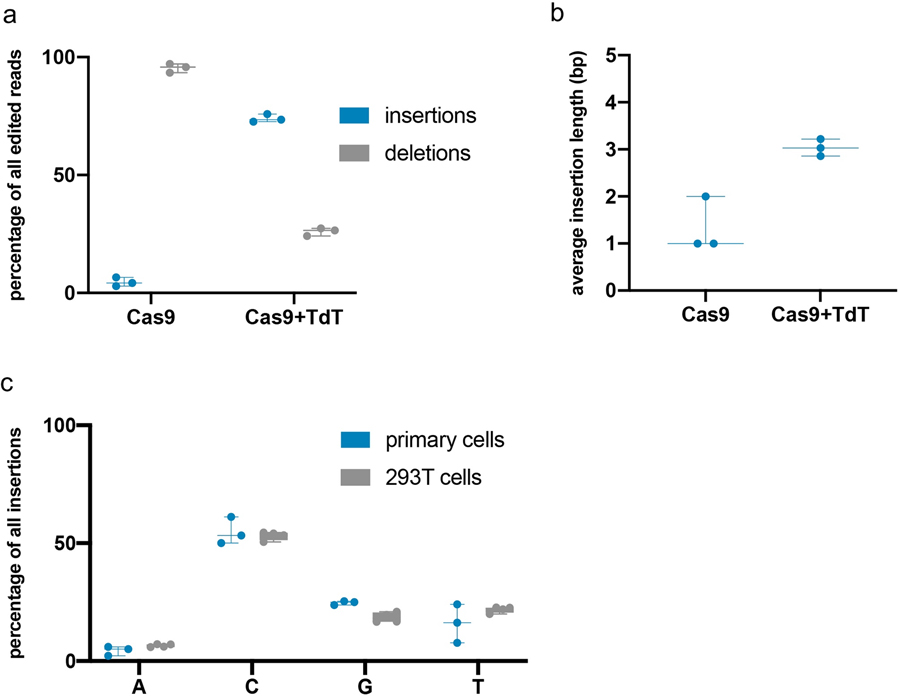
Figure 2. TdT writes stretches of random nucleotides at a Cas9-induced DSB.
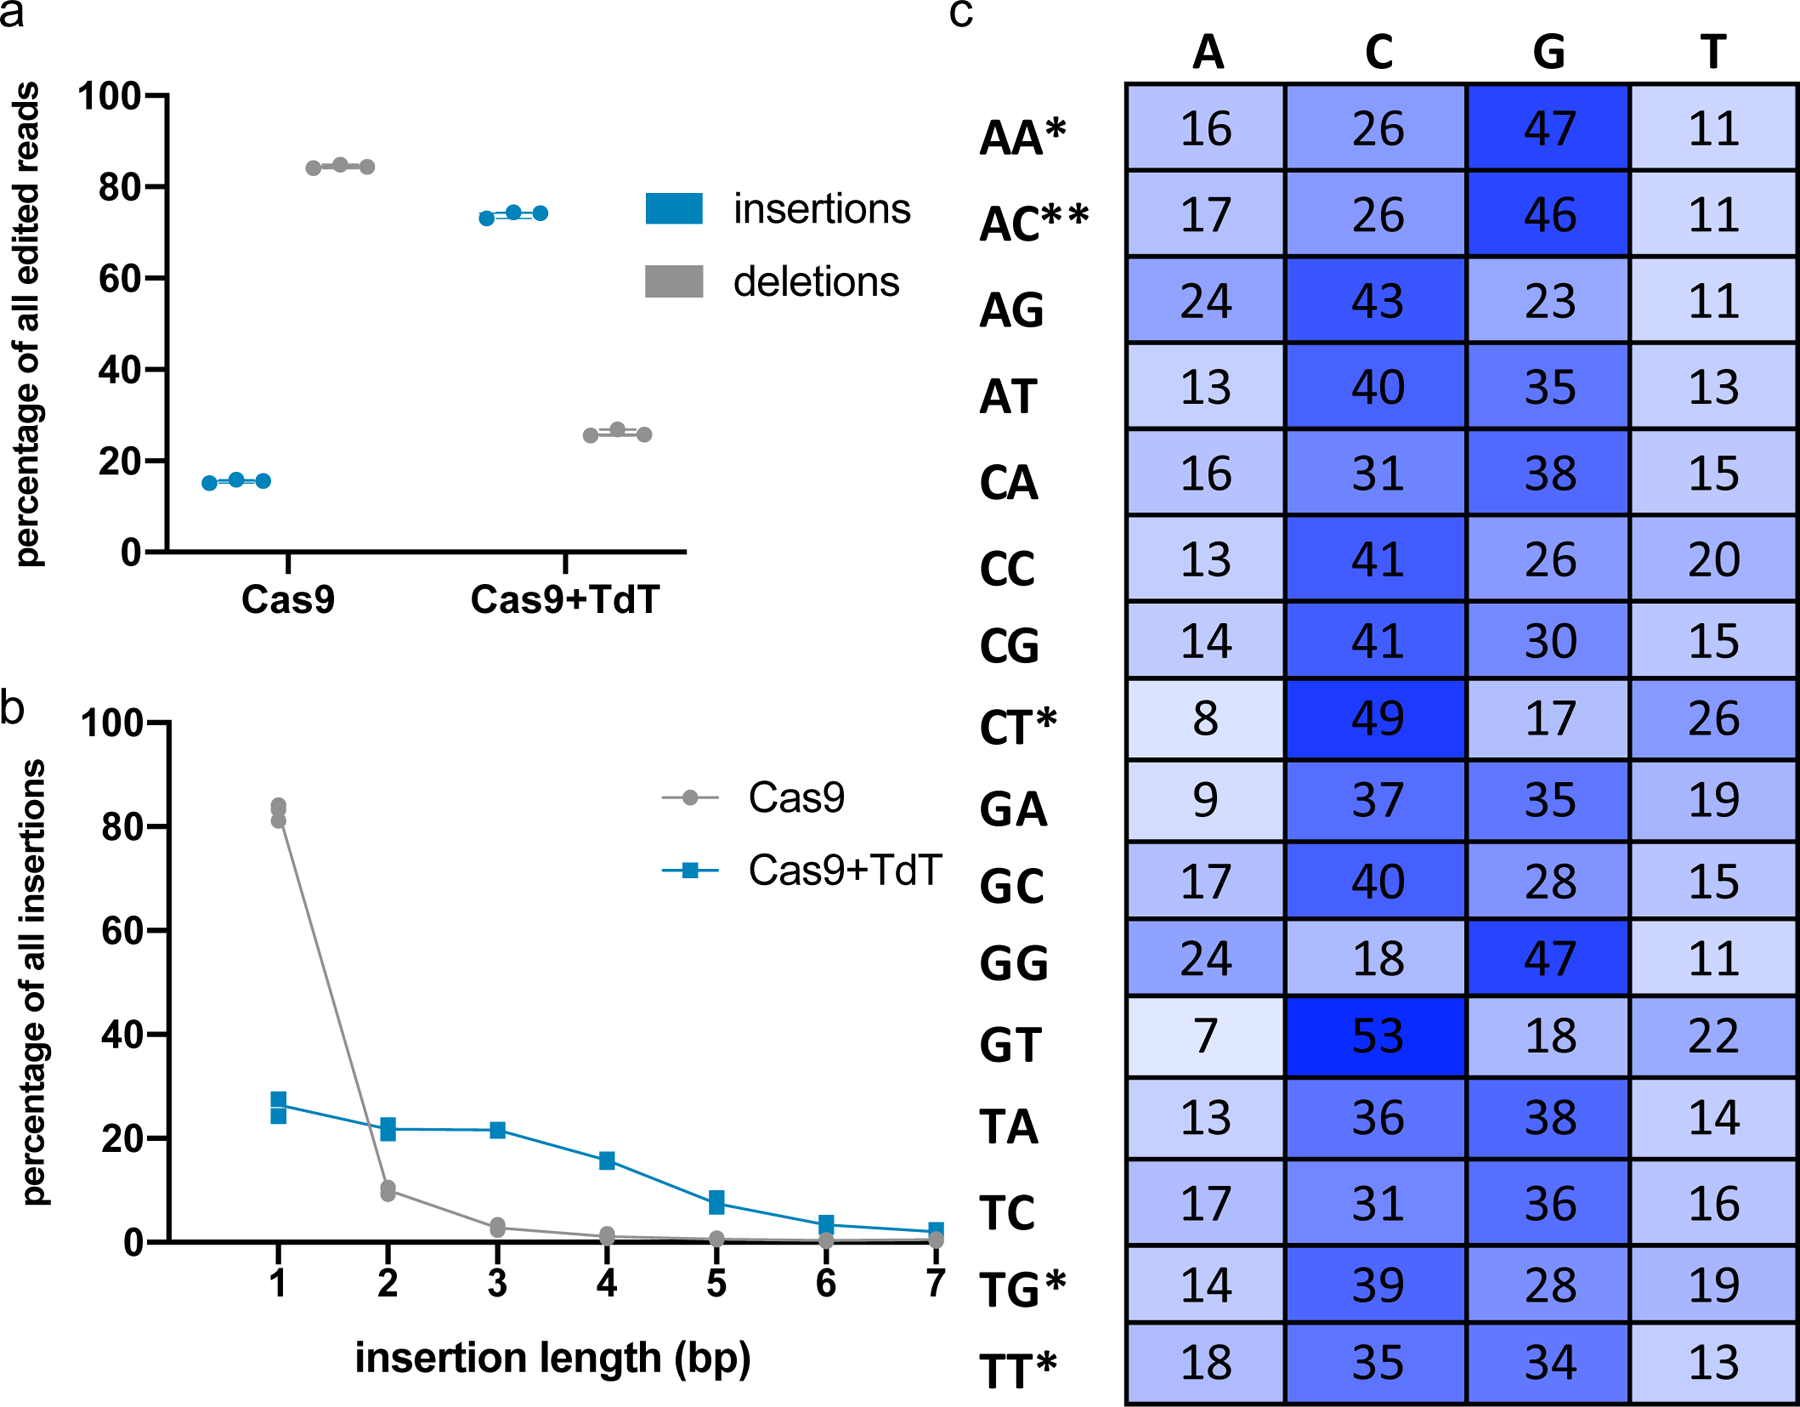
(a) Expression of TdT promoted insertion mutations. 293T cells were transfected with plasmids expressing Cas9 and TdT, or Cas9 alone, and an sgRNA against a genomic site (HEK293site3). Three days later, cells were collected, DNA was extracted, and the targeted genomic site was amplified by PCR and sequenced by NGS. Each point represents a biological replicate; each biological replicate was carried out with two technical replicates whose mean is plotted. (b) Expression of TdT resulted in longer insertion mutations than those minority insertions created in the presence of Cas9 alone, suggesting that TdT acts as a DNA writer. Of the pool of pure insertions, the percentage of each length was calculated and plotted. Each point represents the mean of two technical replicates of a single biological replicate. (Some points overlap; three biological replicates were assayed.) (c) Insertion sequences generated by TdT were random but had a bias toward G and C nucleotides. 293T cells were transfected with plasmids expressing Cas9 and TdT, and one of 16 sgRNAs against different genomic sites. The target protospacers were chosen to have all possible combinations of nucleotides at the sites 4 and 3 nt upstream of the PAM sequence on the top (non-target) strand (these nucleotide identities are shown on the left of each row). The proportions of each nucleotide (on the top strand) found in all pure insertion sequences 4 bp in length were calculated for each protospacer. Data shown are the average of four replicates (two technical replicates each of two biological replicates), except those marked with *, which are the average of two technical replicates of a single biological replicate, and the row marked with **, which are the average of two biological replicates.
Results
TdT promotes random insertion mutations at Cas9 cuts
The core functionality of CHYRON relies on insertional mutagenesis mediated by TdT. We first tested whether a single round of Cas9 cutting and DSB repair could be intercepted by TdT to generate insertions. In HEK293T cells, we targeted Cas9 to a genomic locus in the presence or absence of TdT, expressed as a separate polypeptide. We then analyzed repair outcomes by PCR amplification of the target locus followed by next-generation sequencing (NGS), taking care to capture substitution, deletion, and insertion mutations equally (see Methods). We found that without TdT, the dominant mutation present at the Cas9 target site was a deletion (84%) or 1 bp insertion (13%) (Figure 2a–b), consistent with previous literature21. With TdT, the dominant mutations were insertions (74%) (Figure 2a), with an average length of 2–4 bps (Figure 2b and Source Data for Figure 2c); this pattern was conserved when the same genomic site was targeted in primary human fibroblasts (Extended Data Figure 2a–b) and across all Cas9-targeted genomic sites tested in 293T cells (Supplementary Figure 1b and Source Data for Figure 2c). TdT promoted insertions most efficiently when expressed without fusion to Cas9 or any other protein (Supplementary Figure 2c). TdT’s dramatic effect on repair outcomes in a single round of editing suggested to us that, once we added an hgRNA, CHYRON would be able to write new DNA over multiple rounds with only moderate sequence corruption or loss through deletions.
TdT-mediated insertions must be random for CHYRON to mark individual cells distinctly during recording. We characterized the bias in bps inserted at various genomic target sites in the presence of Cas9 and TdT. The sites were chosen to represent all 16 possible pairs of −4 and −3 nts relative to the PAM, since Cas9 canonically creates a blunt cut between these −4 and −3 positions and there is a known influence of these flanking nts on editing outcomes11,22–24. We determined the proportions of each bp in insertion mutations produced at these sites in the presence of TdT and calculated a Shannon entropy25 of 1.9 bits per bp (Figure 2c). 1.9 bits is lower than the 2 bits of information a single DNA bp maximally contains, reflecting TdT’s known bias for adding Gs26. However, this deviation from perfectly random bp insertion is slight. When we tested TdT insertion at the same site in 293T cells and primary dermal fibroblasts, we observed nearly identical distributions of inserted nucleotides (Extended Data Figure 2c). We conclude that TdT has the potential to generate high-information insertions at nearly maximal information density for DNA.
CHYRON20 loci accumulate multiple insertions in order
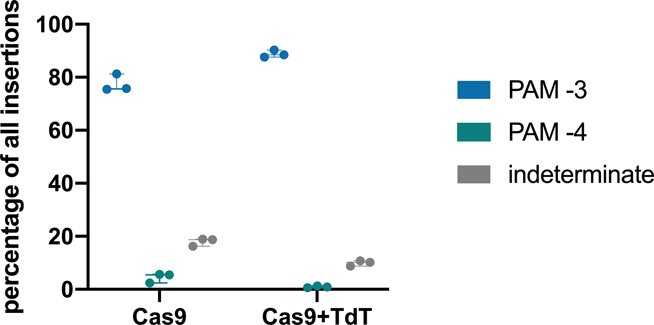
A recording locus should autonomously accumulate mutations over multiple rounds of activity so that cellular and developmental processes occurring over time can be captured. To achieve multiple rounds of DNA writing, we combined TdT with an hgRNA locus to establish CHYRON. Because Cas9-induced DSBs are consistently generated between the −4 and −3 nts relative to the PAM of the hgRNA locus (Extended Data Figure 3), rounds of TdT-mediated insertion mutations should follow in order when repeated (Extended Data Figure 1). This makes CHYRON an ideal recording locus because new insertions will neither remove nor corrupt previous insertions and insertions will be directionally arranged in the exact order in which they are added, simplifying lineage inference and offering options for recording temporal patterns of stimuli (see Discussion).
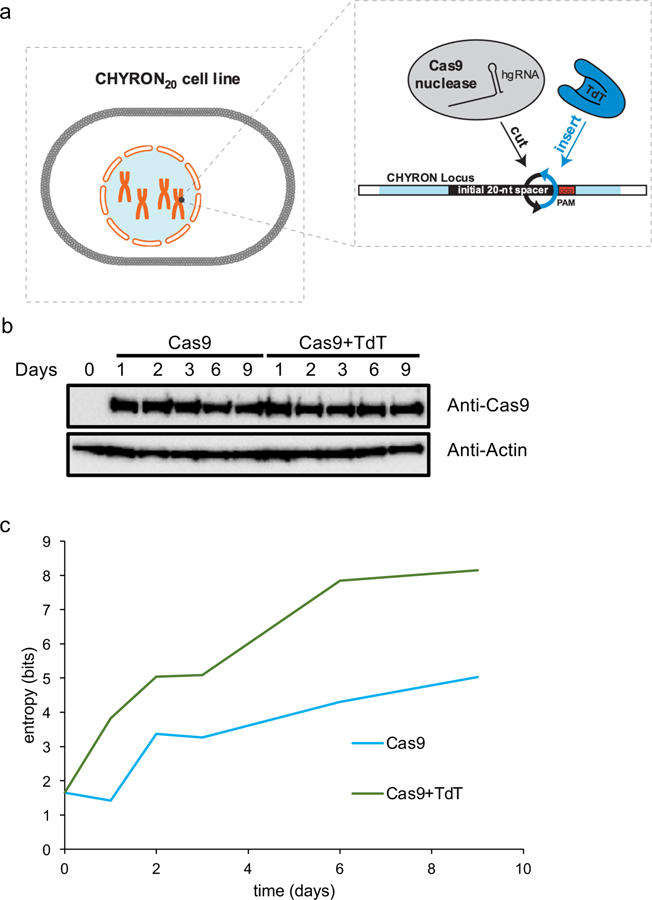
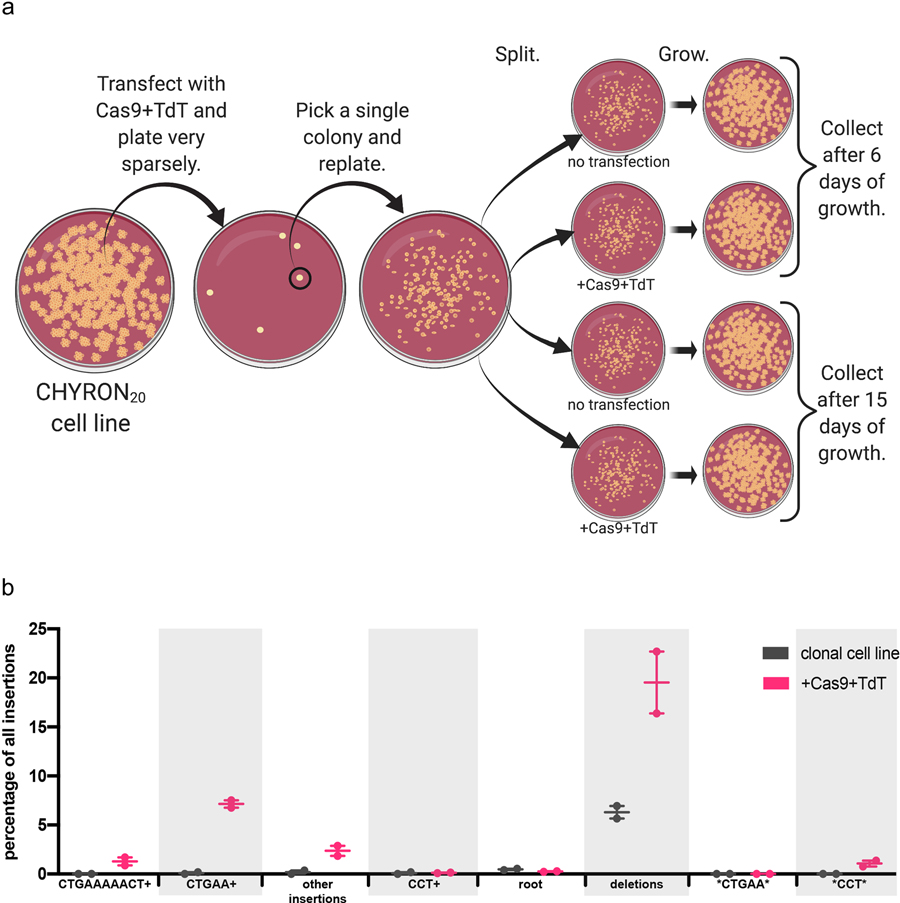
To demonstrate repeated and ordered insertional mutagenesis, we integrated an hgRNA locus, including a 20-nt spacer, at a single site in 293T cells (Extended Data Figure 4a). We call this locus CHYRON20, using the subscript to distinguish this specific instantiation of CHYRON that uses a 20-nt hgRNA spacer from others discussed below. When the cell line containing CHYRON20 (293T-CHYRON20) was transfected with a plasmid encoding Cas9 and TdT for three days, insertions accumulated at the locus over time (Figure 3a–b). As expected, the CHYRON20 locus encoded more information than a benchmark system4 where the same hgRNA was expressed in the presence of Cas9 alone (Extended Data Figure 4c). To test whether multiple rounds of insertion were occurring, we compared our results using CHYRON20 to the experiment shown in Figure 2, in which a genomic locus with the same spacer sequence as CHYRON20 was targeted by an sgRNA that allows for only one round of editing. We found fewer 1–2 bp insertions and more long insertions at the CHYRON20 locus than in the single-round locus (Figure 3c), suggesting that the CHYRON20 locus received multiple rounds of insertions. In order to prove multi-round insertion, we transfected 293T-CHYRON20 with a plasmid encoding Cas9 and TdT, isolated clones that had gained an insertion, and transfected again to observe whether these clones could gain an additional insertion (see Extended Data Figure 5a). Although editing was inefficient, new insertions were abundantly observed, and new insertions were found precisely downstream of the original insertion (Figure 3d, Extended Data Figure 5b, and Supplementary Figure 3).
Figure 3. An integrated hgRNA accumulates insertions in multiple rounds.
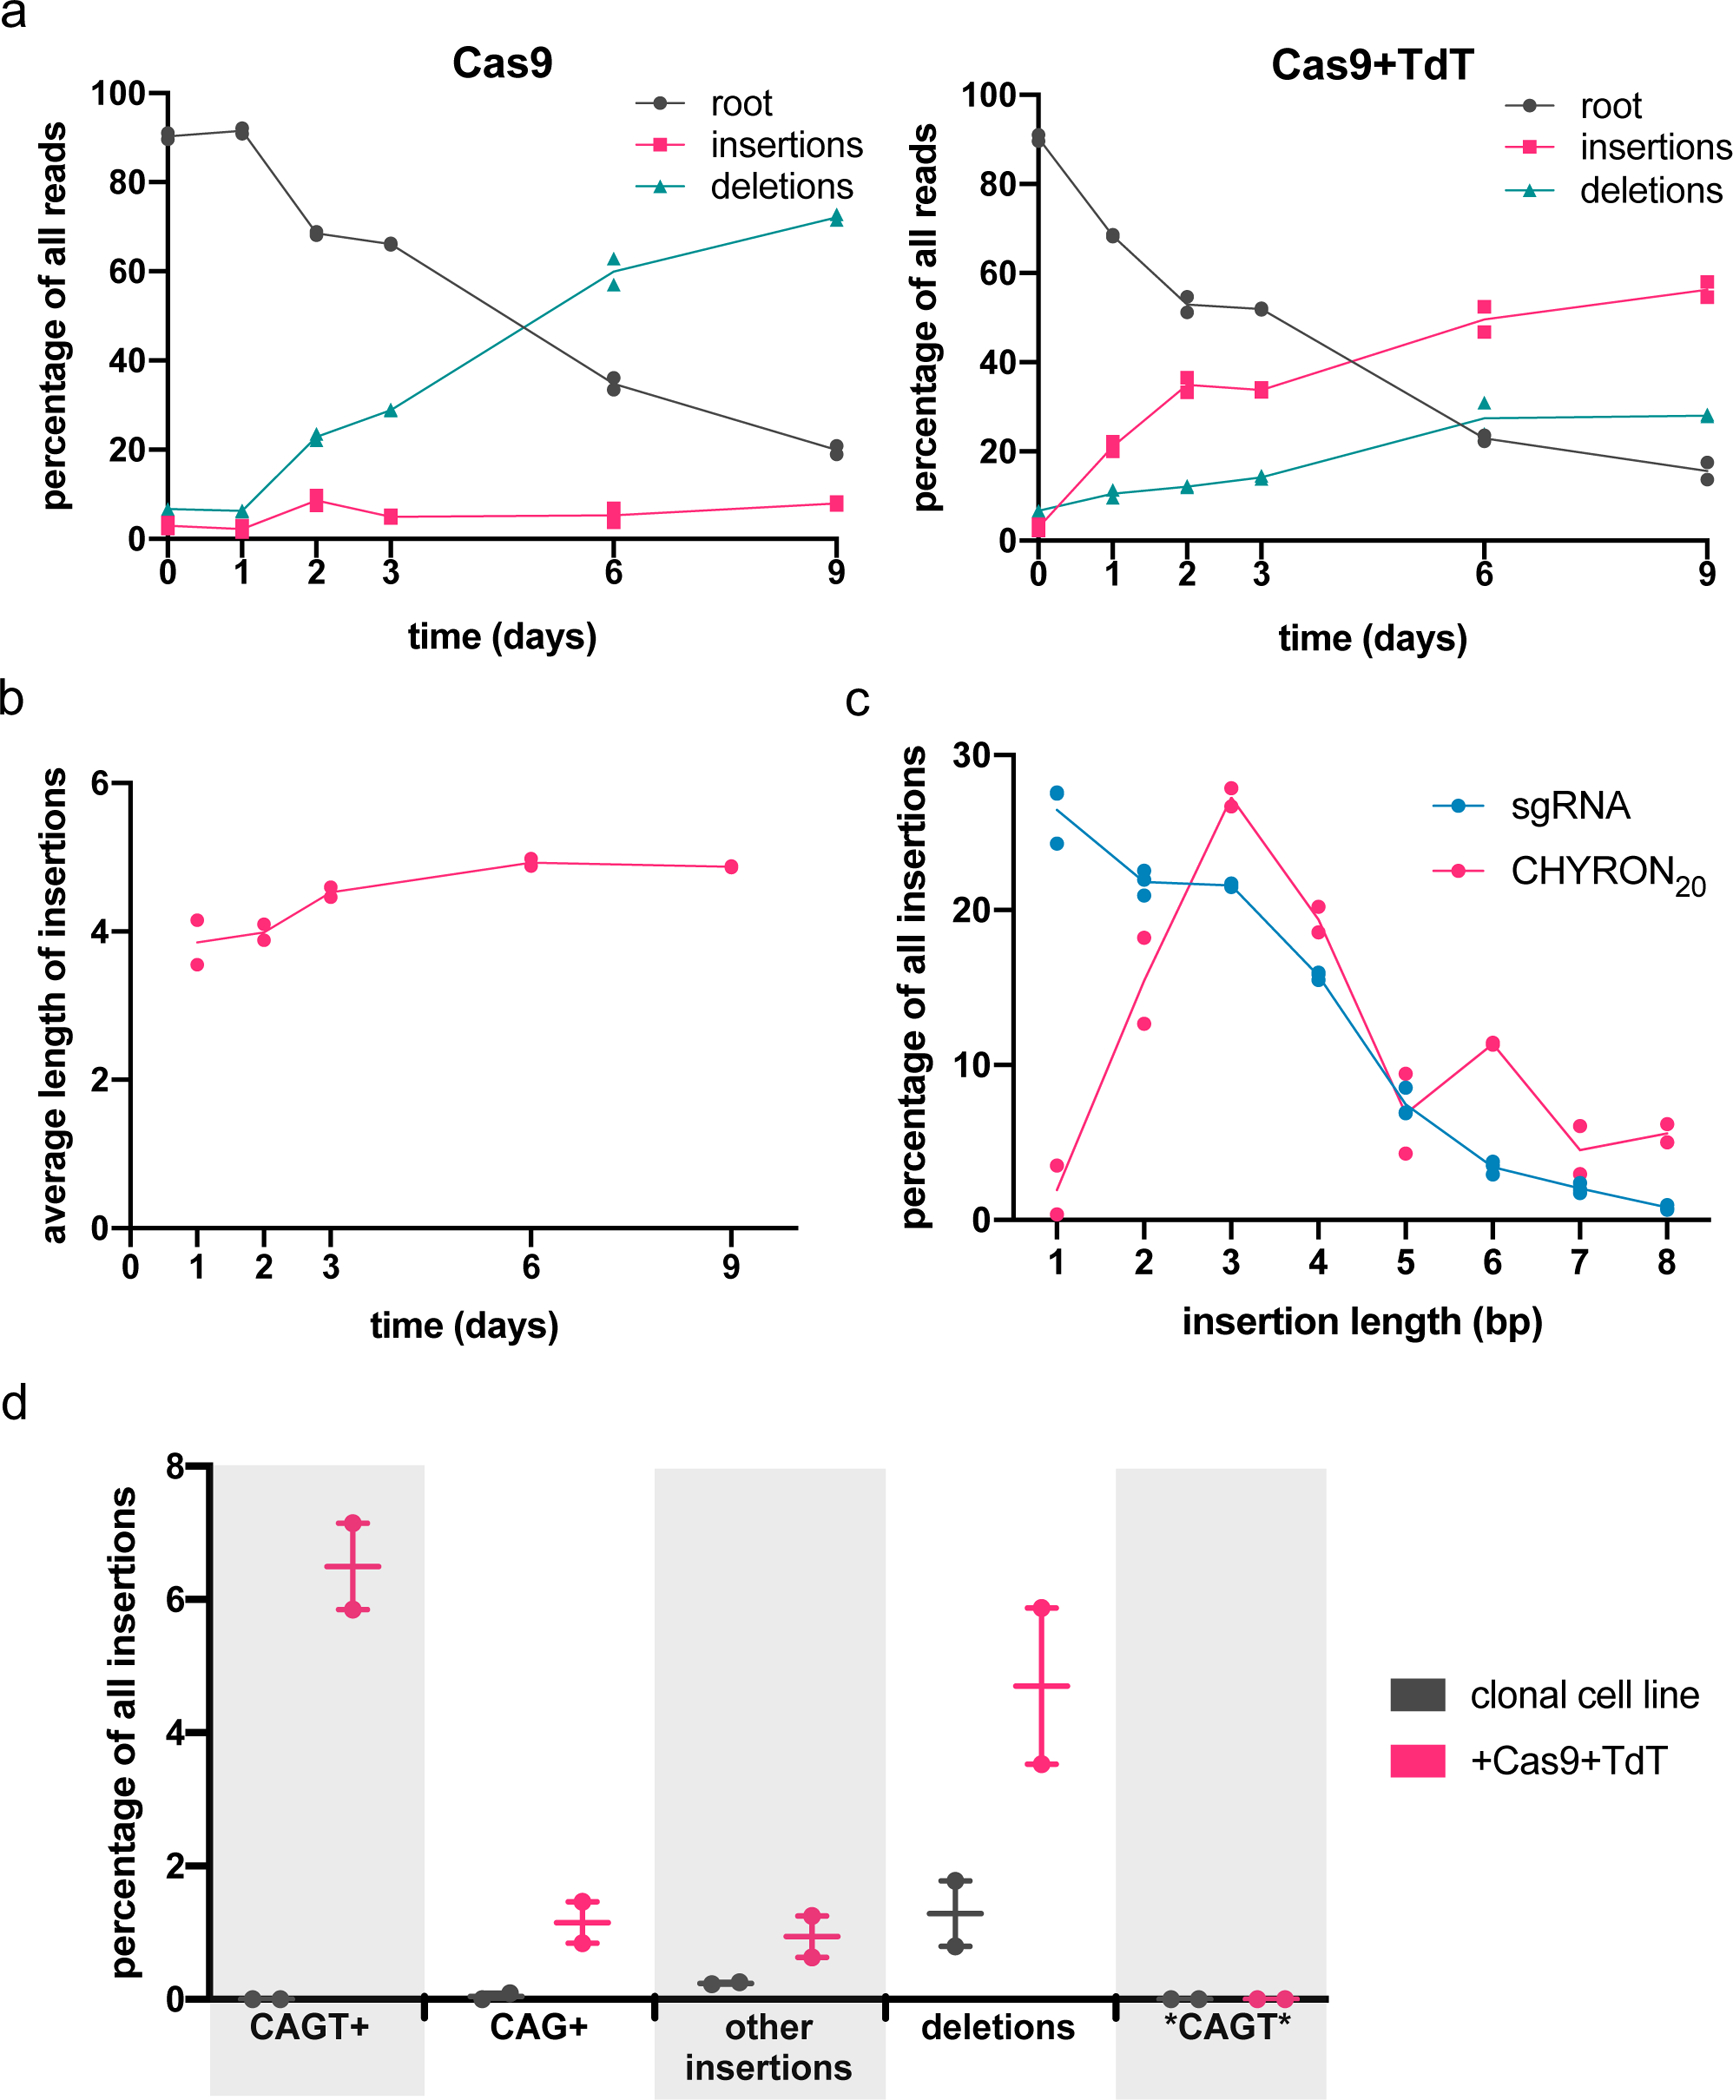
(a) A clonal 293T cell line bearing an integrated hgRNA (hereafter 293T-CHYRON20) was created so that expression of Cas9 and TdT resulted in multiple rounds of insertion of random nucleotides in an ordered fashion. 293T-CHYRON20 cells accumulated insertions and deletions over time when exposed to Cas9 and TdT. 293T-CHYRON20 cells were transfected with a plasmid expressing Cas9 and, optionally, TdT for the indicated time before collection. Cells were re-transfected every three days. The hgRNA locus was sequenced and each sequence was annotated as unchanged (root), pure insertion (insertions), or any sequence that involves a loss of information (deletions). Each point represents a single technical replicate. (Some points overlap; two replicates were assayed.) (b) Insertions grew longer, on average, over time, until the 6-day timepoint, then stopped growing. All sequences containing pure insertions were considered, and the average lengths calculated. Each point represents a single technical replicate. (Some points overlap; two replicates were assayed.) (c) Longer insertions were more abundant for an hgRNA than for a protospacer targeted in a single round. Insertion lengths at the CHYRON20 locus after 3 days of Cas9 and TdT expression were compared to insertions at a genomic site with the same spacer sequence targeted with an sgRNA (data from Figure 2b). Each point represents a single technical replicate. (Some points overlap; two replicates were assayed.) (d) Cas9 and TdT mediated multiple rounds of editing on an integrated hgRNA. The 293T-CHYRON20 cell line was transfected with Cas9 and TdT to induce insertions, then a single colony was isolated. This new cell line bearing an insertion with the sequence CAGT was then transfected again with a plasmid expressing Cas9 and TdT. These cells, and an untransfected control, were grown for 15 days, then collected. The CHYRON locus was sequenced and editing outcomes were determined to be the root CHYRON20 sequence (not shown), deletions, the dominant CAGT insertion (not shown), an insertion containing the prefix CAGT or CAG (CAGT+ or CAG+, respectively), an insertion containing the sequence CAGT other than as a prefix (*CAGT*), or other insertions. Each point represents a single biological replicate.
CHYRON20 gave our basic desired behavior, progressively inserting short random bp stretches in order, but it was clear CHYRON20 could be improved. In particular, we deduced that CHYRON20 only underwent an average of ~1.5 rounds of insertion, because the average insertion length at the end of the experiment, considering all sequences that had insertions, was 4.9 bp (Figure 3b), whereas a single round of insertions generates only 2.88 bp on average (Source Data for Figure 2c). We next sought to improve CHYRON to be capable of more rounds of activity to enable a greater recording capacity.
CHYRON16i accumulates an average of 8.4 inserted bps
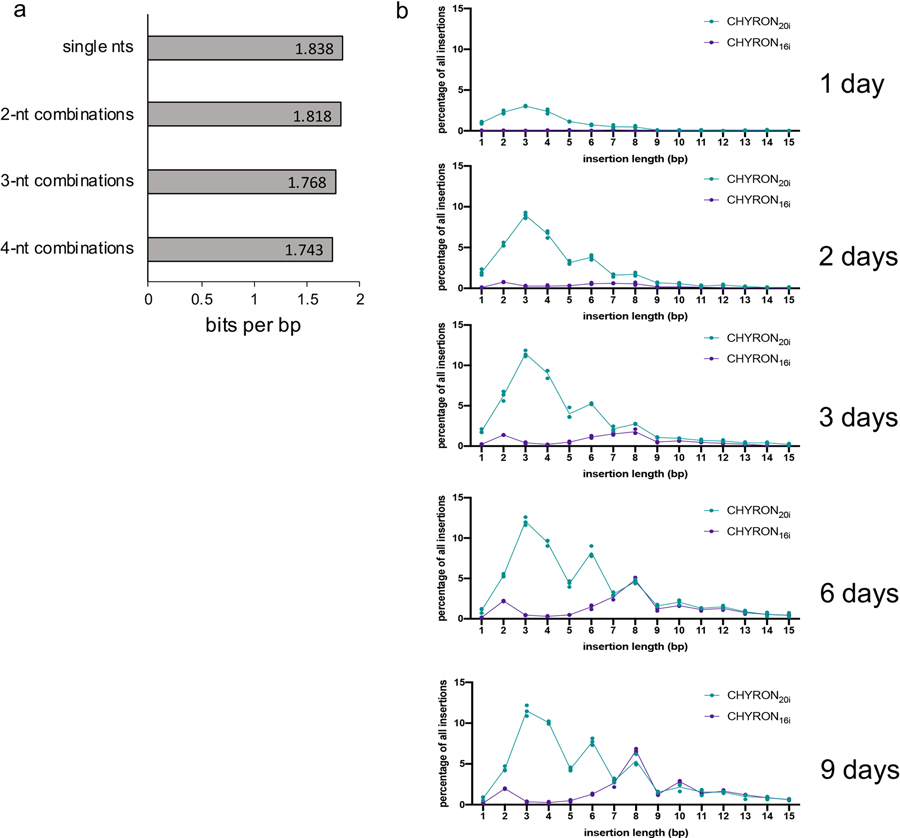
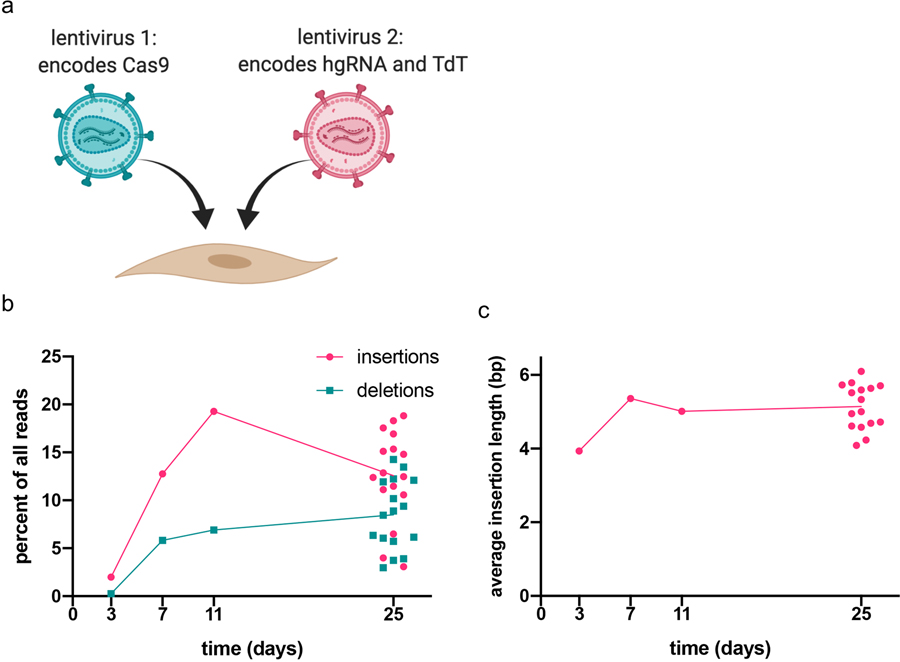
The failure of 293T-CHYRON20 cells to write more than an average of 4.9 bp (Figure 3b) has two likely explanations: 1) reduced efficiency of longer hgRNAs that are the product of rounds of TdT-mediated insertions and 2) silencing of the CHYRON locus. To address these potential problems, we created two new cell lines (Figure 4a), 293T-CHYRON20i and 293T-CHYRON16i. CHYRON20i starts with a 20 nt spacer, whereas CHYRON16i starts with a 16 nt spacer. Both cell lines have the CHYRON locus flanked by chromatin insulator sequences27 and integrated at the AAVS1 safe harbor locus in 293T cells. 293T-CHYRON16i cells accumulated long insertions, reaching an average length for all insertion-containing sequences of 8.4 inserted bps, compared to 5.7 inserted bps for CHYRON20i (Figure 4b). 8.4 bps corresponds to a Shannon entropy of 14.6 bits (Extended Data Figure 6a). As expected, CHYRON16i had a lower overall editing efficiency than CHYRON20i (Figure 4c) due to the low starting activity of shorter sgRNAs. Notably, CHYRON16i accumulated few short insertions (3–6 bp) compared to CHYRON20i (Extended Data Figure 6b), suggesting that inhibition of Cas9 activity as the hgRNA lengthened indeed limited the duration of CHYRON activity in earlier designs. Silencing of the CHYRON locus was also likely important, since 293T-CHYRON20i cells continued to accumulate insertions throughout an entire 9-day time course (Figure 4c). This is in contrast to CHYRON20, which plateaued by 6 days and reached a final length of only 4.9 inserted bps, suggesting the utility of insulator sequences and the safe harbor locus for CHYRON20i. Consistently, CHYRON17, which was delivered by lentivirus but not otherwise insulated, started with a 17 nt spacer and plateaued at an average length of 5.14 inserted bps in primary dermal fibroblasts (Extended Data Figure 7c). These results suggest that both starting spacer length and expression context affect CHYRON performance.
Figure 4. CHYRON writes an average of 8.4 bps in multiple rounds.
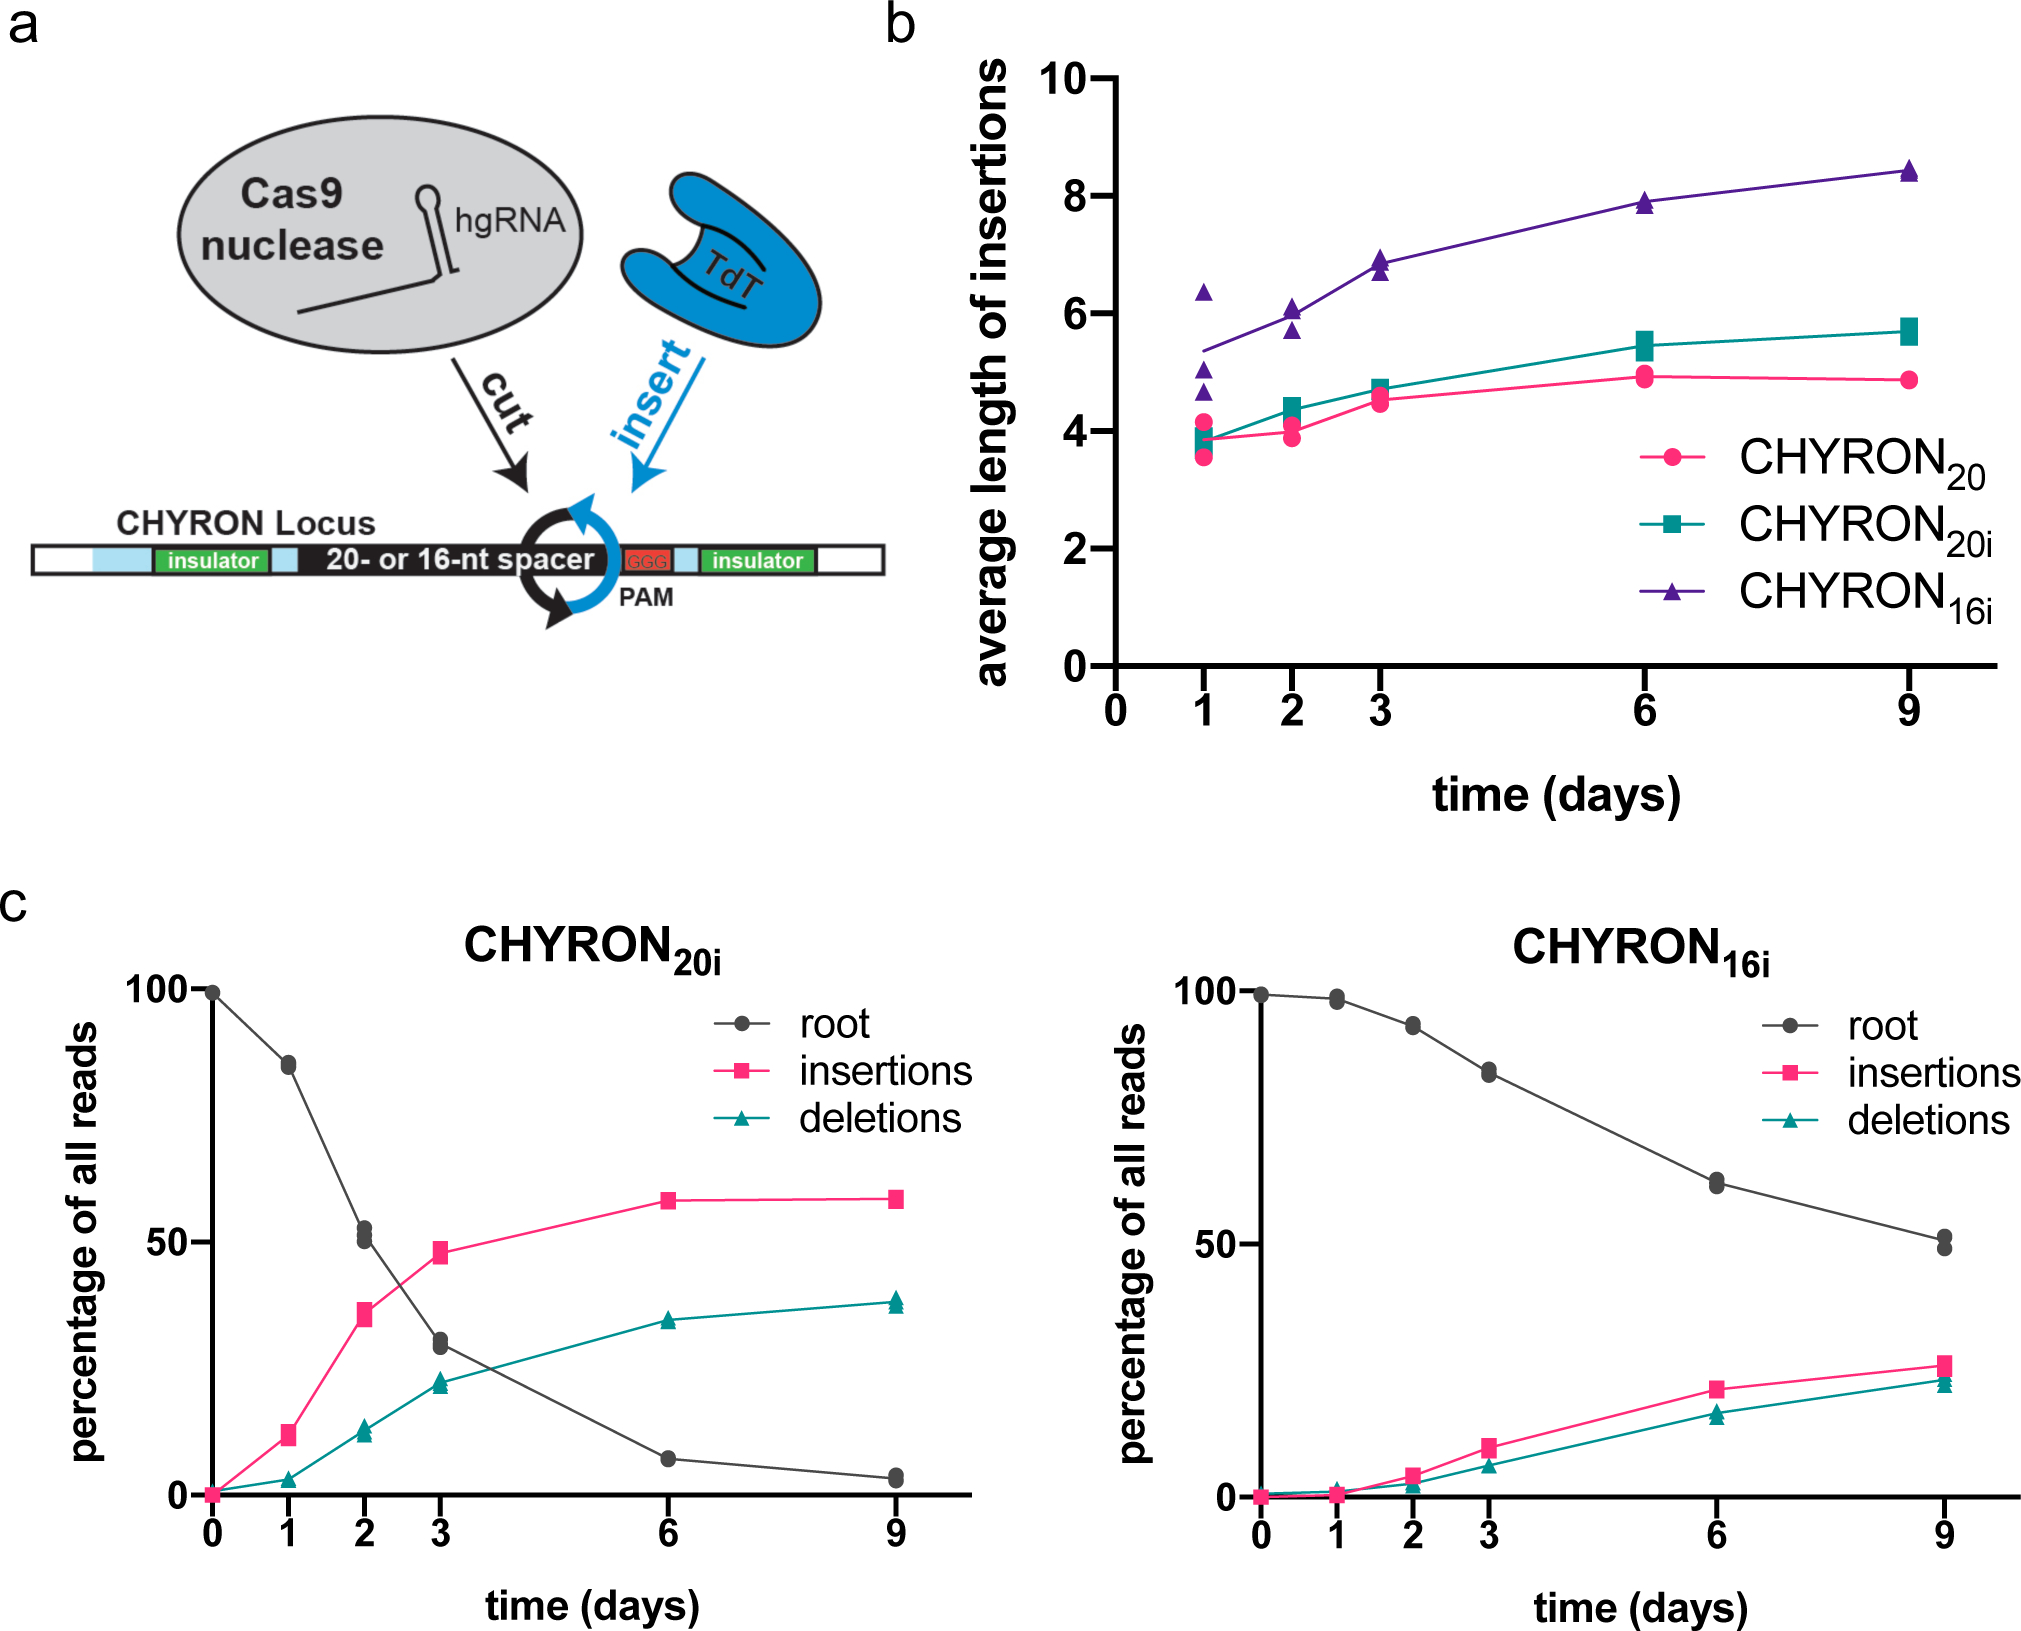
(a) Clonal 293T cell lines (hereafter 293T-CHYRON20i and 293T-CHYRON16i), were created by integrating cassettes at the AAVS1 safe harbor locus. The cassettes contain hgRNAs with initial lengths of 20 or 16 nt, flanked by insulator sequences to prevent silencing. (b) The CHYRON architecture allowed multiple rounds of cutting by Cas9 and writing by TdT. 293T-CHYRON20i and 293T-CHYRON16i cells were transfected with a plasmid expressing Cas9 and TdT for the indicated time before collection. Cells were re-transfected every 3 days. The CHYRON locus was analyzed by NGS and the average lengths of insertions were calculated, considering all insertion-containing sequences. For CHYRON20i and CHYRON16i, each point represents a single technical replicate. (Some points overlap; three replicates were assayed.) Data from Figure 3b is also plotted for reference. (c) CHYRON loci with an initial hgRNA length of 20 nt accumulated insertions and deletions over 6 days, whereas those with an initial hgRNA length of 16 nt accumulated insertions and deletions more slowly but continued to do so through a 9-day timecourse. From the experiment described in (b), each sequence was annotated as root, pure insertion (insertions) or any sequence that involves a loss of information (deletions). Each point represents a single technical replicate. (Some points overlap; three replicates were assayed.)
CHYRON allows reconstruction of cell population lineages
To mimic a process of growth and spatial expansion over several days in a setting where we could know the ground truth lineage relationships among populations of cells, we 1) grew ~40,000 293T-CHYRON16i cells bearing the root CHYRON16i sequence in four separate wells, 2) expressed Cas9 and TdT for three days (approximately three doublings) to allow the cells to write new bps at the CHYRON16i locus, 3) split each well into two, and 4) repeated steps 2 and 3 again to yield 16 final wells (Figure 5a). Cells in these final wells were allowed to grow for three days. By counting cells in an identical experiment on a hemocytometer, we estimated that there were 400,000 cells seeded in each of the final wells, which grew to approximately 3.2M cells per well by the time of collection. We subjected all cells from each final well to NGS of the CHYRON locus and found an average of 762 unique insertions per well (see Source Data for Figure 5). Using this NGS dataset, we inferred population lineage relationships by counting the number of shared sequences between pairs of wells to calculate relatedness (specifically, Jaccard similarity) and applying a standard agglomerative hierarchical clustering method to generate a tree from pairwise similarities (Figure 5b). This resulted in the accurate and robust reconstruction of the full splitting procedure, validating CHYRON’s application as an effective lineage tracer.
Figure 5. Reconstruction of cell relatedness by sequencing of the CHYRON locus.
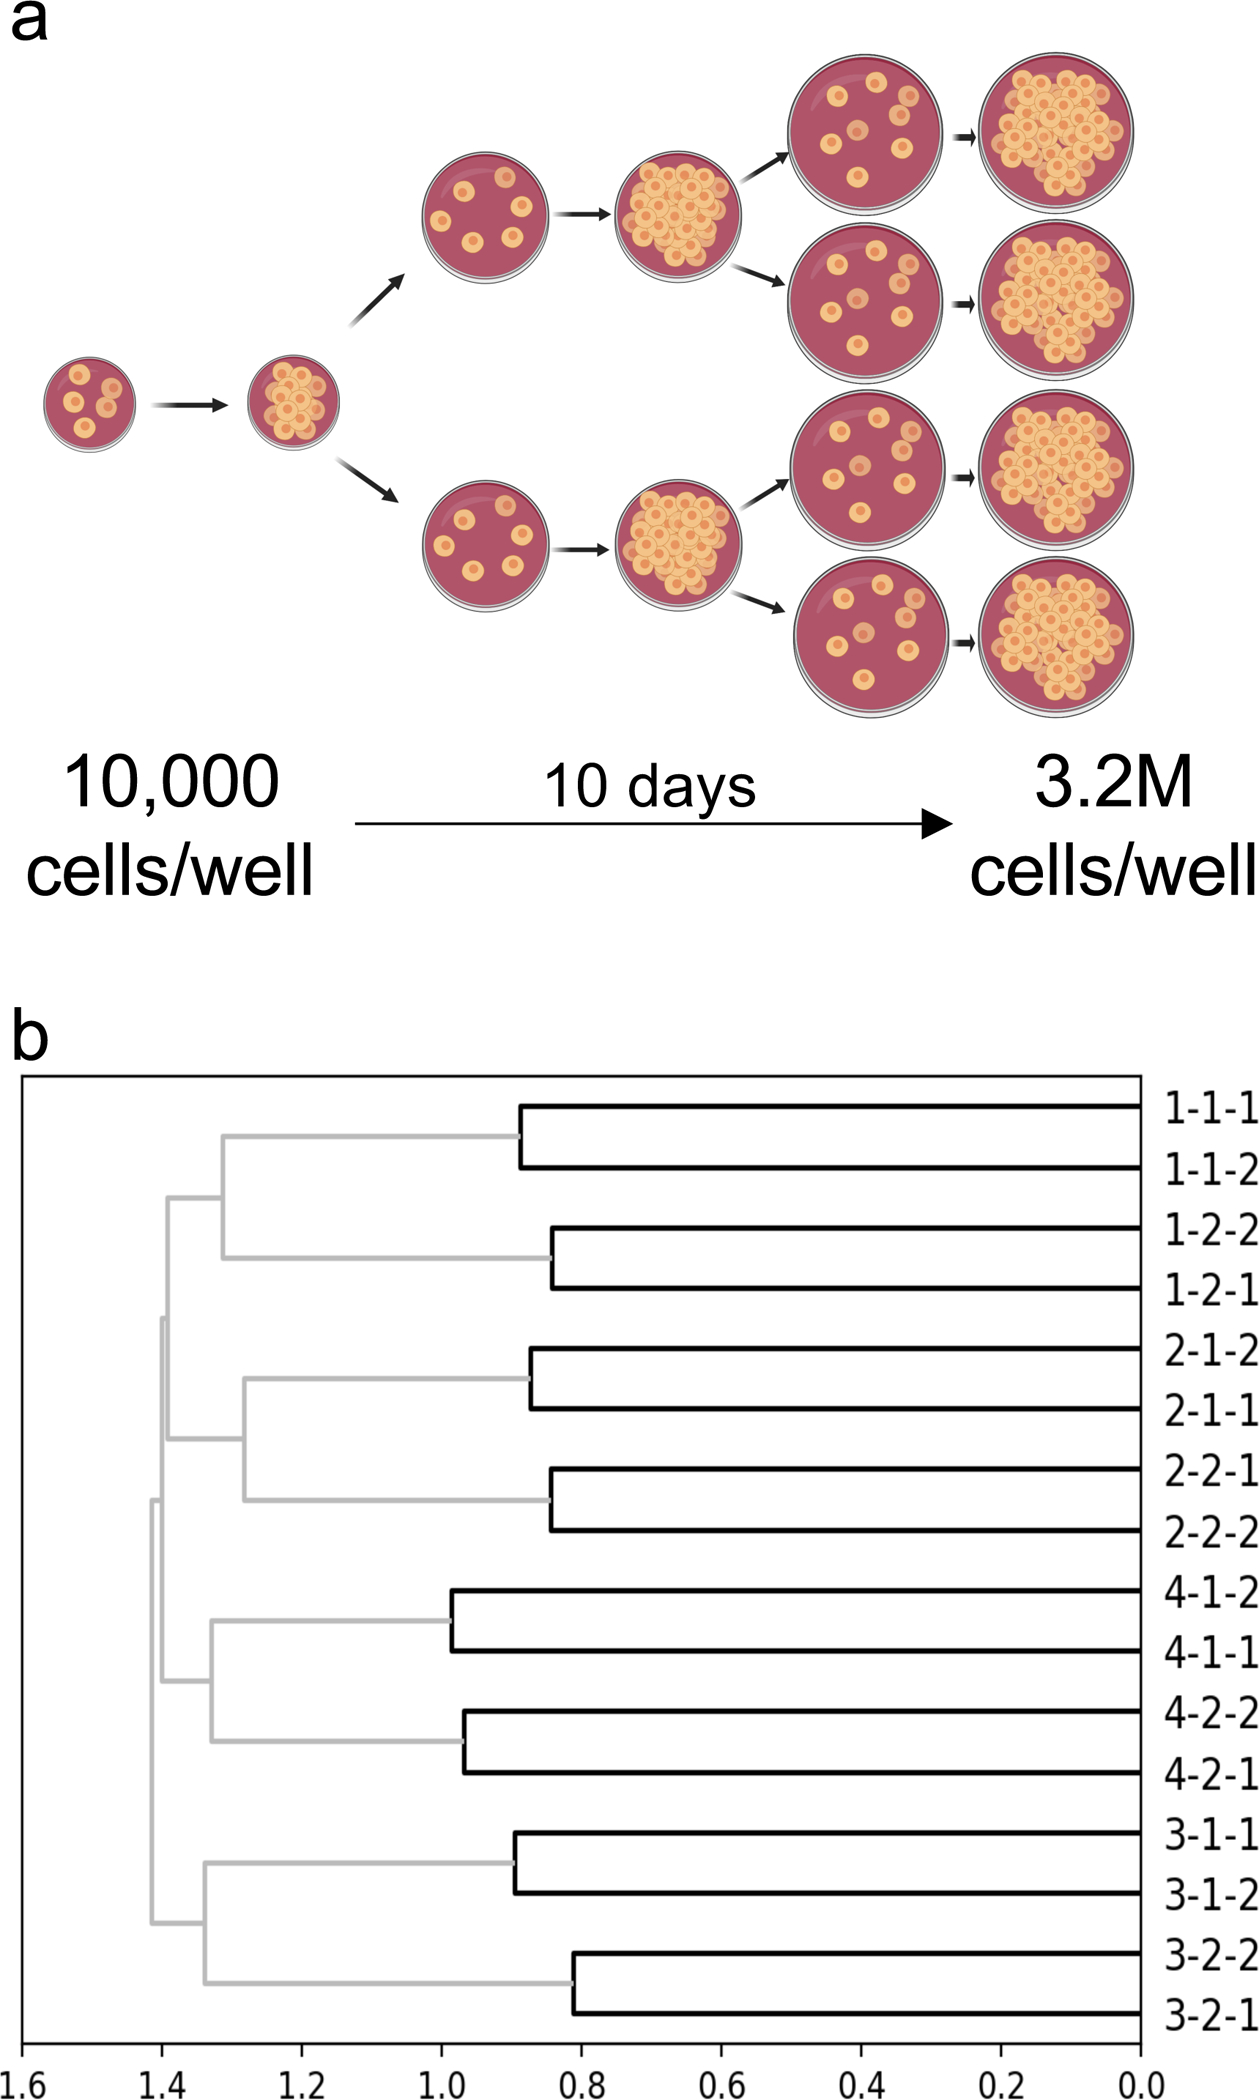
(a) Schematic of the experiment. This experiment was performed in quadruplicate to yield 16 final wells. CHYRON16i cells were transfected with Cas9 and TdT one day after each plating. (b) A simple method led to perfect reconstruction of the relatedness of all wells. For each well, a list was created of all unique insertions with an abundance of at least 0.0139% of the non-deletion reads and a length of 8–15 bp. Next, the Jaccard similarity coefficient between each pair of wells was computed and hierarchical reconstruction was performed using the UPGMA algorithm. Units are consistent across all plots in this work.
A practical consideration for any lineage tracing locus is its performance under sampling constraints. In real settings, it is never possible to sequence from all cells in a relevant population due to inefficiencies in dissection, DNA extraction, and amplification of the tracing locus. In vitro demonstrations of lineage tracing typically bypass this issue by expanding cells to counter sampling inefficiency, but such post-experiment expansion is not possible for real biological samples such as terminally differentiated cells. Sampling inefficiencies are further compounded by the fact that as we sample fewer and fewer molecules of any mutation-based lineage tracing locus in a population, we expect the number of identical mutants arising independently in two populations (homoplasies) to decrease more slowly than the number of identical mutants that genuinely reflect the relatedness of two populations (see Supplementary Note and Supplementary Figure 4). Therefore, sampling inefficiency disproportionately reduces our ability to reconstruct population lineages from recording loci. CHYRON ameliorates this problem by achieving high information through the long insertions generated, which reduces the chance of homoplasy. To test this, we computationally removed, at random, up to 75% of the unique insertion sequences in each well of our lineage tracing experiment. Over ten trials where different sequences were removed, we were still able to achieve near-perfect lineage reconstruction (Supplementary Figure 4e). CHYRON should therefore have unique advantages in cases where large populations and low sampling efficiency are a practical reality.
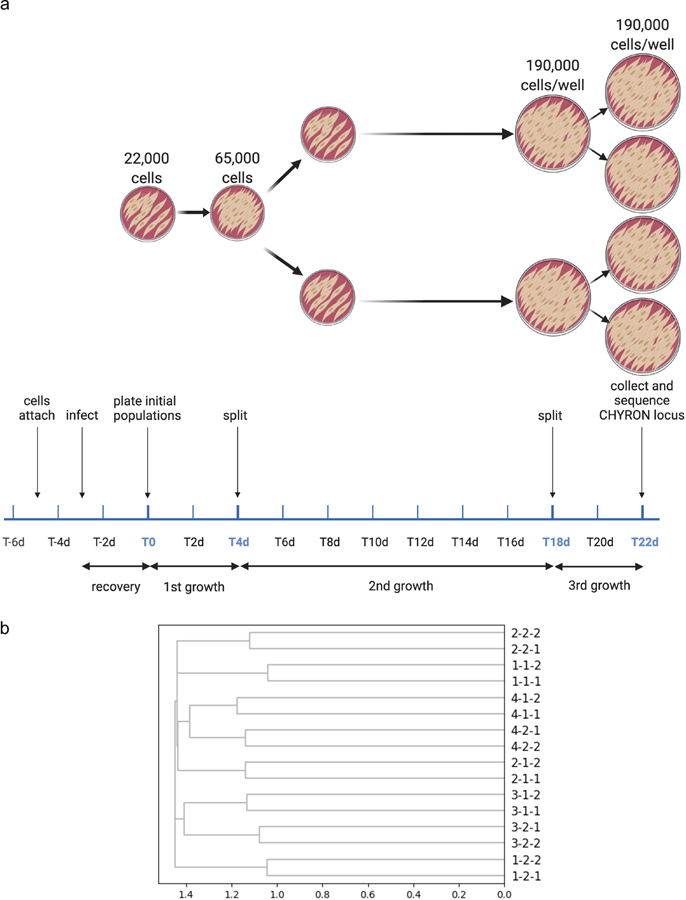
In order to test the limits of CHYRON lineage reconstruction more directly, we performed an additional population lineage tracing experiment in culture (Extended Data Figure 8a), using human adult primary dermal fibroblasts transduced with lentiviruses expressing the CHYRON17 machinery, as shown in Extended Data Figure 7a. The experimental plan was similar to that shown in Figure 5, but the experiment began with 22,000 cells in each of four wells and ended with 190,000 cells in each of 16 wells (Extended Data Figure 8a). With fewer cells in each final population and fewer cell divisions between each splitting event, an even smaller number of cells are predicted to acquire a unique CHYRON barcode, divide, and then have their daughter cells be deposited in and successfully sampled from different daughter wells. Despite this increased challenge and the reduced information-encoding capacity of CHYRON17 relative to CHYRON16i, we were able to reconstruct 10 of 12 splits correctly (Extended Data Figure 8b and Supplementary Figure 5a); this performance was maintained in each of ten trials in which 20% of unique insertions were removed at random (Supplementary Figure 5a).
We wished to compare CHYRON16i’s lineage tracing performance to previously described DNA recording systems that record at a single site. A straight comparison of information generated predicts that CHYRON should lead to more robust lineage tracing, as the Shannon entropy of a CHYRON locus is higher than an hgRNA with Cas9 alone (Extended Data Figure 4c), which is currently the DNA recording system with the highest single-site information (see Supplementary Note). For example, in Kalhor et al., 201811, mice were created in which each cell bore ~60 integrated hgRNAs and constitutively expressed Cas9. For the hgRNA encoding the most information (Methods), Kalhor et al. found 434 distinct mutated sequences in 45 mice. To provide an upper bound estimate of the information encoded by this evolving hgRNA, we considered only edited sequences and assumed that each mutated sequence arose exactly once in each mouse in which it appeared. This resulted in a Shannon entropy of 7.97 bits (Source Data for Extended Data Figure 9), far lower than the 14.6 bits that can be encoded by CHYRON16i insertions (Figure 4b and Extended Data Figure 6a). As already discussed, high information is useful in situations entailing large populations and low sampling efficiency, such as in our population lineage tracing experiment with CHYRON16i (Figure 5). Therefore, CHYRON should perform better than an hgRNA system alone.
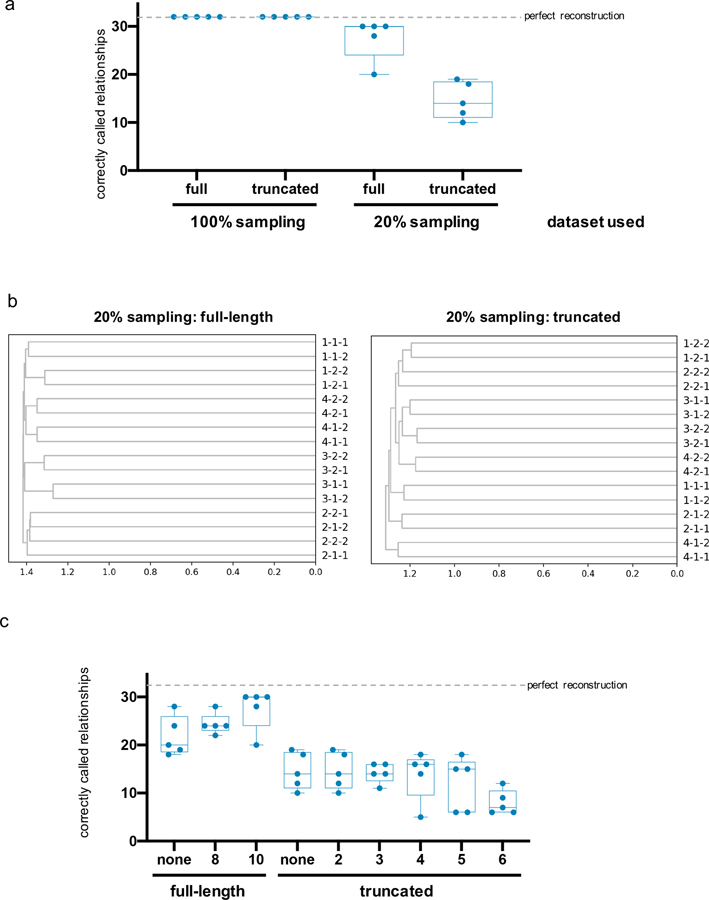
To directly test this assertion, we computationally reduced our lineage tracing NGS dataset (Figure 5) to generate a “truncated” dataset with the same information-encoding capacity as the highest-information hgRNA from Kalhor et al. (see Methods). In essence, this truncated dataset recapitulates what would happen if we used the hgRNA system instead of CHYRON for the exact lineage tracing experiment shown in Figure 5. Although we found that both the CHYRON and truncated datasets were sufficient for perfect reconstruction of the relationships among the 16 populations when all the insertions from each well were used (Extended Data Figure 9a), once we simulated more realistic sampling by computationally removing 80% of the insertion sequences from each well at random before truncation, the original CHYRON insertions resulted in a near-perfect reconstruction whereas the truncated dataset resulted in highly inaccurate reconstructions (Extended Data Figure 9). Therefore, we may conclude that compared to other single-site DNA recorders, CHYRON is more effective for reconstructing population lineage relationships when sampling is limited, as it usually is in experimental contexts.
CHYRON can report the dose or duration of hypoxia
Single-site DNA recording systems have been used to log cellular exposure to biological stimuli by making mutation at the recording locus inducible. For example, mutations at hgRNAs can be linked to inflammation exposure by placing Cas9 expression under the control of nuclear factor-κB33. However, such hgRNA systems infer the dose or duration of the stimulus only at the population level, because it is difficult to determine the number of mutational cycles each individual cell sees when large deletions and deletions that terminate recording are common. Therefore, at the single cell level, one can only reliably assess whether an hgRNA was mutated or not, providing dosage information only at the population level. While CHYRON can also carry out population level stimulus recording, it offers the possibility of analog recording at the level of a single cell, currently available only with substitution-based recorders that are less compact8. This is because the CHYRON locus progressively writes new bps and rarely erases, so a CHYRON locus should grow monotonically longer as the cell is exposed to the stimulus for a longer period of time or at a higher dose (Figure 6a).
Figure 6. Expression of hypoxia-inducible Cas9 and TdT increases insertion abundance in proportion to dose and insertion length in proportion to duration of treatment with the hypoxia mimic DMOG.
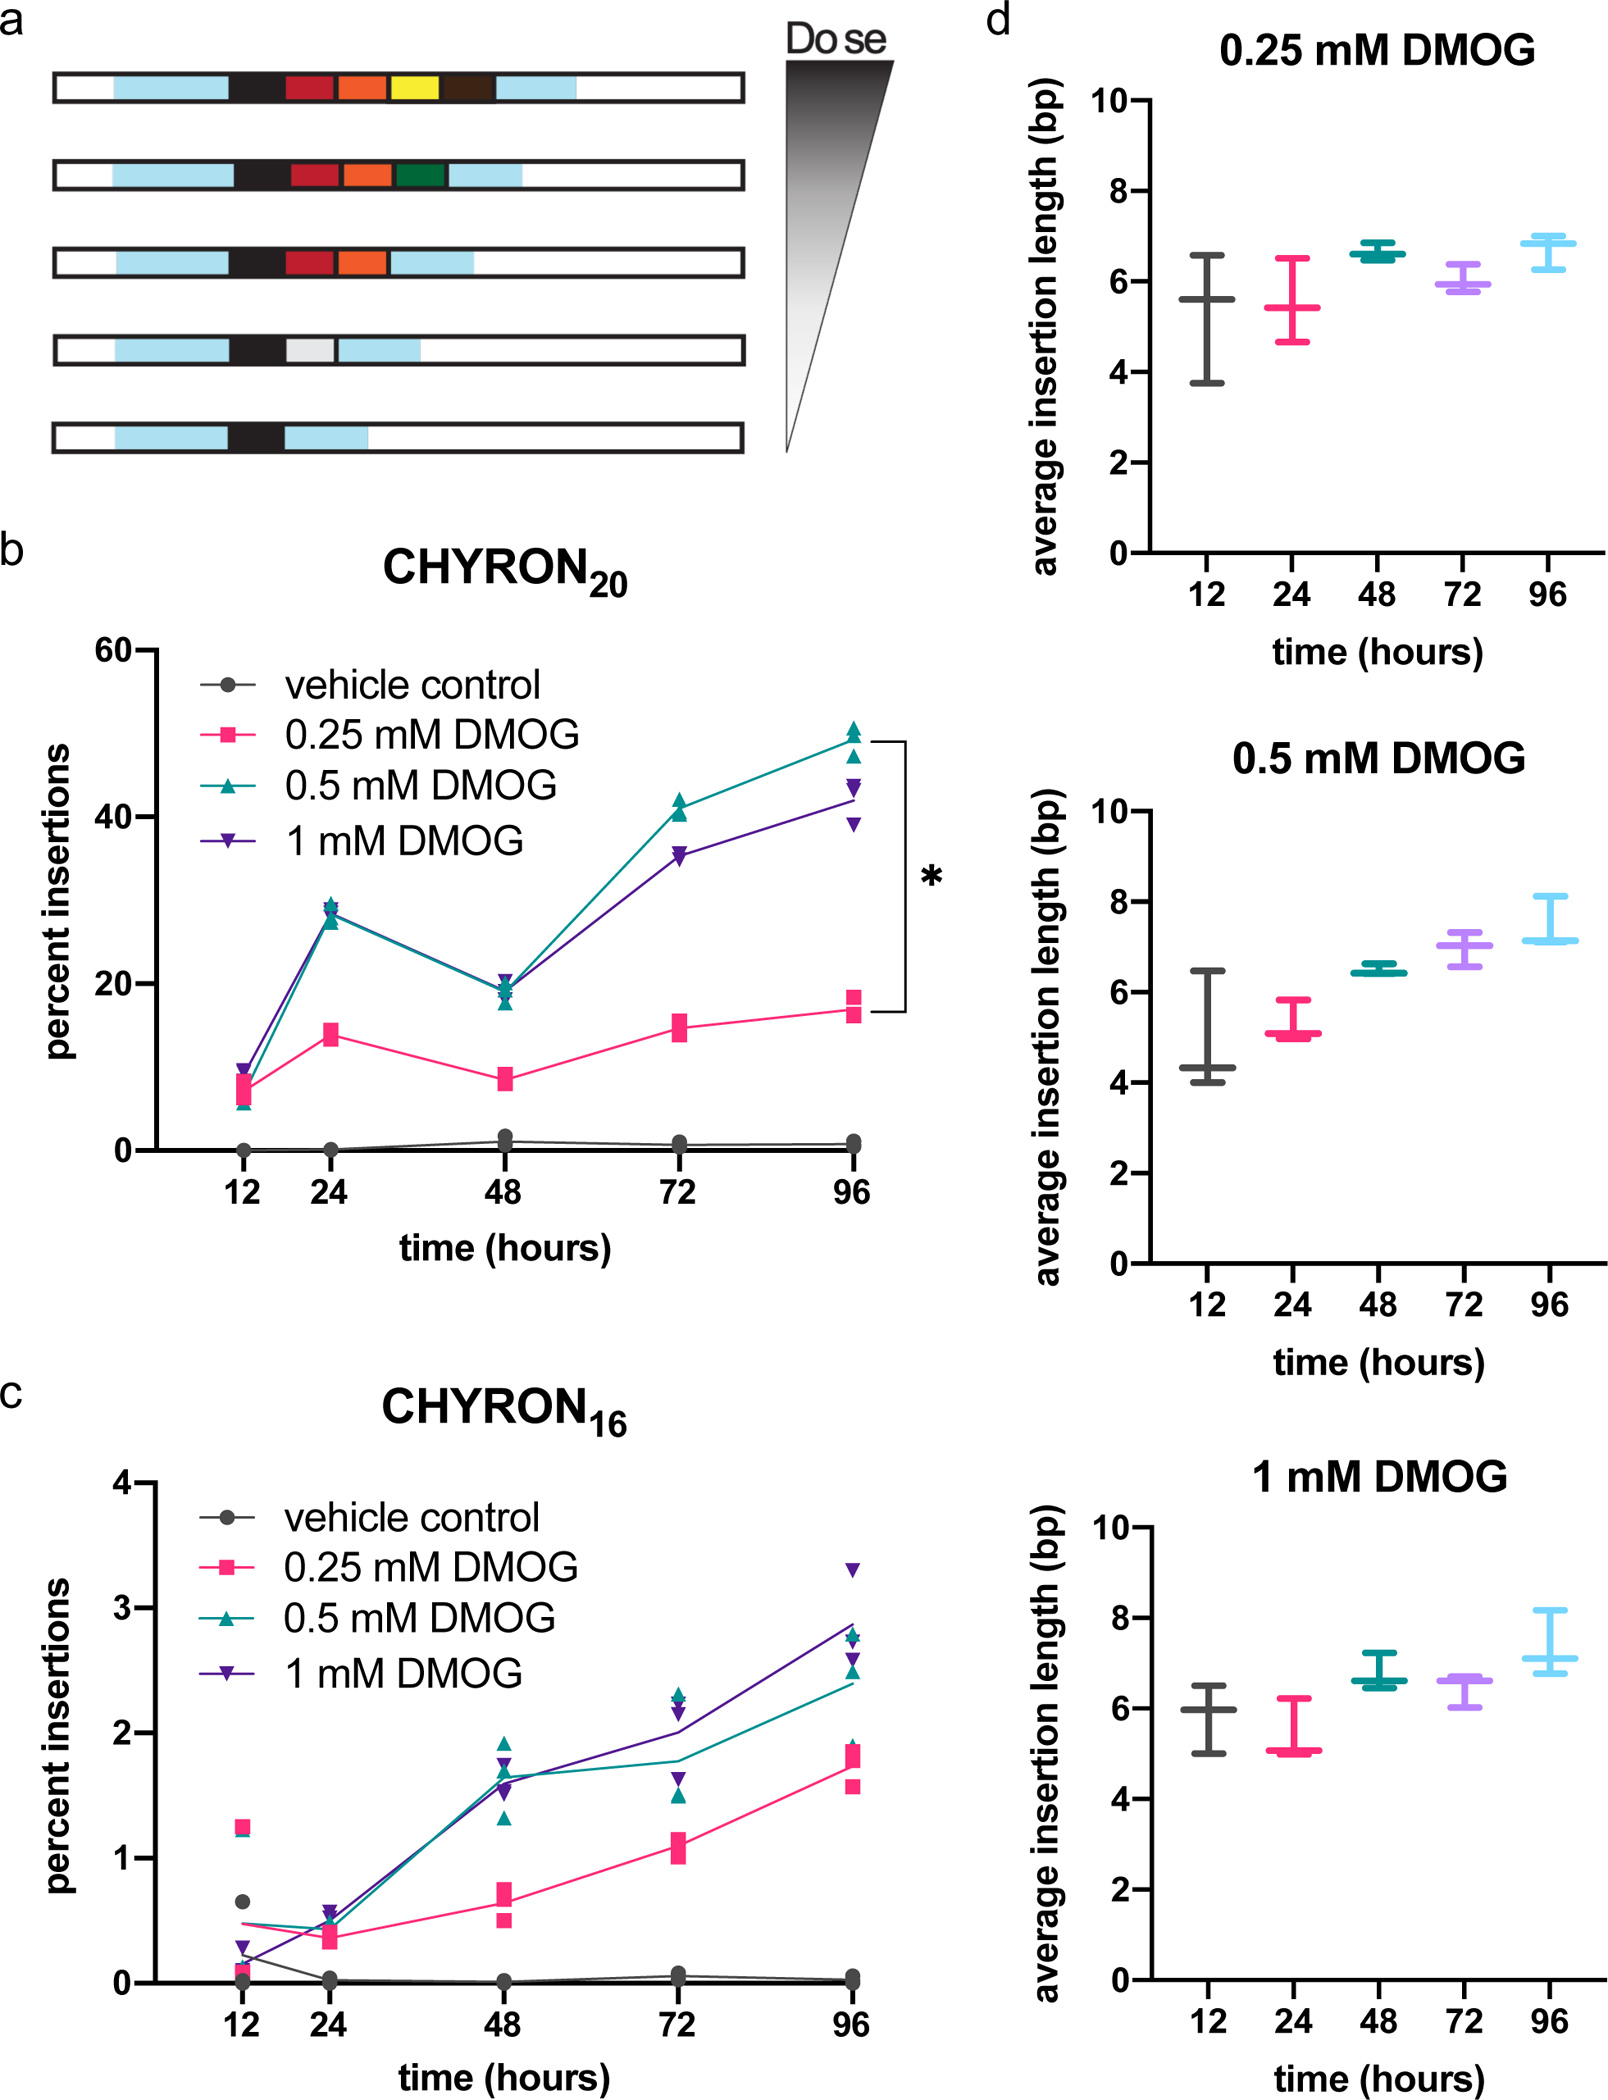
(a) Model: when recording is coupled to a cellular stress, the extent of insertions at the CHYRON locus can be used to reconstruct the extent of the stress. (b) When transfected with hypoxia-inducible Cas9 and TdT, CHYRON20 loci accumulated insertions in a dose-dependent manner in response to DMOG. 293T-CHYRON20 cells were transfected with a plasmid encoding Cas9 and TdT under the control of a promoter containing four copies of the hypoxia response element; Cas9 is additionally fused to a degron that destabilizes proteins in the presence of normal levels of oxygen. After transfection, cells were treated with DMOG or a vehicle control and then collected at the indicated time and analyzed as in Figure 2a. Each point represents a single technical replicate. (Some points overlap; three replicates were assayed.) For all timepoints except 12 hr., the extent of insertions observed at the 0.25 mM and 0.5 mM doses were significantly different by two-tailed T test. For the 24 hr. timepoint, t-value=19.79, p<0.001; for the 48 hr. timepoint, t-value=13.484, p<0.001; for the 72 hr. timepoint, t-value=36.002, p<0.001; for the 96 hr. timepoint, t-value=26.404, p<0.001. (c) In contrast, CHYRON16 loci accumulated insertions at a lower, non-dose-dependent rate. Experiment was performed, analyzed, and plotted as in (b). (d) In 293T-CHYRON16 cells transfected with hypoxia-inducible Cas9 and TdT, insertions grew longer with increasing duration of exposure to DMOG. All sequences containing insertions were considered, and the lengths of the insertions were calculated. Each horizontal bar represents a single technical replicate.
To test stimulus recording with CHYRON, we linked insertional mutagenesis at a CHYRON locus to hypoxia, which triggers adaptive responses that affect a wide range of cellular behaviors28,29. We created a construct in which the expression of Cas9 and TdT is under the control of the 4x hypoxia-responsive element (HRE)-YB-TATA promoter30, and in which Cas9 is additionally fused to an oxygen-dependent degron (ODD) domain28. Because these experiments were done in parallel with those described in Figure 4, we used the original 293T-CHYRON20 cell line, described in Figure 3, and the 293T-CHYRON16 cell line, in which the CHYRON locus is integrated at AAVS1 but no insulators are included. We transfected 293T-CHYRON20 and 293T-CHYRON16 with the 4xHRE-YB-TATA-Cas9-ODD-T2A-TdT construct and then exposed them to three different concentrations of the hypoxia mimic DMOG for five different durations. In both cell lines, DMOG addition promoted insertions at the CHYRON locus (Figure 6b–c). The proportion of the population bearing insertions increased with the dose of DMOG in 293T-CHYRON20 (Figure 6b). We note that the dose effect on the proportion of the 293T-CHYRON16 population bearing insertions was not significant (Figure 6c), likely because the overall low rate of insertions in this cell line reduces the dynamic range. Similarly, the length of insertions at the CHYRON16 locus did not depend on dose of DMOG (Figure 6d). While initially surprising, this observation is consistent with a model in which dose determines the probability that CHYRON will become active in a cell but does not determine the degree of CHYRON activation. In keeping with this model, the average length of insertions at the CHYRON16 locus increased significantly with duration of DMOG exposure (Figure 6d and Extended Data Figure 10). In other words, CHYRON is capable of recording exposure to stimuli in a manner that is digital (Figure 6b) or analog (Figure 6d), where the latter of these modes can in principle provide information on the experience of each single cell. We note that currently the dynamic range of digital and analog recording achieved with CHYRON is narrow (Figure 6b–d and Extended Data Figure 10), but with further development we expect CHYRON will be an ideal system for capturing detailed cellular histories at single-cell resolution.
Discussion
There are two unique features of the CHYRON architecture that we believe will lead to its broad application and motivate its continued development in our and other labs. First is the high information content and density of CHYRON. CHYRON is able to diversify a very compact recording locus, consisting of a single site that is repeatedly modified, so that the locus can bear a unique sequence in each of tens of thousands of cells. This capability may be especially important for applications in which it is difficult to capture all cells that might be related to each other; for these applications, a DNA recorder with a high information content is necessary to limit the possibility of misleading homoplasic sequences in unrelated cells. Second is the property that CHYRON records information by generating an ordered accumulation of random insertions. Unlike deletions and substitutions, pure ordered insertions gain information without corrupting or removing previous information, which is ideal for a DNA recorder. Using sequences of DNA recording loci to computationally reconstruct cell lineage remains challenging31; the ordered nature of CHYRON insertions may reduce the complexity of reconstructing cell lineage by making it clear when two cells diverged. Ordered insertions also make it possible that, if TdT can be engineered to add different types of nts, and the activity of the different TdTs can be coupled to different cellular stresses or the cell cycle, the CHYRON locus could record the relative timings of the different stresses in the cell’s history or even provide an accurate count of cell divisions. The combination of these characteristics may enable single-cell-resolution lineage reconstruction from sparsely sampled CHYRON sequences, a goal we are actively pursuing.
Combining CHYRON with other DNA recording innovations will yield substantial improvements in the depth and length of lineage recording. For example, if multiple CHYRON loci with different initial hgRNA spacer lengths were expressed in the same cell11, CHYRON20i loci would fire early while CHYRON16i loci would stochastically acquire an initial insertion that would increase the activity of the insertion-acquiring locus so that it would then accumulate additional insertions more quickly. Adapting CHYRON so that it can be read out by single-cell RNA sequencing12,13,16 would allow information from multiple CHYRON loci to be combined to report on the lineage or history of a single cell. When encoded in an optimized genomic context, intermediate initial hgRNA lengths, such as 17 nt32, are likely to pair higher initial activity than CHYRON16i with a greater recording capacity than CHYRON20i, and thus could be a valuable tool as single- or multi-site recorders. These straightforward improvements to CHYRON could enable high-information and long-term recording in an organism (see Supplementary Note for additional considerations relevant to in vivo use of CHYRON).
In the longer term, increasing the amount of information CHYRON can encode, and the durability of that information once encoded, will allow the full potential of CHYRON to be realized. The information-encoding capacity, although unprecedentedly high for a single site, is limited by the declining efficiency of the hgRNA as it grows longer. The reduced efficiency likely arises from a combination of guide RNA length and secondary structure in the critical seed region. This problem could be addressed by engineering Cas9 to better tolerate GC-rich sequences in its seed region or by using a different nuclease that cuts farther from its seed region. Additionally, the ~25% rate of deletion per Cas9 cut will eventually lead to information loss and inactivation of all CHYRON loci in the limit of prolonged continuous recording. Recruitment of factors that manipulate the balance of DSB repair pathways at the Cas9 cut site could reduce deletions significantly. The future development of CHYRON will be enhanced by the wide interest in engineering new capabilities into its protein components – a CRISPR nuclease and TdT, in which there has been considerable recent interest as a tool for in vitro DNA synthesis33–35. Techniques that use polymerases36–38, including TdT39, to record time-series information on DNA synthesis timescales in vitro could also be merged with CHYRON. We predict that the unique components of CHYRON and the promise of the CHYRON architecture for reaching fully continuous recording of biological stimuli or lineage relationships at single-cell resolution in vivo will spur its continued development and application.
Online Methods
Plasmid cloning.
Cloning was done by standard Gibson assembly, in vivo recombination, and restriction-ligation cloning. All plasmids are listed in Supplementary Table 1, and available along with full sequences at Addgene (addgene.org/browse/article/28203329). All plasmids to be used for transfection were purified with HP GenElute Midi or Mini kits (Sigma # NA0200 and NA0150).
Polymerase Chain Reactions (PCRs) were performed with Q5 Hot Start High-Fidelity DNA Polymerase or Phusion Hot Start Flex DNA Polymerase (New England BioLabs). All primers were purchased from Integrated DNA Technologies (IDT) and PCR reagents were provided by NEB.
The human codon-optimized S. pyogenes Cas9 DNA sequence was PCR-amplified from hCas9, which was a gift from George Church (Addgene plasmid # 4181540); an XTEN linker or a T2A self-cleaving sequence along with TdT were cloned onto the C-terminus of Cas9. The XTEN linker was cloned through PCR from pCMV-BE3, which was a gift from David Liu (Addgene plasmid # 7302141). The T2A self-cleaving sequence was inserted through PCR by designing primers with overhangs containing the T2A sequence. The sequence encoding TdT was amplified from the cDNA of an acute lymphoblastic leukemia cell line and this entire insert was cloned into a pcDNA3.1 backbone, yielding Cas9-XTEN-TdT or Cas9-T2A-TdT. Cas9-containing constructs with the pcDNA3.1 backbone were transformed into XL10-Gold Ultracompetent E. coli (Agilent #200315).
Hypoxia inducible constructs were cloned by adding a 4x hypoxia-response element (HRE)-YB-TATA promoter to drive the expression of Cas9-T2A-TdT. The 4xHRE sequence was PCR-amplified from 4xHRE_v2_YB-TATA-Gluc-CMV_dsRed30, which was a gift from Yvonne Chen. In addition, the oxygen-dependent degron (ODD) was cloned onto the C-terminus of Cas9. The ODD sequence was amplified from HA-HIF1alpha-wt-pBabe-puro, which was a gift from William Kaelin (Addgene plasmid # 1936542). This plasmid also includes blasticidin resistance (not used in this work), which was cloned from pLenti CMV Blast DEST (706–1) backbone, which was a gift from Eric Campeau and Paul Kaufman (Addgene plasmid # 1745143).
To clone single-guide RNA (sgRNA) plasmids, the spacer region of the desired sgRNA was inserted into the pSQT1313 expression plasmid, which was a gift from Keith Joung (Addgene plasmid # 5337044), placing the sgRNA under the control of the human U6 promoter. The desired spacer region was introduced by PCR, Gibson assembly, and subsequent transformation. Alternatively, a single PCR was performed on the parent plasmid to create a linear product with homologous ends. This linear piece was transformed into SS320 (Lucigen) or Top10 E. coli (ThermoFisher Scientific) to allow for recombination to yield the desired variant sgRNA plasmid.
The homing gRNA (hgRNA) constructs contained the HEK293 site 3 sgRNA cassette with a GGG (instead of GTT) at the 3’-end of the spacer region and the complementary mutations in the opposite site of the hairpin3,4. This sequence was amplified from the sgRNA plasmid with the corresponding spacer and the PAM-introducing mutations were present on the PCR primer. The resulting U6 promoter-hgRNA variant was cloned into a pcDNA3.1 backbone with the CMV promoter driving a puromycin-resistance gene. In addition, 750 bp regions homologous to the HEK293 site3 locus (for CHYRON20) or AAVS1 (for CHYRON16, CHYRON20i, or CHYRON16i) were cloned upstream and downstream of the hgRNA and selection marker region of the plasmid. The sequences of the flanks were PCR amplified from HEK293T genomic DNA and an EcoRI restriction site was added on the 5’-end of the upstream flank and on the 3’-end of the downstream flank. These restriction sites allowed for linearization of the plasmid for stable integration into the genome of HEK293T cells upon transfection.
Cas9-TdT constructs containing different linkers were cloned through restriction enzyme digestion and ligation. All restriction enzymes and T4 DNA Ligase were purchased from NEB. All vector digestions were treated with alkaline phosphatase, calf intestinal (CIP) from NEB after complete digestion by the restriction enzymes. A base construct was cloned first through Gibson Assembly to add restriction sites to the original Cas9-XTEN-TdT construct: NheI-SfiI-Cas9-KpnI-XTEN-SexAI-TdT. The base construct was digested with KpnI and SexAI. Three separate PCR’s were performed to yield a 5xFlag or 5xGSA linker product with KpnI and SexAI restriction sites. The 5xFlag was present on a gBlock (IDT) and the 5xGSA linker (4 repeats of the sequence GSAGSAAGSGEF and a final repeat with the sequence GSAGSAAGASGEGRP45) was ordered on a minigene (IDT). These two inserts were digested with the appropriate enzymes and ligated individually into the KpnI and SexAI digested base construct yielding Cas9–5xFlag-TdT or Cas9–5xGSA-TdT.
Additional PCR on the 5xFlag gBlock yielded 5xFlag flanked by KpnI sites, which was digested and then ligated into Cas9–5xFlag-TdT, resulting in Cas9–10xFlag-TdT. To clone Cas9–15xFlag-TdT, a subsequent PCR was performed on the gBlock to amplify the 5xFlag sequence with FseI restriction sites. The FseI restriction-enzyme recognition sites were used to ligate the 5xFlag sequence into Cas9–10xFlag-TdT, yielding Cas9–15xFlag-TdT.
Control plasmids were cloned containing catalytically-dead TdT (dTdT). The dTdT DNA fragment was prepared through introduction of the D343E and D345E mutations46,47 into the wild-type TdT sequence. Two control plasmids were cloned through Gibson Assembly into the pcDNA3.1 backbone: Cas9-XTEN-dTdT and dTdT alone.
The pcDNA3.1-sfGFP construct was cloned through Gibson assembly of the superfolder GFP gene from the yeast toolkit48 into pcDNA3.1.
Lentiviral plasmids were cloned by Gibson assembly and restriction-ligation in Stbl3 E. coli (ThermoFisher Scientific). The lentiviral backbone for both constructs was from lentiCas9-EGFP, a gift from Phil Sharp and Feng Zhang (Addgene Plasmid #6359249). In Lentivirus 1, mNeonGreen, not used in this experiment, was cloned upstream of Cas9, separated by a P2A sequence, expressed under the control of the EFS promoter. The mNeonGreen sequence was obtained from pmNeonGreenHO-G, Addgene Plasmid #127912, gift of Isei Tanida (unpublished). In Lentivirus 2, an hgRNA locus was cloned upstream of the EFS promoter driving Luc2-P2A-tdTomato-T2A-TdT. Luc2-P2A-tdTomato sequence is from pCDH-EF1-Luc2-P2A-tdTomato, Addgene Plasmid #72486, a gift of Kazuhiro Oka (unpublished). Neither Luc2 nor tdTomato expression was used in our experiments. pU6, the promoter driving the hgRNA, is from pSQT1313, Addgene Plasmid #5337044, a gift of Keith Joung. The hgRNA sequence was followed by a 7T terminator, which was immediately followed by a random 12-bp sequence. This random sequence was not used in our experiments. Lentivirus was produced and titered by VectorBuilder, Inc.
Cell culture and transfection.
HEK293T cells were obtained from ATCC (CRL-3216) but not otherwise authenticated. Normal adult human primary dermal fibroblasts were obtained from ATCC (PCS-201–012, Lot #70015617 was used for Extended Data Figure 2 and Lot #61683453 was used for Extended Data Figures 7–8). All cells were cultured in DMEM, high glucose, GlutaMAX™ Supplement (Gibco #10566024), supplemented with 10% FBS (Sigma #12306C), at 37°C and 5% CO2.
Transient transfections of 293T cells were performed by mixing DNA with Fugene (Promega #E2311) in serum-free DMEM, at a ratio of 1 μg DNA to 3 μL Fugene. Unless otherwise noted, the genomic site targeted for mutation was HEK293 site 341. Nucleofection of primary dermal fibroblasts was performed with a Lonza 4D Nucleofector, per the manufacturer’s instructions, using P2 solution with electroporation code DS-150. For each nucleofection, 100,000 cells in 20 uL solution were mixed with 400 ng DNA, nucleofected in an X kit S cuvette, then plated in one well of a 24-well plate.
To create the 293T-CHYRON cell lines, the plasmid to integrate the hgRNA into 293T cells was digested with EcoRI-HF (NEB #R3101), then purified on a silica column (Epoch #3010). 350 ng of this plasmid was mixed with 100 ng of MSP680, a plasmid expressing Cas9EQR, a gift from Keith Joung (Addgene #6577250), 50 ng of a plasmid expressing an sgRNA against a sequence at HEK293 site 3 or AAVS1 that can be cut by Cas9EQR, and 1.5 uL Fugene. 293T cells were transfected in a 24-well dish, transformants were selected with 1–2 ug/mL of puromycin (Invivogen #ant-pr-1), then a single colony was isolated in two rounds of dilution and colony picking. Integration into the targeted genomic locus was verified by PCR.
Samples of 293T and 293T-CHYRON cells used in this study, corresponding to the latest frozen stock that was used, were commercially tested for mycoplasma contamination and shown to be negative (Applied Biological Materials, Inc.). Primary dermal fibroblasts were obtained directly from ATCC, where they were shown to be negative for mycoplasma, and used immediately.
Examining the insertion bias of TdT at varying cut sites.
To test the insertion characteristics of TdT, 16 targetable sites were chosen that contained all combinations of each nucleotide at the −4/−3 position relative to the PAM. HEK293T cells in one well of a 6-well dish were transfected with 0.4 μg of the specific sgRNA and either 0.92 μg of Cas9, 1.09 μg of Cas9-T2A-TdT, or 1.1 μg of Cas9–5XFlag-TdT. To normalize the total amount of DNA transfected, the Cas9 and Cas9-T2A-TdT transfections were supplemented with 0.12 μg and 0.01 μg of pcDNA3.1-sfGFP, respectively. The cells were collected three days post-transfection and DNA was extracted as detailed below.
Long-term editing on the CHYRON locus.
293T-CHYRON20, 293T-CHYRON20i, or 293T-CHYRON16i cells were transfected in 6-well dishes with 2 μg of the Cas9-T2A-TdT construct. Cell were grown for 1, 2, 3, 6, or 9 days after transfection. For the 6 and 9-day time point, 10% of the cells from the previous time point were used to seed a new culture to be transfected again with the same amount of DNA as the previous transfection. As a control, for the time course shown in Figure 3, the same experiment was performed with a Cas9-T2A-STOP-TdT plasmid, which has a stop codon five amino acids into the TdT sequence. All time points were collected as a single well of a six-well plate (Falcon # 08–772-1B).
Two-step editing with Cas9 and TdT via isolation of single colonies.
293T-CHYRON20 cells were transfected with equal amounts of plasmids expressing Cas9–5xFlag-TdT and free TdT, then plated sparsely and grown until visible single colonies were picked. The CHYRON locus of these colonies was sequenced by the Sanger method, and six cell lines were chosen for further study. These six cell lines were grown in two 6-wells each. For each, one well was transfected with a plasmid expressing Cas9-T2A-TdT and the other well was untransfected. Three cell lines representing two insertions were found to be clonal (>80% of reads from the untransfected sample were a single insertion sequence) and successfully sequenced. All samples were collected and the CHYRON locus sequenced via UMI incorporation and NGS.
Lineage reconstruction assay and analysis.
For the reconstruction shown in Figure 5, 5,000 293T-CHYRON16i cells were plated in each of 4 wells of a 384-well plate, then transfected the next day (“day one”) with a plasmid expressing Cas9 and TdT (pcDNA-Cas9-T2A-TdT). On day two, cells were trypsinized and the entire contents of each well on the 384-well plate was moved to a 96-well plate. On day four, when they had expanded to approximately 86,000 cells per well, each well was split into two wells of a 24-well, allowed to attach for one day, then transfected again. On day eight, when each well had expanded to approximately 800,000 cells, each well was split into two wells of a 6-well dish. On day eleven, all wells were collected and analyzed by amplicon sequencing without UMI incorporation.
For our initial analysis, the researchers performing the analysis (MWS and BSA) were not told which well was which. We created a list of all insertion sequences in each well. Each insertion has an “abundance,” based on the number of NGS reads that include that exact insertion sequence, and a length, equal to the number of bp added to the root sequence at the Cas9 cut site. We refined the list for each well to include only those insertions that met two criteria: 1) they were represented in at least 0.0139% of the non-deletion reads in the well and 2) the inserted sequence had a length of 8 to 15 bp. From this list of insertions, we created a binary vector for each well whose length was equal to the total number of insertion sequences with these criteria observed in any of the 16 wells in the experiment. The vector for each well contains a 1 for a particular insertion if that insertion was present in the refined list for that well, or a 0 if that insertion is absent. We used these vectors to calculate the Jaccard similarity between each pair of wells4, then reconstructed the relationships using the UPGMA hierarchical clustering algorithm (github.com/scipy/scipy/blob/v1.2.1/scipy/cluster/hierarchy.py#L411-L490).
All the analyses were done in Python. The scripts and detailed instructions are available at github.com/liusynevolab/CHYRON-lineage.
The lineage reconstruction shown in Extended Data Figure 8 was performed as above, with the following modifications. 38,000 actively growing, attached primary dermal fibroblasts in each of two wells of a 24-well plate were infected with 114,000 viral particles of each of the two lentiviruses that express CHYRON17. Three days later (Day 0), each well had 44,375 cells, and was split into two wells. On Day 4, there were 65,000 cells in each well, which were again split into two wells. On Day 9, the cells in each well (of a 24-well plate) were transferred to one well of a 6-well plate. On Day 18, each well had 190,000 cells, which were split into 2 wells. On Day 22, when each well had approximately 190,000 cells, cells were collected for DNA extraction. From the DNA extraction until the initial analysis was completed, the researcher (TBL) was unaware which wells were which. Because unedited reads were not removed during library prep (see below), the abundance cutoff for insertions included in the analysis was adjusted to 0.0024% to account for the lower proportion of insertions (compared to unedited reads).
Hypoxia recording assay.
293T-CHYRON20 and 293T-CHYRON16 cells were transfected in 6-well dishes with 2 μg of the 4xHRE-YB-TATA-Cas9-ODD-T2A-TdT construct. Ten hours after transfection, fresh medium supplemented with 0, 0.25, 0.5, or 1 mM DMOG (EMD Millipore Calbiochem™ #40–009) was added. Cells were collected and DNA extracted at 24 or 48 hr. after DMOG addition. At 48 hr., cells were replated and retransfected 14 hours later. 14 hours after transfection, DMOG was added at the indicated concentrations, then the cells were grown for 24 hr. before collection of the 72 hr. timepoint, and 48 hr. before collection of the 96 hr. timepoint.
Western blot.
For determining protein expression of our Cas9 constructs, western blots were performed by first lysing cell pellets with 1X RIPA buffer and a protease inhibitor cocktail (Roche #4693159001). After 30 minutes on ice, the lysis reaction was spun down and the supernatant was used in a BCA Reagent Assay (ThermoFisher Scientific #PI23225) to normalize for protein concentration. Upon normalization, the necessary volume of supernatant was added to LDS Sample Buffer (ThermoFisher Scientific #NP0007) with 0.2% βME (Fisher Scientific #BP176100).
All protein gels were 4–12% Bis-Tris Gels, 1.0 mm, 15-well (Invitrogen, Thermo Scientific #NP0323) and electrophoresis was performed in an XCell SureLock Mini-Cell Electrophoresis System (ThermoFisher Scientific #EI0001) with 1X MOPS Running Buffer according to the NuPAGE MOPS SDS Running Buffer recipe. Protein transfers were performed in a Mini Trans-Blot Cell (Bio-Rad #1703930) with a transfer buffer made according to the Bjerrum Schafer-Nielsen Buffer with SDS (Bio-Rad). Protein membranes and blotting paper were components of the EMD Millipore Blotting Sandwich Immobilin-P (Millipore Sigma #IPSN07852).
After transfer, the protein membrane was cut to create separate sections for Cas9 and actin blotting. An additional protein gel and transfer were performed for experiments that blotted for TdT. The respective membrane was incubated in either Guide-it Cas9 Polyclonal Antibody (Clontech #632607, dilution 1:1000), α-TdT Antibody (Abcam #ab14772, dilution 1:1,000), or α-Actin Antibody (Abcam #ab14128, dilution 1:1,000) for 3 hours at room temperature. Western blots were then incubated with horseradish peroxidase-fused secondary antibodies. α-Rabbit IgG (Sigma-Aldrich #A0545, dilution 1:10,000) was used to bind the primary antibody of Cas9 and TdT, while α-Mouse IgG (R&D Systems #HAF007, dilution 1:1,000) was used to bind the primary antibody of actin. The western blot membrane was treated with Clarity ECL Western Blotting Substrate (Bio-Rad #1705061). Blots were scanned on a ChemiDoc Touch Imaging System (Bio-Rad #1708370).
Deep sequencing library preparation of a genomic locus (for Figure 2, Supplementary Figure 1, and Supplementary Figure 2).
Genomic DNA was isolated with a QIAamp DNA Mini Kit (Qiagen #51304) unless otherwise specified. An alternative protocol was developed for the extraction of genomic DNA from mammalian cells and was used for experiments shown in Supplementary Figure 2. A cell pellet was lysed in a lysis buffer consisting of 20 mM EDTA, 10 mM Tris pH 8.0, 200 mM NaCl, 0.2% TritonX-100, 200 μg/μL proteinase K. The lysis reaction was incubated at 65 °C for 10 minutes and a 1:4 mixture of 7X lysis buffer (Zymo #D4036–1) to water was added and the reaction was further incubated at 65 °C. The lysis reaction was neutralized with neutralization buffer (Zymo #D4036–2) and cell debris was spun out. EconoSpin columns (Epoch #1910) were used to capture the DNA from the supernatant and a wash step with PE buffer was included before elution of the pure genomic DNA in water.
After DNA extraction, the region targeted by Cas9 was amplified by PCR. The primers contained the Illumina adapters and a 5 – 7 nt sample-specific barcode (Supplementary Table 1). To ensure that the reporting of Tdt-mediated insertions (which are GC-rich – Figure 2c) is not skewed by our library prep, we tested the relative amplification of synthetic templates with varying proportions of GC nucleotides by two polymerases (Supplementary Figure 1c). Since Q5 polymerase produced a less skewed result, we used it for all library prep PCR steps, except where indicated. The PCR reaction was performed with Q5 Hot Start High-Fidelity DNA Polymerase (NEB) and the following protocol: 98°C, 1 min; (98°C, 10 s; 60°C, 30 s; 72°C, 30 s) × 35; 72 °C, 1 min. Each reaction was done with 100 ng of nucleic acid. For the same genomic locus, each sample was normalized by signal intensity on a 0.9% agarose gel and pooled into a single mixture, which was cleaned using a NucleoSpin PCR Clean-up Kit (Macherey-Nagel #NC0389463). No size-selection was performed, other than the exclusion of primer-sized DNA from binding to the column. 10 ng per individual sample from the pooled clean product was sent to Quintara Biosciences or FornaxBio and run on an Illumina MiSeq.
At the sequencing vendor, the libraries were purified by binding to AMPure beads (0.9 beads:1 sample) and further amplified to incorporate the TruSeq HT i5 and i7 adaptors, using Q5 High Fidelity DNA Polymerase, for 10–13 cycles. The amplified libraries were agarose gel-purified, including at least 100 bp of room around the desired bands, to avoid biasing against deletions or insertions, and then sequenced on an Illumina MiSeq using the 500-cycle v2 reagent kit (Illumina Cat # MS-102–2003).
Deep sequencing library preparation of a genomic locus from primary cells (for Extended Data Figure 2).
Genomic DNA was isolated with a QIAamp DNA Micro Kit (Qiagen #56304). After DNA extraction, the region targeted by Cas9 (site 3) was amplified by PCR. The primers contained the Illumina adapters and a 5 – 7 nt sample-specific barcode (Supplementary Table 1). The initial PCR was performed for 30 cycles with Phusion HotStart Flex polymerase in GC buffer (NEB), then the technical replicates for each sample were pooled and purified with AMPure beads (0.9:1).
The libraries were sent to Genewiz, Inc. for Amplicon-EZ sequencing, where they were further amplified to incorporate the TruSeq HT i5 and i7 adaptors and then sequenced on an Illumina HiSeq 2500 with a paired-end 250 protocol.
Deep sequencing library preparation of the CHYRON locus at high efficiency for lineage reconstruction (for Figure 5).
Genomic DNA was extracted with the QIAmp DNA Mini kit and the entire recovery was used in the initial PCR. The initial PCR was performed for 25 cycles with Phusion HotStart Flex polymerase in GC buffer (New England Biolabs), each sample was purified with AMPure beads (0.9:1), then digested with PmlI (New England Biolabs) for 4 hours, then purified with AMPure beads again. Then the reamplification PCR was performed for 15–25 cycles with Q5 HotStart polymerase. The samples were pooled according to their estimated concentration on an agarose gel stained with ethidium bromide, then purified with AMPure beads, and cut with PmlI for an additional 4 hours. Finally, bands of the expected library size or up to 100 bp larger were gel-purified using a Macherey-Nagel PCR Clean-up kit. They were sequenced on an Illumina HiSeq 2500 using the PE100 kit at the UCI Genomics High Throughput Facility.
Deep sequencing library preparation of the CHYRON locus expressed from a lentivirus in primary cells (for Extended Data Figures 7–8).
Genomic DNA was extracted with the QIAmp DNA Mini kit (for lineage reconstruction samples) or QIAmp DNA Micro kit (for other samples). For lineage reconstruction samples, all recovered DNA was used in the initial PCR. The initial PCR was performed for 30 cycles with Phusion HotStart Flex polymerase in GC buffer (New England Biolabs), then each sample was purified with AMPure beads (0.9:1). The reamplification PCR was performed for 15 cycles with Q5 HotStart polymerase. The samples were pooled according to their estimated concentration on an agarose gel stained with ethidium bromide, then purified with AMPure beads as before. They were sequenced on an Illumina HiSeq 4000 using the PE150 kit by Novogene Co.
Unique molecular identifier incorporation for sequencing of the CHYRON locus (for Figures 3, 4, and 6).
To barcode the initial primer extension product from each individual DNA template containing the integrated CHYRON locus, unique molecular identifiers (UMIs) of 20 degenerate nucleotides were incorporated. Primers were ordered from IDT containing the following: the Illumina reverse adapter, a UMI, a 5 – 7 nt sample-specific barcode, and a hgRNA construct binding region (Supplementary Table 1). gDNA was isolated with the QIAmp DNA Mini Kit (Qiagen) and 600 ng of nucleic acid was used. The UMI incorporation reaction was run with Phusion Hot Start Flex DNA Polymerase (NEB) and under the following condition: 98°C, 5 min; (55°C, 30 s at a ramp rate of 4°C/s ramp rate; 72°C, 1.5 min) × 10. The reaction was enzymatically cleaned with Exonuclease I and Shrimp Alkaline Phosphatase (NEB) by incubating the sample and enzymes for 30 minutes at 37°C.
A downstream PCR was performed on the UMI incorporation step to amplify specific sequences that contained a UMI. The sample was run with a forward primer with the Illumina forward adapter, a 5 – 7 nt sample-specific barcode, and an hgRNA binding region, and a reverse primer complementary to the Illumina reverse adapter present on the UMI primer. The PCR was performed under the following conditions: 98°C, 3 min; (98°C, 1 min; 65°C, 30 s; 72°C, 30 s) × 35; 72°C, 1 min with a 2°C/s ramp rate. Products were purified on columns from the NucleoSpin Gel and PCR Clean-up Kit (Macherey-Nagel) and individual samples were pooled based on equal molar ratios. Samples were further processed as for genomic sites for Figure 3B–D. For the rest of the experiments, samples were individually purified with AMPure beads (0.9:1), then reamplified for 15 cycles, pooled, and gel-purified including ~50 bp smaller and 100 bp larger than the expected band. Libraries were sequenced at the UCI Genomics High-throughput Facility on an Illumina MiSeq using the 500-cycle v2 reagent kit (Illumina Cat # MS-102–2003).
Amplification bias assay of varying polymerases.
Since the bias for TdT-mediated insertions is for the nucleotides G or C, it was important to test which polymerase would be optimal for amplifying GC stretches inserted on the hgRNA. Three gBlock Gene Fragments (IDT) were ordered with an insertion of 40 nucleotides at the −3 position of the hgRNA. The insertion was either 50%, 65%, or 80% GC rich. The amplification test was either performed with Q5 Hot Start High-Fidelity DNA Polymerase or Phusion Hot Start Flex DNA Polymerase (NEB). Reactions were performed with 10 ng of the individual fragments as well as with a 1:1:1 mix of all three fragments. Both forward and reverse primers contained a 5 – 7 nt sample-specific barcode and the appropriate Illumina adapters. The eight PCR’s were performed with the following protocol: 98 °C, 3 min; (98 °C, 1 min; 55 °C, 30 s; 72 °C, 30 s) × 35; 72 °C, 1 min with a 2 °C/s ramp rate. Each PCR was normalized using agarose gel electrophoresis and equal amounts of each sample were pooled based on signal intensity. Final pools were cleaned on a NucleoSpin Gel and PCR Clean-up Kit column (Macherey-Nagel) and sent to Quintara Biosciences or FornaxBio and sequenced as above.
Deep sequencing analysis.
The sequences retrieved by next generation sequencing were first grouped to individual samples based on their barcodes. Then for each sample, associated forward and reverse reads were merged (PEAR 0.9.1051) and mapped to the reference sequence by the alignment algorithm implementation (Mapp) used in Perli et al., 20163, which provides a sequence of M(Match), X(Mismatch), I(Insertion) and D(Deletion) as the mapping result.
If UMI barcodes are present, before mapping, sequences with the same barcodes are combined to one. To combine, we started with a multiple alignment of the sequences (done by Motility library in Python) with the same UMI barcode (one nucleotide difference was allowed in UMI barcodes) and to avoid any random mismatches produced in the sequencing process, for each position in this alignment only nucleotides present in more than 50% of the sequences in this group, were used to generate the consensus sequence.
After the alignment, first, bad alignments (>20 mismatches or >50% deletions) were removed. Then, mismatches and inserted or deleted sequences, their positions on the reference sequence and their frequencies were extracted: sequences were placed in one of three categories: unchanged, pure insertions (insertions), or any sequence that leads to a loss of information (deletions). “Deletions” included pure deletions; mixtures of insertion, deletion, and substitution mutations; and pure substitutions (2% of all edited sequences in the typical experiment shown in Figure 2a). Only insertions or deletions occurring around (−10nt to +10nt) the cut site were kept. (For the data in Figure 2, Extended Data Figure 2, and Supplementary Figures 1–2, we used the region −7 bp to +7 bp from the cut site to avoid a genomic SNP.) To remove insertions that were the result of homologous recombination repair, if longer insertions (>12nt) could map (with less than 2nt difference) to sequences of our plasmid backbones, they were filtered out. In addition, insertions longer than 15 nt (or 20 nt for Figure 2c and 40 nt for Extended Data Figure 6b) were excluded, as these were found to more frequently have nucleotide biases that suggested they were TdT-independent. For the data shown in Extended Data Figures 2 and 7, substitution mutations were detected at a higher rate, likely due to our increased use of Phusion polymerase, which has a higher error rate than the usual Q5 polymerase, during library prep. Therefore, the rate of substitution mutations observed in unedited negative control samples was subtracted from the rate observed in each edited sample.
All the analyses were done in Python. The scripts are available at github.com/liusynevolab/CHYRON-NGS.
For the experiment shown in Figure 5, because they were sequenced with a paired-end 100 protocol, rather than the paired-end 150 or 250 we used for all other experiments, forward and reverse reads were not paired, and forward reads only were used for the analysis.
Entropy calculations.
To calculate Shannon entropy, we first made a table of all the unique sequences in the relevant dataset, with, for each sequence, the number of times it was observed (the “count”). For each sample shown in Extended Data Figure 4c, from each read that aligned to the reference sequence, we extracted the sequence flanking the cut site (34 bp in the root sequence, shorter in loci with deletions, longer with insertions). The number of unique UMIs associated with the sequence was considered the count. For the calculations shown in Extended Data Figure 6a, we used as an input all insertion sequences that appeared in at least 0.0139% of non-deletion reads in any well of our lineage tracing dataset. Then, we used Python scripts to calculate how many times each possible 1, 2, 3, or 4 nt sequence appeared in these insertions. For example, if the insertion GAG appeared with 1,000 reads in our dataset, we would record a count of 1,000 for the sequences A, GA, AG, and GAG, and a count of 2,000 for the sequence G. Once a table of unique sequences and counts (c) was created, we calculated the proportion (p) for each sequence (equation shown here for sequence i).
| (1) |
Then we calculated the overall Shannon entropy (H) for the dataset:
| (2) |
All analyses were done in Python and Excel. The scripts are available at github.com/liusynevolab/CHYRON-entropycalc and github.com/liusynevolab/CHYRON-insertion-entropy-calc.
Simulation of lineage reconstruction with the information encoding properties of an hgRNA with Cas9 alone.
First, we identified the single hgRNA in Kalhor et al., 201811 with the highest information-encoding capacity when mutated by Cas9 alone. To do this, we calculated the number of unique mutated sequences observed per mouse sequenced for each of the hgRNAs presented. Then, for the top four hgRNAs, we made a table in which we recorded, for each unique mutated sequence, the number of mice in which it was observed (which we considered the count). From this table (Source Data for Extended Data Figure 9), we calculated the Shannon entropy. We argue that the value we calculated constitutes the maximum Shannon entropy, because some common mutated sequences likely arose multiple times in the same mouse, but we only increased the count by one for each mouse in which the sequence appeared; decreasing proportions of more-common sequences lead to increased entropy. The hgRNA (#36) with the highest Shannon entropy was used for the simulation. As above, we considered the number of mice in which it appeared the count for each mutated sequence. For each of the 434 mutated sequences that arose from hgRNA #36, we calculated the self-information (I) in bits:
| (3) |
Next, we calculated, for each of the 434 sequences, the length of a CHYRON insertion with the same self-information, using our earlier determination (Extended Data Figure 6a) that CHYRON insertions encode 1.74 bits/bp. If the calculated length was not an integer, it was expressed as a proportion of integer lengths. For example, if the calculated self-information for sequence x is 4.35 bits, the equivalent insertion length is 4.35 bits/1.74 bits per bp = 2.5 bp. Thus, sequence x corresponds to 50% 2 bp and 50% 3 bp insertions. The equivalent insertion lengths for all 434 mutated sequences were determined, and these values, weighted according to the abundance of the mutated sequence in the Kalhor et al. dataset, were used to calculate the proportions of insertions of each length required to match the overall information capacity and distribution in the hgRNA dataset. We calculated that a CHYRON dataset equivalent in information-encoding capacity to hgRNA #36 would include 3% 2-bp insertions, 19% 3-bp insertions, 17% 4-bp insertions, 40% 5-bp insertions, and 21% 6-bp insertions.
For the next step in our simulation, we created a CHYRON dataset with the above insertion lengths. First, we created a “complete list,” for each well in our lineage tracing experiment (Figure 5), of the insertions that are at least 6 bp in length and that represented at least 0.0139% of all non-deletion reads. Then, we created a “dictionary table” of all unique insertions in this master list, along with all wells in which they were detected. At random, we truncated 3% of the insertions in the dictionary table to 2 bp, 19% to 3 bp, etc. All truncations removed the “downstream” nucleotides. In this way, we created a “truncated list” for each well. The truncated lists were used to calculate the Jaccard similarity between all possible pairs of wells and perform UPGMA hierarchical clustering. The truncation process was repeated five times. For analyses in which sampling was limited, we started with the complete list for each well. From the complete list, we simulated poor sampling by discarding 80% of the insertions from each well at random to create the 20% list. Then, we proceeded to create the dictionary table and perform the truncations as above to create the truncated 20% lists. In parallel, we used the (full-length) 20% lists and truncated 20% lists to calculate Jaccard similarities and perform UPGMA hierarchical reconstructions. The entire sampling, truncating, and reconstruction processes were performed in five replicates.
All analyses were done in Python and Excel, and scripts are available at github.com/liusynevolab/CHYRON-truncation-simulation.
Statistical analyses.
In all cases, biological replicates are derived from different populations of cells that were manipulated separately throughout the experiment. For technical replicates, cells were grown and manipulated, and DNA extracted, together. All procedures downstream of DNA extraction were performed separately. For the data shown in Figure 6b and Extended Data Figure 10, statistical analysis was performed in SPSS. For Figure 6b, for each sample, the values of the three technical replicates were listed. For comparison of the 0.25 mM and 0.5 mM doses, the samples from each timepoint were compared by independent samples two-tailed T test. (Variances were equal as determined by p>0.05 on Levene’s test.) For Extended Data Figure 10, for each timepoint and dose, a list of all insertion lengths recorded was created. (For this analysis, technical replicates were pooled.) Then, for each dose, whether the lengths were significantly different between timepoints was determined. For each dose, variances were unequal as determined by p<0.05 on Levene’s test. Therefore, we performed a Welch one-way ANOVA, followed by a post hoc Games-Howell test.
Figure preparation.
Figure 5a, Extended Data Figure 1, Extended Data Figure 5a, Extended Data Figure 7a, and Extended Data Figure 8a were prepared at biorender.com. The plots in Figure 5b, Extended Data Figure 8b, Extended Data Figure 9b, Supplementary Figure 4a, and Supplementary Figure 4c were generated using the hierarchy.dendrogram function in matplotlib (scipy.org). The threshold for color change was set at the default level: 0.7*max(Z[:,2]).
Data Availability Statement
All scripts are available at github.com/liusynevolab. All NGS data sets have been deposited at the NCBI’s Sequence Read Archive, accession # PRJNA561027. All plasmids and full sequences are available at Addgene. See Supplementary Table 1 for a guide to these data and reagents. Please contact CCL for cell lines.
Extended Data
Extended Data Fig. 1. Detailed model for the progressive accumulation of insertions at the CHYRON locus.
The nucleotides initially added by TdT may be ribonucleotides20.
Extended Data Fig. 2. TdT writes stretches of random nucleotides at a Cas9-induced DSB in primary cells.
(a) Expression of TdT promoted insertion mutations. Adult human primary dermal fibroblasts were nucleofected with plasmids expressing Cas9 and TdT, or Cas9 alone, and an sgRNA against a genomic site (site3, as in Figure 2). After 7 days, cells were collected, processed, and analyzed as described in Figure 2a and Methods. Each point represents a single technical replicate. (Some points overlap; three replicates were assayed.) (b) Expression of TdT resulted in longer insertion mutations than those minority insertions created in the presence of Cas9 alone, suggesting that TdT acts as a DNA writer. From the pool of pure insertions, the average length was calculated and plotted. Each point represents a single technical replicate. (Some points overlap; three replicates were assayed.) (c) Insertion sequences generated by TdT had the same nucleotide biases in primary fibroblasts as in 293T cells. The proportions of each nucleotide (on the top strand) found in all pure insertion sequences 4 bp in length were calculated and plotted. Each point represents a single technical replicate. (293T data from Figure 2c, sequence “GT”).
Extended Data Fig. 3. TdT-mediated insertions are added 3 bp upstream of the PAM.
For the pure insertions shown in Figure 2a, the position of the insertion was determined, if the insertion sequence made this determination possible. Insertions were annotated as having an “indeterminate” position, for example, if the 3’ nt of the insertion was identical to the protospacer nt 5’ of where the insertion was placed. Each point represents the mean of two technical replicates of a single biological replicate.
Extended Data Fig. 4. Further characterization of CHYRON20.
(a) Schematic of 293T-CHYRON20. (b) Western blots of samples shown in Figure 3a–c. (c) The Shannon entropy was calculated at each timepoint of this experiment.
Extended Data Fig. 5. Further characterization of CHYRON20 over successive rounds of activity.
(a) Plan of the experiment for (b), Figure 3d, and Supplementary Figure 3. (b) Cas9 and TdT mediated multiple rounds of editing on an integrated hgRNA. The 293T-CHYRON20 cell line was transfected with Cas9 and TdT to induce insertions, then single colonies isolated. The clonal isolate shown bears the insertions CTGAAAAACT and CCT. This cell line was treated and sequences analyzed as in Figure 3e. Editing outcomes were determined to be the root CHYRON20 sequence (not shown), deletions, both dominant insertions (not shown), any insertion containing these insertions or a shortened version as a prefix (CTGAAAAACT+, CCT+, CTGAA+), any insertion containing the sequences CTGAA or CCT other than as a prefix (*CTGAA* and *CCT*), or other insertions. Each point represents a single biological replicate.
Extended Data Fig. 6. Further characterization of CHYRON20i and CHYRON16i.
(a) From the insertions detected in the experiment shown in Figure 5, the proportions of all possible single-nt, 2-nt, 3-nt, and 4-nt sequences were determined, and the Shannon entropy calculated. The Shannon entropy was divided by the length of the sequences considered to calculate the bits per bp encoded in the insertions. (b) CHYRON loci with an initial hgRNA length of 20 nt accumulated insertions quickly, with a gradual increase in length, whereas those with an initial hgRNA length of 16 nt accumulated insertions more slowly, ending up with a much longer insertion distribution. In the experiment shown in Figure 4, 293T-CHYRON20i and 293T-CHYRON16i cells were transfected with a plasmid expressing Cas9 and TdT for the indicated time before collection. Cells were re-transfected every 3 days. The CHYRON locus was analyzed by NGS and each sequence was annotated as root, pure insertion or any sequence that involves a loss of information. The percentage of total sequences that are a pure insertion of the indicated length was plotted. Each point represents a single technical replicate. (Some points overlap; three replicates were assayed.)
Extended Data Fig. 7. CHYRON17 delivered to primary cells by virus accumulates insertion mutations.
(a) Plan of the experiment. Cells were infected with two lentiviruses, one expressing Cas9 and one expressing TdT and an hgRNA with a 17 nt initial spacer length, at an MOI of 3 for each virus, then grown for the indicated time before collection. (b) The CHYRON locus was analyzed by NGS and each sequence was annotated as in Figure 2a. (c) From these data, the average length of all pure insertions was calculated. For b and c, each point represents a single biological replicate.
Extended Data Fig. 8. Reconstruction of cell relatedness by DNA recording in primary cells.
(a) Plan of the experiment. This procedure was performed in quadruplicate to generate 16 final wells. 76,000 human adult primary dermal fibroblasts growing in 2 wells of a 24-well plate were infected with lentiviruses carrying CHYRON17 at high MOI as described in Extended Data Figure 7, then re-plated after 3 days to begin the experiment. Each well was split evenly into two new wells after 4 days, then split again after 14 more days, then collected 4 days after that. The CHYRON locus was sequenced, and unique insertions enumerated for each well. Low-abundance, artifactual insertions were removed (see Supplementary Figure 4b and Methods). Lineage reconstruction was performed as in Figure 5. (b) Dendrograms for reconstruction using all unique insertions 7-15 bp in length.
Extended Data Fig. 9. Reconstruction of cell relatedness by DNA recording requires high information when sampling is limited.
For the experiment shown in Figure 5, lineage reconstruction under sampling constraints would have been unsuccessful with a recorder that makes use of an hgRNA and Cas9 only. For each population in the experiment, the data set was degraded at random so that only 20% of all unique insertions remained. Then, each insertion was truncated so that the proportions of insertions encoding each amount of self-information matched the proportions of mutated hgRNA sequences encoding that amount of self-information in a published dataset. This pipeline was run five times and the number of correctly reconstructed relationships was calculated in the following way: for each well, the reconstruction was awarded one point for grouping the well with the proper sibling well and one point for grouping the well with at least 2 of the 3 other wells in its clade. Because the relationships among 16 wells were reconstructed, a maximum of 32 points is possible. (a) Each point represents a replicate of the entire truncation and degradation process. For each reconstruction, the insertion length cutoff that produced the most accurate reconstruction for that sample was used. (b) Representative dendrograms for reconstruction from 20% sampling data before or after truncation. For reference, the reconstruction on the left had a score of 30, and the reconstruction on the right had a score of 18. (c) Reconstructions were scored for each minimum insertion length (in bp) used for reconstruction, which is noted below each bar. Results were plotted as in (a). For the experiment shown in Figure 6d, the length of each insertionrecorded in each condition was tabulated and plotted. At each dose, the timepoints were significantly different by one-way Welch analysis of variance (ANOVA). For the 0.25 mM dose, F=17.659, p<0.001; for the 0.5 mM dose, F=18.463, p<0.001; for the 1 mM dose, F=7.461, p<0.001. Pairs of samples marked * were significantly different according to post hoc Games-Howell test (p<0.001).
Extended Data Fig. 10. 293T-CHYRON16 insertions grow longer with increasing duration of exposure to DMOG.
For the experiment shown in Figure 6d, the length of each insertionrecorded in each condition was tabulated and plotted. At each dose, the timepoints were significantly different by one-way Welch analysis of variance (ANOVA). For the 0.25 mM dose, F=17.659, p<0.001; for the 0.5 mM dose, F=18.463, p<0.001; for the 1 mM dose, F=7.461, p<0.001. Pairs of samples marked * were significantly different according to post hoc Games-Howell test (p<0.001).
Supplementary Material
Acknowledgements:
We thank Seanjeet K. Paul and Tate C. Lone for technical assistance. We thank the following people for helpful discussions: Christian Guerrero-Juarez, Chengjian Li, Jan Zimak, Qing Nie, and all members of the Liu Laboratory. We thank the following people for plasmids: Yvonne Chen, Keith Joung, William Kaelin, George Church, David Liu, Eric Campeau, Paul Kaufman, Timothy Lu, Phil Sharp, Feng Zhang, Kazuhiro Oka, and Isei Tanida. This work was made possible, in part, through access to the Genomics High Throughput Facility Shared Resource of the Cancer Center Support Grant (P30CA-062203) at the University of California, Irvine and NIH shared instrumentation grants 1S10RR025496–01, 1S10OD010794–01, and 1S10OD021718–01. This work was funded by NIH grants 1DP2GM119163–01 and 1R21GM126287–01 to CCL, AHA Predoctoral and NSF Graduate Research Fellowships to CKC, and a fellowship from the NSF-Simons Center for Multiscale Cell Fate Research (NSF Award #1763272) to TBL.
Footnotes
Competing interests: The authors have no competing interests.
References
- 1.McDole K et al. In Toto Imaging and Reconstruction of Post-Implantation Mouse Development at the Single-Cell Level. Cell 175, 859–876.e33 (2018). [DOI] [PubMed] [Google Scholar]
- 2.McKenna A et al. Whole-organism lineage tracing by combinatorial and cumulative genome editing. Sci New York N Y 353, aaf7907 (2016). [DOI] [PMC free article] [PubMed] [Google Scholar]
- 3.Perli SD, Cui CH & Lu TK Continuous genetic recording with self-targeting CRISPR-Cas in human cells. Science 353, aag0511–aag0511 (2016). [DOI] [PubMed] [Google Scholar]
- 4.Kalhor R, Mali P & Church GM Rapidly evolving homing CRISPR barcodes. Nat Methods 14, 195–200 (2017). [DOI] [PMC free article] [PubMed] [Google Scholar]
- 5.Frieda KL et al. Synthetic recording and in situ readout of lineage information in single cells. Nature 541, 107–111 (2017). [DOI] [PMC free article] [PubMed] [Google Scholar]
- 6.Schmidt ST, Zimmerman SM, Wang J, Kim SK & Quake SR Quantitative analysis of synthetic cell lineage tracing using nuclease barcoding. Acs Synth Biol (2017) doi: 10.1021/acssynbio.6b00309. [DOI] [PMC free article] [PubMed] [Google Scholar]
- 7.Sheth RU, Yim SS, Wu FL & Wang HH Multiplex recording of cellular events over time on CRISPR biological tape. Sci New York N Y 358, 1457–1461 (2017). [DOI] [PMC free article] [PubMed] [Google Scholar]
- 8.Tang W & Liu DR Rewritable multi-event analog recording in bacterial and mammalian cells. Sci New York N Y 360, eaap8992 (2018). [DOI] [PMC free article] [PubMed] [Google Scholar]
- 9.Shipman SL, Nivala J, Macklis JD & Church GM CRISPR–Cas encoding of a digital movie into the genomes of a population of living bacteria. Nature 547, 345–349 (2017). [DOI] [PMC free article] [PubMed] [Google Scholar]
- 10.Shipman SL, Nivala J, Macklis JD & Church GM Molecular recordings by directed CRISPR spacer acquisition. Sci New York N Y 353, aaf1175 (2016). [DOI] [PMC free article] [PubMed] [Google Scholar]
- 11.Kalhor R et al. Developmental barcoding of whole mouse via homing CRISPR. Sci New York N Y 361, eaat9804 (2018). [DOI] [PMC free article] [PubMed] [Google Scholar]
- 12.Raj B et al. Simultaneous single-cell profiling of lineages and cell types in the vertebrate brain. Nat Biotechnol 36, 442–450 (2018). [DOI] [PMC free article] [PubMed] [Google Scholar]
- 13.Spanjaard B et al. Simultaneous lineage tracing and cell-type identification using CRISPR–Cas9-induced genetic scars. Nat Biotechnol 36, 469–473 (2018). [DOI] [PMC free article] [PubMed] [Google Scholar]
- 14.Sheth RU & Wang HH DNA-based memory devices for recording cellular events. Nat Rev Genet 19, 718–732 (2018). [DOI] [PMC free article] [PubMed] [Google Scholar]
- 15.Hwang B et al. Lineage tracing using a Cas9-deaminase barcoding system targeting endogenous L1 elements. Nat Commun 10, 1234 (2019). [DOI] [PMC free article] [PubMed] [Google Scholar]
- 16.Chan MM et al. Molecular recording of mammalian embryogenesis. Nature 570, 77–82 (2019). [DOI] [PMC free article] [PubMed] [Google Scholar]
- 17.Bowling S et al. An Engineered CRISPR-Cas9 Mouse Line for Simultaneous Readout of Lineage Histories and Gene Expression Profiles in Single Cells. Cell (2020) doi: 10.1016/j.cell.2020.04.048. [DOI] [PMC free article] [PubMed] [Google Scholar]
- 18.Alemany A, Florescu M, Baron CS, Peterson-Maduro J & Oudenaarden A van. Whole-organism clone tracing using single-cell sequencing. Nature 556, 108–112 (2018). [DOI] [PubMed] [Google Scholar]
- 19.Landau NR, Schatz DG, Rosa M & Baltimore D Increased frequency of N-region insertion in a murine pre-B-cell line infected with a terminal deoxynucleotidyl transferase retroviral expression vector. Mol Cell Biol 7, 3237–3243 (1987). [DOI] [PMC free article] [PubMed] [Google Scholar]
- 20.Pryor JM et al. Ribonucleotide incorporation enables repair of chromosome breaks by nonhomologous end joining. Sci New York N Y 361, 1126–1129 (2018). [DOI] [PMC free article] [PubMed] [Google Scholar]
- 21.Wang T, Wei JJ, Sabatini DM & Lander ES Genetic screens in human cells using the CRISPR-Cas9 system. Sci New York N Y 343, 80–4 (2013). [DOI] [PMC free article] [PubMed] [Google Scholar]
- 22.Jinek M et al. A programmable dual-RNA-guided DNA endonuclease in adaptive bacterial immunity. Sci New York N Y 337, 816–21 (2012). [DOI] [PMC free article] [PubMed] [Google Scholar]
- 23.Zuo Z & Liu J Cas9-catalyzed DNA Cleavage Generates Staggered Ends: Evidence from Molecular Dynamics Simulations. Sci Rep-uk 6, 37584 (2016). [DOI] [PMC free article] [PubMed] [Google Scholar]
- 24.Gisler S et al. Multiplexed Cas9 targeting reveals genomic location effects and gRNA-based staggered breaks influencing mutation efficiency. Nat Commun 10, 1598 (2019). [DOI] [PMC free article] [PubMed] [Google Scholar]
- 25.Shannon CE A Mathematical Theory of Communication. Bell Syst Tech J 27, 379–423 (1948). [Google Scholar]
- 26.Motea EA & Berdis AJ Terminal deoxynucleotidyl transferase: The story of a misguided DNA polymerase. Biochimica Et Biophysica Acta Bba - Proteins Proteom 1804, 1151–1166 (2010). [DOI] [PMC free article] [PubMed] [Google Scholar]
- 27.Liu M et al. Genomic discovery of potent chromatin insulators for human gene therapy. Nat Biotechnol 33, 198–203 (2015). [DOI] [PubMed] [Google Scholar]
- 28.Semenza GL Hypoxia-Inducible Factors in Physiology and Medicine. Cell 148, 399–408 (2012). [DOI] [PMC free article] [PubMed] [Google Scholar]
- 29.Rankin EB & Giaccia AJ Hypoxic control of metastasis. Science 352, 175–180 (2016). [DOI] [PMC free article] [PubMed] [Google Scholar]
- 30.Ede C, Chen X, Lin M-Y & Chen YY Quantitative Analyses of Core Promoters Enable Precise Engineering of Regulated Gene Expression in Mammalian Cells. Acs Synth Biol 5, 395–404 (2016). [DOI] [PMC free article] [PubMed] [Google Scholar]
- 31.McKenna A & Gagnon JA Recording development with single cell dynamic lineage tracing. Development 146, dev169730 (2019). [DOI] [PMC free article] [PubMed] [Google Scholar]
- 32.Fu Y, Sander JD, Reyon D, Cascio VM & Joung JK Improving CRISPR-Cas nuclease specificity using truncated guide RNAs. Nat Biotechnol 32, 279–284 (2014). [DOI] [PMC free article] [PubMed] [Google Scholar]
- 33.Palluk S et al. De novo DNA synthesis using polymerase-nucleotide conjugates. Nat Biotechnol 36, 645–650 (2018). [DOI] [PubMed] [Google Scholar]
- 34.Barthel S, Palluk S, Hillson NJ, Keasling JD & Arlow DH Enhancing Terminal Deoxynucleotidyl Transferase Activity on Substrates with 3’ Terminal Structures for Enzymatic De Novo DNA Synthesis. Genes-basel 11, 102 (2020). [DOI] [PMC free article] [PubMed] [Google Scholar]
- 35.Lee HH, Kalhor R, Goela N, Bolot J & Church GM Terminator-free template-independent enzymatic DNA synthesis for digital information storage. Nat Commun 10, 2383 (2019). [DOI] [PMC free article] [PubMed] [Google Scholar]
- 36.Zamft BM et al. Measuring Cation Dependent DNA Polymerase Fidelity Landscapes by Deep Sequencing. Plos One 7, e43876 (2012). [DOI] [PMC free article] [PubMed] [Google Scholar]
- 37.Marblestone AH et al. Physical principles for scalable neural recording. Front Comput Neurosc 7, 137 (2013). [DOI] [PMC free article] [PubMed] [Google Scholar]
- 38.Glaser JI et al. Statistical analysis of molecular signal recording. Plos Comput Biol 9, e1003145 (2013). [DOI] [PMC free article] [PubMed] [Google Scholar]
- 39.Bhan NJ et al. Recording temporal data onto DNA with minutes resolution. Biorxiv 634790 (2019) doi: 10.1101/634790. [DOI] [Google Scholar]
- 40.Mali P et al. RNA-guided human genome engineering via Cas9. Sci New York N Y 339, 823–6 (2013). [DOI] [PMC free article] [PubMed] [Google Scholar]
- 41.Komor AC, Kim YB, Packer MS, Zuris JA & Liu DR Programmable editing of a target base in genomic DNA without double-stranded DNA cleavage. Nature 533, 420–424 (2016). [DOI] [PMC free article] [PubMed] [Google Scholar]
- 42.Yan Q, Bartz S, Mao M, Li L & Kaelin WG The Hypoxia-Inducible Factor 2α N-Terminal and C-Terminal Transactivation Domains Cooperate To Promote Renal Tumorigenesis In Vivo. Mol Cell Biol 27, 2092–2102 (2007). [DOI] [PMC free article] [PubMed] [Google Scholar]
- 43.Campeau E et al. A versatile viral system for expression and depletion of proteins in mammalian cells. Plos One 4, e6529 (2009). [DOI] [PMC free article] [PubMed] [Google Scholar]
- 44.Tsai SQ et al. Dimeric CRISPR RNA-guided FokI nucleases for highly specific genome editing. Nat Biotechnol 32, 569–576 (2014). [DOI] [PMC free article] [PubMed] [Google Scholar]
- 45.Waldo GS, Standish BM, Berendzen J & Terwilliger TC Rapid protein-folding assay using green fluorescent protein. Nat Biotechnol 17, 691–695 (1999). [DOI] [PubMed] [Google Scholar]
- 46.Yang B, Gathy KN & Coleman MS Mutational analysis of residues in the nucleotide binding domain of human terminal deoxynucleotidyl transferase. J Biological Chem 269, 11859–68 (1994). [PubMed] [Google Scholar]
- 47.Repasky JAE, Corbett E, Boboila C & Schatz DG Mutational Analysis of Terminal Deoxynucleotidyltransferase- Mediated N-Nucleotide Addition in V(D)J Recombination. J Immunol 172, 5478–5488 (2004). [DOI] [PubMed] [Google Scholar]
- 48.Lee ME, DeLoache WC, Cervantes B & Dueber JE A Highly Characterized Yeast Toolkit for Modular, Multipart Assembly. Acs Synth Biol 4, 975–986 (2015). [DOI] [PubMed] [Google Scholar]
- 49.Chen S et al. Genome-wide CRISPR Screen in a Mouse Model of Tumor Growth and Metastasis. Cell 160, 1246–1260 (2015). [DOI] [PMC free article] [PubMed] [Google Scholar]
- 50.Kleinstiver BP et al. Engineered CRISPR-Cas9 nucleases with altered PAM specificities. Nature 523, 481–485 (2015). [DOI] [PMC free article] [PubMed] [Google Scholar]
- 51.Zhang J, Kobert K, Flouri T & Stamatakis A PEAR: a fast and accurate Illumina Paired-End reAd mergeR. Bioinform Oxf Engl 30, 614–20 (2013). [DOI] [PMC free article] [PubMed] [Google Scholar]
Associated Data
This section collects any data citations, data availability statements, or supplementary materials included in this article.
Supplementary Materials
Data Availability Statement
All scripts are available at github.com/liusynevolab. All NGS data sets have been deposited at the NCBI’s Sequence Read Archive, accession # PRJNA561027. All plasmids and full sequences are available at Addgene. See Supplementary Table 1 for a guide to these data and reagents. Please contact CCL for cell lines.


