Abstract
The adipose tissue-derived hormone leptin can drive decreases in food intake while increasing energy expenditure. In diet-induced obesity, circulating leptin levels rise proportionally to adiposity. Despite this hyperleptinemia, rodents and humans with obesity maintain increased adiposity and are resistant to leptin’s actions. Here we show that inhibitors of the cytosolic enzyme histone deacetylase 6 (HDAC6) act as potent leptin sensitizers and anti-obesity agents in diet-induced obese mice. Specifically, HDAC6 inhibitors, such as tubastatin A, reduce food intake, fat mass, hepatic steatosis and improve systemic glucose homeostasis in an HDAC6-dependent manner. Mechanistically, peripheral, but not central, inhibition of HDAC6 confers central leptin sensitivity. Additionally, the anti-obesity effect of tubastatin A is attenuated in animals with a defective central leptin-melanocortin circuitry, including db/db and MC4R-KO mice. Our results suggest the existence of an HDAC6-regulated adipokine that serves as a leptin-sensitizing agent, and reveals HDAC6 as a potential target for the treatment of obesity.
Obesity and associated disorders including type II diabetes, cardiovascular disease and cancer have reached epidemic rates around the world 1. A hallmark of diet-induced obesity is hyperleptinemia. Leptin is a 16 kDa hormone produced mainly by the adipose tissue in proportion to the size of the fat depots, and acts through its receptors (LepRb) expressed predominantly in the central nervous system (CNS) including the hypothalamus, brain stem and midbrain 2. Leptin administration to leptin deficient mice (ob/ob) reduces food intake and increases energy expenditure, resulting in profound weight loss. In diet-induced obesity, the circulating leptin levels rise proportionally to adiposity, and may reach levels 10–40 fold higher than the lean state 3. Despite this hyperleptinemic state, obese rodents and humans maintain their increased adiposity, and show a blunted response to exogenous leptin administration, which has been characterized as leptin resistance 4.
Defective protein homeostasis (proteostasis) has emerged as a contributing factor to the metabolic syndrome 5–8. Impairments in proteostatic processes such as autophagy 9,10, the heat shock response 11–14, ubiquitin-proteasome pathway 8,15,16, and integrated stress responses 17,18 have been implicated in the pathophysiology of obesity and diabetes. A central component of these proteostatic mechanisms is histone deacetylase 6 (HDAC6), a microtubule-associated member of the HDAC family that is predominantly localized to the cytoplasm. In addition to its deacetylase activity, and E3 ligase activity 19, HDAC6 has non-enzymatic functions largely due to its C-terminal ubiquitin-binding domain (UBD) 20,21, making it a unique HDAC that can interact with proteins normally targeted to degradation through the proteasome. Cellular processes regulated by HDAC6 include aggresome and stress granule formation 22,23, autophagy 24, heat shock response, and recycling of dysfunctional mitochondria through mitophagy 25,26. Here, we examine the physiological role of HDAC6 in the regulation of energy homeostasis.
Results
HDAC6 Inhibitors Reduce Obesity
In order to study the potential role of HDAC6 in energy homeostasis, we first targeted its deacetylase activity pharmacologically. A hydroxamic acid-based compound, tubastatin A (tubastatin), is a potent and selective HDAC6 inhibitor with over 1000-fold selectivity against other HDACs (except HDAC8 with more than 50 fold selectivity) 27. It has been designed to have a drug-like structure with relatively simple synthesis 27, and its pharmacokinetics in mice have been characterized 28. Tubastatin confers protection against oxidative stress, and has anti-inflammatory and neuroprotective effects 27,29–32.
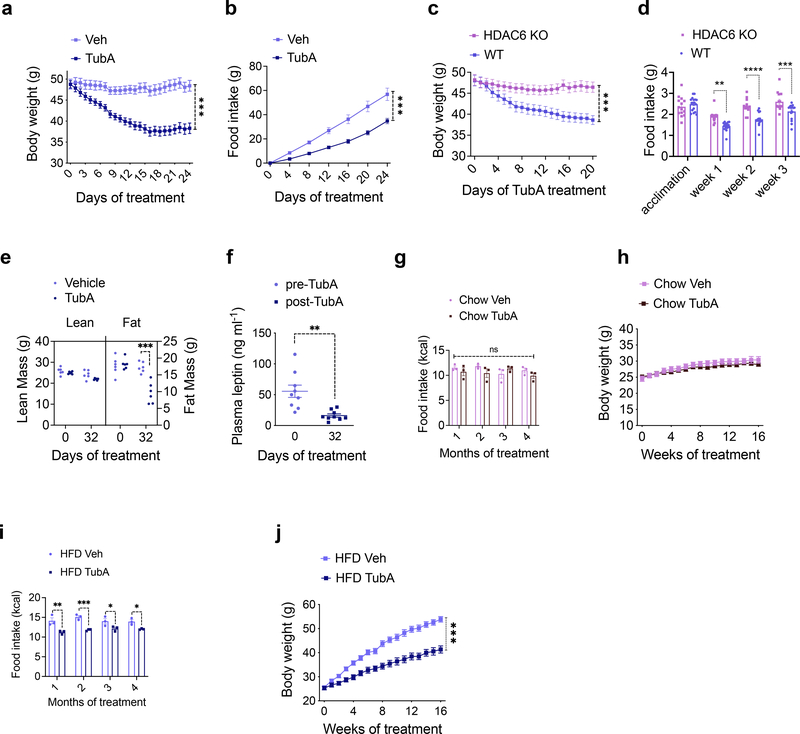
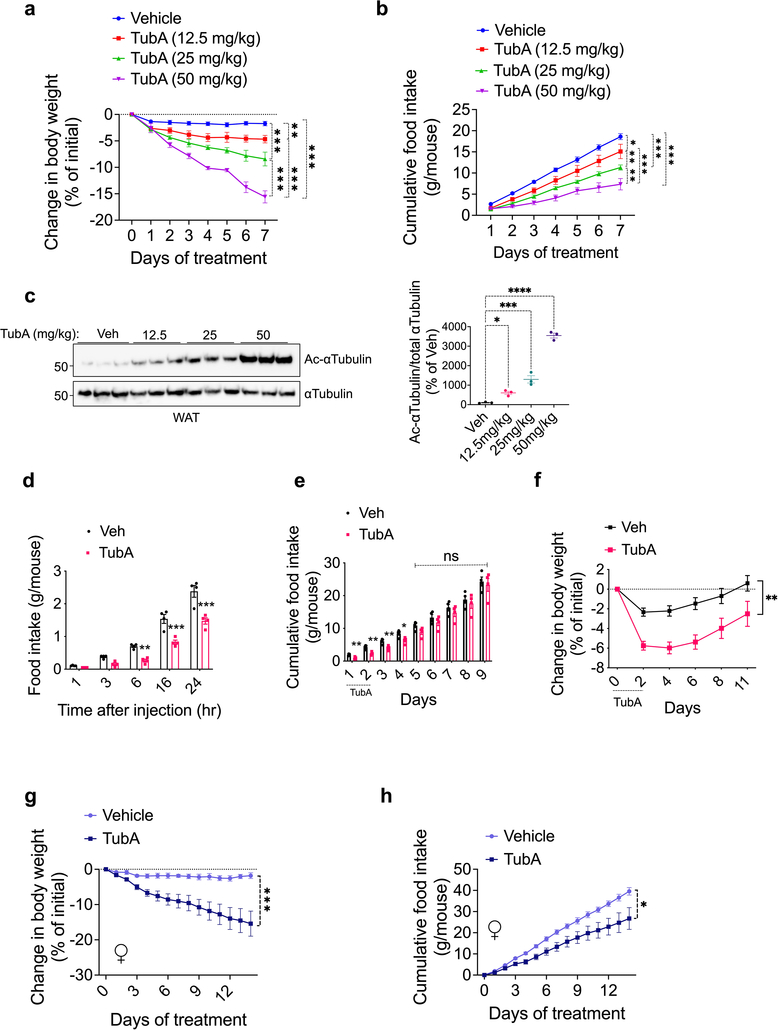
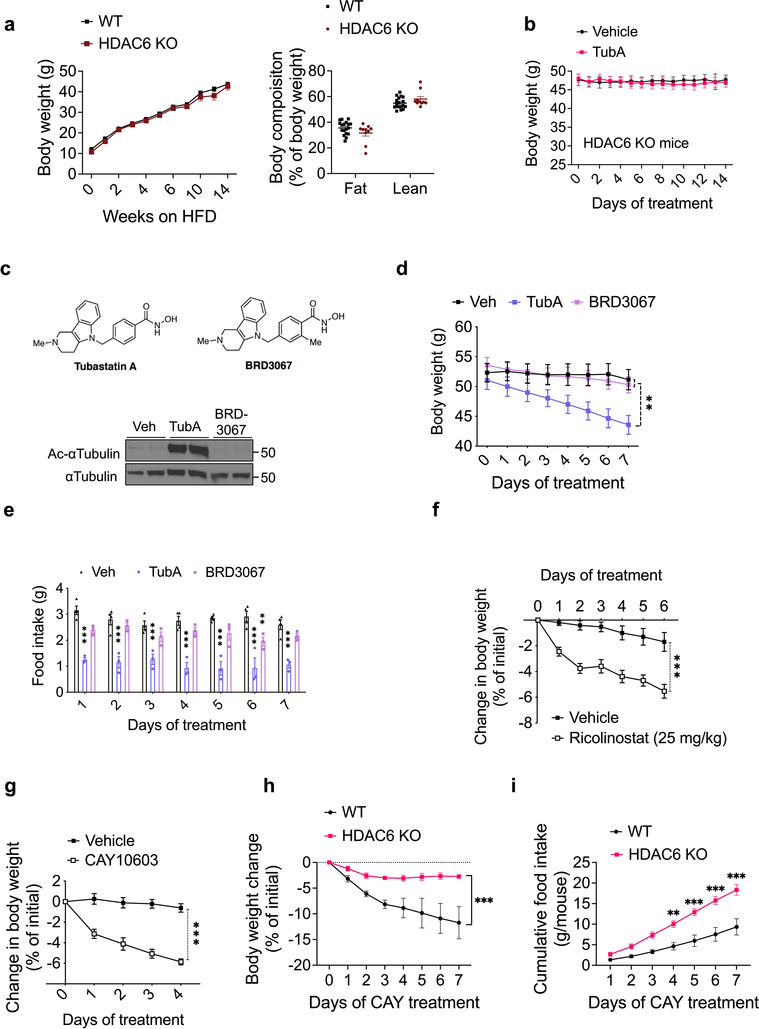
We first analyzed the effect of tubastatin in wild-type male mice fed high fat diet (HFD) for 16–20 weeks to induce obesity (diet-induced obese, DIO). Following daily intraperitoneal (i.p.) injections, DIO mice lost weight for approximately two weeks (Fig. 1a). The weight loss was accompanied by significantly decreased food intake (Fig. 1b), and the effect of tubastatin was dose dependent (Extended Data Fig. 1a–f). The anti-obesity effect of the drug was not specific to male mice and tubastatin significantly decreased the body weight and food intake of female DIO mice (Extended Data Fig. 1g, h). We next tested whether the effect of tubastatin was HDAC6 dependent by first assessing the response of the HDAC6 KO mice to tubastatin. The weight gain of HDAC6 KO mice or their body composition were not different than those of wild-type mice on high-fat diet (Extended Data Fig. 2a), suggesting that embryonic ablation of HDAC6 does not protect mice from diet-induced obesity. However, tubastatin was ineffective in decreasing the body weight or food intake of DIO HDAC6 KO mice (Fig. 1c, d, Extended Data Fig. 1b). Furthermore, a structurally inactive analog of tubastatin, BRD3067 33, which cannot inhibit the deacetylase activity of HDAC6 (Extended Data Fig. 1c), did not significantly reduce the food intake or body weight of obese mice (Extended Data Fig. 1d, e). In agreement with these findings, two other HDAC6-specific inhibitors, CAY10603 and ricolinostat also resulted in significant weight loss in DIO wild-type mice (Extended Data Fig. 1f–l).
Fig. 1. Inhibition of HDAC6 Reverses Diet-Induced Obesity.
a, b, Effect of daily intraperitoneal (i.p.) Tubastatin (TubA, 25 mg/kg, n= 6) or vehicle (Veh, n= 6) administration on wild-type DIO mice: a, Body weight (P=2.6E-9), b, cumulative food intake of the animals (P=1.7E-5). c, Body weight (P=1E-4) and d, food intake (week 1 P=0.0012, week 2 P=7E-6, week 3 P=0.00097) of TubA-treated WT (n=17) and HDAC6 KO (n= 14) DIO mice. e, Lean and fat mass of DIO mice determined by nuclear magnetic resonance (NMR) before and 32 days after TubA or Veh treatment (n= 6 per group, Fat mass at 32 days P= 1.4E-7). f, Plasma leptin concentration of DIO mice before and 32 days after tubastatin treatment (n= 6, P=0.0016). g-j, Food intake and growth curves of wild-type mice on regular diet (chow) or HFD treated by daily i.p. vehicle or tubastatin (25 mg/kg) (n=9 mice per group) For i, week1 P=0.0014, week2 P=0.00043, week 3 P=0.042, week4 P=0.037); j, P=1E-10). *P<0.05, **P<0.01, ***P<0.001 as analyzed by one-way or two-way analysis of variance (ANOVA) or mixed-effect analysis with Tukey’s post-hoc test for multiple comparison, or two-tailed Student’s t-test. Data are represented as mean ± s.e.m.
Fasting and calorie restriction are usually followed by a decrease in fat and muscle mass 34. Because tubastatin significantly suppressed the food intake of the obese animals, we measured the body composition of the mice at the beginning and one month after tubastatin or vehicle treatments. In contrast to calorie restriction induced weight loss, tubastatin treatment did not significantly alter the lean mass of the DIO mice while their fat mass decreased approximately 50% (Fig. 1e). These results are in agreement with the HDAC6 null mice being resistant to skeletal muscle wasting 35, and suggest that the tubastatin-induced weight loss was almost exclusively from fat depots. Accordingly, the plasma leptin levels of DIO mice significantly decreased following tubastatin treatment (Fig. 1f).
While HDAC6 inhibition induces weight loss in DIO mice, it is not known if the same treatment would prevent the development of obesity. In order to address this question, and to assess the prolonged effects of tubastatin on mouse physiology, we treated young wild-type mice with either vehicle or tubastatin for 16 consecutive weeks while feeding the mice either regular chow or HFD. The body weight or food intake of the lean wild-type mice were surprisingly not affected by the HDAC6 inhibitor over a four-month treatment (Fig. 1g, h), and tubastatin was inert on measured cardiac parameters including the heart rate and blood pressure (Extended Data Fig. 3a, b), suggesting that inhibition of HDAC6 activity alone does not significantly alter metabolism via sympathetic tone or thyroid hormone in lean mice. However, when the animals were exposed to HFD, tubastatin restricted the calorie intake of the animals and reduced weight gain (Fig. 1i, j). These results collectively suggest that HDAC6 inhibition is an effective anti-obesity approach.
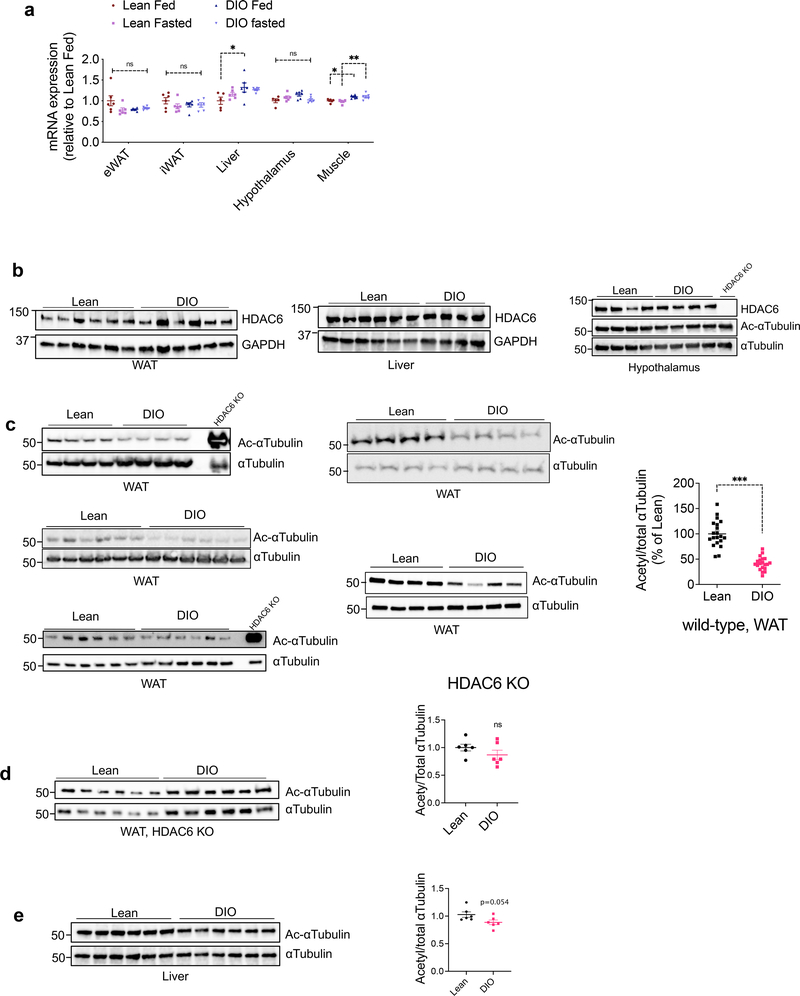
HDAC6 mRNA and protein expression in the metabolic tissues we analyzed including the adipose tissue, skeletal muscle, liver and the hypothalamus did not show major changes by fasting or diet-induced obesity (Fig. 2a, b). The enzymatic activity of HDAC6 is positively regulated by upstream signals, including the extracellular signal activated kinases (ERK1/2) 36, which are activated during obesity in the adipose tissue 37. Analysis of acetylated α-tubulin, the canonical marker of HDAC6 activity, revealed that DIO mice had significantly decreased α-tubulin acetylation in the adipose tissue (Fig. 2c) but not in the liver or the hypothalamus (Fig. 2b, e). Notably, obese HDAC6 KO mice did not display the same change in α-tubulin acetylation (Fig. 2d). These findings demonstrated that HDAC6 activity is elevated in the adipose tissue of obese animals, and HDAC6 inhibition effectively reverses obesity.
Fig. 2. Obesity induces HDAC6 activity in the adipose tissue.
a, HDAC6 mRNA expression at the indicated tissues collected from lean and DIO wild-type mice fed ad lib or fasted overnight (n=5 for liver and hypothalamus of lean fed and muscle of lean fasted; n=6 for all other groups). *P<0.05, **P<0.01 as analyzed by one-way ANOVA. b-d, Representative immunoblots of tissue lysates from the white adipose tissue (WAT), liver and the hypothalamus of lean and DIO wild-type or HDAC6 KO mice. The western blots were reproduced in at least two cohorts. Quantifications are graphed on the right of western blots (n=20, c P=8.1E-11; n=6, d and e, by two-tailed unpaired t-test) ***P<0.001 as analyzed by two-tailed Student’s t-test. Data are represented as mean ± s.e.m.
Tubastatin Improves Metabolic Function in Diet-Induced Obese Mice
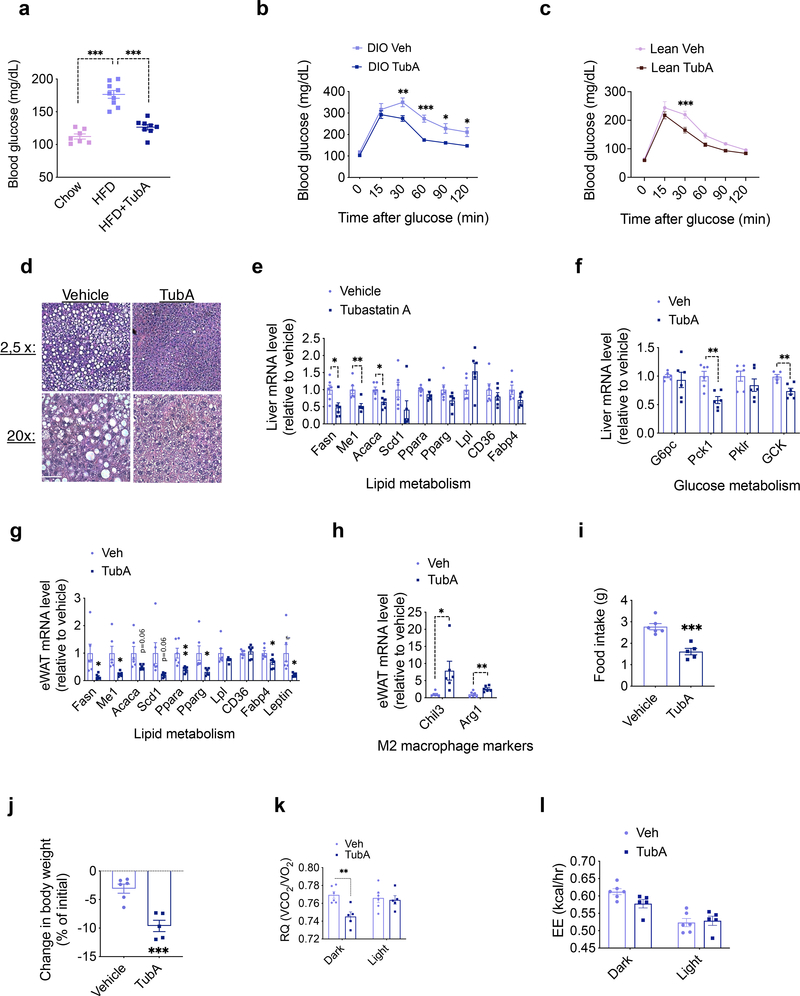
Diet-induced obesity is usually accompanied by ectopic fat accumulation and impaired glucose homeostasis. When the animals were exposed to HFD they displayed significant hyperglycemia, which was reversed by the tubastatin treatment (Fig. 3a). Accordingly, DIO mice treated with tubastatin performed better in the glucose tolerance test (Fig. 3b). Although tubastatin did not alter the body weight or food intake of lean mice (Fig. 1g, h), following six-week drug treatment lean mice also had improved glucose tolerance (Fig. 3c), indicating a fat loss-independent effect of tubastatin on glucose metabolism. Tubastatin-induced weight loss in DIO mice was also accompanied by a significant reduction in hepatic steatosis (Fig. 3d). Accordingly, liver and adipose tissue expression of lipid metabolism genes, and the hepatic expression of genes regulating glucose metabolism showed a significant decrease (Fig. 3e–g). Tubastatin treatment further led to an elevated expression of anti-inflammatory M2 macrophage markers, Chil3 (also called Ym1) and Arg1, in the adipose tissue (Fig. 3h).
Fig. 3. Tubastatin Treatment Improves Metabolic Function in Diet-Induced Obese Mice.
a, 6 hr day-time fasting blood glucose measured 10 weeks after treatments (n=7, chow; n=9 HFD; n=8, HFD+TubA; chow vs. HFD P= 3.1E-8, HFD vs. HFD+TubA P=9.6E-7). b, c, Glucose tolerance tests performed after vehicle or TubA treatment of DIO wild-type mice (n=6 vehicle, n=6 TubA; 30min P=0.0076, 60min P=2.3E-4, 90 min P=0.023, 120min P=0.035) (b) or lean wild-type mice (n=8 vehicle, n=8 TubA; P=5.8E-4) (c). d, Hematoxylin and eosin (H&E) staining of liver sections of DIO mice after one month of vehicle or TubA treatment. Scale bar 50μm e, f, Expression of hepatic lipid (e) and glucose (f) metabolism genes analyzed by RT-qPCR 5 days of vehicle or tubastatin treatment of DIO wild-type mice (n=6; Me1 P=0.0047, Acaca P=0.011, Fasn P=0.021, Pck1 P=0.0024, GCK P=0.0041)). g, h, qPCR analysis of eWAT from DIO mice after 5 days of vehicle or TubA treatments (n= 6; Ppara P=0.0091, Me1 P=0.013, Fabp4 P=0.022, Fasn P=0.026, Leptin P=0.029, Pparg P=0.030, Arg1 P=0.0070, Chil3 P=0.032). i-l, DIO mice were placed into metabolic chambers and treated with vehicle or TubA for 5 consecutive days. i, Average daily food intake (P=3.9E-4), j, change in body weight (P=5.9E-4), k, respiratory quotient (RQ, Dark P=0.041), and l, energy expenditure (EE) during the treatment period (n=6, Veh; n=5, TubA). *P<0.05, **P<0.01, ***P<0.001 as analyzed by two-way analysis of variance (ANOVA) with Sidak’s correction for multiple comparison or two-tailed Student’s t-test. Data are represented as mean ± s.e.m.
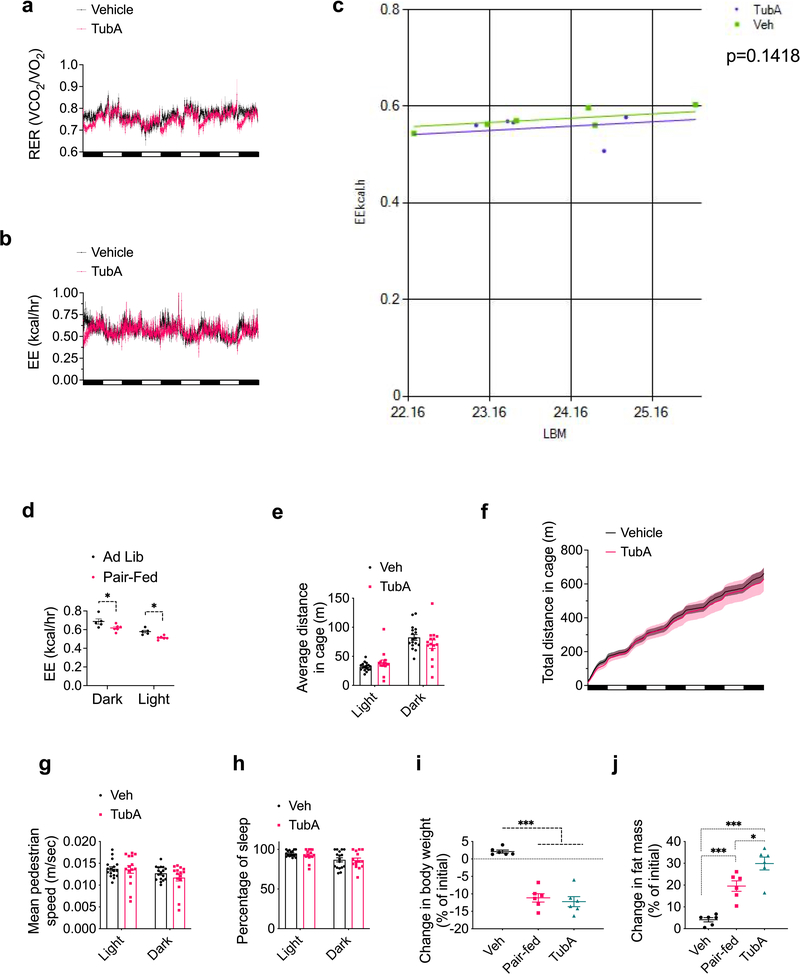
Tubastatin-induced fat loss in DIO mice indicates increased lipolysis coupled to fatty acid oxidation. Therefore, we next placed DIO mice in metabolic chambers and started treating them with vehicle or tubastatin, during which period the food intake (Fig. 3i) and body weight (Fig. 3j) of the drug-treated animals significantly decreased. DIO mice displayed a decrease in their respiratory quotient (RQ) values indicating increased utilization of fatty acids as the preferred energy source (Fig. 3k, Extended Data Fig. 4a). Although tubastatin-treated mice consumed less calories than the vehicle group (Fig. 3i), we did not observe a compensatory decrease in their total energy expenditure (Fig. 3l, Extended Data Fig. 4b, c), whereas the pair-fed mice displayed decreased energy expenditure (Extended Data Fig. 4d). These results suggest that tubastatin-induced metabolic changes differ from food restriction, which normally triggers a decrease in energy expenditure adaptive to decreased caloric intake. Tubastatin-treated mice did not display a change in their overall physical activity or other parameters of locomotion and sleep (Extended Data Fig. 4e–h), suggesting that tubastatin does not induce any locomotor or circadian changes in the animals. Compared to their pair-fed counterparts, tubastatin-treated mice lost more fat mass (Extended Data Fig. 4i, j). These results collectively suggest that tubastatin-induced weight loss is accompanied by significant improvements in the overall metabolic health of the animals.
The Anti-obesity Effect of Tubastatin Requires Leptin Signaling
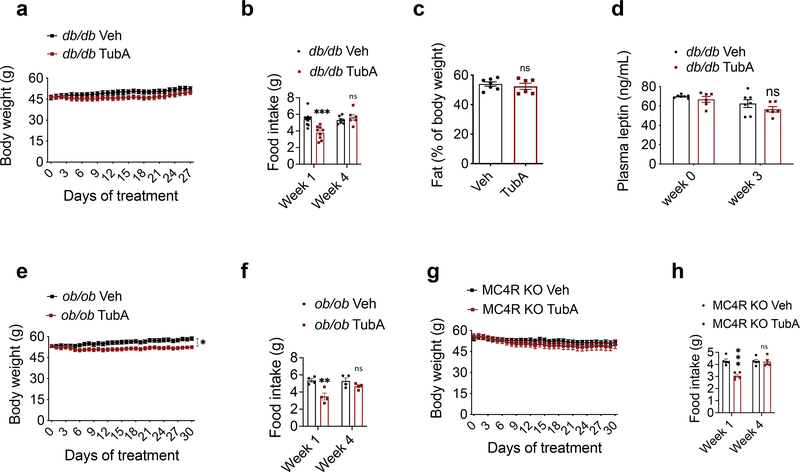
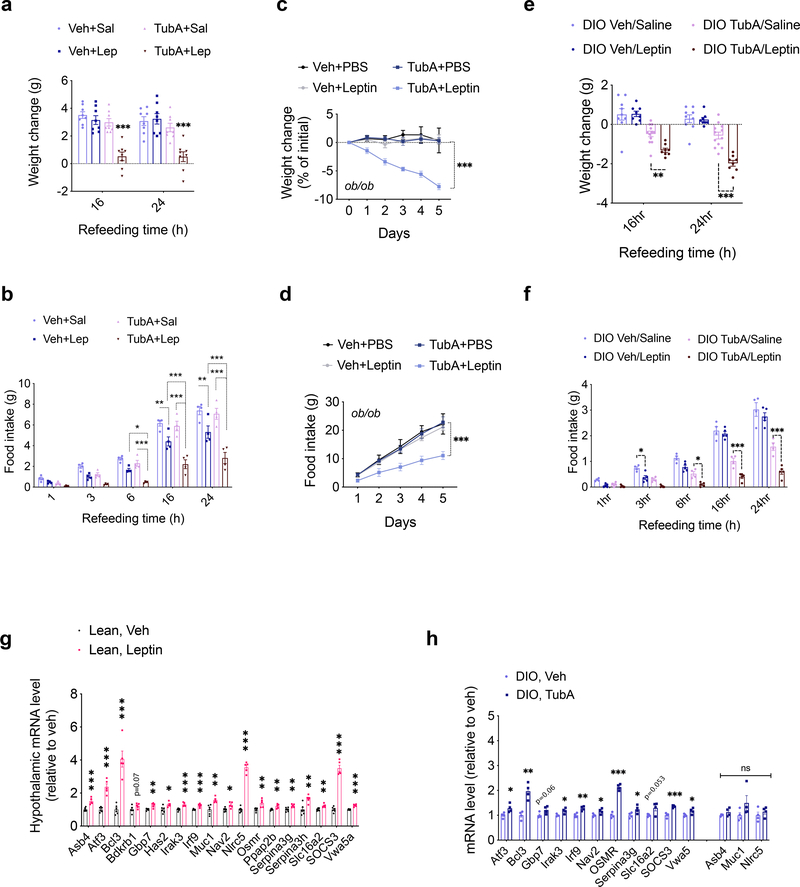
Food intake and body weight in mammals are regulated in part by the adipostatic factor leptin, and its activity on circuits such as the central melanocortin system 38. Mutations in leptin, leptin receptor, or the melanocortin receptor 4 (MC4R) results in hyperphagic obesity in both rodents and humans. Because tubastatin decreases body weight in hyperleptinemic DIO mice but not in normoleptinemic lean mice, we tested if the anti-obesity effect of tubastatin required leptin signaling. Surprisingly, tubastatin failed to decrease the body weight of the db/db mice and had only a transient effect on their food intake during the four-week drug treatment (Fig. 4a, b). The body composition or the plasma leptin concentration of the db/db mice between the vehicle and tubastatin groups did not significantly differ (Fig. 4c, d). Leptin deficient ob/ob mice (Fig. 4e, f), or the MC4R knockout mice (Fig. 4g, h) also displayed resistance to the anti-obesity effect of tubastatin, strongly arguing that activation of the leptin-melanocortin system couples HDAC6 inhibition to weight loss. Therefore, we directly tested whether tubastatin can potentiate leptin action in vivo. To this end, we first treated lean wild-type mice with saline or leptin in combination with vehicle or tubastatin, and measured the response of the animals to a 24 h fast-induced refeeding. We chose a dose of leptin (2.5 mg/kg) that did not significantly change the weight gain when administered alone (Fig. 5a). Tubastatin did not alter the food intake or body weight of the saline-treated mice (Fig. 5a, b), whereas leptin-treated mice ate less than saline group (Fig. 5b). Notably, tubastatin increased the anorectic effect of leptin; mice that were co-treated with leptin and tubastatin ate significantly less and gained significantly less weight than all other groups (Fig. 5a, b), suggesting that tubastatin increases the anorectic effect of exogenous leptin. We conducted a similar experiment in leptin deficient ob/ob mice, which develop hyperphagic obesity. In order to see whether tubastatin can also sensitize these mice to exogenous leptin, we first treated the mice with vehicle or tubastatin for 5 consecutive days. Next, we started treating the mice in each group with either PBS or a low dose of leptin (0.2 mg/kg) while continuing the vehicle or tubastatin treatments. Leptin or tubastatin did not significantly alter the food intake or body weight of ob/ob mice during the course of the experiment when compared to the controls (Veh+PBS) (Fig. 5c, d). However, when leptin was co-administered with tubastatin, the food intake of the mice was significantly suppressed, and their body weight decreased (Fig. 5c, d).
Fig. 4. Tubastatin-induced weight loss requires leptin-melanocortin signaling.
a, b, Body weight curves and food intake of daily vehicle or tubastatin-treated db/db mice (n=13 mice, Veh; n=12 mice, TubA; week 1 food intake P=1.2E-4). c, Body fat percentage of the db/db mice after three-week treatment (n=7, Veh; n=6 mice, TubA). d, Plasma leptin concentration of db/db mice measured by ELISA before and three-week after vehicle (n=7) or tubastatin (n=6) treatments. e, f, Body weight curves and food intake of daily vehicle or tubastatin-treated ob/ob mice (n=8, body weight P=0.015, week 1 of food intake 1.7E-3). g, h, Body weight curves and food intake of vehicle or tubastatin-treated MC4R KO mice (n=7, week 1 of food intake P=5.9E-5). *P<0.05, **P<0.01, ***P<0.001 as analyzed by mixed-effect analysis a, two-way ANOVA (b, d-h) with Sidak’s correction for multiple comparison or student’s t-test (c). Data are represented as mean ± s.e.m.
Fig. 5. Inhibition of HDAC6 leads to increased leptin action.
a, b, Food intake (TubA+Sal vs. TubA+Lep 16h P=5.1E-6, 24h P=8.6E-5) and body weight change (6h Veh+Lep vs. TubA+Lep P=0.044, TubA+Sal vs. TubA+Lep P=7.1E-4; 16h Veh+Lep vs. TubA+Lep P=3.8E-5, TubA+Sal vs. TubA+Lep P=1.1E-10; 24h Veh+Lep vs. TubA+Lep P=3.E-6, TubA+Sal vs. TubA+Lep P=2.1E-11) of 24h-fasted lean wild-type mice upon treatment with vehicle, saline, TubA (25 mg/kg) and/or leptin (2.5 mg/kg) (n= 8 per group). c, d, Cumulative food intake (Veh+Lep vs. TubA+Lep P=2.1E-4, TubA+PBS vs. TubA+Lep P=1.9E-5) and body weight change intake (Veh+Lep vs. TubA+Lep P=2.0E-13, TubA+PBS vs. TubA+Lep P=3.5E-11) of ob/ob mice (n= 4–6) treated with vehicle+saline (n=6 mice), Vehicle+leptin (0.2 mg/kg) (n=6), TubA (25 mg/kg)+saline (n=5) or TubA+leptin (n=6) following 5 day vehicle or tubastatin pre-treatments. *P<0.05, **P<0.01, ***P<0.001 as analyzed by two-way ANOVA (a-c) or mixed-effect analysis (d) with Sidak’s correction or Tukey’s post-hoc test for multiple comparison. e, f, Food intake (3h Veh/Saline vs. Veh/Leptin P=0.048; 16h TubA/Saline vs. TubA/Leptin P=2.0E-4, 24h TubA/Saline vs. TubA/Leptin P=6.9E-9) and body weight change (for TubA/Saline vs. TubA/Leptin: 16h P=6.8E-3, 24h P=1.6E-6) of 24h-fasted DIO wild-type mice upon treatment with vehicle, saline, TubA (25 mg/kg) and/or leptin (5 mg/kg) (n= 8 mice for Veh/Saline, Veh/Leptin, and TubA/Leptin, n=12 mice for TubA/Saline). g, Hypothalamic mRNA expression of the indicated genes in lean wild-type mice 4h after i.p. vehicle (n=6) or leptin (5 mg/kg, n=5) administration (Asb4 P=3.8E-4, Atf3 P=4.1E-5, Bcl3 P=8.9E-5, Bdkrb1 P=0.073, Gbp7 P=3.0E-3, Has2 P=0.023, Irak3 P=7.8E-4, Irf9 P=5.1E-4, Muc1 P=3.3E-3, Nav2 P=0.014, Nlrc5 P=3E-8, Osmr P=6.7E-3, Ppaap2b P=5.9E-3, Serpina3g P=6.7E-3, Serpina3h P=4.2E-3, Slc16a2 P=3E-3, SOCS3 P=2.7E-7, Vwa5a P=3.6E-5). h, Hypothalamic mRNA expression of the leptin-regulated genes in DIO wild-type mice 4h after vehicle or tubastatin administration (n=4; (Atf3 P=0.031, Bcl3 P=1.7E-3, Gbp7 P=0.062, Irak3 P=0.023, Irf9 P=4.2E-3, Nav2 P=0.042, Osmr P=7.5E-6, Serpina3g P=0.047, Slc16a2 P=0.053, SOCS3 P=5.7E-4, Asb4 P=0.18, Muc1 P=0.17, Nlrc5 P=0.41). *P<0.05, **P<0.01, ***P<0.001 as analyzed by Student’s t-test. Data are represented as mean ± s.e.m.
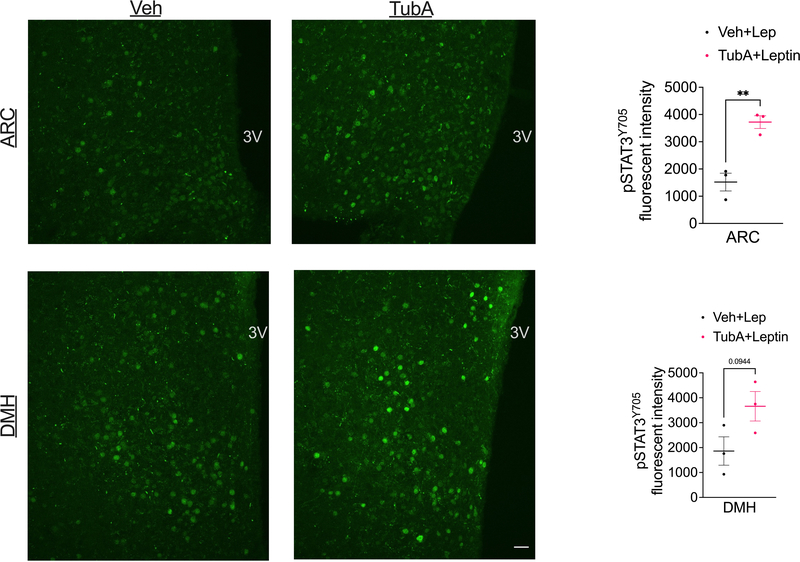
While lean wild-type mice and ob/ob mice have low or no circulating leptin, respectively, DIO mice have significantly increased leptin concentrations but fail to restrict their weight gain due to central leptin resistance 3,4,39,40. Therefore, we tested if tubastatin treated DIO mice would regain their leptin sensitivity. We first tested the response of DIO wild-type mice to exogenous leptin following tubastatin administration. Because tubastatin alone induces weight loss, which could lead to leptin sensitization, we fasted the DIO animals after the first vehicle or tubastatin injections, and followed their food intake and weight gain after leptin treatments. Vehicle treated mice did not show a significant difference in their weight gain or food intake upon leptin treatment (Fig. 5e, f), consistent with diet-induced leptin resistance. Tubastatin-treated DIO mice lost more weight and ate less than other groups when they were co-administered leptin (Fig. 5e, f). Accordingly, the level of leptin-induced STAT3 phosphorylation was higher in the arcuate and dorsomedial hypothalamic nuclei of DIO mice following tubastatin treatment (Extended Data Fig. 5).
Finally, to assess the potentiation of endogenous leptin signaling, we tested if tubastatin would induce leptin-responsive gene expression in hyperleptinemic DIO mice. To this end, we first determined the leptin-regulated transcripts by RNA sequencing after leptin stimulation of the hypothalamic N1-LRb cell line (Supplementary Table S1). We confirmed that leptin also induced the expression of these genes in the hypothalamus of lean mice, suggesting that they are physiological targets of leptin receptor signaling (Fig. 5g). The fold stimulation of the leptin induced transcripts in the hypothalamus was relatively low, probably because of the low percentage of LepRb positive cells in the hypothalamus. We enriched our leptin responsive gene list with the recently published in vivo transcriptome of hypothalamic LepRb cells, identified by TRAP-seq 41. Importantly, tubastatin treatment led to a significant increase in the majority of the leptin responsive genes in the DIO hypothalamus (Fig. 5h). Taken together, these results show that tubastatin reverses the leptin resistance in DIO mice.
HDAC6 regulates body weight in a cell non-autonomous manner
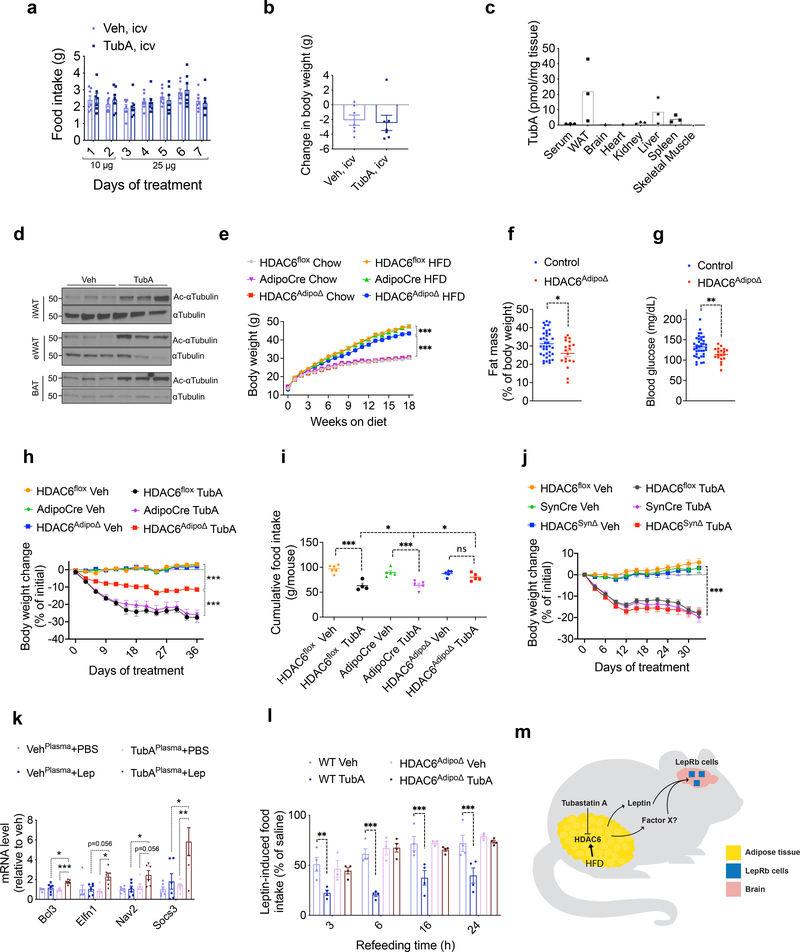
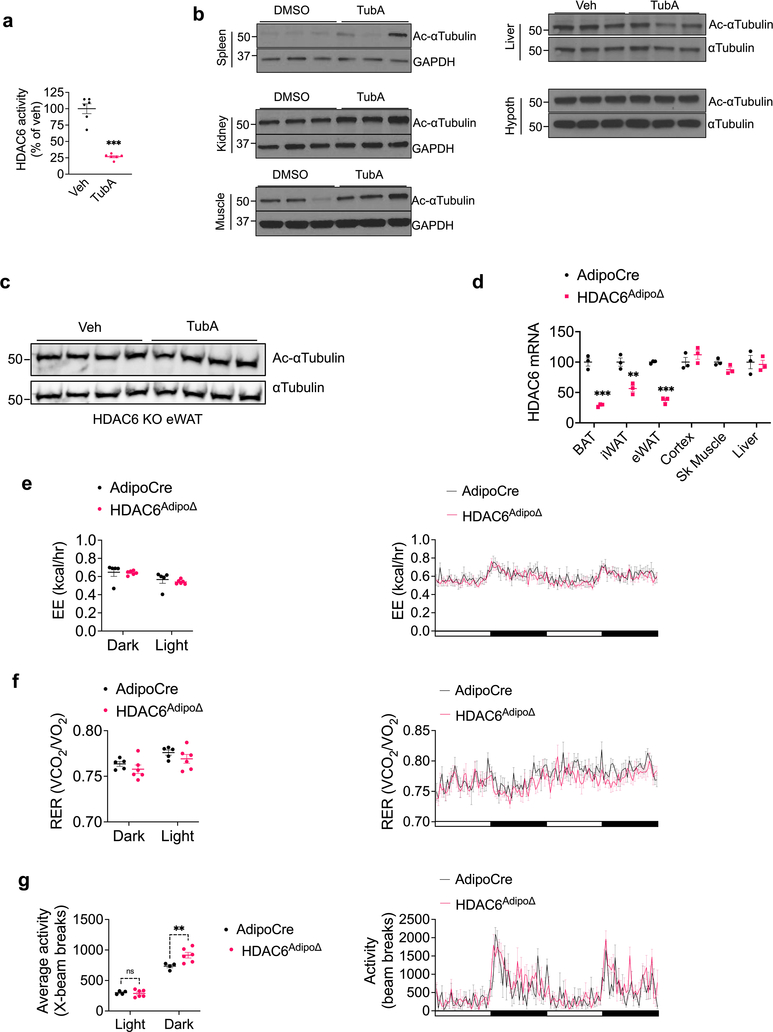
Leptin regulates energy balance predominantly through its central action. Therefore we next set to determine if tubastatin treatment was able to increase leptin sensitivity via acting directly in the CNS. When tubastatin was infused centrally to DIO mice at doses that significantly inhibited the HDAC6 activity (Extended Data Fig. 6a), we did not detect a significant difference in the food intake or body weight of the animals in response to tubastatin (Fig. 6a, b). This result suggests that tubastatin-induced weight loss was not via direct action in the CNS, and argued for a peripheral site for the leptin-sensitizing effects of tubastatin. Following i.p. administration, analysis of the tissue distribution by mass spectrometry indicated that tubastatin accumulated mostly in the adipose tissue and the liver, with marginal levels detected in serum or other tissues (Fig. 6c). Notably, the levels of tubastatin in the brain were very low (Fig. 6c) in agreement with previous reports on its low brain penetrance 28. We also analyzed the level of acetylated α-tubulin in tubastatin-treated DIO mice as a measure of HDAC6 activity. Tubastatin administration significantly increased α-tubulin acetylation, suggesting suppressed HDAC6 deacetylase activity in the inguinal and gonadal white fat (iWAT and eWAT, respectively) and in the brown adipose tissue (BAT) (Fig. 6d). The levels of acetylated α-tubulin in other tissues were either marginally elevated (spleen, kidney, muscle) or unchanged (liver and the hypothalamus) (Extended Data Fig. 6b), suggesting that tubastatin inhibited HDAC6 activity predominantly in the adipose tissue in an HDAC6-dependent manner (Extended Data Fig. 6c).
Fig. 6. HDAC6 regulates body weight in a cell non-autonomous manner.
a, b, Daily food intake and body weight change of DIO wild-type mice treated with the indicated doses of tubastatin (n= 7) or vehicle (DMSO, n= 7) by daily infusion into the lateral ventricle. c, Biodistribution of TubA in indicated tissues and serum collected 2 h post i.p. drug injection (n= 3). WAT is epididymal white adipose tissue. d, Immunoblots of acetylated αTubulin (Ac-αTubulin) and total αTubulin in the inguinal white adipose tissue (iWAT), epididymal WAT (eWAT) and intrascapular brown adipose tissue (BAT) of vehicle or tubastatin-treated wild-type DIO mice. The results were repeated in two independent experiments. e, Growth curves of regular diet-fed control (HDAC6flox (n=20 chow, n=20 HFD and AdipoCre (n=18 chow, n=18 HFD) and HDAC6AdipoΔ mice (n=14 chow, n=19 HFD; HDAC6AdipoΔ HFD vs. AdipoCre HFD P=1.0E-4; HDAC6AdipoΔ HFD vs. HDAC6AdipoΔ Chow P=3.3E-10). f, Body fat composition of control (n=38) and HDAC6AdipoΔ (n=19) mice on HFD (P=0.011, unpaired, two-tailed t-test). g, Day-time fasting (6h) blood glucose of HFD-fed control (n=38) and HDAC6AdipoΔ (n=19) mice (P=0.0047 by two-tailed t-test. *P<0.05, **P<0.01, ***P<0.001 as analyzed by Student’s t-test. h-j, Change in body weight (HDAC6AdipoΔ Veh vs. HDAC6AdipoΔ TubA P=4.9E-10; HDAC6flox Veh vs. HDAC6flox TubA P=2.6E-10, AdipoCre Veh vs. AdipoCre TubA P=2.6E-10, HDAC6AdipoΔ TubA vs. AdipoCre/HDAC6flox TubA P=2.6E-10) and (h) cumulative food intake (HDAC6AdipoΔ Veh vs. HDAC6AdipoΔ TubA P=0.73; HDAC6flox Veh vs. HDAC6flox TubA P=1.3E-5, AdipoCre Veh vs. AdipoCre TubA P=4.2E-4, HDAC6AdipoΔ TubA vs. AdipoCre/HDAC6flox TubA P=0.04) (i) of HDAC6AdipoΔ mice (n=10 mice. HDAC6flox Veh; n=9 mice HDAC6 flox TubA; n=9 mice, AdipoCre Veh; n=9 mice, AdipoCre TubA;;n=8 mice, HDAC6AdipoΔ Veh; n=10 mice, HDAC6AdipoΔ TubA) (h), and weight change of HDAC6SynΔ mice (n=10 mice, HDAC6 flox Veh; n=10 mice, HDAC6flox TubA; n=8 mice, SynCre Veh; n=7 mice, SynCre TubA, n=8 mice, HDAC6SynΔ Veh, n=8 mice, HDAC6SynΔ TubA; for all genotypes Veh vs TubA P=2.7E-10) (j) and their respective controls during daily vehicle or tubastatin treatments. k, Expression of the leptin responsive transcripts in N1-LRb cells pre-treated with plasma from vehicle or TubA-treated ob/ob mice for 2h, followed by leptin (2 ng/mL) stimulation for 4h (n=6; TubAPlasma+PBS vs. TubAPlasma+Lep: Bcl3 P=9.4E-4, Elfn1 P=0.023, Nav2 P=0.056, Socs3 P=0.0052). l, 24hr fasted lean wild-type or HDAC6AdipoΔ mice were treated with leptin or saline alone or in combination with TubA. The food intake during refeeding were plotted as percent intake of the saline groups (n=4 for all groups except HDAC6AdipoΔ Veh, where n=3. wt Veh vs. wt TubA: 3h P=2.2E-3, 6h P=1.3E-5, 16h P=2.2E-4, 24h P=5.0E-4; wt TubA vs. HDAC6AdipoΔ Tub: 3h P=0.025, 6h P=7.3E-7, 16h P=2.8E-3, 24h P=2.6E-4). See also Extended Data Fig. 9f, g. m, Illustration summary: HFD induces and tubastatin suppresses HDAC6 activity in the adipose tissue. Inhibition of HDAC6 activity leads to central leptin sensitization through a potentially novel adipokine (Factor X).
*P<0.05, **P<0.01, ***P<0.001 as analyzed by mixed-effect analysis (e-i) or one-way (j) or two-way ANOVA (k, l) with Tukey’s post-hoc test for multiple comparison. Data are represented as mean ± s.e.m.
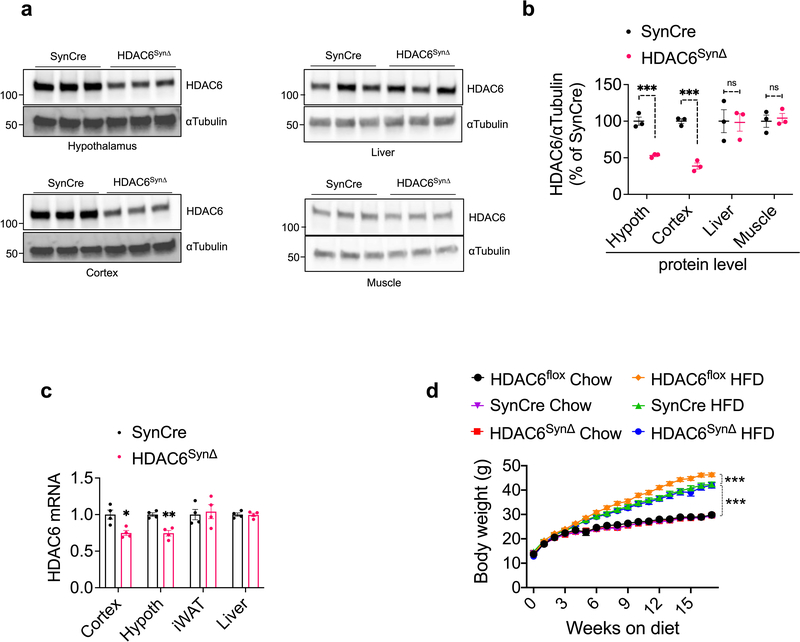
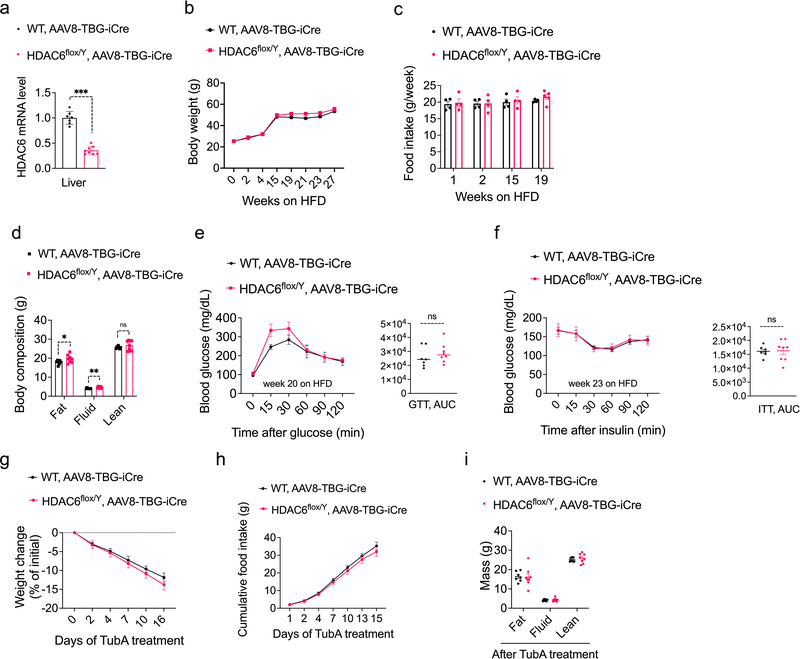
In order to probe the site of action of tubastatin using genetic methods, we first crossed HDAC6-floxed mice42 with adiponectin-Cre (Adipo-Cre) or synapsin-Cre (SynCre) animals to generate fat specific (HDAC6AdipoΔ) or neuronal HDAC6 knockout animals (HDAC6SynΔ), respectively (Extended Data Fig. 6 and 7). HDAC6AdipoΔ mice had normal body weights on regular diet (Fig. 6e). The energy expenditure and respiratory quotient of the HDAC6AdipoΔ mice on HFD were comparable to the control group, but the KO mice displayed increased physical activity during the dark cycle (Extended Data Fig. 6e–g). DIO HDAC6AdipoΔ mice gained less weight (Fig. 6e), accumulated significantly less fat mass than control mice (Fig. 6f) and resisted diet-induced hyperglycemia (Fig. 6g), essentially mimicking the phenotypes of tubastatin-treated mice. Accordingly, the anti-obesity effect of tubastatin was significantly compromised in HDAC6AdipoΔ animals (Fig. 6h). Following five weeks of tubastatin treatment, the control mice (HDAC6flox/Y and Adipo-Cre+/− mice) lost 27.5 ± 2.8% and 25.9 ± 2.7% of their initial body weights, respectively, whereas the HDAC6AdipoΔ mice lost only 11.5 ± 1.1% weight (Fig. 6h). Tubastatin treatment significantly decreased the food intake of the control mice but had no significant effect on the cumulative food intake of HDAC6AdipoΔ mice (Fig. 6i). These effects were restricted to mice with fat specific ablation of HDAC6: HDAC6SynΔ mice had a normal body weight on standard or high fat diet (Extended Data Fig. 7d), and there was no difference in the effect of tubastatin on HDAC6SynΔ mice vs. their respective controls (Fig. 6j). We further deleted HDAC6 in the livers of adult HDAC6flox/Y mice by tail injection of AAV-Cre (Extended Data Fig. 8), and these mice responded to tubastatin in a comparable manner to their control counterparts (Extended Data Fig. 8g, h), collectively suggesting that neuronal and hepatic HDAC6 are not required for tubastatin-induced weight loss. Notably, liver specific deletion of HDAC6 led to higher fat accumulation on HFD (Extended Data Fig. 8d), a phenotype that is the opposite of HDAC6AdipoΔ mice, which may in part explain the normal adiposity of global HDAC6 KO mice (Extended Data Fig. 1i, j).
To further delineate the tubastatin-induced transcriptional changes, we conducted RNA sequencing using the WAT from vehicle or tubastatin-treated wild type and HDAC6 KO DIO mice as well as the WAT from AdipoCre versus HDAC6AdipoΔ mice (Supplementary Tables S2–S7). There were 739 differentially expressed genes in tubastatin-treated wild-type DIO eWAT, whereas only 57 of these genes (<8%) were altered in the HDAC6 KO mice upon tubastatin treatment. Among these 57 transcripts, the expression of 28 genes were also altered in either HDAC6AdipoΔ mice or global HDAC6 KOs when compared to the controls, suggesting that tubastatin alters the expression of these genes in an HDAC6-dependent and independent manner. Collectively, we conclude that the non-specific effect of tubastatin on the transcriptome of adipose tissue was marginal. Furthermore, the ablation of HDAC6 did not appear to induce a compensatory response from other HDAC family members; the only exception being an approximately 50% decrease in HDAC9 expression in eWAT of HDAC6 KO mice (Supplementary Table S5). We did not observe a significant change in the expression of any HDACs in HDAC6AdipoΔ mice (Supplementary Table S4), and tubastatin treatment did not alter the expression of other HDACs in wild-type DIO mice (Supplementary Table S2, S3).
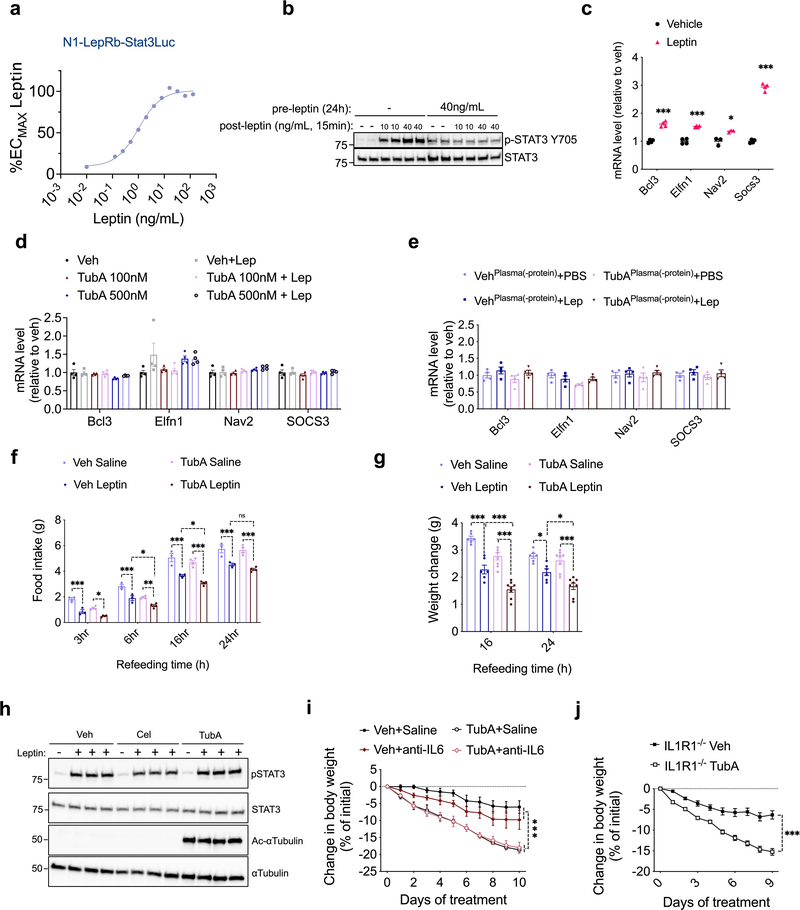
Our results suggest that tubastatin-induced leptin sensitization and weight loss works in a cell non-autonomous manner, possibly through a systemic factor. Thus, we devised an in vitro leptin-sensitization experiment. Using the hypothalamic N1-LRb cells, we first confirmed that this cell line responded to leptin in a dose dependent manner (Extended Data Fig. 9a), and we were able to recapitulate leptin-induced leptin resistance by pre-incubating the cells with leptin (Extended Data Fig. 9b). Using a sub-maximal leptin dose, we tested whether the plasma from tubastatin-treated animals could increase the expression of leptin-responsive genes (Extended Data Fig. 9c) in N1-LRb cells in a leptin-dependent manner. To avoid the potential confounding effects of endogenous leptin, we used plasma from vehicle or tubastatin-treated ob/ob mice. Our results showed that the plasma from tubastatin-treated mice significantly potentiated leptin action (Fig. 6k). The leptin-sensitizing factor in the plasma was not tubastatin itself as dose response studies with tubastatin, covering the range of the drug detected in plasma, failed to increase leptin action (Extended Data Fig. 9d). This putative factor had a protein nature, as treatment with proteinase K followed by heat neutralized the leptin sensitizing factor in the plasma samples (Extended Data Fig. 9e). Notably, lean HDAC6AdipoΔ mice lost their response to the leptin sensitizing effect of tubastatin (Fig. 6l, and Extended Data Fig. 9f, g), suggesting that the tubastatin-induced systemic factor was fat-derived (Fig. 6m).
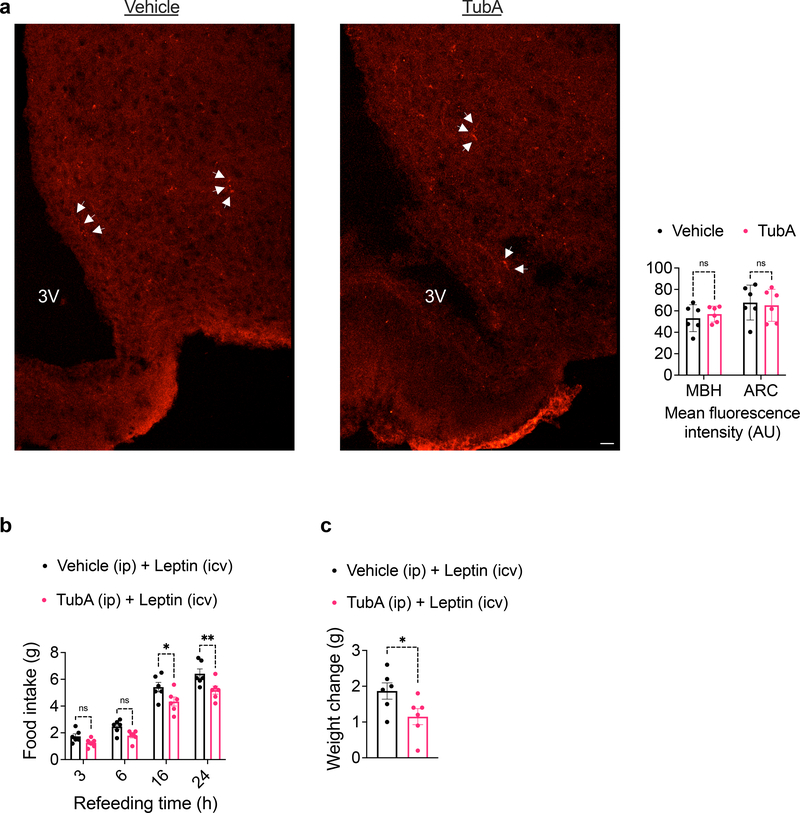
Amylin and GLP-1 potentiate the anorectic effect of leptin, at least in part, by IL1R1 and interleukin 6 (IL6) signaling 43,44. A pentacyclic triterpenoid called celastrol was also proposed to induce leptin sensitization and weight loss through an unknown mechanism of action that requires IL1R1 45. Furthermore, IL6 was proposed to act as a leptin sensitizer 44,46. We found tubastatin did not directly potentiate leptin signaling in N1-LRb cells (Extended Data Fig. 9h). Furthermore, IL6 neutralizing antibodies or genetic ablation of IL1R1 did not block tubastatin-induced weight loss in obese mice (Extended Data Fig. 9i, j). Tubastatin did not increase the transport of fluorescently labelled leptin (Cy3-leptin) across the blood-brain barrier (Fig. 7a), and the drug was effective in increasing the potency of leptin when leptin was administered centrally (Fig. 7b, c). Collectively, these findings suggest a dual mode-of-action for tubastatin-induced weight loss, in which peripheral HDAC6 inhibition leads to a potentially unidentified systemic factor that in turn acts in the CNS to induce leptin action (Fig. 6m).
Fig. 7. Tubastatin does not alter blood-brain barrier permeability of leptin.
Wild-type mice were treated with vehicle or tubastatin (i.p.) followed by iv. Cy3-leptin. Mice were subsequently perfused and sections were prepared for imaging. a, Confocal images of Cy3 fluorescence (left) and the quantification of the fluorescence intensity (right) in the mediobasal hypothalamus (MBH) and the arcuate nucleus alone (ARC) (n=6). Arrowheads indicate Cy3-leptin. Scale bar: 20μm. b, c, Wild-type lean mice were implanted with a cannula in the lateral ventricle. Following 24-hr fasting, mice were treated with i.p. vehicle (n=6) or tubastatin (25mg/kg, n=6) and icv leptin (0.5μg per mouse). Food intake (16h P=0.027, 24h P=9.5E-3 by two-way ANOVA with Sidak correction (b) and 24hr body weight change (P=0.049 by unpaired two-tailed t-test) (c) was recorded. *P<0.05, **P<0.01, ***P<0.001. Data are represented as mean ± s.e.m.
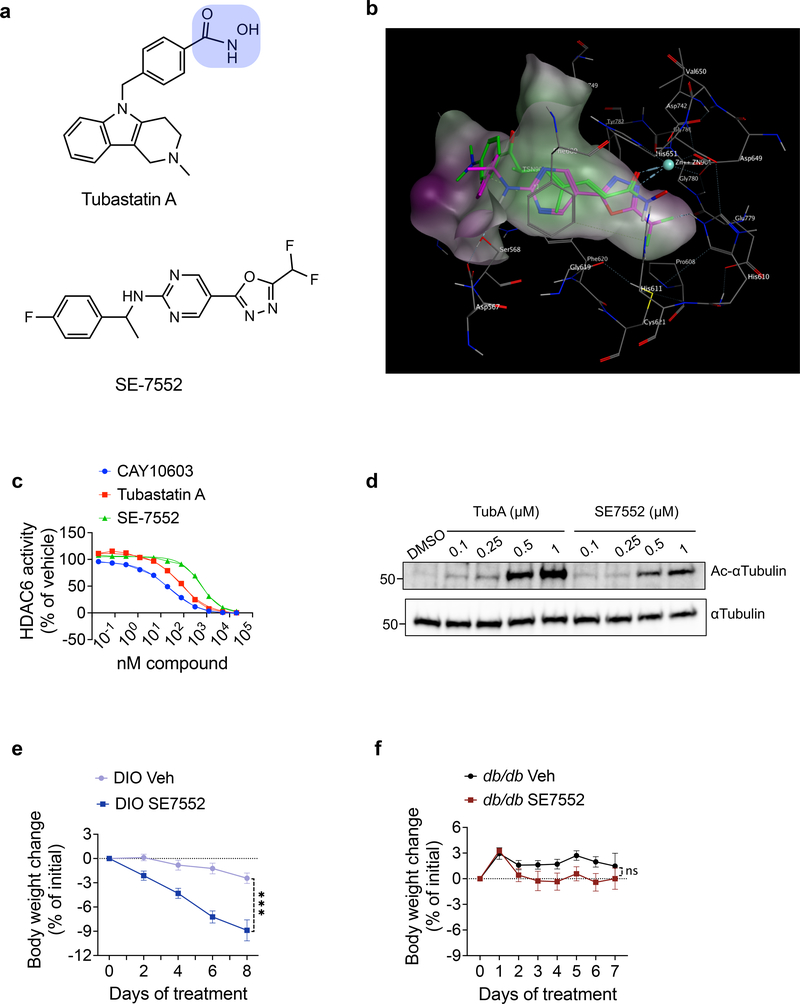
HDAC6 is a zinc dependent enzyme, and potent HDAC6-inhibitors including tubastatin contain the hydroxamic acid residue as the zinc chelating moiety (Fig. 8a). While HDAC6-specific inhibitors were shown to be safer than pan-HDAC inhibitors 47,48, the potential problems associated with the hydroxamates have hindered their clinical use 49. We identified that a non-hydroxamate HDAC6-specific inhibitor, which has about 1000-fold selectivity versus all other known HDAC isozymes 50 and is structurally unrelated to tubastatin (Fig. 8a–d) effectively reduces obesity (Fig. 8e), serving as the proof-of-principle study for the potential development of non-hydroxamate HDAC6 inhibitors as safe anti-obesity therapeutics. Notably, this compound was also ineffective at inducing weight loss in db/db mice (Fig. 8f), further supporting our conclusion that HDAC6 inhibition-induced weight loss requires intact leptin signaling.
Fig. 8. A non-hydroxamate HDAC6-specific inhibitor reverses diet-induced obesity.
a, Chemical structures of tubastatin (top) and SE-7552 (bottom). The hydroxamate moiety of tubastatin is highlighted in blue. b, Docking of SE-7552 into the inhibitor binding site of HDAC6. The A chain of the 5edu.pdb was used for docking. The Trichostatin A in the 5edu.pdb is shown in green and the docked pose of the SE-7552 in magenta. One nitrogen of oxadiazole in SE-7552 is binding to Zinc as the carbonyl of hydroxamate in Trichostatin A, one of the fluorine in the difluoromethyl group is interacting with His610, the pyrimidine ring is sandwiched between Phe680 at the top and Phe620 at the bottom making pi-pi interactions with them. The amide is hydrogen bonding with Ser568, and the fluorobenzene ring is also interacting with Phe620 by T-shaped pi-pi stacking. The docking experiment was carried out using MOE software 86. The same results were obtained by gold docking program 87. c, Dose response curves of HDAC6 inhibition for the HDAC6-specific inhibitors CAY10603, tubastatin, and SE-7552 (n=2 per dose per compound, n=6 for no compound). d, Immunoblots from lysates of N1 cells treated with the indicated compounds for 24 hr. e, f, Body weight change of SE-7552 (50 mg/kg, i.p., n=12) treated wild-type DIO mice (n=13, P=3E-10 by mixed-effect analysis with Sidak correction) (e) or db/db mice (n=6) (f). *P<0.05, **P<0.01, ***P<0.001. Data are represented as mean ± s.e.m.
Discussion
In this study we demonstrate that peripheral HDAC6 inhibition, predominantly in the adipose tissue, leads to central leptin sensitization and consequent weight loss. Suppression of food intake appears to be the major driver of reduced obesity, and several lines of evidence indicate that tubastatin-induced weight loss involves improved leptin action. While tubastatin-treated DIO mice lose approximately half of their fat mass, this response is significantly compromised in db/db mice, which lack leptin receptor signaling, leptin deficient ob/ob mice, and the MC4R KO mice. While tubastatin does not affect the body weight or food intake of lean wild-type mice, it potentiates the anorectic effect of exogenous leptin, and a similar response is observed in leptin deficient ob/ob animals. Following an acute tubastatin administration, DIO mice regain their response to leptin. Furthermore, administration of tubastatin to hyperleptinemic DIO mice induces the expression of leptin-responsive genes in the hypothalamus. These results collectively suggest that the tubastatin-induced effect on energy homeostasis requires hyperleptinemia and depends on intact leptin receptor signaling.
Tubastatin does not alter the energy balance in lean mice probably due to their relatively low circulating leptin levels. However, long term administration of tubastatin to these mice leads to a significant improvement in their glucose homeostasis. Whether this response is leptin dependent or is a cell autonomous consequence of HDAC6 inhibition, potentially in the liver, is currently unknown. HDAC6 deficiency, in the global HDAC6 KO mice, was previously shown to improve the glucocorticoid-induced systemic glucose intolerance 51. In addition, leptin has anti-diabetic effects through its central action 52, suggesting that the tubastatin-induced improvement in glucose metabolism might work through leptin-dependent and independent pathways. Leptin acts as a peripheral signal to regulate fasting-induced changes in the central neuro-endocrine axes 53. In our study we tested the effect of tubastatin on the regulation of energy balance by leptin. It is worth investigating whether this synergy involves other neuroendocrine functions of leptin and whether the tubastatin-induced potentiation of leptin’s anorectic effect extends to other endocrine regulators of feeding.
Earlier studies conducted using a broad spectrum HDAC inhibitor butyrate, which inhibits the classical HDACs except HDAC6 and HDAC10 54, showed that while butyrate did not induce weight loss in obese mice following peripheral administration 55, its central action increased food intake and weight gain 56. Furthermore, class I HDAC inhibitor MS275 does not alter food intake in mice 57,58, further supporting our conclusion that the metabolic improvements observed with tubastatin treatment are restricted to HDAC6. Peripherally restricted cannabinoid inverse agonists increase leptin excretion through kidneys and decrease leptin expression from the adipose tissue to resensitize DIO mice to their endogenous leptin 59. Furthermore, partial blockade of the diet-induced hyperleptinemia also leads to leptin sensitization 60. Decreased leptinemia is unlikely to mediate the tubastatin-induced leptin sensitization as plasma leptin levels of tubastatin-treated db/db mice were not significantly altered, suggesting that HDAC6 inhibition does not decrease plasma leptin prior to weight loss. In addition, plasma from tubastatin-treated ob/ob mice, which lack leptin, can induce leptin-responsive gene expression only in the presence of leptin itself, strongly arguing that HDAC6 inhibition leads to an unknown systemic signal that synergizes with leptin. Accordingly, the adipose tissue transcriptome of DIO mice indicates changes in the expression of numerous secreted proteins following tubastatin treatment (Supplementary Table S2, S3). This nonautonomous mechanism also distinguishes HDAC6 inhibition-induced leptin sensitization from some of the other leptin sensitizers that were proposed to act centrally to relieve ER stress 4. While we could not reproduce these findings (Extended Data Fig. 10d, e), and this mechanism of action was also challenged by other groups 61,62, how central ER stress per se is mechanistically coupled to leptin action is still not clear 63. Tubastatin does not have an anti-obesity effect when infused centrally to wild-type DIO mice. Furthermore, neuronal HDAC6 or global IL1R1 expressions are dispensable for tubastatin-induced weight loss, thus distinguishing the tubastatin-induced restoration of leptin action as a pathway distinct from other leptin sensitizers 4.
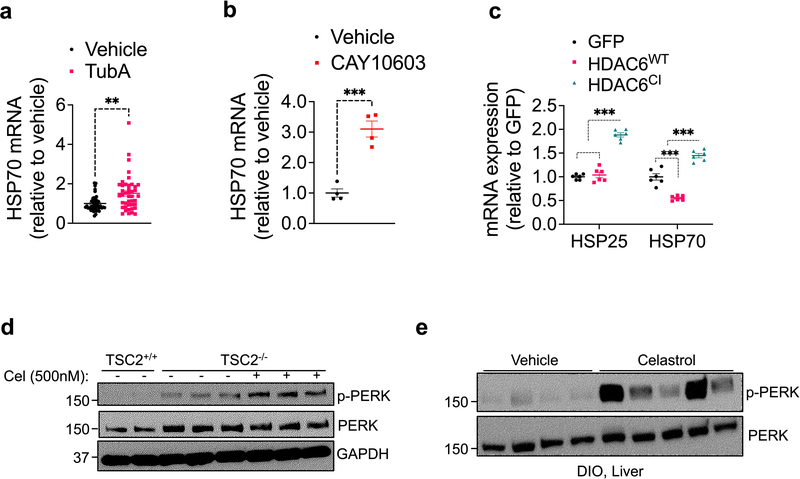
Tubastatin administration or fat-specific HDAC6 deletion attenuates HFD-induced adiposity while global HDAC6 KO mice gain weight normally. While it is possible that embryonic deletion of HDAC6 might be developmentally compensated, it is worth noting that HDAC6 deletion in the fat versus the liver protected or augmented, respectively, the response to HFD. Thus, the tissue-specific pharmacodynamic results shown here, such as the ability of the tubastatin to inhibit HDAC6 predominantly in fat but not liver likely accounts for the different effects on DIO seen following tubastatin administration versus HDAC6 knockout. In this regard, for example, many well-tolerated drugs target genes that are lethal when embryonically ablated 64, and similar discrepancies have been observed for other factors including NRF2, where both its genetic deletion and pharmacological activation protects from diet-induced obesity 65–68. It is also worth noting that HDAC6 has deacetylase-independent functions, including its E3 ligase and the ubiquitin binding activities, which are retained under tubastatin treatment 69 but not in global KO mice. Tubastatin-mediated inhibition of HDAC6 was shown to enhance its microtubule binding capacity 69, and certain proteostatic steps regulated by HDAC6, including the heat shock response, require its ubiquitin binding domain and are not entirely dependent on its catalytic activity 70–72. Accordingly, direct treatment of isolated fat explants with tubastatin or CAY10603 lead to the induction of heat shock response which was mimicked by only the catalytically-inactive HDAC6 (HDAC6CI) but not the wild type protein (Extended Data Fig. 10a–c). While it is unclear at this stage whether such a stress response is the driving factor leading to the metabolic improvements we observed in this study, it is possible that HDAC6 inhibitors could induce a gain-of-function in the deacetylase-independent-activities of the protein that might in turn be important for protection from obesity.
A former study characterized the role of HDAC6 in adipose tissue and reported that fat-specific ablation of HDAC6 leads to excess weight gain in mice independent of the diet they consume when compared to HDAC6flox mice 73. Furthermore, the same study reported significantly decreased HDAC6 protein level in the gonadal fat of diet-induced obese mice. In contrast, our results obtained from a relatively large cohort of mice (n=14–20 mice per genotype, and reproduced in two separate cohorts) including both HDAC6flox and Adipo-Cre groups as the controls indicate that fat-specific deletion of HDAC6 protects from obesity. Importantly, the anti-obesity effect of tubastatin is significantly compromised upon fat-specific ablation of HDAC6 expression. We further tested the nutrient dependent regulation of HDAC6 expression in various metabolic tissues in lean and DIO mice concluding that HDAC6 mRNA expression did not show major changes in various tissues. Notably, the HDAC6 protein level was similar in the gonadal fat and liver of lean versus DIO mice. The reason for this apparent discrepancy between our results and this former study 73 is not clear. However, HDAC6 inhibition was suggested to inhibit adipogenesis 74, and HDAC6 acts as a negative regulator of adipose tissue insulin receptor signaling to regulate systemic glucose homeostasis 75. Our results also suggest an improvement of the metabolic syndrome by HDAC6 inhibition.
These findings collectively suggest that peripheral inhibition of HDAC6 deacetylase activity results in weight loss and improves glucose homeostasis in large part through increased leptin sensitivity in obese animals. It is worth noting that tubastatin induces a transient but significant reduction in the food intake of db/db, MC4R, and ob/ob mice, however in the presence of hyperleptinemia this effect is prolonged and translates into significant weight loss in wild-type DIO animals. This phenotype is reminiscent of the preservation of body weight set point observed in forced-feeding studies 76,77, where the hypophagia following cessation of forced-feeding is dependent on the functional leptin receptor signaling and is mediated by a circulating and potentially adipose-derived catabolic signal. Such a factor that alone is moderately hypophagic would have an augmented anti-obesity action in the presence of an intact leptin signaling 78. While the details of the communication between peripheral HDAC6 activity and central leptin sensitivity is not clear, studies conducted in a range of species from C. elegans to mammals suggest the presence of signaling molecules that originate in response to perturbations in proteostasis to regulate energy metabolism and longevity 79,80, and that loss of HDAC6 in C. elegans leads to extended life span 81. Future studies will be needed to uncover the potential link between the role of HDAC6 in proteostasis and the regulation of energy metabolism.
Unlike other HDACs, inhibition of HDAC6 activity does not cause toxicity or apparent adverse effects 47,48, and treatment with HDAC6 inhibitors protects against muscle atrophy and neurodegeneration 29,35, and confers cardioprotection 35,82. In light of our findings presented here, potent and safe HDAC6-specific inhibitors could represent a pharmacological approach for the treatment of metabolic disorders including obesity.
Methods
Animals
The Institutional Animal Care and Use Committees (IACUC) at the University of Michigan, Vanderbilt University, and University of Colorado Anschutz Medical Campus approved the experimental protocols and euthanasia procedures used in this study. Animals were housed at a 12 hours dark/light cycle, temperature and humidity controlled rooms (72°F/22.2°C, and relative humidity at 30–70%). Mice were purchased from the Jackson Laboratory (000664 - C57BL/6J; 000632 - B6.Cg-Lep<ob>/J -; 000697 - B6.BKS(D)-Lepr db /J -; 003245 - B6.129S7-Il1r1<tm1Imx>/J -; 006414 - B6;129S4-Mc4r<tm1Lowl>/J -; 028020 - B6.FVB-Tg(Adipoq-cre)1Evdr/J -; 003966 - B6.Cg-Tg(Syn1-cre)671Jxm/J), except the HDACflox mice42 (donated by Dr. Venetia Zachariou, Icahn School of Medicine at Mount Sinai) and the HDAC6 KO mice35,83. HDACflox mice were crossed to Adipo-Cre or Syn1-Cre mice (described below) to generate the tissue specific knockout mice. Adipo-Cre+/−, Syn-Cre+/−, HDACflox mice were used as the control groups. Combined data from the Adipo-Cre+/− and HDACflox mice were listed as the control group as the results of these groups were not statistically different for the reported parameters. Generation of the HDAC6 KO mice was described in35,83. Mice were fed either regular chow (5LOD from Lab Diet) or high fat diet (60 kcal% fat, Research Diets, Cat#: D12492) and had free access to food and water unless specified. Lean mice were 8–12 week old at the beginning of the experiments. DIO models were developed by exposing mice to high fat diet at 4–5 week-of-age for 16–20 weeks unless stated otherwise in the experiments described. Only male mice were used expect for the studies described in Extended Data Fig 1 g, h. Body composition was analyzed with Bruker’s minispec LF50 Body Composition Analyzer (Bruker) when indicated. IL6 neutralization was done by intraperitoneal injection of the rat monoclonal InVivoMAb anti-mouse IL-6 antibody from Bio X Cell (Cat# BE0046).
Leptin-Food Intake Studies
Lean wild-type mice were fasted for 25 hr. Tubastatin was injected at 0, 16 and 24 hr of fasting. Leptin was dissolved in sterile PBS and intraperitoneally injected 30min prior to start of refeeding. Food intake was measured at 1, 3, 6, 16, 24 hr, body weight was measured 16 and 24 hr after refeeding. ob/ob mice were pretreated with tubastatin or vehicle for 5 consecutive days, and then continued to receive vehicle or tubastatin with either PBS or leptin. Injections were done within one hour prior to start of dark cycle.
Cell Culture
HEK293 and 293T cells were cultured in high glucose DMEM (GIBCO) supplemented with 10% FBS and penicillin/streptomycin. Tubastatin and BRD3067 were dissolved in DMSO and added to the culture medium for 24hr. Embryonic Mouse Hypothalamus Cell Line N1 (mHypoE-N1) was obtained from Cedarlane Labs (Cat#: CLU101).
Drugs and reagents
Tubastatin A HCl (tubastatin), CAY10603, Ricolinostat were purchased from different vendors (APExBIO, Selleckchem, AdooQ Bioscience, and Chemboxer). Tubastatin was dissolved in a solution of 50% PEG-400, 30% PBS, 20% DMSO or only DMSO for animal studies. CAY10603 and ricolinostat were dissolved in DMSO. Recombinant mouse leptin was from A. F. Parlow (National Hormone and Peptide Program, Torrance, CA). HDAC6 activity assay kit was from BioVision (Milpitas, CA, Cat #: K466); the assay was run according to the manufacturer’s instructions.
Drug treatments
Tubastatin, CAY10603 or ricolinostat were administered within 1 hr before dark cycle by daily intraperitoneal injections unless specified otherwise. For intraperitoneal (i.p.) injections, drugs or vehicle were injected at 25 μL volumes per animal. For lateral ventricle infusions tubastatin was dissolved in DMSO as vehicle, and was infused in 500nL at indicated doses once a day prior to dark cycle.
Glucose tolerance test (GTT)
For GTT, mice were fasted overnight. In the morning, mice received 1 g/kg dextrose intraperitoneally. Blood glucose was measured from the tail vein at 0, 15, 30, 60, 90, and 120 min after glucose injections.
Leptin and Insulin ELISAs
Leptin ELISA kit was from Crystal Chem (Cat# 90030). Leptin concentration was measured using mouse plasma according to manufacturer’s instructions. Blood was collected in heparinized vials, and centrifuged for 60min at 3000rpm at 4°C. Plasma was collected and stored in −80 °C until further processing.
Lateral Ventricle Cannulation
Under isoflurane anesthesia, mice were stereotaxically implanted with a stainless steel cannula (Plastic One, VA) into their right lateral ventricle at the following coordinates with respect to bregma: Lateral: 1.00 mm; anteroposterior: −0.460 mm; ventral: −2.20 mm. Positive cannulation was verified by measurement of water intake in response to icv injection of Angiotensin II (Sigma, MO).
Western Blot
For western blot analysis, cells or tissues were lysed in RIPA buffer (50mM TRIS pH:7.50, 25mM NaF, 100mM NaCl, 5mM EDTA, 0.1% SDS, 1% TritonX-100) supplemented with protease and phosphatase inhibitors, 20mM nicotinamide and 20μM vorinostat. Equal amounts of total-lysates were separated on 4–15% SDS-PAGE gels (Bio-Rad), transferred to PVDF membranes (Millipore), and probed with indicated antibodies. Blots were washed with PBS/T (0.1% Tween-20 in PBS) and either developed (for GAPDH-HRP) or probed with HRP-conjugated secondary antibodies (Cell Signaling, Cat# 7074 and 7076), and developed. Rabbit monoclonal anti-HDAC6 (Cat# 7612), Rabbit monoclonal anti-Acetyl-α-Tubulin (Cat# 5335), Rabbit polyclonal anti-α-Tubulin (Cat# 2144), Rabbit monoclonal anti-GAPDH HRP conjugate (Cat# 8884) were from Cell Signaling (Danvers, MA). Rabbit monoclonal anti-HDAC6 (Cat# 7612), Rabbit monoclonal anti-Acetyl-α-Tubulin (Cat# 5335) antibodies were validated using wild-type and HDAC6 KO mouse tissues as in Extended Data Fig. 2b, c. Primary antibodies were used at 1:1000 dilution with anti-Acetyl-α-Tubulin antibody used at 1:10,000. Secondary HRP-conjugated antibodies were used at 1:10,000 dilution. Western blot images were quantified using Adobe Photoshop SC6 and ImageJ version 1.51.
Immunohistofluorescent staining and microscopy
Wild type DIO mice were treated with i.p. vehicle and leptin or i.p. tubastatin and leptin. Mice were perfused by cold 10% formalin 40 min post-leptin administration. The brain was removed and tissue blocks containing the hypothalamus were dissected and postfixed in 10% formalin for 24 hours and transferred to 30% sucrose in 0.1M phosphate buffer for cryoprotection. Coronal sections were cut (30 microns) using a freezing microtome (Leica SM2000R) and stored at −20°C in a cryopreservative solution (30% ethylene glycol, 1% polyvinylpyrrolidone, 30% sucrose in sodium phosphate buffer) until further processing. Recombinant mouse leptin - Cy3 Labeled (Cat #: FC3–003-13) was purchased from Phoenix Pharmaceuticals (Burlingame, CA). Wild type DIO mice were treated with i.p. vehicle or tubastatin and co-treated with 0.5 nmol leptin intravenously (iv.). The animals were perfused as described above and 30μm hypothalamic sections covering the median eminence were mounted onto Superfrost slides (Fisher Scientific), coverslipped with ProLong Gold with DAPI mounting medium (catalog #: P36931; ThermoFisher) and stored at 4°C until analysis.
All steps were performed at room temperature, with gentle agitation of free-floating sections except for primary antibody incubation. Tissue sections were washed with phosphate buffered saline (PBS, pH 7.35, 0.1M PB containing 0.9% NaCl) between steps. Sections were treated with1% sodium hydroxide (NaOH; catalog #: SIG/221465; Sigma Aldrich) and 1% hydrogen peroxide (20 min, H2O2; catalog #: H325; Fisher Scientific). The sections were then transferred to a 0.3% glycine (10 min; catalog #: G48–500; Fisher Scientific) followed by an incubation in 0.04% sodium dodecyl sulfate (SDS; catalog #: L3771–100G; Sigma Aldrich).
Primary and secondary antibodies were diluted in an incubation solution consisting of 0.25% gelatin (Fisher Scientific, catalog #: G7–500) in PBS with 0.5% Triton X-100 (Sigma-Aldrich, catalog #: BP151–500) to prevent nonspecific labeling. Once tissue was incubated in the proper fluoroprobe, tissue was protected from light from that step forward. After staining, sections were mounted onto Superfrost slides (Fisher Scientific), coverslipped with ProLong Gold with DAPI mounting medium (ThermoFisher) and stored at 4°C until analysis. Sections from animals in all groups were processed simultaneously and the experimenter was blind to the treatment group during tissue processing and analysis. For pSTAT3 IHF, staining and analysis was performed on 4 middle arcuate sections/animal/treatment. Sections were incubated with rabbit anti-p-STAT3 (1: 500, 17h, Cell Signaling catalog #: 9145S) at 4°C followed by incubation in DyLight 488 goat anti-rabbit (1:500, 60min, RT, Thermo Fisher catalog#: 35553). Confocal Z-stacks comprised of 1.0-μm optical sections were captured at 20x magnification on a Leica SP8 inverted, point-scanning confocal system (Leica); fluorophores were detected at wavelengths of 488 (p-STAT3) and 565 (Cy3-fluorescent tagged leptin). Images were imported into ImageJ software (National Institutes of Health, Bethesda, Maryland), max projections of z-stacks were created, sharpened, and adjusted for contrast and brightness, identically for all images.
HDAC6 activity assay
Wild-type DIO mice, cannulated in the lateral ventricle, were sacrificed one hour after vehicle or tubastatin (25 μg) infusion. Brains, except cerebellum, were excised and immediately frozen in liquid nitrogen until processing. Brains were homogenized in HDAC6 activity kit lysis buffer (BioVision) supplemented with protease and phosphatase inhibitors. HDAC6 was immunoprecipitated using an HDAC6 antibody (Novus Biologicals) that is specific to the C-terminal of the protein. Of note, the Cell Signaling HDAC6 antibody used in the western blots can successfully immunoprecipitate the protein however hinders the deacetylase domain due to close proximity of the epitope to the second catalytic domain, and thus is not appropriate for the activity assays. The brain homogenates were incubated with the HDAC6 antibody and protein A/G sepharose beads at 4 C for 3h. The beads were washed 4 times with the lysis buffer and once with the assay buffer of the assay kit. The beads were resuspended in the assay buffer, and the assay was run according to the manufacturer’s protocol except with the following modifications. Each resuspended agarose bead was divided into two equal volumes into the assay plate, and one half was added 20μM Vorinostat. The fluorescence from the vorinostat wells were subtracted to obtain the activity for each sample.
Gene Expression Analysis (qRT–PCR)
Total RNA (1 μg) isolated (Trizol Reagent, Invitrogen) from frozen tissues was converted to cDNA (cDNA reverse transcription kit, Invitrogen) and used to screen expression levels of the listed genes. Reactions were amplified in an ABI Prism 7500 FAST sequence detector (Applied Biosystems) and acquired data were analyzed using the ΔΔCt method to determine the expression level of each transcript normalized to the expression level of the housekeeping genes (36B4, TBP, and/or β-Actin). Primer sequences are listed in Supplementary Tables S8.
RNA sequencing
N1-LRb cells were treated for 4hr with PBS or leptin (100 ng/mL). Total RNA was extracted and sequencing was performed by the University of Michigan DNA Sequencing Core, using the Illumina Hi-Seq 4000 platform. Tuxedo Suite software package was used for alignment, differential expression analysis, and post-analysis diagnostics. Briefly, the reads were aligned to the reference using TopHat (version 2.0.13) and Bowtie2 (version 2.2.1.). The default parameter settings were used for alignment, with the exception of: “--b2-very-sensitive” telling the software to spend extra time searching for valid alignments. FastQC was used for a second round of quality control (post-alignment), to ensure that only high quality data would be input to expression quantitation and differential expression analysis. For expression quantitation, normalization, and differential expression analysis, the parameter settings: “--multi-read-correct” was used to adjust expression calculations for reads that map in more than one locus, as well as “--compatible-hits-norm” and “--upper-quartile–norm” for normalization of expression values. The genes and transcripts were identified as being differentially expressed based on three criteria: test status = “OK”, FDR 0.05, and fold change ≥ ± 1.5. We annotated genes and isoforms with NCBI Entrez GeneIDs and text descriptions. The sequencing of eWAT samples from HDAC6 KO and HDAC6AdipoΔ mice was performed by Novogene (Sacramento, CA).
Genotyping protocols:
Materials
Ear punches were extracted in a mixture of 50μl/sample Sigma extraction solution (Cat# E7526) and 12.5μl/sample Sigma tissue preparation solution (Cat# T3073). Samples were incubated at room temperature for 10 minutes, followed by 95 °C incubation for 3 minutes. Solutions were neutralized by 50μl/sample Sigma neutralization solution (Cat# N3910).
Genotyping protocol
For global HDAC6 KO, two separate reactions were used to identify the genotype (WT: 326bp, KO: ~300bp). Wild type PCR reaction was run using primers: 5’ CTG GTT CGT CTG AAG ACA 3’, and 5’ GTG GAC CAG TTA GAA GCC 3’. The reaction proceeds with 95 °C for 3min, 32 cycles of (95 °C for 30sec, 60 °C for 30sec, 72 °C for 90 sec), 72 °C for 10min, hold at 4 °C.
Knockout allele was identified using primers: 5’ CCA TGA CCG AGA TCG GCG AGC A 3’, and 5’ CGT GAA TTC CGA TCA TAT TCA AT 3’. PCR reaction was run at 95 °C for 3min, 35 cycles of (95 °C for 30sec, 60 °C for 30sec, 72 °C for 90sec), 72 °C for 10min, hold at 4 °C.
We obtained the Adipoq-Cre mice from The Jackson Laboratory (Stock # 028020). The following 4 primer mix was used for genotyping PCR (Transgene: ~200bp, Internal positive control 324bp). Transgene reverse: 5’ ACG GAC AGA AGC ATT TTC CA 3’; Transgene forward: 5’ GGA TGT GCC ATG TGA GTC TG 3’; Internal positive forward: 5’ CTA GGC CAC AGA ATT GAA AGA TCT 3’; Internal positive reverse: 5’ GTA GGT GGA AAT TCT AGC ATC ATC C 3’. PCR reaction proceeds with: 94 °C for 2min, 10 cycles of (94 °C for 20sec, 65 °C for 15sec 0.5 decrease per cycle (touchdown), 68 °C for 10 sec); 28 cycles of (94 °C for 15sec, 60 °C for 15sec, 72 °C for 10sec); 72 °C for 2min and hold at 10 °C.
Syn1-Cre mice were purchased from The Jackson Laboratory (stock# 003966). Two sets of primers were used for two separate PCRs (transgene: ~300bp, internal positive control: 324bp). Transgene forward: 5’ CTC AGC GCT GCC TCA GTC T 3’, transgene reverse: 5’ GCA TCG ACC GGT AAT GCA 3’; Internal positive forward: 5’ CTA GGC CAC AGA ATT GAA AGA TCT 3’, internal positive reverse: 5’ GTA GGT GGA AAT TCT AGC ATC ATC C 3’.
Wild-type PCR is the same as Adipoq-Cre PCR- 94°C for 2min, 10 cycles of (94 °C for 20sec, 65 °C for 15sec 0.5 decrease per cycle (touchdown), 68 °C for 10sec); 28 cycles of (94 °C for 15sec, 60 °C for 15sec, 72 °C for 10sec); 72 °C for 2min and hold at 10 °C. Transgene PCR was proceed as following- 94 °C 2min, 30 cycles of (94 °C 15sec, 62 °C 15sec, 72 °C 10sec), 72 °C 2min, hold at 10 °C.
HDAC6-floxed mouse were identified by confirming both 5’ and 3’ ends of the flox sequence. 5’ floxed reaction (WT: 600bp, 5’floxed: 650bp) includes primers: F- GTA CAA TGT GGC TCA CAG AA, and R-CAG GCA CAG GAA TAT GAG TT. PCR reaction: 94 °C 5min, 39 cycles of (94 °C 30sec, 60.8 °C 30sec, 72 °C 1min), 72 °C 10min, hold at 4 °C. 3’ floxed (WT: 318bp, 3’floxed: 350bp) primers- F- GGC CTT GTG GCC TGT GAT CT; R- CAA CTC TGC CTC TCC TGG AT. Reaction proceeds with: 94 °C 5min, 39 cycles of (94 °C 30sec, 60 °C 30sec, 72 °C 40 sec), 72 °C 10min, hold at 4 °C.
Indirect Calorimetry
A standard 12h light/dark cycle was maintained throughout the calorimetry studies. Mice, after acclimation to individual housing for at least 7 days, were placed in metabolic cages located in the Mouse Metabolic Phenotyping Center at Vanderbilt University in a temperature- and humidity-controlled housing room. Energy expenditure measures were obtained using a computer controlled indirect calorimetry system (Promethion, Sable Systems, Las Vegas, NV). The calorimetry system consists of 16 metabolic cages (identical to home cages with bedding) each equipped with water bottles and food hoppers connected to load cells for food and water intake monitoring, and all animals had ad libitum access to food and water throughout the study unless otherwise specified. Details of the system’s operation, and the calculation of energy expenditure, RER, and physical activity parameters were as described84.
Compound Synthesis
SE-7552 was synthesized as described and dissolved in DMSO for animal studies85. Compound 4 (BRD3067) was synthesized according to the reaction steps described (Supplementray Figure 1). The NMR spectra for compound 3 and compound 4 are listed at the end.
Methyl 2-methyl-4-((2-methyl-1,2,3,4-tetrahydro-5H-pyrido[4,3-b]indol-5-yl)methyl)benzoate (3):
At 0 °C, to a DMF solution (1.5 mL) of 2-methyl-2,3,4,5-tetrahydro-1H-pyrido[4,3-b]indole (1, 31.0 mg, 0.166 mmol) was added NaH (7.9 mg, 0.332 mmol, 95% in mineral oil). The reaction mixture was stirred at 0 °C for 40 min. A DMF solution (1.0 mL) of methyl 4-(bromomethyl)-2-methylbenzoate (2, 40.3 mg, 0.166 mmol) was added dropwise for 15 min. The mixture was further stirred at 0 °C for 5 min. the reaction was quenched with sat. NH4Cl (aq) and the aqueous layer was extracted with EtOAc (4 × 10 mL). The combined organic layer was dried over Na2SO4 (anh), concentrated in vacuo, and the crude was purified by Biotage ISCO silica gel chromatography to yield compound 3 (31.0 mg, 53%) as oil. 1H-NMR (CDCl3) δ (ppm) 2.54 (s, 3H), 2.61 (s, 3H), 2.81 (t, J = 5.6 Hz, 2H), 2.89 (t, J = 5.3 Hz, 2H), 3.79 (s, 2H), 3.87 (s, 3H), 5.25 (s, 2H), 6.83 (d, J = 8.1 Hz, 1H), 6.95 (s, 1H), 7.09–7.20 (m, 3H), 7.48 (dd, J = 1.9, 6.1 Hz, 1H), 7.81 (d, J = 8.0 Hz, 1H). MS (ES) 349.2 [M + H] +, LCMS RT = 0.923 min.
N-hydroxy-2-methyl-4-((2-methyl-1,2,3,4-tetrahydro-5H-pyrido[4,3-b]indol-5-yl)methyl)benzamide (4, BRD3067):
At room temperature, to a THF/MeOH (1:1) solution (2 mL) of 3 (72.0 mg, 0.206 mmol) was added NH2OH.HCl (71.8 mg, 1.034 mmol) and KOH (173.3 mg, 3.09 mmol). The reaction mixture was stirred at RT for 2.0 h. The reaction was quenched with 10.0 mL 1N HCl (aq) to adjust the pH = 1. The mixture was concentrated in vacuo. The crude was purified by HPLC (Phenomenex Gemini C18, H2O (0.1% TFA) /CH3CN gradient 0%−50% for 5 min to give the compound 4 (61.0 mg, 84%). 1H-NMR (MeOD) δ (ppm) 2.31 (s, 3H), 3.13 (s, 3H), 3.15–3.20 (m, 2H), 3.56–3.63 (m, 1H), 3.84–3.90 (m, 1H), 4.40 (d, J = 14.3 Hz, 1H), 4.77 (d, J = 14.3 Hz, 1H), 5.40 (d, J = 7.8 Hz, 2H), 6.87 (d, J = 8.0 Hz, 1H), 6.99 (s, 1H), 7.11–7.23 (m, 3H), 7.34 (d, J = 8.0 Hz, 1H), 7.51 (d, J = 7.5 Hz, 1H). MS (ES) 350.2 [M + H] +, LCMS RT = 0.65 min.
Tubastatin A in Plasma and Tissues: LC-MS Measurements
Materials
Proteomics-grade trifluoroacetic acid packaged in sealed amber glass ampules was purchased from Thermo-Fisher Scientific (Waltham, MA). HPLC-grade (J.T. Baker) water and acetonitrile were purchased from VWR (Radnor, PA). Pooled control mouse plasma (EDTA, unfiltered) was obtained from Bioreclamation, LLC (Hicksville, NY).
Instrumentation
HPLC analyses were carried out using a Thermo Accela / HTC PAL system (Thermo Finnigan, San Jose, CA) equipped with a Brinkmann CH-30 external column heater (Metrohm, Herisau, Switzerland). Tandem mass spectrometric detection was performed using a Thermo-Finnigan Quantum Ultra triple-stage quadrupole mass spectrometer (Thermo Scientific, San Jose, CA) equipped with an Ion Max API source, a standard ESI probe, and a 50 μm ID stainless steel high voltage capillary. The mass analyzer was calibrated every 4–6 weeks over a mass range of m/z 182 to m/z 997 using a mixture of tyrosine peptides following the manufacturer’s recommended calibration procedure. Data acquisition and analysis were carried out using Xcalibur version 2.0.7 and Thermo-Finnigan LCQuan version 2.7, respectively.
Liquid chromatographic conditions
A Hypersil Gold-AQ analytical column (2.1 mm x 100 mm, 1.8 μm particle size, (Thermo Scientific) was used for all chromatographic separations. The column and autosampler tray temperatures were maintained at 50 °C and 5 °C respectively. Mobile phases were made up of 0.1% TFA in (A) H2O and in (B) CH3CN. Gradient conditions were as follows: 0–1 min, B = 0 %; 1–6 min, B = 0–100 %; 6–8 min, B = 100 %; 8–8.5 min, B = 100–0 %; 8.5–13 min, B = 0 %. The flow rate was maintained at 300 μL/min; a software-controlled divert valve was used to transfer eluent from 0–3.5 min and from 5.5–13 min of each chromatographic run to waste. The total chromatographic run time was 13 min.
The sample injection volume was 10 μL. The autosampler injection valve and syringe needle were flushed sequentially with mobile phase B (two cycles) and mobile phase A (two cycles) between sample injections. To minimize complications resulting from the gradual buildup of hydrophobic tissue components, the column was washed overnight with a solution containing tert-butyl methyl ether (MTBE) after each batch of samples were injected (CH3CN/i-PrOH/MTBE/H2O, 4:3:2:1).
Mass spectrometry
The mass spectrometer was operated in positive ion mode. Quantitation was based on multiple reaction monitoring detection (Tubastatin A: m/z 336.1 → 293.1, collision energy 11; BRD-3067: m/z 350.1 → 307.1, collision energy 11; Q3 scan width 1.0; scan time 0.080 sec) (Supplementary Figure 2). The following optimized ion source parameters were used for the detection of analyte and internal standard: N2 sheath gas 30 psi; N2 auxiliary gas 25 psi; spray voltage 4.5 kV; capillary temperature 300 °C; declustering voltage 10 V.
Sample Processing
Plasma and tissue samples were stored at −80 °C in polypropylene tubes and allowed to thaw on ice before processing. Plasma samples (100 μL) were deproteinized with HPLC-grade acetonitrile (300 μL) containing internal standard BRD-3067. Brain, liver, muscle, heart, and kidney were homogenized at 0 °C by sonication (Fisher Sonic Dismembrator, 3 × 15 sec, power = 3) at a tissue density of approx. 0.75 g/mL in H2O/MeOH (9:1) containing 100 mM NH4OAc. A portion of the homogenate (10 μL) was diluted with control mouse plasma (90 μL), lightly vortexed, and deproteinized with acetonitrile (300 μL) containing internal standard BRD-3067. Hypothalamus, spleen, and brown adipose tissue samples were extracted in HPLC-grade acetonitrile (400 μL) with sonication (3 × 15 sec, power = 3). The insoluble fraction was removed by centrifugation, and a portion of the supernatant (10 μL) was diluted with control mouse plasma (90 μL), lightly vortexed, and deproteinized with acetonitrile (300 μL) containing internal standard BRD-3067. Epididymal and subcutaneous white adipose tissues were extracted in methanol/chloroform (2:1, 400 μL) with sonication (3 × 15 sec, power = 3). The insoluble fraction was removed by centrifugation, and a portion of the supernatant (10 μL) was diluted with control mouse plasma (90 μL), lightly vortexed, and deproteinized with acetonitrile (300 μL) containing internal standard BRD-3067. Precipitated proteins were removed by centrifugation; the supernatants were transferred to clean tubes and evaporated under a gentle stream of nitrogen gas. Residues were reconstituted in water/methanol (3:1) and transferred to autosampler vials capped with Teflon-lined rubber septa. External plasma calibration samples were spiked with known concentrations of tubastatin A and processed as described above.
Statistics and Reproducibility
The statistical analysis was conducted on GraphPad software (Prism, versions 7–9), and each statistical test is listed in the figure legends. Statistical corrections were done using Sidak or Tukey’s multiple comparison tests as recommended by GraphPad Prism. P<0.05 were considered significant, and exact P values for the reported comparisons are listed in figure legends. Majority of the experiments are conducted at least twice to ensure reproducibility, except the RNA sequencing results, which were conducted once. In the metabolic cage studies described in Fig. 3k and 3l, the data collected during the time frame the metabolic cages were opened for mouse injections were excluded from analysis. For the studies that involve stereotaxic surgeries into the lateral ventricle, the animals that tested negative during the water intake test (Angiotensin II test) were excluded from the study. In most experiments, the investigators were not blinded to the experiment except for the experiments presented in Fig. 6h–j. Experimental sample sizes used are noted in the figure legends. Cohort sizes were determined based on the experience of the co-authors (IC, RDC, MGL, and TAM) as well as the published literature of similar experimental protocols. Number of animals used in the metabolic cage measurements were determined based on the available animal housing chambers of the units in our facilities.
Data Availability
Figures 2 and 6, and Extended Data Figures 1, 2, and 6–10 have associated raw data provided as source data files. All raw data is also available upon request. 5edu.pdb was used for the docking reported in Fig. 8. The RNA sequencing results are deposited to the GEO database with the accession numbers: GSE190156
Extended Data
Extended Data Fig. 1. Effect of HDAC6 Inhibitors on DIO Mice.
a, b, Body weight change (Veh vs. 12.5 mg/kg TubA P=2.8E-3, Veh vs. 25 mg/kg TubA P=4.8E-12, Veh vs. 50 mg/kg TubA P=7E-15) and cumulative food intake (Veh vs. 12.5 mg/kg TubA P=0.012, Veh vs. 25 mg/kg TubA P=7.7E-7, Veh vs. 50 mg/kg TubA P=1.1E-10 by two-wat ANOVA with Tukey correction for a and b) of DIO wild-type mice treated with indicated doses of tubastatin or vehicle (n=5 mice, Veh; n=4 mice for drug groups). c, Wild type DIO mice were treated with vehicle or the indicated doses of tubastatin. Ac-αtubulin and total αtubulin was analyzed in eWAT lysates (n=3. Veh vs. 12.5 mg/kg TubA P=0.045, Veh vs. 25 mg/kg TubA P=3.2E-4, Veh vs. 50 mg/kg TubA P<E-15, by one-way ANOVA with Dunnett correction). d, Time-course food intake measurements of DIO wild-type mice following tubastatin administration (n=4. 6h P=4.1E-3, 16h P=6E-6, 24h P=6.8E-8 by two-way ANOVA with Sidac correction). e, f, Cumulative food intake (1day P=5.4E-3, 2day P=2.9E-3, 3day P=8.6E-, 4day P=0.025 by multiple unpaired two-sample t-test) (e) and body weight change (P=9.7E-3 by two-way ANOVA with Sidak correction for e and f) (f) of DIO wild-type mice treated twice with vehicle (n=10) or tubastatin. (n=8). g, h, Female DIO wild-type mice were treated with vehicle (n=4) or tubastatin (n=5) for two weeks. Change in body weight (P=4.4E-6) (g), and cumulative food intake (P=0.015 by two-way ANOVA with Sidak correction for g and h) (h) of the animals.
Extended Data Fig. 2. HDAC6-specific Weight Loss response to HDAC6 inhibitors.
a, Growth curves of WT (n=18 mice) and HDAC6 KO (n=12 mice) mice on high fat diet (left) and their body composition (right). b, Body weight of daily vehicle (n=5) or tubastatin (i.p., 12.5 mg/kg, n-6) treated DIO HDAC6 KO mice. c, Structure of tubastatin and BRD3067 (top). Immunoblots from 293T lysates 24hr after drug treatment. d, e, Body weight (BRD3067 vs. TubA P=7.0E-3, Veh vs. TubA P=2.0E-3) and food intake (day 1 BRD3067 vs. TubA P=5.8E-4, Veh vs. TubA P=9.7E-9, day 2 BRD3067 vs. TubA P=2.6E-5, Veh vs. TubA P=2.8E-7, day 3 BRD3067 vs. TubA P=9.5E-3, Veh vs. TubA P=2.6E-5, day 4 BRD3067 vs. TubA P=1.7E-5, Veh vs. TubA P=3.0E-8, day 5 BRD3067 vs. TubA P=4.7E-5, Veh vs. TubA P=6.2E-9, day 6 BRD3067 vs. TubA P=2.0E-3, Veh vs. TubA P=3.4E-9, Veh vs. BRD3067 P=1.8E-3, day 7 BRD3067 vs. TubA P=8.5E-4, Veh vs. TubA P=1.4E-6, two-way ANOVA with Tukey post-hoc test) of vehicle, tubastatin, or BRD3067-treated DIO wild-type mice (n=6). f, g, Body weight change of DIO wild-type mice treated daily with vehicle (n=12), ricolinostat (25 mg/kg, i.p., n=12, P=2.7E-7 by two-way ANOVA with Sidak correction) (f) or CAY10603 (12.5 mg/kg, i.p., n=4, P=2.5E-9 by two-way ANOVA with Sidak correction) (g). h, i, Weight change (P=9.2E-4) and cumulative food intake (P=8.9E-6 by two-way ANOVA with Sidak correction for h and i) of wild-type and HDAC6 KO DIO mice treated daily with i.p. CAY10603 (n=3). *P<0.05, **P<0.01, ***P<0.001 as analyzed by two-way analysis of variance (ANOVA) with Sidak’s correction Tukey’s post-hoc test for multiple comparison. Data are represented as mean ± s.e.m.
Extended Data Fig. 3. Tubastatin does not affect blood pressure or heart rate.
a, b, Heart rate and blood pressure of wild-type mice measured real-time during the first 4 days of the vehicle or tubastatin administrations (n=3 mice per group). Data are represented as mean ± s.e.m.
Extended Data Fig. 4. Tubastatin improves metabolic function in diet-induced obese mice.
a, RER, b, EE, and c, linear regression analysis of EE versus lean body mass (LBM) by ANCOVA of DIO wild-type mice treated with vehicle (n=6) or tubastatin (n=5). Linear regression was plotted using https://www.mmpc.org/shared/regression.aspx. d, Energy expenditure (EE) of DIO wild-type mice placed into metabolic chambers where they were allowed to eat ad libitum (n=5) or provided the proportion of food consumed by the TubA group compared to the vehicle group (Pair-Fed, n=6) (Dark P=0.02, Light P=0.026 by two-way ANOVA with Sidac correction). e-h, DIO mice were placed into metabolic chambers and treated with vehicle (n=17) or tubastatin (n=15) for 5 consecutive days. Total distance travelled in the cage (e, f), mean pedestrian speed (g), and percentage of sleep of the animals during the treatment period (h). i, Body weight change of DIO wild-type mice treated with vehicle (Veh and Pair-fed groups) or tubastatin (n=6 per group) for 12 consecutive days. Pair-fed group’s food intake was matched to the daily average food intake of the tubastatin group’s (Veh vs. Pair-fed P=1.3E-6, Veh vs. TubA P=4.7E-7). j, Change in fat mass (Veh vs. Pair-fed P=6.1E-4, Veh vs. TubA P=2.3E-6, Pair-fed vs. TubA P=0.015 by one-way ANOVA with Tukey’s post-hoc test for i and j) of the mice in (i). *P<0.05, **P<0.01, ***P<0.001 as analyzed by one-way ANOVA with Tukey’s post-hoc test or Sidak test for multiple comparison. Data are represented as mean ± s.e.m.
Extended Data Fig. 5. Tubastatin increases hypothalamic leptin signaling.
Wild-type DIO mice were treated with i.p. vehicle of tubastatin (n=3 mice per group), and co-treated with i.p. leptin. Mice were perfused, and hypothalamic STAT3 phosphorylation was analyzed by immunofluorescent staining. Arcuate nucleus (ARC) (P=0.0054) and dorsomedial hypothalamic (DMH) (P=0.094) confocal images of p-STAT3Y705 stainings (left) and the quantification of the fluorescent intensities (right bar graphs) Scale bar: 20μm. The experiment was conducted in two independent cohorts. *P<0.05, **P<0.01, ***P<0.001 as analyzed by unpaired two-tailed t-test.
Extended Data Fig. 6. HDAC6-dependent regulation of obesity is peripherally mediated.
a, Brain HDAC6 activity of DIO mice following icv vehicle or TubA (25μg) administration (n=6, P=2.8E-6 by unpaired two-tailed t-test). b, Immunoblots of acetylated αTubulin (Ac-αTubulin), total αTubulin or GAPDH in spleen, kidney, skeletal muscle, liver, and the hypothalamus. The results were confirmed in two independent cohorts. c, Ac-αTubulin and total αTubulin immunoblot of eWAT samples from DIO HDAC6 KO mice treated with vehicle or tubastatin. This experiment was done in cohort of animals. d, HDAC6 mRNA expression in the cortex (brain), the hypothalamus, adipose tissue, liver and skeletal muscle of the indicated genotypes (n=3 per group; BAT P=4.5E-4, iWAT P=7.2E-3, eWAT P=5.6E-5 by unpaired multiple t-test. The results were repeated in two independent experiments). e, f, Total (left panels) and time-course (right panels) energy expenditure (e) and respiratory exchange ratios (RER) (f) of AdipoCre (n=5) and HDAC6AdipoΔ (n=6) mice. g, Physical activity profile of the mice in (e) (n=4 for AdipoCre, n=6 for HDAC6AdipoΔ; Dark P=4.4E-3). Data are represented as mean ± s.e.m.
Extended Data Fig. 7. Phenotype of the neuron-specific HDAC6 knockout mice.
a, b, Immunoblots of HDAC6 and total αTubulin in the hypothalamus (Hypoth), cortex, liver, and skeletal muscle of SynCre controls (n=3) and HDAC6SynΔ (n=3) mice (a), and the quantification of HDAC6 band intensities normalized to tubulin (Cortex P=4.6E-4, Hypothalamus P=9.6E-3 by multiple unpaired t-test) (b). Immunoblot results were confirmed in two cohorts of mice. c, mRNA expression of HDAC6 in the indicated tissues (n=4; Cortex P=0.012, Hypothalamus P=1.3E-3 by multiple t-test). d, Body weight of control and neuron-specific HDAC6 knockout (HDAC6SynΔ) mice on standard or high-fat diet (n=18, HDAC6 flox chow; n=20, HDAC6 flox HFD; n=16, SynCre chow, n=17, SynCre HFD; n=18, HDAC6SynΔ chow; n=20, HDAC6SynΔ HFD; HFD vs. Chow for all genotypes P=1.2E-11, HDAC6flox HFD vs. SynCre HFD P=6.3E-5, HDAC6flox HFD vs. HDAC6SynΔ HFD P=1E-6 by mixed effect analysis with Tukey’s post-doc test.). *P<0.05, **P<0.01, ***P<0.001. Data are represented as mean ± s.e.m.
Extended Data Fig. 8. Metabolic phenotype of the liver specific HDAC6 KO mice.
Wild-type (n=7 mice) and HDAC6flox/Y (n=8) mice were treated with tail-vein injection of AAV8-TBG-iCre. Mice were placed on HFD four weeks after viral injection. a, Liver HDAC6 expression analyzed by qPCR (P=2.5E-8 by two-tailed unpaired t-test). b, Body weight of the cohorts on HFD. c, Weekly food intake of the mice measured at indicated times. d, Body composition measured after 19-week of HFD exposure)Fat P=0.049, Fluid P=7.2E-3 by multiple unpaired t-test). e, Glucose tolerance test conducted after 20 weeks on HFD. f, Insulin tolerance test conducted after 23 weeks on HFD. g-I, Mice were treated with 25mg/kg tubastatin by daily i.p. injections. Weight change (g), cumulative food intake (h), and body composition after tubastatin treatment (i). *P<0.05, **P<0.01, ***P<0.001. Data are represented as mean ± s.e.m.
Extended Data Fig. 9. The anti-obesity effect of HDAC6 inhibition requires a potentially unidentified systemic factor.
a, Leptin dose-response curves of N1-LRb cells stably expressing the luciferase construct under a STAT3-responsive promoter (n=32 per time point). b, Immunoblots for pSTAT3 and total STAT3 from the lysates of N1-LRb cells pre-treated with leptin or PBS for 24hr followed by leptin stimulation at the indicated doses. c, mRNA expression of leptin responsive transcripts in N1-LRb cells treated with vehicle or leptin (100 ng/mL) for 4h (n=3 for Nav2; n=4 for other groups, Bcl3 P=3.9E-5, Elfn1 P=4.5E-5, Nav2 P=0.012, Socs3 P=1.5E-7 by multiple unpaired t-test). d, mRNA expression of leptin responsive transcripts in N1-LRb cells treated with TubA at indicated doses for 2hr, and stimulated with leptin (2 ng/mL) for 4hr (n=4). The results was confirmed in two independent experiments. e, Plasma from vehicle or TubA-treated ob/ob mice was deproteinized by proteinase K treatment followed by heat inactivation. Expression of the leptin responsive transcripts in N1-LRb cells pre-treated with deproteinized plasma for 2h, followed by leptin (2 ng/mL) stimulation for 4h (n=4). f, g, Food intake (Veh Saline vs. Veh Leptin; 3h P=3.6E-4, 6h P=7.2E-4, 16h P=8.7E-7, 24h P=1.3E-5; TubA Saline vs. TubA Leptin; 3h P=0.011, 6h P=9.4E-3, 16h P=9.4E-10, 24h P=7.1E-9; Veh Leptin vs. TubA Leptin: 3h P=0.34, 6h P=0.038, 16h P=0.032, 24h P=0.30) and body weight change (Veh Saline vs. Veh Leptin; 16h P=1.2E-6, 24h P=0.014; TubA Saline vs. TubA Leptin; 16h P=8.7E-9, 24h P=3.2E-6; Veh Leptin vs. TubA Leptin: 16h P=8E-4, 24h P=0.025 by two-way ANOVA with Tukey’s post-hoc test for f and g) of 24h-fasted lean HDAC6AdipoΔ mice upon treatment with vehicle, saline, TubA and/or leptin (n= 6 mice for Veh groups, n=8 mice for TubA groups). h, N1-LepRb cells were treated with celastrol (500nM) or tubastatin (1μM) for 24hr, and stimulated with leptin for 15min. The level of STAT3 phosphorylation and αtubulin acetylation was analyzed by immunoblots, and confirmed in two independent experiments. i, Body weights of DIO wild-type mice treated with vehicle (n=4), tubastatin (n=3), IL6 neutralizing antibodies (anti-IL6, n=4), or tubastatin+anti-IL6 (n=4; Veh+Saline vs. TubA+Saline P=3.2E-9, Veh+anti-IL6 vs. TubA+anti-IL6 P=3.3E-5 by two-way ANOVA with Tukey’s post-hoc test). j, Body weight change of DIO IL1R1 KO mice treated with vehicle (n=5) or tubastatin (n=6, P=1E-15 by two-way ANOVA with Sidak correction). *P<0.05, **P<0.01, ***P<0.001 as analyzed Student’s t-test, two-way ANOVA with Tukey’s post-hoc test, or Sidak’s multiple comparison. Data are represented as mean ± s.e.m.
Extended Data Fig. 10. HDAC6 inhibitors induce heat shock response.
a, b, HSP70 mRNA level in iWAT explants from DIO mice 24 hr after, vehicle (n=41) vs. TubA (n=42, P=1.1E-3) (a) or Vehicle (n=4) vs. CAY10603 (n=4, P=3.8E-4, by two-tailed unpaired t-test for a and b) (b) treatments. c, HSP25 and HSP70 mRNA expression in 293T cells transfected with the indicated constructs (n=6. HSP25: GFP vs. HDAC6CI P=1.5E-9, HDAC6 WT vs. HDAC6CI P=2.8E-9; HSP70: GFP vs. HDAC6CI P=3E-5, HDAC6 WT vs. HDAC6CI P=4.5E-9, GFP vs. HDAC6 WT P=3.1E-5). d, TSC2+/+ and TSC−/− mouse embryonic fibroblasts (MEFs) were treated with vehicle (DMSO) or celastrol for 24 hr. Cell lysates were analyzed by immunoblots. The results were confirmed in three independent experiemnts e, p-PERK and total PERK protein levels in liver homogenates from wild-type DIO mice treated with vehicle or celastrol. Th experiment was conducted in two independent cohorts of mice with similar outcomes. Data are represented as mean ± s.e.m.
Supplementary Material
ACKNOWLEDGEMENTS
This work was supported by NIH R01DK070332 and 1R01DK125830 to R.D.C., and MDRC Pilot and Feasibility Grant (NIH Grant P30-DK020572), the Klatskin-Sutker Discovery Fund and the American Diabetes Association grant #7-21-JDF-032 to I. C.. T.A.M. was supported by the NIH (HL116848, HL127240, HL147558, DK119594) and the American Heart Association (16SFRN31400013). R.A.B. received funding from the Canadian Institutes of Health Research (FRN-216927). The indirect calorimetry study was performed by the Vanderbilt Mouse Metabolic Phenotyping Center (DK059637). We thank Dr. Venetia Zachariou from the Icahn School of Medicine at Mount Sinai for providing the HDAC6flox mice, Dr. Vera P. Krymskaya from the University of Pennsylvania for TSC2+/+ and TSC−/− MEFs, Dr. Owen McGuinness and David Wasserman from Vanderbilt University and Cone laboratory members for useful discussion.
COMPETING INTEREST
T.A.M. is on the SABs of Artemes Bio and Eikonizo Therapeutics, received funding from Italfarmaco for an unrelated project, and has a subcontract from Eikonizo Therapeutics for an SBIR grant from the National Institutes of Health (HL154959). I.C., A.W., P.L., and R.D.C. have filed a provisional patent application on non-hydroxymate HDAC6 blockers. Other authors declare no competing interests.
References
- 1.Ng M et al. Global, regional, and national prevalence of overweight and obesity in children and adults during 1980–2013: a systematic analysis for the Global Burden of Disease Study 2013. Lancet 384, 766–781 (2014). [DOI] [PMC free article] [PubMed] [Google Scholar]
- 2.Elmquist JK, Bjørbaek C, Ahima RS, Flier JS & Saper CB Distributions of leptin receptor mRNA isoforms in the rat brain. J. Comp. Neurol. 395, 535–547 (1998). [PubMed] [Google Scholar]
- 3.Maffei M et al. Leptin levels in human and rodent: measurement of plasma leptin and ob RNA in obese and weight-reduced subjects. Nat. Med. 1, 1155–1161 (1995). [DOI] [PubMed] [Google Scholar]
- 4.Andreoli MF, Donato J, Cakir I & Perello M Leptin resensitisation: a reversion of leptin-resistant states. J. Endocrinol. 241, R81–R96 (2019). [DOI] [PubMed] [Google Scholar]
- 5.Cavadas C, Aveleira CA, Souza GFP & Velloso LA The pathophysiology of defective proteostasis in the hypothalamus - from obesity to ageing. Nat. Rev. Endocrinol. 12, 723–733 (2016). [DOI] [PubMed] [Google Scholar]
- 6.Kondo T et al. Heat shock response regulates insulin sensitivity and glucose homeostasis: pathophysiological impact and therapeutic potential. Curr. Diabetes Rev. 7, 264–269 (2011). [DOI] [PubMed] [Google Scholar]
- 7.Quan W, Jung HS & Lee M-S Role of autophagy in the progression from obesity to diabetes and in the control of energy balance. Arch. Pharm. Res. 36, 223–229 (2013). [DOI] [PubMed] [Google Scholar]
- 8.Wing SS The UPS in diabetes and obesity. BMC Biochem. 9 Suppl 1, S6 (2008). [DOI] [PMC free article] [PubMed] [Google Scholar]
- 9.Barlow AD & Thomas DC Autophagy in diabetes: β-cell dysfunction, insulin resistance, and complications. DNA Cell Biol. 34, 252–260 (2015). [DOI] [PubMed] [Google Scholar]
- 10.Ryter SW, Koo JK & Choi AMK Molecular regulation of autophagy and its implications for metabolic diseases. Curr. Opin. Clin. Nutr. Metab. Care 17, 329–337 (2014). [DOI] [PMC free article] [PubMed] [Google Scholar]
- 11.Abubaker J et al. DNAJB3/HSP-40 cochaperone is downregulated in obese humans and is restored by physical exercise. PLoS One 8, e69217 (2013). [DOI] [PMC free article] [PubMed] [Google Scholar]
- 12.Islam A, Hait SH, Andrews-Shigaki B, Carus S & Deuster PA Plasma HSP70 levels correlate with health risk factors and insulin resistance in African American subjects. Exp. Clin. Endocrinol. Diabetes 122, 496–501 (2014). [DOI] [PubMed] [Google Scholar]
- 13.Matz JM, LaVoi KP, Epstein PN & Blake MJ Thermoregulatory and heat-shock protein response deficits in cold-exposed diabetic mice. Am. J. Physiol. 270, R525–32 (1996). [DOI] [PubMed] [Google Scholar]
- 14.Tiss A et al. Immunohistochemical profiling of the heat shock response in obese non-diabetic subjects revealed impaired expression of heat shock proteins in the adipose tissue. Lipids Health Dis. 13, 106 (2014). [DOI] [PMC free article] [PubMed] [Google Scholar]
- 15.Bollinger LM, Powell JJS, Houmard JA, Witczak CA & Brault JJ Skeletal muscle myotubes in severe obesity exhibit altered ubiquitin-proteasome and autophagic/lysosomal proteolytic flux: Proteolysis of Myotubes in Obesity. Obesity 23, 1185–1193 (2015). [DOI] [PMC free article] [PubMed] [Google Scholar]
- 16.Ignacio-Souza LM et al. Defective regulation of the ubiquitin/proteasome system in the hypothalamus of obese male mice. Endocrinology 155, 2831–2844 (2014). [DOI] [PubMed] [Google Scholar]
- 17.Hotamisligil GS Endoplasmic reticulum stress and the inflammatory basis of metabolic disease. Cell 140, 900–917 (2010). [DOI] [PMC free article] [PubMed] [Google Scholar]
- 18.Lee M-S Effect of mitochondrial stress on systemic metabolism. Ann. N. Y. Acad. Sci. 1350, 61–65 (2015). [DOI] [PubMed] [Google Scholar]
- 19.Zhang M et al. HDAC6 deacetylates and ubiquitinates MSH2 to maintain proper levels of MutSα. Mol. Cell 55, 31–46 (2014). [DOI] [PMC free article] [PubMed] [Google Scholar]
- 20.Hook SS, Orian A, Cowley SM & Eisenman RN Histone deacetylase 6 binds polyubiquitin through its zinc finger (PAZ domain) and copurifies with deubiquitinating enzymes. Proc. Natl. Acad. Sci. U. S. A. 99, 13425–13430 (2002). [DOI] [PMC free article] [PubMed] [Google Scholar]
- 21.Seigneurin-Berny D et al. Identification of components of the murine histone deacetylase 6 complex: link between acetylation and ubiquitination signaling pathways. Mol. Cell. Biol. 21, 8035–8044 (2001). [DOI] [PMC free article] [PubMed] [Google Scholar]
- 22.Kawaguchi Y et al. The deacetylase HDAC6 regulates aggresome formation and cell viability in response to misfolded protein stress. Cell 115, 727–738 (2003). [DOI] [PubMed] [Google Scholar]
- 23.Kwon S, Zhang Y & Matthias P The deacetylase HDAC6 is a novel critical component of stress granules involved in the stress response. Genes Dev. 21, 3381–3394 (2007). [DOI] [PMC free article] [PubMed] [Google Scholar]
- 24.Lee J-Y et al. HDAC6 controls autophagosome maturation essential for ubiquitin-selective quality-control autophagy. EMBO J. 29, 969–980 (2010). [DOI] [PMC free article] [PubMed] [Google Scholar]
- 25.Lee J-Y, Nagano Y, Taylor JP, Lim KL & Yao T-P Disease-causing mutations in parkin impair mitochondrial ubiquitination, aggregation, and HDAC6-dependent mitophagy. J. Cell Biol. 189, 671–679 (2010). [DOI] [PMC free article] [PubMed] [Google Scholar]
- 26.Yan J et al. SQSTM1/p62 interacts with HDAC6 and regulates deacetylase activity. PLoS One 8, e76016 (2013). [DOI] [PMC free article] [PubMed] [Google Scholar]
- 27.Butler KV et al. Rational design and simple chemistry yield a superior, neuroprotective HDAC6 inhibitor, tubastatin A. J. Am. Chem. Soc. 132, 10842–10846 (2010). [DOI] [PMC free article] [PubMed] [Google Scholar]
- 28.Jochems J et al. Antidepressant-like properties of novel HDAC6-selective inhibitors with improved brain bioavailability. Neuropsychopharmacology 39, 389–400 (2014). [DOI] [PMC free article] [PubMed] [Google Scholar]
- 29.d’Ydewalle C et al. HDAC6 inhibitors reverse axonal loss in a mouse model of mutant HSPB1–induced Charcot-Marie-Tooth disease. Nat. Med. 17, 968 (2011). [DOI] [PubMed] [Google Scholar]
- 30.Vishwakarma S et al. Tubastatin, a selective histone deacetylase 6 inhibitor shows anti-inflammatory and anti-rheumatic effects. Int. Immunopharmacol. 16, 72–78 (2013). [DOI] [PubMed] [Google Scholar]
- 31.Xu X, Kozikowski AP & Pozzo-Miller L A selective histone deacetylase-6 inhibitor improves BDNF trafficking in hippocampal neurons from Mecp2 knockout mice: implications for Rett syndrome. Front. Cell. Neurosci. 8, 68 (2014). [DOI] [PMC free article] [PubMed] [Google Scholar]
- 32.Zhang L et al. Tubastatin A/ACY-1215 improves cognition in Alzheimer’s disease transgenic mice. J. Alzheimers. Dis. 41, 1193–1205 (2014). [DOI] [PubMed] [Google Scholar]
- 33.Olson DE et al. Hydroxamate-based histone deacetylase inhibitors can protect neurons from oxidative stress via a histone deacetylase-independent catalase-like mechanism. Chem. Biol. 22, 439–445 (2015). [DOI] [PMC free article] [PubMed] [Google Scholar]
- 34.Kirchner H et al. Caloric restriction chronically impairs metabolic programming in mice. Diabetes 61, 2734–2742 (2012). [DOI] [PMC free article] [PubMed] [Google Scholar]
- 35.Demos-Davies KM et al. HDAC6 contributes to pathological responses of heart and skeletal muscle to chronic angiotensin-II signaling. Am. J. Physiol. Heart Circ. Physiol. 307, H252–8 (2014). [DOI] [PMC free article] [PubMed] [Google Scholar]
- 36.Williams KA et al. Extracellular signal-regulated kinase (ERK) phosphorylates histone deacetylase 6 (HDAC6) at serine 1035 to stimulate cell migration. J. Biol. Chem. 288, 33156–33170 (2013). [DOI] [PMC free article] [PubMed] [Google Scholar]
- 37.Bost F et al. The extracellular signal-regulated kinase isoform ERK1 is specifically required for in vitro and in vivo adipogenesis. Diabetes 54, 402–411 (2005). [DOI] [PubMed] [Google Scholar]
- 38.Seeley RJ et al. Melanocortin receptors in leptin effects. Nature 390, 349 (1997). [DOI] [PubMed] [Google Scholar]
- 39.Mazor R et al. Cleavage of the leptin receptor by matrix metalloproteinase-2 promotes leptin resistance and obesity in mice. Sci. Transl. Med. 10, (2018). [DOI] [PMC free article] [PubMed] [Google Scholar]
- 40.Knight ZA, Hannan KS, Greenberg ML & Friedman JM Hyperleptinemia is required for the development of leptin resistance. PLoS One 5, e11376 (2010). [DOI] [PMC free article] [PubMed] [Google Scholar]
- 41.Allison MB et al. Defining the Transcriptional Targets of Leptin Reveals a Role For Atf3 in Leptin Action. Diabetes (2018) doi: 10.2337/db17-1395. [DOI] [PMC free article] [PubMed] [Google Scholar]
- 42.Zhang Y et al. Mice lacking histone deacetylase 6 have hyperacetylated tubulin but are viable and develop normally. Mol. Cell. Biol. 28, 1688–1701 (2008). [DOI] [PMC free article] [PubMed] [Google Scholar]
- 43.Shirazi R et al. Glucagon-like peptide 1 receptor induced suppression of food intake, and body weight is mediated by central IL-1 and IL-6. Proc. Natl. Acad. Sci. U. S. A. 110, 16199–16204 (2013). [DOI] [PMC free article] [PubMed] [Google Scholar]
- 44.Larsen L, Le Foll C, Dunn-Meynell AA & Levin BE IL-6 ameliorates defective leptin sensitivity in DIO ventromedial hypothalamic nucleus neurons. Am. J. Physiol. Regul. Integr. Comp. Physiol. 311, R764–R770 (2016). [DOI] [PMC free article] [PubMed] [Google Scholar]
- 45.Feng X et al. IL1R1 is required for celastrol’s leptin-sensitization and antiobesity effects. Nat. Med. 25, 575–582 (2019). [DOI] [PMC free article] [PubMed] [Google Scholar]
- 46.Sadagurski M et al. Human IL6 enhances leptin action in mice. Diabetologia 53, 525–535 (2010). [DOI] [PMC free article] [PubMed] [Google Scholar]
- 47.Subramanian S, Bates SE, Wright JJ, Espinoza-Delgado I & Piekarz RL Clinical Toxicities of Histone Deacetylase Inhibitors. Pharmaceuticals 3, 2751–2767 (2010). [DOI] [PMC free article] [PubMed] [Google Scholar]
- 48.Witt O, Deubzer HE, Milde T & Oehme I HDAC family: What are the cancer relevant targets? Cancer Lett. 277, 8–21 (2009). [DOI] [PubMed] [Google Scholar]
- 49.Shen S & Kozikowski AP Why Hydroxamates May Not Be the Best Histone Deacetylase Inhibitors--What Some May Have Forgotten or Would Rather Forget? ChemMedChem 11, 15–21 (2016). [DOI] [PMC free article] [PubMed] [Google Scholar]
- 50.Holt JA et al. SE-7552, a Highly Selective, Non-Hydroxamate Inhibitor of Histone Deacetylase-6 Blocks Multiple Myeloma Growth In Vivo. Blood 132, 3215–3215 (2018). [Google Scholar]
- 51.Winkler R et al. Histone deacetylase 6 (HDAC6) is an essential modifier of glucocorticoid-induced hepatic gluconeogenesis. Diabetes 61, 513–523 (2012). [DOI] [PMC free article] [PubMed] [Google Scholar]
- 52.Fujikawa T et al. Leptin engages a hypothalamic neurocircuitry to permit survival in the absence of insulin. Cell Metab. 18, 431–444 (2013). [DOI] [PMC free article] [PubMed] [Google Scholar]
- 53.Ahima RS et al. Role of leptin in the neuroendocrine response to fasting. Nature 382, 250–252 (1996). [DOI] [PubMed] [Google Scholar]
- 54.Davie JR Inhibition of histone deacetylase activity by butyrate. J. Nutr. 133, 2485S–2493S (2003). [DOI] [PubMed] [Google Scholar]
- 55.Ozcan U et al. Chemical chaperones reduce ER stress and restore glucose homeostasis in a mouse model of type 2 diabetes. Science 313, 1137–1140 (2006). [DOI] [PMC free article] [PubMed] [Google Scholar]
- 56.Kabra DG et al. Hypothalamic leptin action is mediated by histone deacetylase 5. Nat. Commun. 7, 10782 (2016). [DOI] [PMC free article] [PubMed] [Google Scholar]
- 57.Galmozzi A et al. Inhibition of class I histone deacetylases unveils a mitochondrial signature and enhances oxidative metabolism in skeletal muscle and adipose tissue. Diabetes 62, 732–742 (2013). [DOI] [PMC free article] [PubMed] [Google Scholar]
- 58.Ferrari A et al. Attenuation of diet-induced obesity and induction of white fat browning with a chemical inhibitor of histone deacetylases. Int. J. Obes. 41, 289–298 (2017). [DOI] [PubMed] [Google Scholar]
- 59.Tam J et al. Peripheral cannabinoid-1 receptor inverse agonism reduces obesity by reversing leptin resistance. Cell Metab. 16, 167–179 (2012). [DOI] [PMC free article] [PubMed] [Google Scholar]
- 60.Zhao S et al. Partial Leptin Reduction as an Insulin Sensitization and Weight Loss Strategy. Cell Metab. 30, 706–719.e6 (2019). [DOI] [PMC free article] [PubMed] [Google Scholar]
- 61.Saito K et al. Celastrol Reduces Obesity in MC4R Deficiency and Stimulates Sympathetic Nerve Activity Affecting Metabolic and Cardiovascular Functions. Diabetes 68, 1210–1220 (2019). [DOI] [PMC free article] [PubMed] [Google Scholar]
- 62.Fribley AM et al. Celastrol induces unfolded protein response-dependent cell death in head and neck cancer. Exp. Cell Res. 330, 412–422 (2015). [DOI] [PMC free article] [PubMed] [Google Scholar]
- 63.Cakir I & Nillni EA Endoplasmic Reticulum Stress, the Hypothalamus, and Energy Balance. Trends Endocrinol. Metab. 30, 163–176 (2019). [DOI] [PubMed] [Google Scholar]
- 64.Minikel EV et al. Author Correction: Evaluating drug targets through human loss-of-function genetic variation. Nature 590, E56 (2021). [DOI] [PMC free article] [PubMed] [Google Scholar]
- 65.Pi J et al. Deficiency in the nuclear factor E2-related factor-2 transcription factor results in impaired adipogenesis and protects against diet-induced obesity. J. Biol. Chem. 285, 9292–9300 (2010). [DOI] [PMC free article] [PubMed] [Google Scholar]
- 66.Chartoumpekis DV et al. Nrf2 represses FGF21 during long-term high-fat diet-induced obesity in mice. Diabetes 60, 2465–2473 (2011). [DOI] [PMC free article] [PubMed] [Google Scholar]
- 67.Nagata N et al. Glucoraphanin Ameliorates Obesity and Insulin Resistance Through Adipose Tissue Browning and Reduction of Metabolic Endotoxemia in Mice. Diabetes 66, 1222–1236 (2017). [DOI] [PubMed] [Google Scholar]
- 68.Shin S et al. Role of Nrf2 in prevention of high-fat diet-induced obesity by synthetic triterpenoid CDDO-imidazolide. Eur. J. Pharmacol. 620, 138–144 (2009). [DOI] [PMC free article] [PubMed] [Google Scholar]
- 69.Asthana J, Kapoor S, Mohan R & Panda D Inhibition of HDAC6 deacetylase activity increases its binding with microtubules and suppresses microtubule dynamic instability in MCF-7 cells. J. Biol. Chem. 288, 22516–22526 (2013). [DOI] [PMC free article] [PubMed] [Google Scholar]
- 70.Leyk J, Daly C, Janssen-Bienhold U, Kennedy BN & Richter-Landsberg C HDAC6 inhibition by tubastatin A is protective against oxidative stress in a photoreceptor cell line and restores visual function in a zebrafish model of inherited blindness. Cell Death Dis. 8, e3028–e3028 (2017). [DOI] [PMC free article] [PubMed] [Google Scholar]
- 71.Boyault C et al. HDAC6 controls major cell response pathways to cytotoxic accumulation of protein aggregates. Genes Dev. 21, 2172–2181 (2007). [DOI] [PMC free article] [PubMed] [Google Scholar]
- 72.Pernet L et al. HDAC6-ubiquitin interaction controls the duration of HSF1 activation after heat shock. Mol. Biol. Cell 25, 4187–4194 (2014). [DOI] [PMC free article] [PubMed] [Google Scholar]
- 73.Qian H et al. HDAC6-mediated acetylation of lipid droplet-binding protein CIDEC regulates fat-induced lipid storage. J. Clin. Invest. 127, 1353–1369 (2017). [DOI] [PMC free article] [PubMed] [Google Scholar]
- 74.Forcioli-Conti N, Estève D, Bouloumié A, Dani C & Peraldi P The size of the primary cilium and acetylated tubulin are modulated during adipocyte differentiation: Analysis of HDAC6 functions in these processes. Biochimie 124, 112–123 (2016). [DOI] [PubMed] [Google Scholar]
- 75.Lundh M et al. Afadin is a scaffold protein repressing insulin action via HDAC6 in adipose tissue. EMBO Rep e48216 (2019). [DOI] [PMC free article] [PubMed] [Google Scholar]
- 76.Harris RB & Martin RJ Site of action of putative lipostatic factor: food intake and peripheral pentose shunt activity. Am. J. Physiol. 259, R45–52 (1990). [DOI] [PubMed] [Google Scholar]
- 77.White CL, Purpera MN, Ballard K & Morrison CD Decreased food intake following overfeeding involves leptin-dependent and leptin-independent mechanisms. Physiol. Behav. 100, 408–416 (2010). [DOI] [PMC free article] [PubMed] [Google Scholar]
- 78.Ravussin Y, Leibel RL & Ferrante AW Jr. A missing link in body weight homeostasis: the catabolic signal of the overfed state. Cell Metab. 20, 565–572 (2014). [DOI] [PMC free article] [PubMed] [Google Scholar]
- 79.Salminen A, Kaarniranta K & Kauppinen A Regulation of longevity by FGF21: Interaction between energy metabolism and stress responses. Ageing Res. Rev. 37, 79–93 (2017). [DOI] [PubMed] [Google Scholar]
- 80.Taylor RC, Berendzen KM & Dillin A Systemic stress signalling: understanding the cell non-autonomous control of proteostasis. Nat. Rev. Mol. Cell Biol. 15, 211–217 (2014). [DOI] [PMC free article] [PubMed] [Google Scholar]
- 81.Xu A et al. Microtubule regulators act in the nervous system to modulate fat metabolism and longevity through DAF-16 in C. elegans. Aging Cell 18, e12884 (2019). [DOI] [PMC free article] [PubMed] [Google Scholar]
- 82.Ratti F et al. Histone deacetylase 6 is a FoxO transcription factor-dependent effector in skeletal muscle atrophy. J. Biol. Chem. 290, 4215–4224 (2015). [DOI] [PMC free article] [PubMed] [Google Scholar]
- 83.Gao Y-S et al. Histone deacetylase 6 regulates growth factor-induced actin remodeling and endocytosis. Mol. Cell. Biol. 27, 8637–8647 (2007). [DOI] [PMC free article] [PubMed] [Google Scholar]
- 84.Lark DS et al. Reduced Nonexercise Activity Attenuates Negative Energy Balance in Mice Engaged in Voluntary Exercise. Diabetes 67, 831–840 (2018) [DOI] [PMC free article] [PubMed] [Google Scholar]
- 85.YATES, Christopher & M. METALLOENZYME INHIBITOR COMPOUNDS. World Patent (2018). [Google Scholar]
- 86.MOE: Molecular Operating Environment. https://www.chemcomp.com/MOE-Molecular_Operating_Environment.htm.
- 87.Jones G, Willett P, Glen RC, Leach AR & Taylor R Development and validation of a genetic algorithm for flexible docking. J. Mol. Biol. 267, 727–748 (1997). [DOI] [PubMed] [Google Scholar]
Associated Data
This section collects any data citations, data availability statements, or supplementary materials included in this article.
Supplementary Materials
Data Availability Statement
Figures 2 and 6, and Extended Data Figures 1, 2, and 6–10 have associated raw data provided as source data files. All raw data is also available upon request. 5edu.pdb was used for the docking reported in Fig. 8. The RNA sequencing results are deposited to the GEO database with the accession numbers: GSE190156


