

Abstract
Background and Aims:
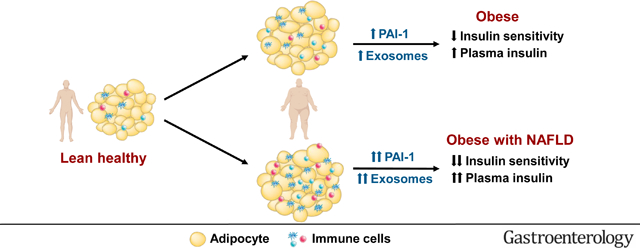
Insulin resistance is a key factor in the pathogenesis of NAFLD. We evaluated the importance of subcutaneous abdominal adipose tissue (SAAT) inflammation and both plasma and SAAT-derived exosomes in regulating insulin sensitivity in people with obesity and NAFLD.
Methods:
Adipose tissue inflammation (macrophage and T cell content and expression of proinflammatory cytokines), liver and whole-body insulin sensitivity (assessed by a hyperinsulinemic-euglycemic clamp and glucose tracer infusion), and 24-hour serial plasma cytokine concentrations were evaluated in three groups stratified by adiposity and intrahepatic triglyceride (IHTG) content: 1) lean with normal IHTG content (LEAN; n=14); 2) obese with normal IHTG content (OB-NL; n=28); and 3) obese with NAFLD (OB-NAFLD; n=28). The effect of plasma and SAAT-derived exosomes on insulin-stimulated Akt phosphorylation in human skeletal muscle myotubes and mouse primary hepatocytes was assessed in a subset of participants.
Results:
Proinflammatory macrophages, proinflammatory CD4 and CD8 T cell populations, and gene expression of several cytokines in SAAT were greater in the OB-NAFLD than the OB-NL and LEAN groups. However, with the exception of PAI-1, which was greater in the OB-NAFLD than the LEAN and OB-NL groups, 24-hour plasma cytokine concentration areas-under-the-curve (AUCs) were not different between groups. The percentage of proinflammatory macrophages and plasma PAI-1 concentration AUC were inversely correlated with both hepatic and whole-body insulin sensitivity. Compared with exosomes from OB-NL participants, plasma and SAAT-derived exosomes from the OB-NAFLD group decreased insulin signaling in myotubes and hepatocytes.
Conclusion:
Systemic insulin resistance in people with obesity and NAFLD is associated with increased plasma PAI-1 concentrations and both plasma and SAAT-derived exosomes.
ClinicalTrials.gov number:
Keywords: Macrophages, T-cells, cytokines, insulin resistance, PAI-1
Short summary:
Alterations in adipose tissue biology, which likely increase the release of PAI-1 and exosomes into the circulation, are associated with hepatic and skeletal muscle insulin resistance in people with NAFLD.
Graphical Abstract
Hepatic steatosis is the hallmark feature of nonalcoholic fatty liver disease (NAFLD) and occurs commonly in people with obesity.1 Obesity-induced insulin resistance is involved in the pathogenesis of NAFLD and hepatic steatosis is unlikely to occur in people with obesity who do not have significant insulin resistance.2, 3 Even people with a genetic variant of the patatin-like phospholipase domain-containing 3 gene (PNPLA3), which markedly increases the risk of NAFLD, are unlikely to develop hepatic steatosis in the absence of obesity and concomitant insulin resistance.4 The therapeutic effect of pharmacological agents that increase insulin sensitivity on IHTG content and other histological features of NAFLD provides further support for the role of insulin resistance in the pathogenesis of NAFLD.5, 6 These findings underscore the importance of understanding the underlying mechanism(s) responsible for insulin resistance in people with obesity and NAFLD.
It has been proposed that an increase in adipose tissue (AT) proinflammatory immune cells and inflammation, which increases the secretion of inflammatory cytokines from AT into the bloodstream, is an important cause of obesity-induced insulin resistance in people.7 In rodent models, obesity and insulin resistance are associated with increased adipose tissue macrophage (ATM) and T cell content and AT gene expression of proinflammatory cytokines.8 Experimentally decreasing or completely eliminating TNF-α signaling9, 10 or shifting the T cell pool towards higher proportions of anti-inflammatory cells11, 12 promotes glucose tolerance and improves insulin sensitivity. However, the importance of AT inflammation in causing insulin resistance in people with obesity is not clear because of conflicting data among studies, which have found increases in proinflammatory macrophages and CD4 T cells in subcutaneous abdominal AT (SAAT) obtained from people with obesity who were considered to be insulin-resistant compared to those who were insulin-sensitive,13–15 whereas other studies found no differences between insulin-sensitive and insulin-resistant groups.16–18 The reason(s) for the discrepant findings among studies could be related to differences in the methods used to assess AT inflammation and immune cell content and differences in the criteria used to define insulin-sensitive and insulin-resistant cohorts.
Exosomes are membrane bound extracellular vesicles that are produced by most cells in the body and provide a mechanism for inter-organ communication by delivering microRNAs (miRNAs), bioactive lipids and regulatory proteins from one cell to another.19 Data from studies conducted in rodent models have shown exosomes derived from AT explants20 and ATMs21, 22 can regulate systemic insulin action mediated by the transfer of specific miRNAs.21, 22 Adipose tissue is the major source of miRNAs in circulating exosomes; adipose-tissue specific knockout of the miRNA-producing enzyme Dicer in mice causes more than a fourfold reduction in circulating exosomal miRNAs.23 Therefore, it is possible that AT-derived exosomes contribute to systemic insulin resistance in people with obesity and NAFLD.
In the present study, we assessed the potential importance of AT inflammation, systemic mediators of AT inflammation, and exosomes in the pathogenesis of insulin resistance in people with obesity and NAFLD. We evaluated the composition of AT resident immune cells, AT expression of genes that encode for cytokines and markers of macrophages and T cells, plasma cytokine concentrations obtained serially for 24-hours, and the effect of exosomes isolated from plasma and AT on insulin action ex vivo in three distinct groups of participants who were separated based on adiposity, oral glucose tolerance and IHTG content: i) healthy lean (LEAN, defined as body mass index [BMI] 18.5–24.9 kg/m2, normal oral glucose tolerance test [OGTT], HbA1c, and IHTG content); ii) obese with normal IHTG content (OB-NL; defined as BMI 30–49.9 kg/m2, normal OGTT, HbA1c, and IHTG content); and iii) obese with NAFLD (OB-NAFLD); defined as BMI 30–49.9 kg/m2, abnormal OGTT and/or HbA1c and hepatic steatosis). We hypothesized that: i) AT proinflammatory immune cell subsets, AT gene expression of cytokines and plasma cytokine concentrations would progressively increase from LEAN to the OB-NL to the OB-NAFLD group; ii) AT proinflammatory macrophages and T cells would be negatively associated with hepatic and skeletal muscle insulin sensitivity (assessed by using the hyperinsulinemic-euglycemic clamp procedure in conjunction with stable isotopically labeled glucose tracer infusion); and iii) exosomes derived from plasma and SAAT obtained from OB-NAFLD participants, but not LEAN or OB-NL participants, would impair insulin signaling in human myotubes and mouse hepatocytes.
Methods
Study participants
Seventy men and women participated in this study (14 men and 56 women; age 38 ± 1 years old) from May 2016 to April 2020, which was conducted in the Clinical Translational Research Unit (CTRU) at Washington University School of Medicine in St. Louis, MO (Supplementary Figure 1). Some of data reported here were obtained from a subset of subjects as part of their participation in another study.24 Written informed consent was obtained from all subjects before their participation in this study, which was approved by the Institutional Review Board at Washington University School of Medicine in St. Louis, MO.
All participants completed a comprehensive screening evaluation, including a medical history and physical examination, standard blood tests, HbA1c, an OGTT and assessment of IHTG content by using magnetic resonance imaging (MRI) to determine eligibility for each study cohort based on the following inclusion criteria: i) LEAN had BMI 18.5–24.9 kg/m2, IHTG content ≤4%, serum TG concentration <150 mg/dL, fasting plasma glucose concentration <100 mg/dL, 2-hr OGTT plasma glucose concentration ≤140 mg/dL, and HbA1c ≤5.6%; ii) OB-NL had BMI 30.0–49.9 kg/m2, IHTG content ≤4%, serum TG concentration <150 mg/dL, fasting plasma glucose concentration <100 mg/dL, 2-hr OGTT plasma glucose concentration ≤140 mg/dL, and HbA1c ≤5.0%; and iii) OB-NAFLD had BMI 30–49.9 kg/m2, IHTG content ≥5.6% and HbA1c 5.7%−6.4% or fasting plasma glucose concentration 100–125 mg/dL or 2-hr OGTT plasma glucose concentration 140–199 mg/dL. Potential participants who had a history of diabetes or liver disease other than NAFLD, were taking medications that could affect metabolism, or consumed excessive amounts of alcohol (>21 units/wk for men and >14 units/wk for women) were excluded.
We evaluated whether plasma and SAAT-derived exosomes from the OB-NAFLD group can induce insulin resistance in human skeletal muscle myotubes and mouse hepatocytes by studying a subset of participants in whom there was an adequate amount of stored plasma to isolate exosomes (9 LEAN, 8 OB-NL and 7 OB-NAFLD) and by obtaining fresh SAAT for exosome isolation in an additional 9 OB-NL and 6 OB-NAFLD participants (participant characteristics are provided in Supplementary Tables 1 and 2).
Body composition analyses
Total body fat and fat-free mass (FFM) were determined by using dual-energy X-ray absorptiometry. Intra-abdominal AT (IAAT) and SAAT volumes and IHTG content were assessed by using MRI.
Metabolic testing
Serial 24-h plasma cytokine concentrations and hyperinsulinemic-euglycemic clamp procedure.
Subjects were admitted to the CTRU at 1700 h for ~48 hours and consumed a standard meal between 1800 h and 1900 h. At 0630 h the next morning (day 2), a catheter was inserted into an antecubital vein and blood samples were obtained every hour from 0700 h to 2300 h and at 0500 h and 0700 h the following day (day 3). Meals were provided at 0700 h, 1300 h, and 1900 h. Each meal contained one-third of the participant’s energy requirements and were comprised of 50% carbohydrate, 35% fat, and 15% protein. A hyperinsulinemic-euglycemic clamp procedure, in conjunction with stable isotopically labeled glucose tracer infusion, was then conducted to assess hepatic and skeletal muscle insulin sensitivity. Subcutaneous abdominal AT was obtained from the periumbilical area during the basal period of the clamp procedure. Details of all procedures are provided in the Supplementary materials.
Sample analysis and calculations
Plasma glucose concentration was determined by using an automated glucose analyzer. Plasma insulin, HbA1c, liver enzymes and lipid profile were measured in the Washington University Core Laboratory for Clinical Studies. Plasma cytokine concentrations were determined by using a Luminex 200 analyzer (Luminex Corp., Austin, TX). Plasma 24-h cytokine concentration area under the curve (AUC) was calculated by using the trapezoidal method25 to provide a comprehensive assessment of daily plasma cytokine levels. Hepatic and skeletal muscle insulin sensitivity were determined as described in the Supplementary material.
Exosomes were isolated from plasma and SAAT explant cultures and incubated with human skeletal muscle myotubes and mouse primary hepatocytes to assess insulin-stimulated phosphorylation of serine 473 of Akt as described in the Supplementary materials. The studies in mice were approved by the Washington University Animal Studies Committee. Standard methods were used for AT RNA sequencing, AT stromal vascular fraction isolation, in vitro stimulation and intracellular cytokine staining of isolated AT immune cells, flow cytometry and mass cytometry, as described in the Supplementary materials.
Statistical Analysis
One-way analysis of variance was used to compare subject characteristics and outcomes measured at a single time point among LEAN, OB-NL and OB-NAFLD groups with Fisher’s least significant difference post-hoc procedure used to identify significant mean differences where appropriate. Polynomial contrasts were performed for selected variables to describe the linear trend from the LEAN to the OB-NL to the OB-NAFLD group. Plasma cytokine profiles over 24-h were analyzed by using linear mixed model analysis with time and group as fixed factors. Outliers in plasma cytokine concentrations in the 24-h profiles (defined as >3 standard deviations from the mean) were winsorized, and those values were adjusted to match the next less extreme value26; this occurred in <2% of values for each cytokine. Relationships among insulin sensitivity and the proportion of proinflammatory and anti-inflammatory macrophages and proinflammatory T cells were evaluated by using linear and nonlinear regression analysis with the best fit to the data reported. Data are reported as means ± SEM unless otherwise noted. Statistical analyses were performed by using SPSS (version 25, IBM, Armonk, NY).
Based on the previously reported inter-individual variability in total macrophage number per gram of SAAT and the proportion of total SAAT macrophages that are proinflammatory,27 we estimated that 28 subjects per group would be needed to detect differences in total macrophage number of 10,900 cells/gram SAAT and percent proinflammatory macrophages of 12.3% between the OB-NL and OB-NAFLD groups using a two-sided test with ≥90% power and an α value of <.05.
Results
Body composition and metabolic characteristics of LEAN, OB-NL and OB-NAFLD groups
Body mass index, percent body fat and SAAT volume were not different in the OB-NL and OB-NAFLD groups, but IAAT volume and IHTG content were much greater in the OB-NAFLD than in the OB-NL group (Table 1). Although IAAT volumes were greater in the OB-NL than the LEAN group, there was no difference in IHTG content between groups. Fasting plasma glucose, plasma glucose 2 hours after glucose ingestion, plasma TG, and HbA1c were higher in the OB-NAFLD group than in both the OB-NL and LEAN groups, without any differences between the two groups with normal IHTG content (Table 1). Plasma alanine aminotransferase and aspartate aminotransferase concentrations were higher in the OB-NAFLD than in the OB-NL group (Table 1). Fasting plasma insulin concentration progressively increased and both hepatic insulin sensitivity (assessed as the Hepatic Insulin Sensitivity Index [HISI], which is the reciprocal of the product of basal endogenous glucose production rate and basal plasma insulin concentration) and skeletal muscle insulin sensitivity (assessed as the glucose disposal rate relative to plasma insulin concentration during the hyperinsulinemic-euglycemic clamp procedure) progressively decreased from the LEAN to the OB-NL to the OB-NAFLD group (Table 1). Hepatic and skeletal muscle insulin sensitivity were lower in the OB-NL group than the LEAN group, even though both groups had normal IHTG content.
Table 1.
Body composition and metabolic characteristics of participants
| LEAN (n=14) | OB-NL (n=28) | OB-NAFLD (n=28) | |
|---|---|---|---|
|
| |||
| Body mass index (kg/m2) | 22.9 ± 0.4 | 37.7 ± 0.9a | 39.2 ± 0.9a |
| Body fat (%) | 29.4 ± 1.6 | 48.0 ± 1.1a | 48.6 ± 0.8a |
| IHTG content (%) | 1.8 ± 0.2 | 2.4 ± 0.2 | 17.5 ± 1.7ab |
| IAAT volume (cm3) | 457 ± 53 | 938 ± 89a | 1,928 ± 141ab |
| SAAT volume (cm3) | 963 ± 94 | 3,701 ± 181a | 3,798 ± 237a |
| Alanine aminotransferase (U/L) | 15 ± 2 | 16 ± 1 | 37 ± 8ab |
| Aspartate aminotransferase (U/L) | 19 ± 2 | 17 ± 1 | 26 ± 3b |
| Fasting triglyceride (mg/dL) | 72 ± 8 | 69 ± 4 | 135 ± 8ab |
| HbA1c (%) | 5.0 ± 0.1 | 5.1 ± 0.1 | 5.5 ± 0.1ab |
| Fasting insulin (μU/mL) | 5.2 ± 0.5 | 12.3 ± 1.3a | 27.8 ± 3.0ab |
| Fasting glucose (mg/dL) | 86 ± 1 | 88 ± 1 | 97 ± 2ab |
| Glucose at 2 h of OGTT (mg/dL) | 98 ± 5 | 107 ± 3 | 158 ± 4ab |
| HISI [1,000 / (μmol/kg FFM/min) × (μU/mL)] | 10.9 ± 1.2 | 5.6 ± 0.4a | 2.9 ± 0.2ab |
| Glucose Rd/Insulin (nmol/kg FFM/min)/(μU/mL) | 683 ± 65 | 383 ± 33a | 206 ± 17ab |
Data are expressed as mean ± SEM.
P ≤ .05 value significantly different from the corresponding value in the LEAN group.
P ≤ .05 value significantly different from the corresponding value in the OB-NL group.
Proinflammatory macrophages are increased in subcutaneous abdominal adipose tissue in people with obesity
To help characterize ATMs as either proinflammatory (“M1-like”) or anti-inflammatory (“M2-like”) subsets, we used mass cytometry to assess the expression of macrophage-related proteins on the surface of SVF cells from four participants (2 LEAN and 2 OB-NAFLD). Consistent with a previous study,13 ATMs were classified into two subsets: i) CD206+ CD11c− macrophages; and ii) CD206+ CD11c+ macrophages (Supplementary Figure 2A). We also identified a third subset of CD64 positive cells, but did not categorize those cells as macrophages because they either did not express or expressed very low levels of markers that are characteristic of known macrophage subsets (CD206, HLA-DR, CD9, and CD163) (Supplementary Figure 2B) and have been characterized as monocytes, not macrophages.13 The CD206+ CD11c− subset tended to express higher levels of markers associated with antiinflammatory macrophages (CD206 and CD163), whereas the CD206+ CD11c+ subset tended to express higher levels of the co-stimulatory marker CD86 and contained a population of CD9+ cells, which is a marker associated with crown-like structure macrophages.28 Within each macrophage subset, cells from LEAN and OB-NAFLD participants tended to express similar levels of the other surface markers. Based on this analysis, we defined CD206+ CD11c− ATMs as being anti-inflammatory (M2-like) and CD206+ CD11c+ ATMs as being proinflammatory (M1-like), and used these markers for all subsequent flow cytometric analyses. Nonetheless, it is likely that the M1-like and M2-like ATM subsets comprise heterogeneous mixtures of cells with both M1-like and M2-like features.
The number of total, M1-like and M2-like macrophages increased progressively from the LEAN to the OB-NL to the OB-NAFLD group, and the number of total macrophages and M1-like macrophages were greater in the OB-NAFLD than the OB-NL group (Figure 1A). In addition, the proportion of total macrophages that were M1-like progressively increased, whereas the proportion that were M2-like progressively decreased, from the LEAN to the OB-NL to the OB-NAFLD group, and the mean values in the OB-NAFLD group were significantly different than the mean values in the OB-NL group (Figure 1B, Supplementary Figure 3A). Accordingly, the ratio of M1-like to M2-like macrophages increased progressively from the LEAN to the OB-NL to the OB-NAFLD group. The proportion of M1-like macrophages and the M1-like:M2-like ratio among all subjects were negatively associated, whereas the proportion of M2-like macrophages was positively associated, with both hepatic (Figure 1C) and muscle (Figure 1D) insulin sensitivity. Adipose tissue monocytes, which can differentiate into macrophages, were not different between the LEAN, OB-NL and OB-NAFLD groups (Supplementary Figure 4). However, the number of classical dendritic cells, which are another myeloid cell subset that has important functions in initiating immune responses via antigen presentation to T cells, were lower in the LEAN group than the OB-NL and OB-NAFLD groups, without a difference between the two obese groups (Supplementary Figure 4).
Figure 1.
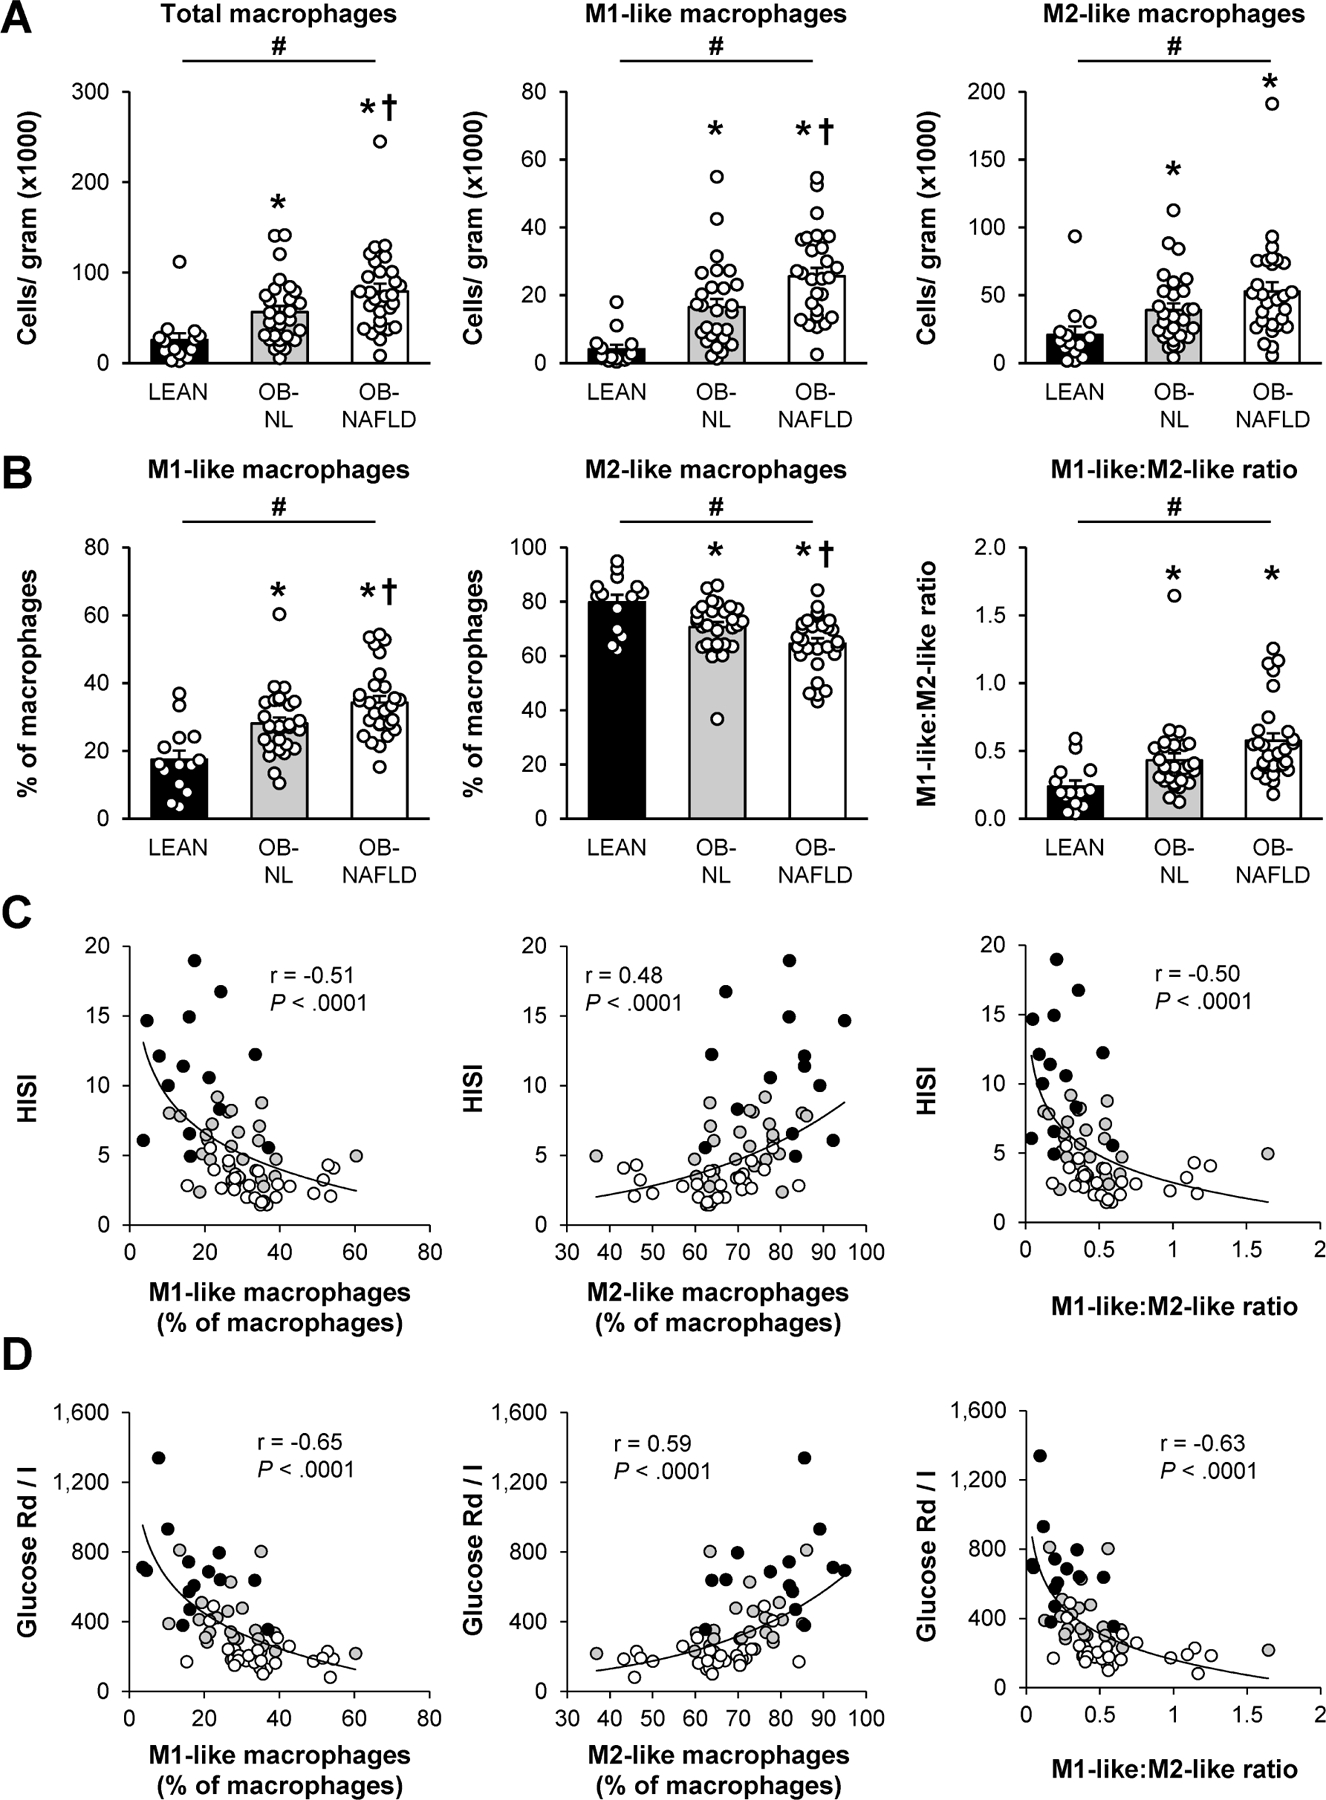
Macrophages in subcutaneous abdominal adipose tissue. (A and B) Number of total, pro-inflammatory (M1-like), and anti-inflammatory (M2-like) macrophages per gram of tissue (A) and M1-like and M2-like macrophages as a percentage of total macrophages and the M1-like:M2-like ratio (B) in SAAT in LEAN, OB-NL and OB-NAFLD groups. (C and D) Relationship between the hepatic (HISI; C) and skeletal muscle (Glucose Rd/I; D) insulin sensitivity and M1-like and M2-like macrophages as a proportion of total macrophages and the M1-like:M2-like ratio in LEAN (black circles), OB-NL (grey circles) and OB-NAFLD (white circles) participants. The values in (A) and (B) are means ± SEM. *Value significantly different from the LEAN value, P < .05. †Value significantly different from the OB-NL value, P < .05. #linear trend, P < .05.
Increase in memory T cells in adipose tissue from OB-NAFLD participants
There were no differences in the total number of cells within T cell subsets (CD4 T cells, CD8 T cells, naïve CD4 T cells, memory CD4 T cells, naïve CD8 T cells, and memory CD8 T cells) or NK cells per gram of SAAT among the LEAN, OB-NL and OB-NAFLD groups (Figure 2A, Supplementary Figure 4). However, when analyzed as proportions within T cell subgroups, the percentage of memory CD4 and CD8 T cells were greater in the OB-NAFLD than in the OB-NL and LEAN groups, without a difference between the LEAN and OB-NL groups, whereas the percentage of naïve CD4 and CD8 T cells were lower in the OB-NAFLD than in the OB-NL and LEAN groups (Figure 2A, Supplementary Figure 3B). Among memory CD4 T cells, we found progressive increases in the number of Th1 cells and the proportion of Th1 cells within CD4 T cells from the LEAN to the OB-NL to the OB-NAFLD groups, and both the number and proportion of Th1 cells were greater in the OB-NAFLD than in the OB-NL and LEAN groups (Figure 2B). Consistent with these findings, the proportion of CD4 T cells that produced IFN-γ, the signature cytokine of Th1 cells, progressively increased from the LEAN to the OB-NL to the OB-NAFLD groups, and was greater in the OB-NAFLD than the OB-NL and LEAN groups (Figure 2C, Supplementary Figure 3C). There were no differences in the total number of Th17 cells or the proportion of CD4 T cells that were Th17 cells among the three groups (Figure 2B). However, the proportion of CD4 T cells that produced IL-17 was lower in the OB-NL and OB-NAFLD than in the LEAN group (Figure 2C, Supplementary Figure 5B). Within CD8 T cells, the proportion that produced IFN-γ progressively increased from the LEAN to the OB-NL to the OB-NAFLD group and was greater in the OB-NAFLD than the OB-NL and LEAN groups (Figure 2C). A very small percentage of stimulated CD8 T cells produced IL-17 and the proportion that produced IL-17 was lower in the OB-NAFLD than in the LEAN group (Figure 2C). The number of AT CD69+ CD4 T cells, which are comprised of recently activated and tissue-resident memory T cells, was greater in the OB-NAFLD group than in the OB-NL and LEAN groups (Figure 2D). The number of CD69+ CD8 T cells and CD69+ NK cells increased progressively from the LEAN to the OB-NL to the OB-NAFLD group and were significantly greater in the OB-NAFLD than in the LEAN group, without a difference between the two obese groups (Figure 2D).
Figure 2.
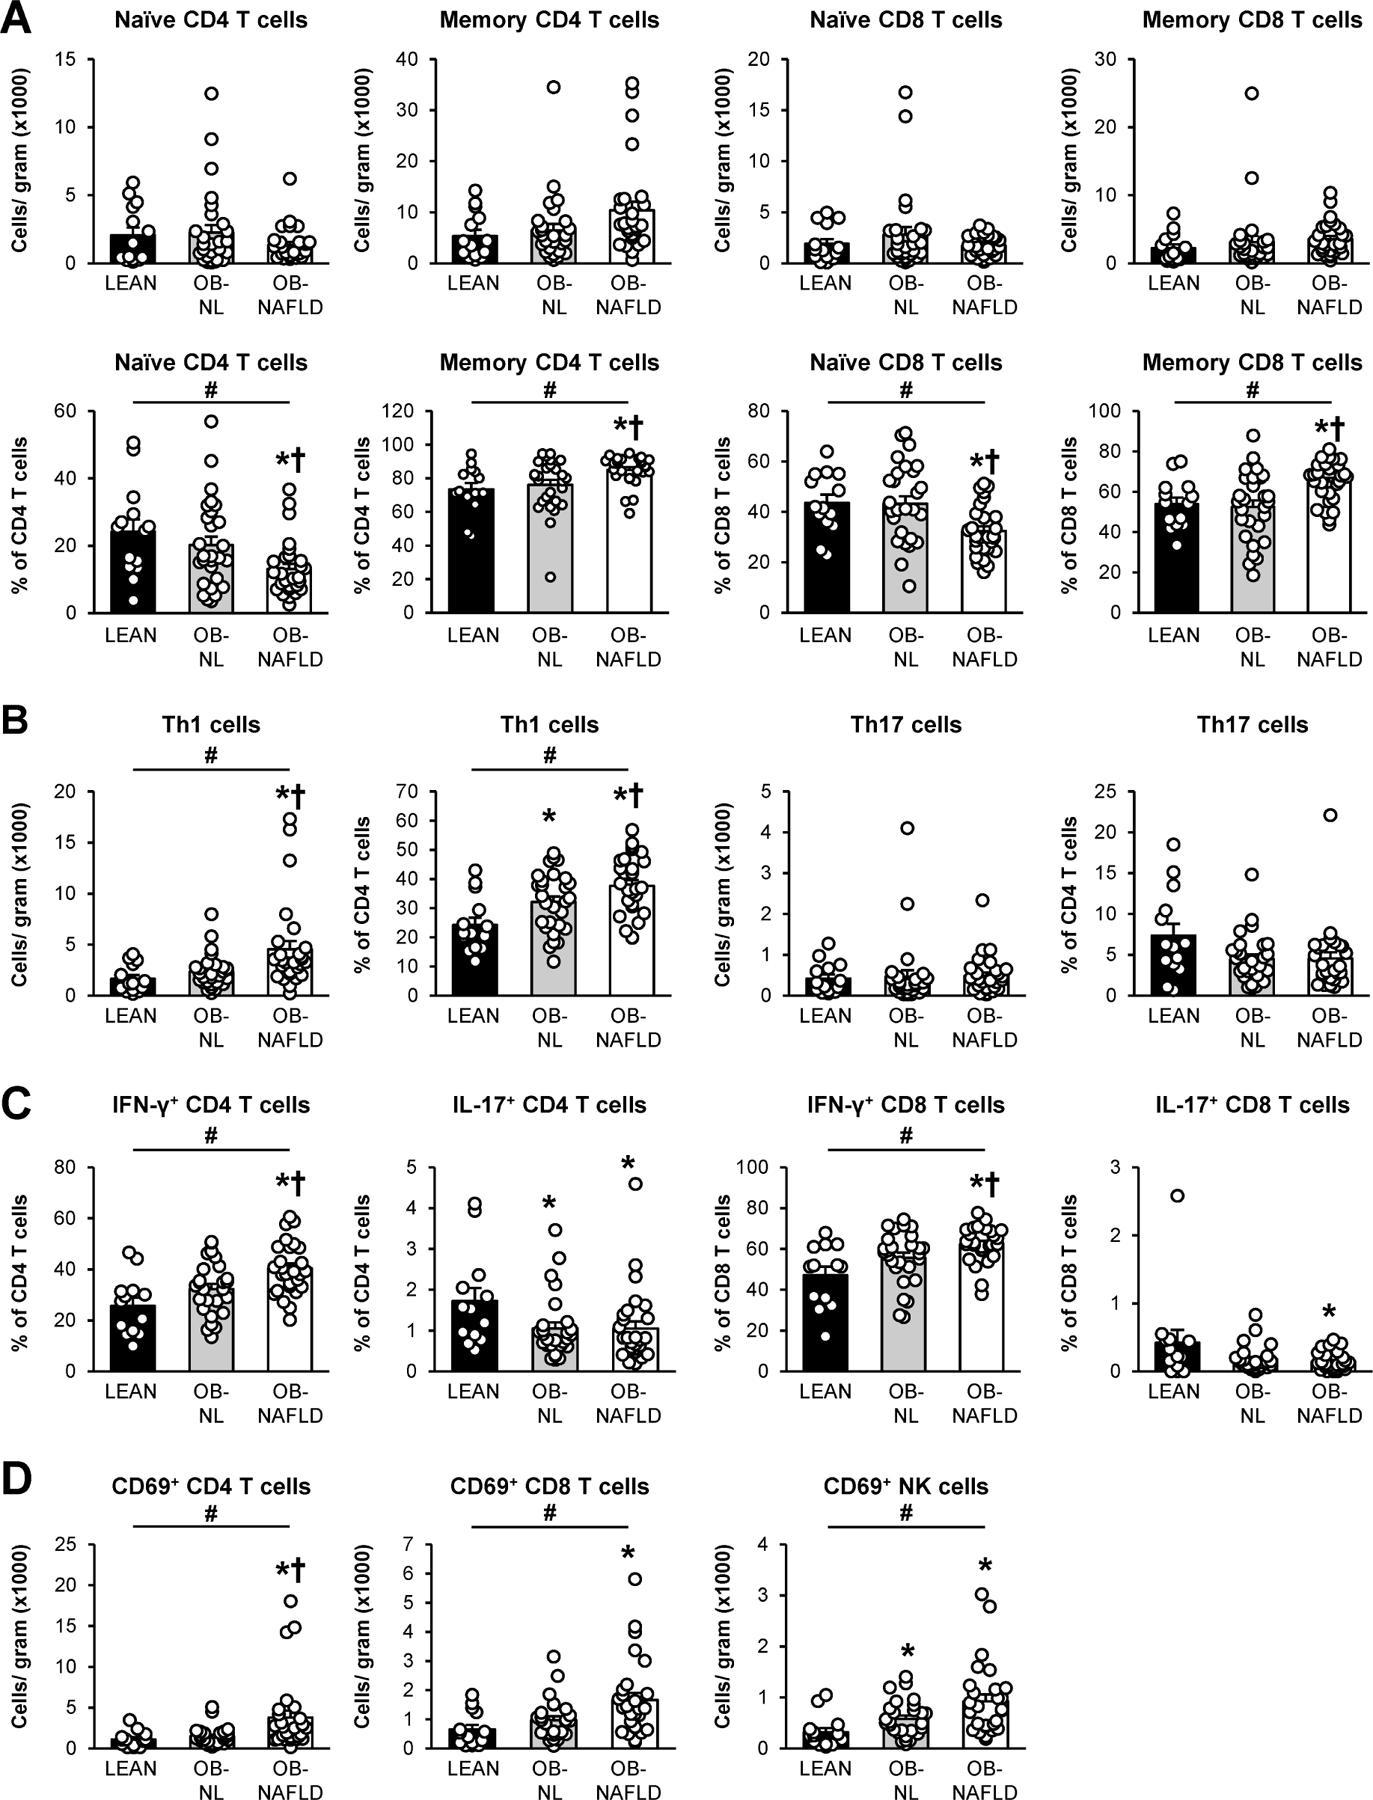
T cells in subcutaneous abdominal adipose tissue. (A) Absolute numbers (top row) and proportions (bottom row) of naïve and memory CD4 and CD8 T cells. (B) Absolute Th1 and Th17 cell numbers and proportions within total CD4 T cells. (C) Frequencies of IFN-γ and IL-17 positive cells within CD4 (left two graphs) and CD8 (right two graphs) T cells, following in vitro stimulation. (D) Absolute numbers of CD69+ CD4, CD8 and NK cells. Values are means ± SEM. *Value significantly different from the LEAN value, P < .05. †Value significantly different from the OB-NL value, P < .05. #linear trend, P < .05.
We then evaluated the relationship between insulin sensitivity and the subgroups of proinflammatory T cells that showed significantly greater numbers or percentages in the OB-NAFLD than the OB-NL group (i.e. % memory CD4 T cells, % memory CD8 T cells, total and % Th1 T cells, % IFN-γ+ CD4 and CD8 T cells, and total CD69+ CD4 T cells). There were statistically significant, but weak, inverse correlations between muscle insulin sensitivity and these T cell subgroups (Supplementary Figure 6).
No significant differences were identified among the three groups of participants in the numbers of AT neutrophils, B cells, eosinophils, or mast cells (Supplementary Figure 4). There were also no differences among groups in the number or proportion of Th2 cells (Supplementary Figure 5A), the proportion of CD4 T cells that produced IL-22 alone or in combination with IL-17, or in the proportion of CD4 and CD8 T cells that produced TNF-α or IL-10 (Supplementary Figure 5B).
Adipose tissue gene expression of markers of inflammation are increased in OB-NAFLD
Adipose tissue expression of genes that encode for proinflammatory proteins, SERPINE1, TNF, IL6, CCL2, CCL3, CCL5, and CXCL16, macrophage (CD68 and MRC1) and lipid-associated macrophage (TREM2) markers, and an anti-inflammatory protein (IL10) progressively increased from the LEAN to the OB-NL to the OB-NAFLD group, but no difference in IL1B expression among groups (Figure 3). Moreover, the expression of genes that encode for SERPINE1, CCL3, CCL5, CXCL16, CD68, MRC1 and TREM2 were greater in the OB-NAFLD than in the OB-NL group and greater in the OB-NL than in the LEAN group (Figure 3). The expression of genes that encode for several other proinflammatory proteins (TNF, IL-6 and CCL2) were greater in the OB-NL and OB-NAFLD groups than in the LEAN group, but not different between the two obese groups.
Figure 3.
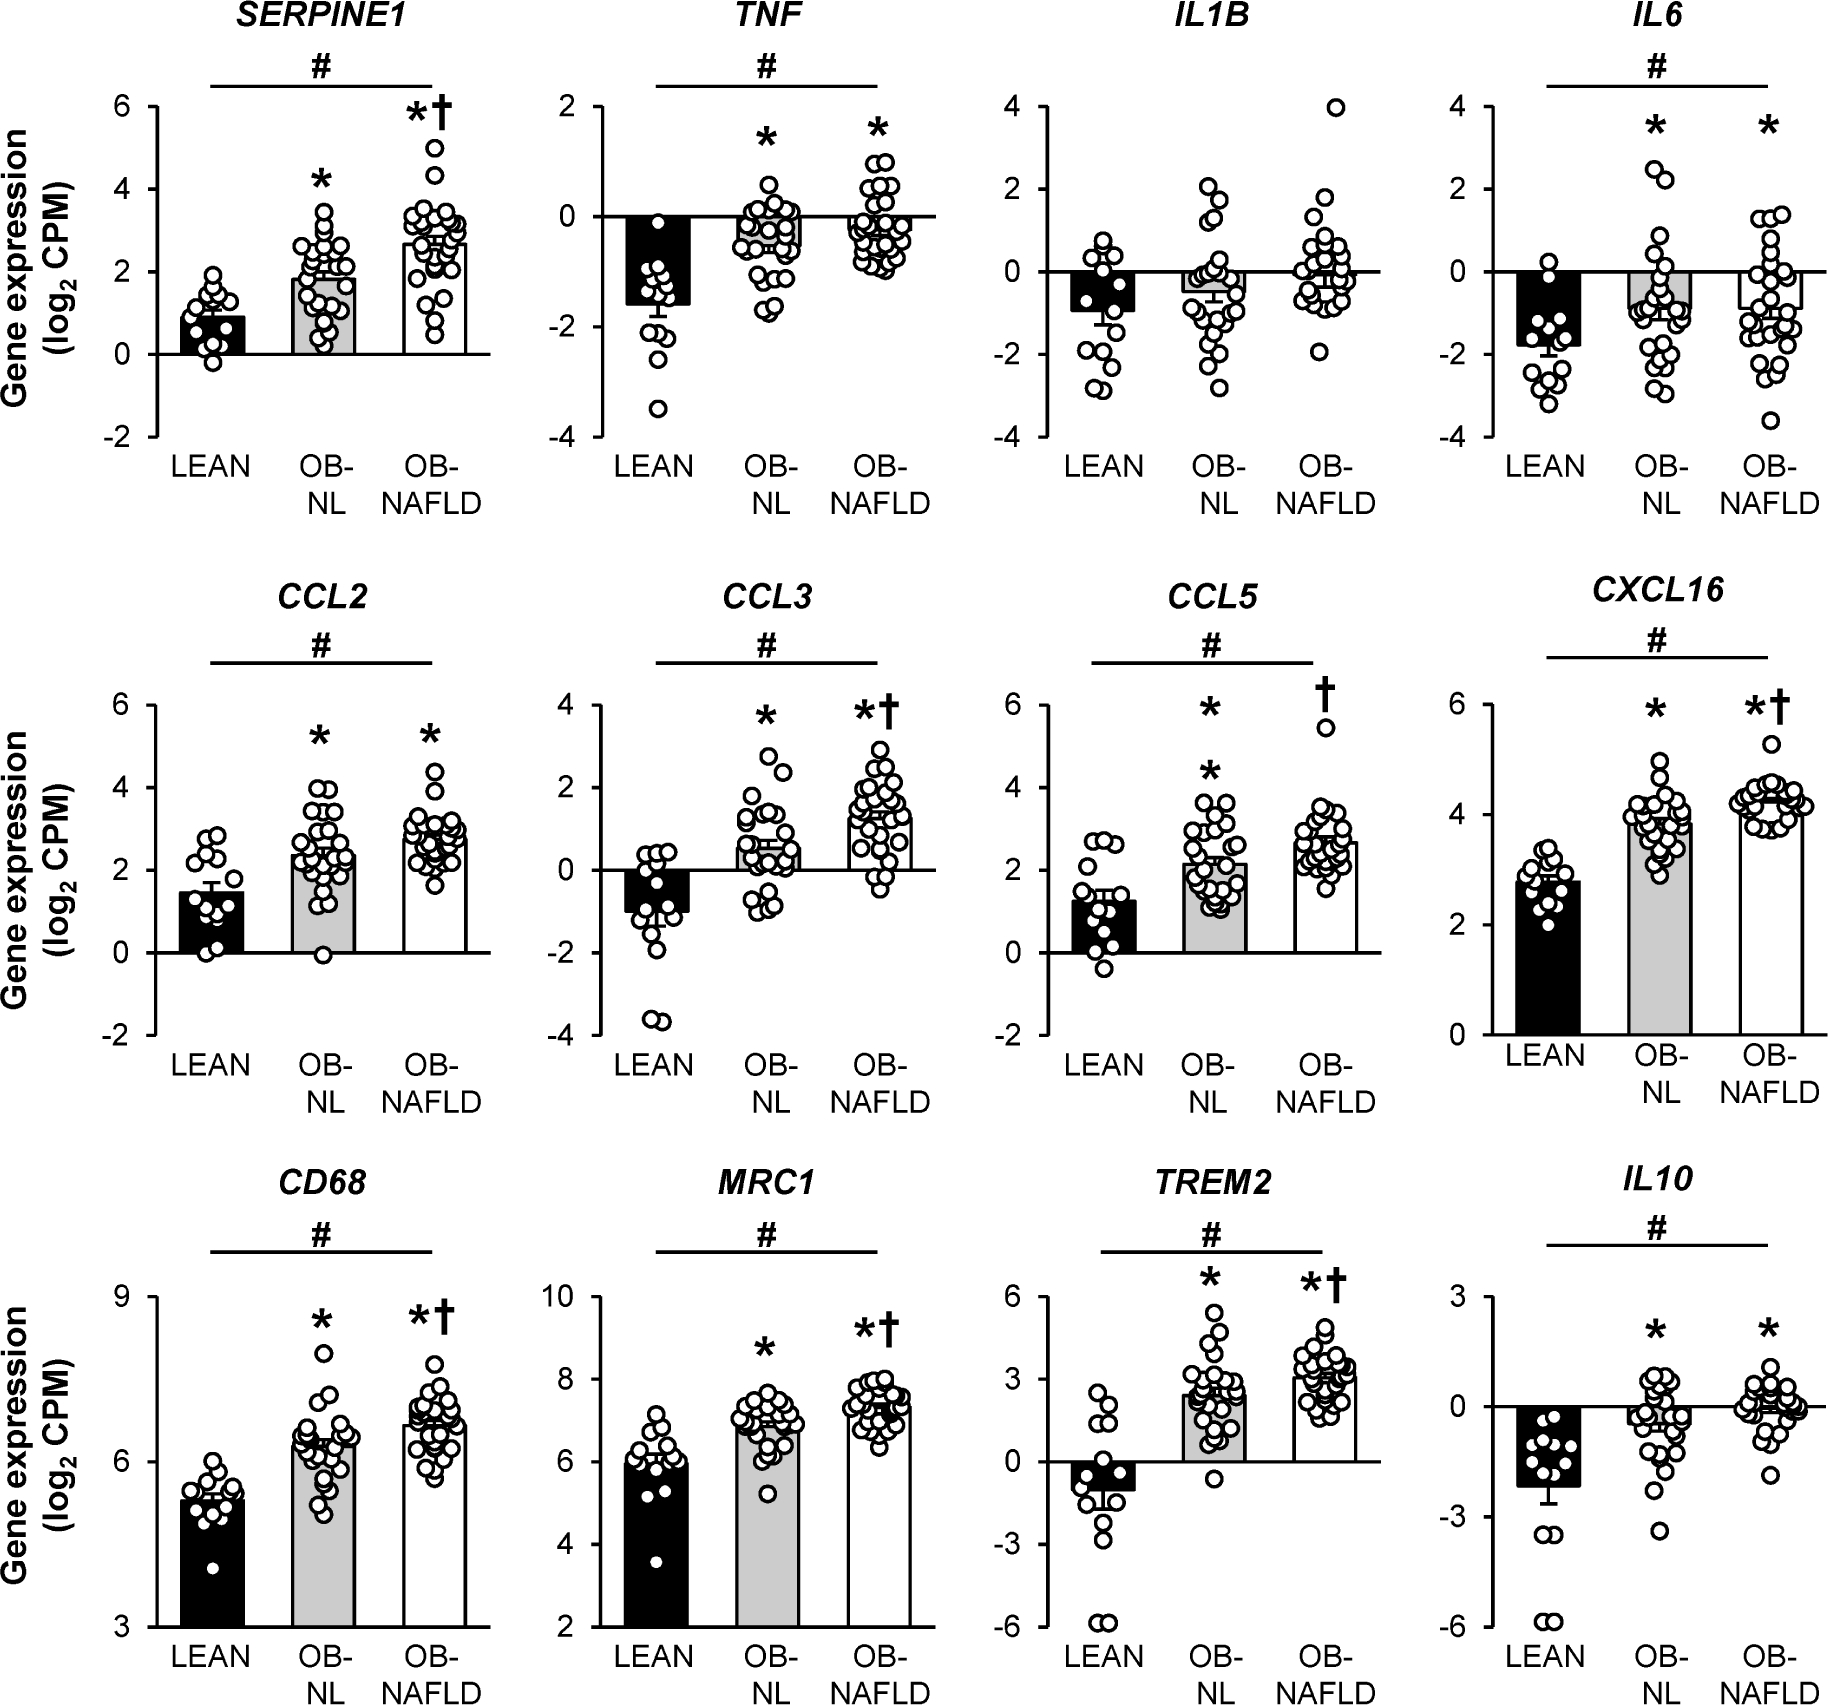
Gene expression of markers of inflammation in subcutaneous abdominal adipose tissue. Expression of genes encoding for cytokines [PAI-1 (encoded by SERPINE1), TNF-α, IL-1β, IL-6, CCL2, CCL3, CCL5, CXCL16, IL-10] and for proteins highly expressed in macrophages (CD68 and CD206, encoded by MRC1) and lipid-associated macrophages (TREM2) in SAAT in LEAN, OB-NL and OB-NAFLD groups. Values are means ± SEM *Value significantly different from the LEAN value, P < .05. †Value significantly different from the OB-NL value, P < .05. #linear trend, P < .05.
Concentrations of plasma PAI-1 but not cytokines, are greater in the OB-NAFLD than the OB-NL group
To provide a more comprehensive assessment of circulating cytokines than would be obtained by fasting samples only, we evaluated plasma cytokine concentrations serially for 24-h (every hour from 0700 h to 2300 h and then at 0500 h and 0700 h the next day). With the exception of the diurnal variation in plasma PAI-1 concentrations, plasma TNF-α, IL-6, IFN-γ, CCL2, CCL5, IL-1β, and IL-17 concentrations were stable throughout the 24-h blood sampling study and were not affected by meals (consumed at 0700 h, 1300 h, and 1900 h) (Figure 4). The 24-h plasma TNF-α and CCL2 concentration AUCs were greater in the OB-NL and OB-NAFLD groups than in the LEAN group, without differences between the two obese groups. The 24-h plasma IL-6, IFN-γ, CCL5, IL-1β, and IL-17 concentration AUCs were not significantly different between groups. Plasma PAI-1 progressively increased from the LEAN to the OB-NL to the OB-NAFLD group and the 24-h AUC was greater in the OB-NAFLD than in both OB-NL and LEAN groups (Figure 4). Because of the unique differences in plasma PAI-1 concentration among the three groups of participants, which was not observed with the other plasma cytokines, we evaluated the relationship between 24-h plasma PAI-1 AUC and insulin sensitivity among all participants. There was an inverse curvilinear correlation between 24-h plasma PAI-1 AUC and both hepatic and skeletal muscle insulin sensitivity (Figure 5A). In addition, there was a positive correlation between markers of ATMs (expression of CD68 and percentage of M1-like ATMs) and both adipose tissue expression of SERPINE1 and 24-h plasma PAI-1 AUC (Figures 5B and 5C).
Figure 4.
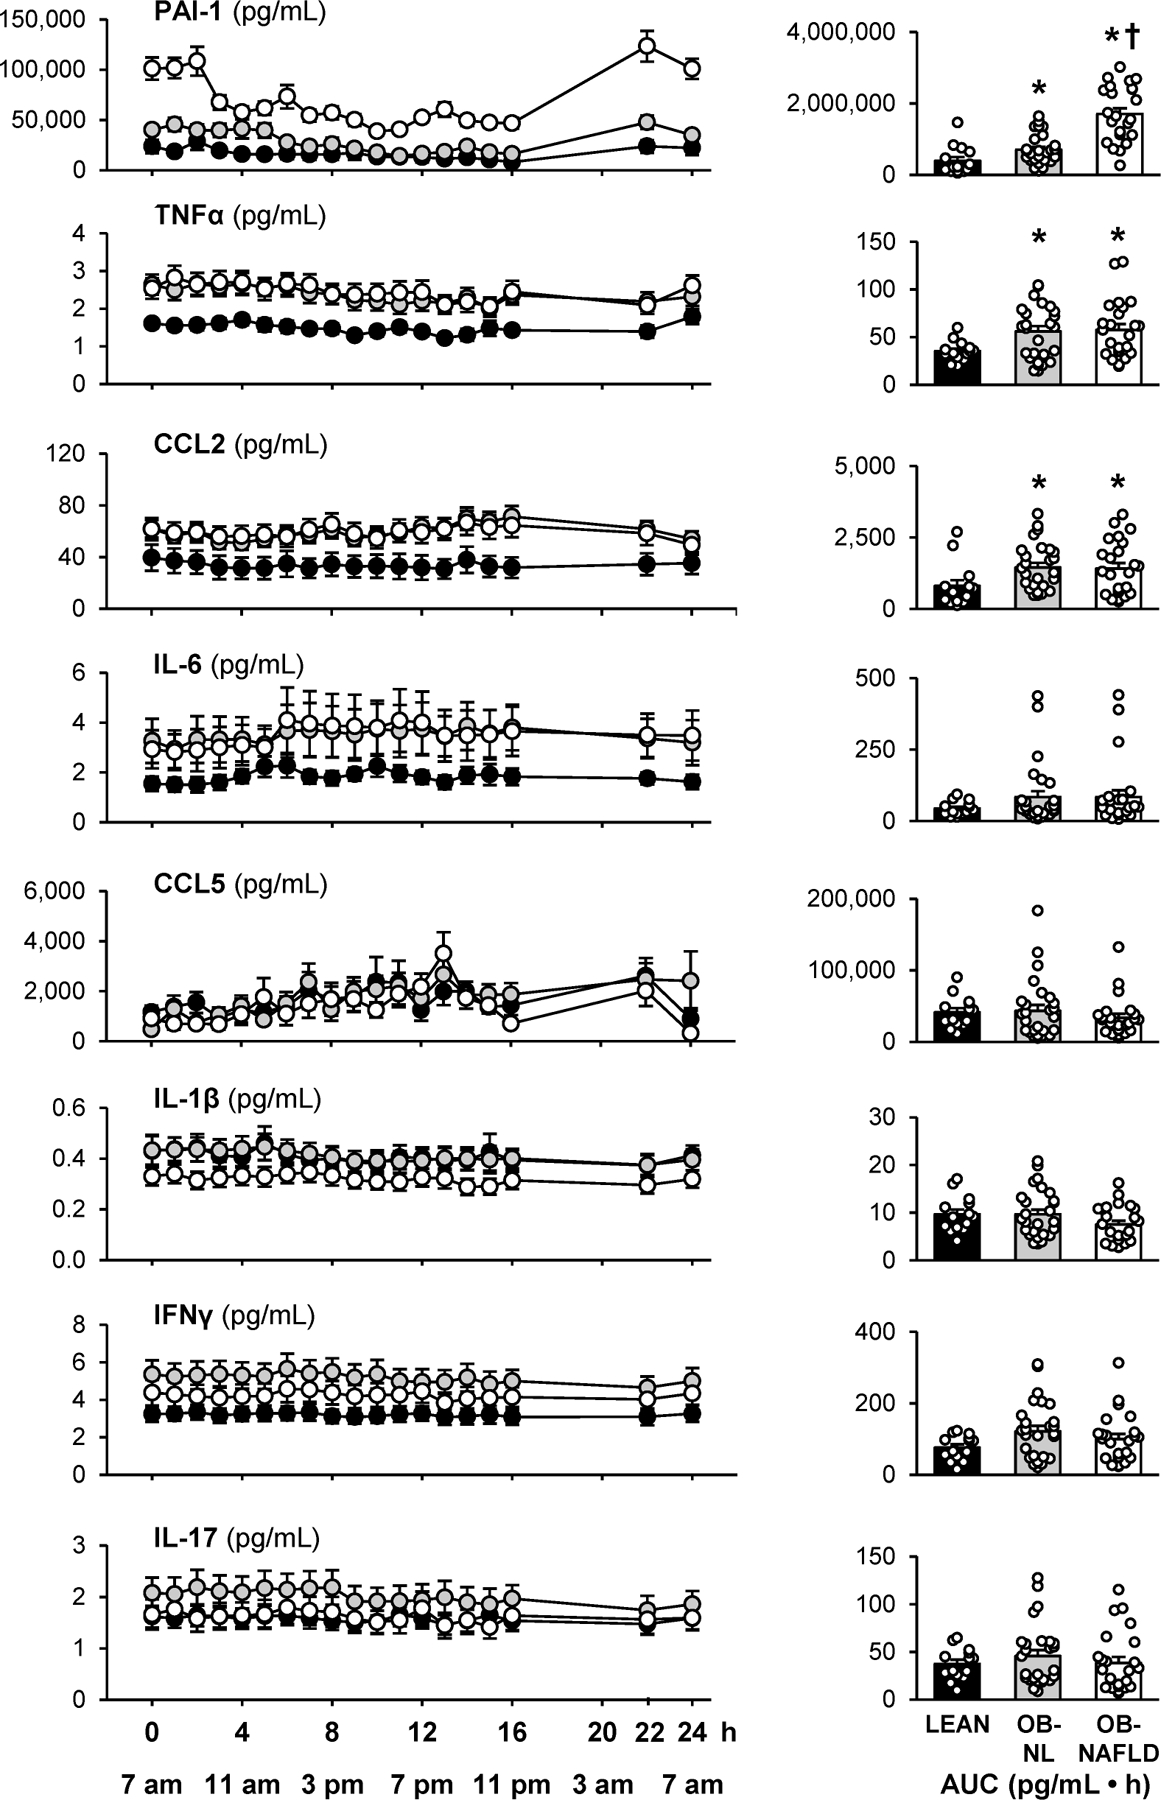
24-h plasma cytokine profiles. Plasma cytokine concentrations determined hourly between 7 am and 11 pm on day 1 and at 5 am and 7 am on day 2 (left panels) and 24-h AUCs (right panels) in LEAN, OB-NL and OB-NAFLD groups. Values are means ± SEM. *Value significantly different from the LEAN value, P < .05. †Value significantly different from the OB-NL value, P < .05.
Figure 5.

Relationships among plasma PAI-1 24-h area-under-the-curve (AUC) and both hepatic (HISI) and skeletal muscle (Glucose Rd/I) insulin sensitivity (A), adipose tissue SERPINE1 expression and both adipose tissue CD68 expression and M1-like macrophages (B), and plasma PAI-1 24-h AUC and both adipose tissue CD68 expression and M1-like macrophages (C) in LEAN (black circles), OB-NL (grey circles) and OB-NAFLD (white circles) participants.
Plasma and adipose tissue exosomes from OB-NAFLD induce insulin resistance in myotubes and hepatocytes
Exosomes isolated from plasma and SAAT explant cultures were used to assess their effects on insulin action in myotubes and hepatocytes. The reliability of our isolation procedure was verified by measuring particle size (Supplementary Figure 7A) and the expression of exosome-specific protein markers (Supplementary Figures 7B and 7C). Plasma exosome concentration was three-fold higher in the OB-NAFLD group than in the OB-NL and LEAN groups (7.0 ± 1.5 vs 2.5 ± 0.3 and 2.0 ± 0.3 1010 particles/mL, respectively; P < .01). We detected protein markers of AT-derived exosomes in plasma exosome samples (Supplementary Figure 7D), demonstrating that the plasma exosomes originated, at least in part, from AT. Compared with exosomes derived from the LEAN and OB-NL groups, plasma and SAAT-derived exosomes from the OB-NAFLD group caused insulin resistance in both myotubes and hepatocytes, demonstrated by impaired insulin signaling (phosphorylation of Akt) (Figures 6A and 6B). Equal concentrations of exosomes were used to treat myotubes and hepatocytes ex vivo in order to evaluate the concentration-independent effects of exosomes on insulin action across study groups. Therefore, it is possible the adverse effects of plasma exosomes on insulin action in the OB-NAFLD group might be more pronounced in vivo because of their higher plasma exosome concentrations. The effects of both plasma and SAAT-derived exosomes on insulin signaling in myotubes and hepatocytes ex vivo correlated directly with skeletal muscle and hepatic insulin sensitivity, respectively, measured in vivo by using the clamp procedure and stable isotopically labeled glucose tracer infusion (Figures 6C and 6D).
Figure 6.
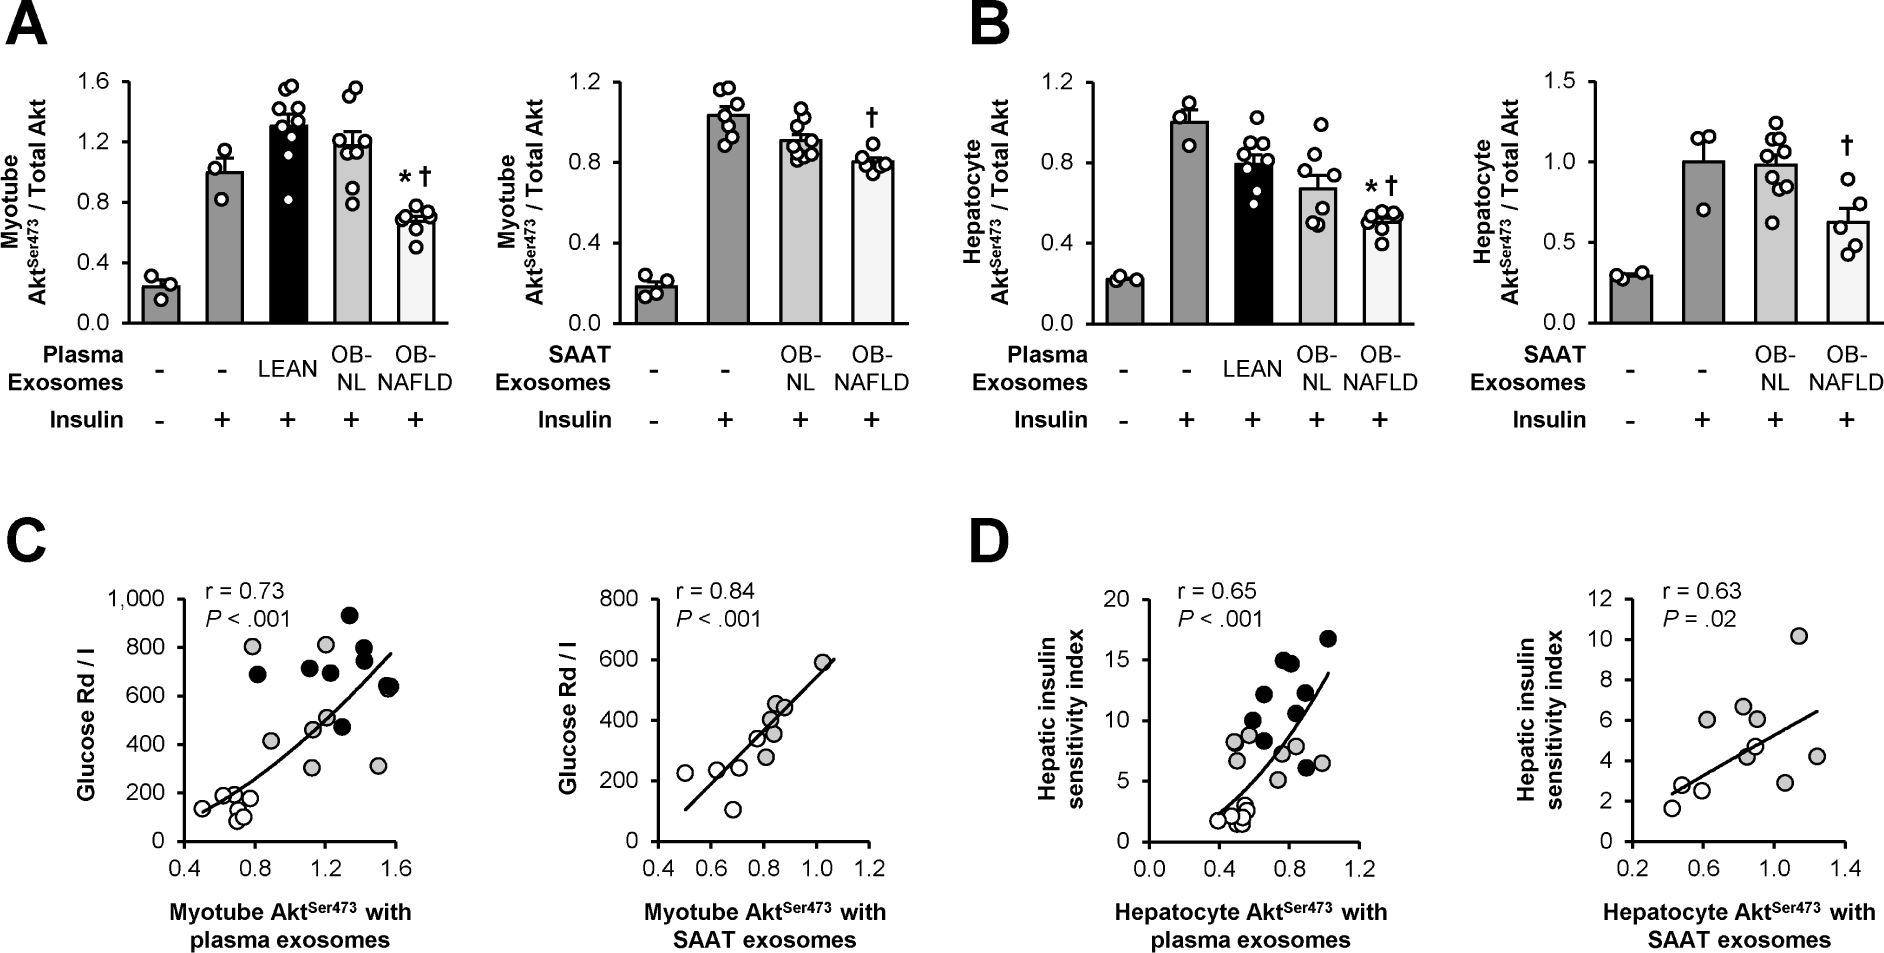
Exosomes and insulin action. (A and B) Insulin-stimulated phosphorylation of serine 473 of Akt in human skeletal muscle myotubes (A) and mouse hepatocytes (B) treated with exosomes isolated from plasma from LEAN, OB-NL and OB-NAFLD participants and SAAT explants from OB-NL and OB-NAFLD participants. (C) Relationship between skeletal muscle insulin sensitivity (glucose Rd/I) and phosphorylation of serine 473 of Akt in myotubes treated with exosomes isolated from plasma and SAAT in LEAN (black circles), OB-NL (grey circles) and OB-NAFLD (white circles) participants. (D) Relationship between the hepatic insulin sensitivity index and phosphorylation of serine 473 of Akt in hepatocytes treated with exosomes isolated from plasma and SAAT in LEAN (black circles), OB-NL (grey circles) and OB-NAFLD (white circles) participants. Values are means ± SEM. *Value significantly different from the LEAN value, P < .05. †Value significantly different from the OB-NL value, P < .05.
DISCUSSION
We conducted in vivo and ex vivo studies to assess the potential importance of SAAT inflammation and exosomes in the pathogenesis of insulin resistance in people with obesity and NAFLD. The immune cell profile and expression of genes involved in inflammation in SAAT, plasma cytokine concentrations and the effect of both plasma and SAAT-derived exosomes on insulin action were evaluated in three rigorously characterized cohorts stratified by adiposity, metabolic health and IHTG content. Our data demonstrate that most proinflammatory immune cells and the expression of proinflammatory genes in SAAT progressively increased from the LEAN to the OB-NL to the OB-NAFLD group. Moreover, these markers of inflammation were often significantly greater in the OB-NAFLD than in the OB-NL group, including: i) the number of total and proinflammatory (M1-like) macrophages and the percentage of macrophages that were M1-like; ii) the number or percentage of activated and memory T cell subsets (memory CD4 and CD8 T cells, IFN-γ-producing CD4 and CD8 T cells, and CD69+ CD4 T cells); and iii) gene expression of proinflammatory cytokines (SERPINE 1, CCL3, CCL5, and CXCL16) and macrophage markers (CD68 and MRC1) and lipid-associated macrophage (TREM2) markers. However, the absolute mean differences in immune cells and gene expression between the OB-NL and the OB-NAFLD groups were small, and there was considerable overlap in individual participant values between the two obese groups. There were no differences in the 24-h plasma cytokine AUCs between the OB-NL and OB-NAFLD groups with the exception of PAI-1, which was much greater in the OB-NAFLD than in the OB-NL and LEAN groups and was inversely correlated with measures of both hepatic and skeletal muscle insulin sensitivity. Both plasma and SAAT exosomes isolated from the OB-NAFLD group impaired insulin action in myotubes and hepatocytes ex vivo. In addition, the percentage of macrophages that were proinflammatory, which are an important source of plasma and AT-derived exosomes, was inversely correlated with both hepatic and skeletal muscle insulin sensitivity. Together, these results demonstrate it is unlikely that SAAT inflammation causes systemic insulin resistance by increasing the release of classical inflammatory cytokines into the circulation. Instead, our data suggest SAAT production and secretion of PAI-1 and exosomes are involved in the pathogenesis of insulin resistance associated with obesity and NAFLD, but we are unable to precisely determine whether these relationships are causal or simply an association.
We found a greater number of total ATMs and M1-like ATMs per gram of SAAT in the OB-NAFLD than the OB-NL group, even though the two groups were matched on body fat mass. Therefore, other factors, independent of fat mass itself, are involved in the accumulation of SAAT ATMs in people with obesity and NAFLD. The factors responsible for the infiltration and polarization of immune cells in AT have been studied in rodent models. Macrophage infiltration increases in response to hypoxia29 and increased rates of lipolysis of adipocyte triglycerides.30 Moreover, increased intra-adipocyte free fatty acid (FFA) flux can cause adipocyte hypoxia by adenine nucleotide translocase (ANT)-2-dependent uncoupling of mitochondrial respiration.31 In addition, increases in CD8 T cells and CD4 Th1 cells in obese rodents increase the secretion of chemokines that recruit circulating monocytes to AT and promote their differentiation into macrophages12, 32, which are then polarized toward a proinflammatory state by IFN-γ.33 The release of cytokines from M1-like macrophages also increases macrophage number in a positive, feed-forward manner by increasing monocyte infiltration and stimulating the proliferation of tissue-resident macrophages.34–36 Together, these data suggest a complex interplay among AT FFA flux, oxygenation, and immune cells that drive the recruitment and accumulation of proinflammatory ATMs.
Both hepatic and skeletal muscle insulin sensitivity were lower in the OB-NAFLD than the OB-NL group. Although the number and percentage of M1-like macrophages and many proinflammatory T cell subsets and SAAT expression of proinflammatory genes were greater in the OB-NAFLD than the OB-NL group, these differences did not translate into differences in classical plasma cytokine concentrations. Instead, SAAT gene expression of SERPINE1, which encodes for PAI-1, progressively increased from the LEAN to the OB-NL to the OB-NAFLD groups, and plasma PAI-1 24-h AUC was inversely associated with hepatic and muscle insulin sensitivity. These findings are consistent with the results from previous studies that found plasma PAI-1 concentrations are increased in people with NAFLD.37 PAI-1 is produced by adipocytes38, 39 and ATMs38, 40. The correlations we observed between ATMs and both adipose tissue expression of SERPINE1 and 24-h plasma PAI-1 AUC support the notion that the increase in plasma PAI-1 concentrations in the OB-NAFLD group was, at least in part, caused by the production of PAI-1 by ATMs. In rodent models, adipocyte-specific PAI-1 overexpression causes insulin resistance41 whereas whole-body and adipocyte-specific knockouts of PAI-1 improve insulin action.42, 43 These findings suggest the production of most cytokines by SAAT might have local paracrine effects, but do not have direct effects on systemic metabolic function. In fact, it is unlikely that changes in circulating TNF-α, IL-1β, and IL-6 cause systemic insulin resistance in people because: i) biological treatments that decrease TNF-α and IL-1β plasma concentrations or activity do not affect insulin sensitivity44–47; ii) TNF-α concentrations that impair glucose uptake or insulin signaling in cell systems are orders of magnitude higher than plasma concentrations found in people48, 49; iii) the infusion of IL-6 that results in a 25–160-fold increase in plasma IL-6 concentrations in healthy lean people has either no effect50, 51 or a small beneficial effect on insulin sensitivity52; and iv) TNF-α infusions that cause about a 10-fold increase in plasma concentrations (from 1–2 pg/ml to ~16 pg/ml) reduce insulin-stimulated glucose uptake by only 10%−15%.51, 53 Together, these data suggest PAI-1 secreted from AT, but not other adipokines, contributed to hepatic and muscle insulin resistance observed in our OB-NAFLD participants.
The marked increase in plasma exosomes observed in our OB-NAFLD group than in the OB-NL and LEAN groups extends the findings from previous studies that demonstrated plasma exosome concentrations were higher in people with obesity and metabolic syndrome54 and in people with obesity and type 2 diabetes55 than in healthy lean subjects. Incubating human skeletal muscle myotubes and mouse hepatocytes with plasma and SAAT-derived exosomes obtained from the OB-NAFLD group, but not from the LEAN or OB-NL groups, impaired insulin-stimulated Akt phosphorylation. Moreover, the effects of both plasma and SAAT-derived exosomes on insulin signaling in myotubes and hepatocytes correlated directly with skeletal muscle and hepatic insulin sensitivity, respectively, measured in vivo during the clamp procedure. In mouse models, injecting ATM exosomes isolated from lean mice into obese mice improves systemic insulin sensitivity, whereas injecting exosomes isolated from ATMs from obese mice induces insulin resistance in lean mice.21, 22 It is likely that exosome-mediated regulation of insulin action is mediated by the transfer of specific miRNAs; studies conducted in mice and cell culture systems have shown exosomal miR-29a and miR-155 decrease21, 22 and exosomal miR-690 increase56 insulin sensitivity. Our results support the notion that circulating exosomes derived from SAAT contribute to systemic insulin resistance in people with obesity and NAFLD, but does not preclude the possibility that exosomes produced by other organs are also involved.
The results from the present study demonstrate statistically significant, but small, differences in SAAT immune cell populations and SAAT expression of most proinflammatory cytokines in people with obesity and NAFLD than in those with obesity and normal IHTG content. Although it has been proposed that the secretion of proinflammatory cytokines cause systemic insulin resistance, this seems unlikely because 24-h plasma concentrations of many classical cytokines were not greater in the OB-NAFLD than the OB-NL group. Instead, our data, in conjunction with the results from previous studies conducted in mouse models, suggest SAAT-derived PAI-1 and exosomes are involved in the pathogenesis of insulin resistance in people with obesity and NAFLD.
Supplementary Material
What You Need to Know:
BACKGROUND AND CONTEXT
Insulin resistance is a common feature of obesity and is a critical factor in the pathogenesis of nonalcoholic fatty liver disease (NAFLD).
NEW FINDINGS
Adipose tissue pro-inflammatory immune cells and markers of inflammation are increased in people with obesity and NAFLD compared with people with obesity and normal intrahepatic triglyceride content. Adipose tissue-derived PAI-1 and exosomes are associated with insulin resistance in people with obesity and NAFLD.
LIMITATIONS
This clinical study demonstrates a link between insulin resistance and both adipose tissue-derived PAI-1 and exosomes in people with NAFLD, but is unable to determine whether this relationship is causal.
IMPACT
Our findings support the potential importance of alterations in adipose tissue biology in the pathogenesis of insulin resistance in people with obesity and NAFLD.
ACKNOWLEDGEMENTS
The authors thank the staff of the Center for Human Nutrition, the Clinical and Translational Research Unit and the Center for Clinical Imaging Research for their help in performing this study, and the study subjects for their participation. Technical support for the mass cytometry analysis was provided by Washington University’s Immunomonitoring Laboratory, which is supported by the Andrew M. and Jane M. Bursky Center for Human Immunology and Immunotherapy Programs. This study was supported by National Institutes of Health grants R01DK101578, T32DK007296, P30DK56341 (Nutrition Obesity Research Center), DK20579 (Diabetes Research Center), DK052574 (Digestive Disease Research Center) and UL1TR002345 (Clinical and Translational Science Award) and support from the Longer Life Foundation, the Foundation for Barnes-Jewish Hospital, and the Centene Corporation contract (P19-00559) for the Washington University-Centene ARCH Personalized Medicine Initiative.
Grant Support:
This study was supported by National Institutes of Health grants T32DK007296, P30DK56341 (Nutrition Obesity Research Center), DK20579 (Diabetes Research Center), DK052574 (Digestive Disease Research Center) and UL1TR002345 (Clinical and Translational Science Award) and support from the Longer Life Foundation, the Foundation for Barnes-Jewish Hospital, and the Centene Corporation contract (P19-00559) for the Washington University-Centene ARCH Personalized Medicine Initiative.
Conflict of Interests:
S.K. receives research funding from Janssen Pharmaceuticals and serves on a Scientific Advisory Board for Merck Sharp & Dohme Corp. T.M.M. serves on the Advisory Board for Allergan Medical and RTI and received royalties for product development from RTI. The other authors have nothing to disclose.
Abbreviations:
- ANT2
adenine nucleotide translocase 2
- AT
adipose tissue
- ATM
adipose tissue macrophage
- AUC
area under the curve
- BMI
body mass index
- CTRU
Clinical Translational Research Unit
- DXA
dual-energy X-ray absorptiometry
- FFM
fat-free mass
- HOMA-IR
homeostasis model assessment of insulin resistance
- HISI
hepatic insulin sensitivity index
- IAAT
intra-abdominal adipose tissue
- IHTG
intrahepatic triglyceride
- LEAN
lean with normal intrahepatic triglyceride content
- OB-NL
obese with normal intrahepatic triglyceride content
- MRI
magnetic resonance imaging
- OB-NAFLD
obese with NAFLD
- OGTT
oral glucose tolerance test
- PNPLA3
phospholipase domain-containing 3
- Rd
rate of disappearance from plasma during the hyperinsulinemic-euglycemic clamp procedure
- SAAT
subcutaneous abdominal adipose tissue
- SVF
stromal vascular fraction
Footnotes
Transcript Profiling: The RNA sequencing data have been deposited in the Gene Expression Omnibus (GEO) database, https://www.ncbi.nlm.nih.gov/geo (accession no. GSE156906).
Publisher's Disclaimer: This is a PDF file of an unedited manuscript that has been accepted for publication. As a service to our customers we are providing this early version of the manuscript. The manuscript will undergo copyediting, typesetting, and review of the resulting proof before it is published in its final form. Please note that during the production process errors may be discovered which could affect the content, and all legal disclaimers that apply to the journal pertain.
REFERENCES
- 1.Klein S, Wadden T, Sugerman HJ. AGA technical review on obesity. Gastroenterology 2002;123:882–932. [DOI] [PubMed] [Google Scholar]
- 2.Fabbrini E, Magkos F, Mohammed BS, et al. Intrahepatic fat, not visceral fat, is linked with metabolic complications of obesity. Proc Natl Acad Sci U S A 2009;106:15430–5. [DOI] [PMC free article] [PubMed] [Google Scholar]
- 3.Stefan N, Haring HU, Cusi K. Non-alcoholic fatty liver disease: causes, diagnosis, cardiometabolic consequences, and treatment strategies. Lancet Diabetes Endocrinol 2019;7:313–324. [DOI] [PubMed] [Google Scholar]
- 4.Stender S, Kozlitina J, Nordestgaard BG, et al. Adiposity amplifies the genetic risk of fatty liver disease conferred by multiple loci. Nat Genet 2017;49:842–847. [DOI] [PMC free article] [PubMed] [Google Scholar]
- 5.Belfort R, Harrison SA, Brown K, et al. A placebo-controlled trial of pioglitazone in subjects with nonalcoholic steatohepatitis. N Engl J Med 2006;355:2297–307. [DOI] [PubMed] [Google Scholar]
- 6.Sanyal AJ, Chalasani N, Kowdley KV, et al. Pioglitazone, vitamin E, or placebo for nonalcoholic steatohepatitis. N Engl J Med 2010;362:1675–85. [DOI] [PMC free article] [PubMed] [Google Scholar]
- 7.Kawai T, Autieri MV, Scalia R. Adipose Tissue Inflammation and Metabolic Dysfunction in Obesity. Am J Physiol Cell Physiol 2021;320:C375–C391. [DOI] [PMC free article] [PubMed] [Google Scholar]
- 8.Russo L, Lumeng CN. Properties and functions of adipose tissue macrophages in obesity. Immunology 2018;155:407–417. [DOI] [PMC free article] [PubMed] [Google Scholar]
- 9.Hotamisligil GS, Shargill NS, Spiegelman BM. Adipose expression of tumor necrosis factor-alpha: direct role in obesity-linked insulin resistance. Science 1993;259:87–91. [DOI] [PubMed] [Google Scholar]
- 10.Uysal KT, Wiesbrock SM, Marino MW, et al. Protection from obesity-induced insulin resistance in mice lacking TNF-alpha function. Nature 1997;389:610–4. [DOI] [PubMed] [Google Scholar]
- 11.Feuerer M, Herrero L, Cipolletta D, et al. Lean, but not obese, fat is enriched for a unique population of regulatory T cells that affect metabolic parameters. Nat Med 2009;15:930–9. [DOI] [PMC free article] [PubMed] [Google Scholar]
- 12.Winer S, Chan Y, Paltser G, et al. Normalization of obesity-associated insulin resistance through immunotherapy. Nat Med 2009;15:921–9. [DOI] [PMC free article] [PubMed] [Google Scholar]
- 13.Wentworth JM, Naselli G, Brown WA, et al. Pro-inflammatory CD11c+CD206+ adipose tissue macrophages are associated with insulin resistance in human obesity. Diabetes 2010;59:1648–56. [DOI] [PMC free article] [PubMed] [Google Scholar]
- 14.Fabbrini E, Cella M, McCartney SA, et al. Association between specific adipose tissue CD4+ T-cell populations and insulin resistance in obese individuals. Gastroenterology 2013;145:366–74. [DOI] [PMC free article] [PubMed] [Google Scholar]
- 15.Klimcakova E, Roussel B, Kovacova Z, et al. Macrophage gene expression is related to obesity and the metabolic syndrome in human subcutaneous fat as well as in visceral fat. Diabetologia 2011;54:876–87. [DOI] [PubMed] [Google Scholar]
- 16.Amouzou C, Breuker C, Fabre O, et al. Skeletal Muscle Insulin Resistance and Absence of Inflammation Characterize Insulin-Resistant Grade I Obese Women. PLoS One 2016;11:e0154119. [DOI] [PMC free article] [PubMed] [Google Scholar]
- 17.Kloting N, Fasshauer M, Dietrich A, et al. Insulin-sensitive obesity. Am J Physiol Endocrinol Metab 2010;299:E506–15. [DOI] [PubMed] [Google Scholar]
- 18.Verboven K, Wouters K, Gaens K, et al. Abdominal subcutaneous and visceral adipocyte size, lipolysis and inflammation relate to insulin resistance in male obese humans. Sci Rep 2018;8:4677. [DOI] [PMC free article] [PubMed] [Google Scholar]
- 19.Crewe C, Scherer PE. Intercellular and interorgan crosstalk through adipocyte extracellular vesicles. Rev Endocr Metab Disord 2021: In press. doi: 10.1007/s11154-020-09625-x. [DOI] [PubMed] [Google Scholar]
- 20.Deng ZB, Poliakov A, Hardy RW, et al. Adipose tissue exosome-like vesicles mediate activation of macrophage-induced insulin resistance. Diabetes 2009;58:2498–505. [DOI] [PMC free article] [PubMed] [Google Scholar]
- 21.Ying W, Riopel M, Bandyopadhyay G, et al. Adipose Tissue Macrophage-Derived Exosomal miRNAs Can Modulate In Vivo and In Vitro Insulin Sensitivity. Cell 2017;171:372–384 e12. [DOI] [PubMed] [Google Scholar]
- 22.Liu T, Sun YC, Cheng P, et al. Adipose tissue macrophage-derived exosomal miR-29a regulates obesity-associated insulin resistance. Biochem Biophys Res Commun 2019;515:352–358. [DOI] [PubMed] [Google Scholar]
- 23.Thomou T, Mori MA, Dreyfuss JM, et al. Adipose-derived circulating miRNAs regulate gene expression in other tissues. Nature 2017;542:450–455. [DOI] [PMC free article] [PubMed] [Google Scholar]
- 24.Cifarelli V, Beeman SC, Smith GI, et al. Decreased adipose tissue oxygenation associates with insulin resistance in individuals with obesity. J Clin Invest 2020;130:6688–6699. [DOI] [PMC free article] [PubMed] [Google Scholar]
- 25.Allison DB, Paultre F, Maggio C, et al. The use of areas under curves in diabetes research. Diabetes Care 1995;18:245–50. [DOI] [PubMed] [Google Scholar]
- 26.Ghosh D, Vogt A. Outliers: an evaluation of methodologies. Joint Statistical Meetings Proceedings: American Statistical Association, 2012:3455–3460. [Google Scholar]
- 27.Lesna IK, Cejkova S, Kralova A, et al. Human adipose tissue accumulation is associated with pro-inflammatory changes in subcutaneous rather than visceral adipose tissue. Nutr Diabetes 2017;7:e264. [DOI] [PMC free article] [PubMed] [Google Scholar]
- 28.Hill DA, Lim HW, Kim YH, et al. Distinct macrophage populations direct inflammatory versus physiological changes in adipose tissue. Proc Natl Acad Sci U S A 2018;115:E5096–E5105. [DOI] [PMC free article] [PubMed] [Google Scholar]
- 29.Lee YS, Kim JW, Osborne O, et al. Increased adipocyte O2 consumption triggers HIF-1alpha, causing inflammation and insulin resistance in obesity. Cell 2014;157:1339–52. [DOI] [PMC free article] [PubMed] [Google Scholar]
- 30.Kosteli A, Sugaru E, Haemmerle G, et al. Weight loss and lipolysis promote a dynamic immune response in murine adipose tissue. J Clin Invest 2010;120:3466–79. [DOI] [PMC free article] [PubMed] [Google Scholar]
- 31.Seo JB, Riopel M, Cabrales P, et al. Knockdown of ANT2 reduces adipocyte hypoxia and improves insulin resistance in obesity. Nature Metabolism 2019;1:86–97. [DOI] [PMC free article] [PubMed] [Google Scholar]
- 32.Nishimura S, Manabe I, Nagasaki M, et al. CD8+ effector T cells contribute to macrophage recruitment and adipose tissue inflammation in obesity. Nat Med 2009;15:914–20. [DOI] [PubMed] [Google Scholar]
- 33.Mantovani A, Sica A, Sozzani S, et al. The chemokine system in diverse forms of macrophage activation and polarization. Trends Immunol 2004;25:677–86. [DOI] [PubMed] [Google Scholar]
- 34.Oh DY, Morinaga H, Talukdar S, et al. Increased macrophage migration into adipose tissue in obese mice. Diabetes 2012;61:346–54. [DOI] [PMC free article] [PubMed] [Google Scholar]
- 35.Amano SU, Cohen JL, Vangala P, et al. Local proliferation of macrophages contributes to obesity-associated adipose tissue inflammation. Cell Metab 2014;19:162–171. [DOI] [PMC free article] [PubMed] [Google Scholar]
- 36.Kanda H, Tateya S, Tamori Y, et al. MCP-1 contributes to macrophage infiltration into adipose tissue, insulin resistance, and hepatic steatosis in obesity. J Clin Invest 2006;116:1494–505. [DOI] [PMC free article] [PubMed] [Google Scholar]
- 37.Targher G, Chonchol M, Miele L, et al. Nonalcoholic fatty liver disease as a contributor to hypercoagulation and thrombophilia in the metabolic syndrome. Semin Thromb Hemost 2009;35:277–87. [DOI] [PubMed] [Google Scholar]
- 38.Alessi MC, Peiretti F, Morange P, et al. Production of plasminogen activator inhibitor 1 by human adipose tissue: possible link between visceral fat accumulation and vascular disease. Diabetes 1997;46:860–7. [DOI] [PubMed] [Google Scholar]
- 39.Eriksson P, Reynisdottir S, Lonnqvist F, et al. Adipose tissue secretion of plasminogen activator inhibitor-1 in non-obese and obese individuals. Diabetologia 1998;41:65–71. [DOI] [PubMed] [Google Scholar]
- 40.Kishore P, Li W, Tonelli J, et al. Adipocyte-derived factors potentiate nutrient-induced production of plasminogen activator inhibitor-1 by macrophages. Sci Transl Med 2010;2:20ra15. [DOI] [PubMed] [Google Scholar]
- 41.Lijnen HR, Alessi MC, Van Hoef B, et al. On the role of plasminogen activator inhibitor-1 in adipose tissue development and insulin resistance in mice. J Thromb Haemost 2005;3:1174–9. [DOI] [PubMed] [Google Scholar]
- 42.Ma LJ, Mao SL, Taylor KL, et al. Prevention of obesity and insulin resistance in mice lacking plasminogen activator inhibitor 1. Diabetes 2004;53:336–46. [DOI] [PubMed] [Google Scholar]
- 43.Liang X, Kanjanabuch T, Mao SL, et al. Plasminogen activator inhibitor-1 modulates adipocyte differentiation. Am J Physiol Endocrinol Metab 2006;290:E103–E113. [DOI] [PubMed] [Google Scholar]
- 44.Ofei F, Hurel S, Newkirk J, et al. Effects of an engineered human anti-TNF-alpha antibody (CDP571) on insulin sensitivity and glycemic control in patients with NIDDM. Diabetes 1996;45:881–5. [DOI] [PubMed] [Google Scholar]
- 45.Paquot N, Castillo MJ, Lefebvre PJ, et al. No increased insulin sensitivity after a single intravenous administration of a recombinant human tumor necrosis factor receptor: Fc fusion protein in obese insulin-resistant patients. J Clin Endocrinol Metab 2000;85:1316–9. [DOI] [PubMed] [Google Scholar]
- 46.Bernstein LE, Berry J, Kim S, et al. Effects of etanercept in patients with the metabolic syndrome. Arch Intern Med 2006;166:902–8. [DOI] [PMC free article] [PubMed] [Google Scholar]
- 47.Everett BM, Donath MY, Pradhan AD, et al. Anti-Inflammatory Therapy With Canakinumab for the Prevention and Management of Diabetes. J Am Coll Cardiol 2018;71:2392–2401. [DOI] [PubMed] [Google Scholar]
- 48.Hotamisligil GS, Murray DL, Choy LN, et al. Tumor necrosis factor alpha inhibits signaling from the insulin receptor. Proc Natl Acad Sci U S A 1994;91:4854–8. [DOI] [PMC free article] [PubMed] [Google Scholar]
- 49.del Aguila LF, Claffey KP, Kirwan JP. TNF-alpha impairs insulin signaling and insulin stimulation of glucose uptake in C2C12 muscle cells. Am J Physiol 1999;276:E849–55. [DOI] [PubMed] [Google Scholar]
- 50.Steensberg A, Fischer CP, Sacchetti M, et al. Acute interleukin-6 administration does not impair muscle glucose uptake or whole-body glucose disposal in healthy humans. J Physiol 2003;548:631–8. [DOI] [PMC free article] [PubMed] [Google Scholar]
- 51.Krogh-Madsen R, Plomgaard P, Moller K, et al. Influence of TNF-alpha and IL-6 infusions on insulin sensitivity and expression of IL-18 in humans. Am J Physiol Endocrinol Metab 2006;291:E108–14. [DOI] [PubMed] [Google Scholar]
- 52.Carey AL, Steinberg GR, Macaulay SL, et al. Interleukin-6 increases insulin-stimulated glucose disposal in humans and glucose uptake and fatty acid oxidation in vitro via AMP-activated protein kinase. Diabetes 2006;55:2688–97. [DOI] [PubMed] [Google Scholar]
- 53.Plomgaard P, Bouzakri K, Krogh-Madsen R, et al. Tumor necrosis factor-alpha induces skeletal muscle insulin resistance in healthy human subjects via inhibition of Akt substrate 160 phosphorylation. Diabetes 2005;54:2939–45. [DOI] [PubMed] [Google Scholar]
- 54.Eguchi A, Lazic M, Armando AM, et al. Circulating adipocyte-derived extracellular vesicles are novel markers of metabolic stress. J Mol Med (Berl) 2016;94:1241–1253. [DOI] [PMC free article] [PubMed] [Google Scholar]
- 55.Freeman DW, Noren Hooten N, Eitan E, et al. Altered Extracellular Vesicle Concentration, Cargo, and Function in Diabetes. Diabetes 2018;67:2377–2388. [DOI] [PMC free article] [PubMed] [Google Scholar]
- 56.Ying W, Gao H, Dos Reis FCG, et al. MiR-690, an exosomal-derived miRNA from M2-polarized macrophages, improves insulin sensitivity in obese mice. Cell Metab 2021: In Press. doi: 10.1016/j.cmet.2020.12.019. [DOI] [PMC free article] [PubMed] [Google Scholar]
Associated Data
This section collects any data citations, data availability statements, or supplementary materials included in this article.