

Abstract
Listeria monocytogenes (Lm) is a major human foodborne pathogen. Numerous Lm outbreaks have been reported worldwide and associated with a high case fatality rate, reinforcing the need for strongly coordinated surveillance and outbreak control. We developed a universally applicable genome-wide strain genotyping approach and investigated the population diversity of Lm using 1,696 isolates from diverse sources and geographical locations. We define, with unprecedented precision, the population structure of Lm, demonstrate the occurrence of international circulation of strains and reveal the extent of heterogeneity in virulence and stress resistance genomic features among clinical and food isolates. Using historical isolates, we show that the evolutionary rate of Lm from lineage I and lineage II is low (~2.5 × 10⁻⁷ substitutions per site per year, as inferred from the core genome) and that major sublineages (corresponding to so-called ‘epidemic clones’) are estimated to be at least 50–150 years old. This work demonstrates the urgent need to monitor Lm strains at the global level and provides the unified approach needed for global harmonization of Lm genome-based typing and population biology.
Pathogens know no border and can cause multi-country outbreaks and pandemics1,2, emphasizing the importance of international coordination for infectious diseases surveillance3. Microbiological surveillance programmes rely on the continuous monitoring of circulating genotypes in space and time, enabling the rapid detection of common-source clusters and the implementation of control measures4. Despite outstanding exceptions5–7, most pathogens are so far monitored only at the national level. The lack of international coordination implies that outbreaks affecting multiple countries are either not detected or not controlled optimally3,4. International and cross-sector surveillance of pathogens requires strain subtyping methods that combine high resolution, reproducibility and exchangeability, so that epidemiologically relevant groups of matching isolates can be rapidly recognized across space and time4. Besides, harmonized and universally shared strain nomenclatures, which must be rooted in the microorganism population biology, are a prerequisite for rapid detection and efficient communication on emerging strain types.
The foodborne pathogen Listeria monocytogenes (Lm) causes listeriosis, a human systemic infection characterized by septicemia and central nervous system and maternal–fetal invasion, with high hospitalization and fatality rates8. Less severe manifestations include gastroenteritis9 and may often remain undiagnosed. In the PulseNet programme6, the microbiological typing golden standard, pulsed-field gel electrophoresis (PFGE), has been standardized internationally, but naming of profiles is not coordinated between the different international PulseNet networks. Furthermore, PFGE does not reflect evolutionary relationships and certain profiles are highly prevalent, leading to insufficient discriminative power. In contrast, multilocus sequence typing (MLST) based on seven genes provides highly standardized genotypes and nomenclature10–12, but lacks the discriminatory power required for epidemiological surveillance of most bacterial pathogens. Advances in high-throughput sequencing technologies have established whole-genome sequencing (WGS) as a powerful epidemiological typing tool1,13,14 that has been applied to investigate outbreaks and Lm contamination of food production plants15–20. However, these studies were restricted to local or national levels and a relatively small number of isolates.
Wide-range transmission of Lm strains can occur through international food trade21, and the major MLST-defined clonal complexes (CCs) of Lm are distributed globally11. However, the rate of evolution of Lm genomes and the speed at which strains can spread over large distances are currently unknown. Furthermore, a global view of the relationships between genotype and virulence potential of Lm strains remains to be established.
To enable population biology studies of global Lm collections and for prospective international epidemiological surveillance, a harmonized protocol to translate a genomic sequence into its corresponding nomenclatural genotype needs to be established. Although single-nucleotide polymorphism (SNP)-based approaches can provide maximal discrimination20, they are difficult to standardize and can be difficult to interpret18,22. In contrast, genome-wide MLST approaches rely on well-defined standard sets of hundreds of genes that can be validated a priori for strain genotyping14,19,23,24.
Here, we have developed a core genome MLST (cgMLST) method for Lm and applied it to a large number of strains from a wide spectrum of geographic, temporal and epidemiological origins. This enabled us to decipher the population structure and evolutionary rate of Lm, to demonstrate international transmission of major sublineages and to develop a unified genome-based nomenclature of Lm strains accessible through an open bioinformatics platform, allowing international collaboration on research and public health surveillance based on high-throughput genome sequencing.
Results
Universal Lm cgMLST.
A core genome MLST (cgMLST) scheme of 1,748 loci was defined based on a high level of conservation of this set of genes among 957 genomes of diverse origins (Supplementary Section 2.1). Using an independent set of 650 prospectively collected isolates to estimate typeability4, each of these genes could be detected in 644 genomes (99.1%) on average, resulting in half of the genomes having eight or fewer uncalled alleles (average ± standard deviation (s.d.) of uncalled alleles 15 ± 20; Supplementary Section 2.1). These results demonstrate the universal applicability of this cgMLST scheme for Lm strain genotyping.
Reproducibility of allele calls based on genomic sequences obtained from independent cultures and sequencing protocols of the reference EGD-e strain was absolute (error rate <0.029%, that is, <1 error in 3,496 allelic comparisons). cgMLST genotyping was also reproducible, irrespective of the assembly pipeline, for coverage depths ≥40 (per-site Phred quality score ≥20, that is, corresponding to ≥99% base accuracy), and de novo assembly allele calls were identical to assembly-free methods (Supplementary Section 2.4). Overall, the cgMLST scheme developed herein constitutes an extremely robust genotyping method, even when applied on a very wide variety of Lm strains sequenced from diverse sources and geographical locations.
Definition of cgMLST types.
To provide a definition of cgMLST types (CTs) that would be maximally useful for surveillance purposes, we compared the genetic heterogeneity between epidemiologically related isolates on the one hand and between isolates with no documented epidemiological link on the other. Pairwise allelic mismatches revealed two distinct distributions (Fig. 1a). First, most isolates sampled during investigations of single outbreaks had seven or fewer allelic mismatches (Fig. 1a). Among these, pairs of isolates from vertical maternal–neonatal transmission cases had no allelic differences (not shown). Second, taking into account the entire data set (Fig. 1a), a sharp discontinuity was observed, with few pairs of isolates having between seven and ten allelic mismatches, showing that isolates with no documented epidemiological link differed most generally by more than ten mismatches. Clustering efficiency was optimal when using a cutoff value of 7.3 allelic mismatches (that is, 0.414% of mismatched loci; Supplementary Section 2.7). Therefore, we propose to define CTs as groups of cgMLST profiles that differ by up to seven allelic mismatches out of 1,748 loci (that is, in the case of uncalled alleles, 0.400% of mismatched loci among those that are called in both profiles) from at least one other member of the group.
Figure 1 |. Nomenclature of Lm cgMLST profiles.
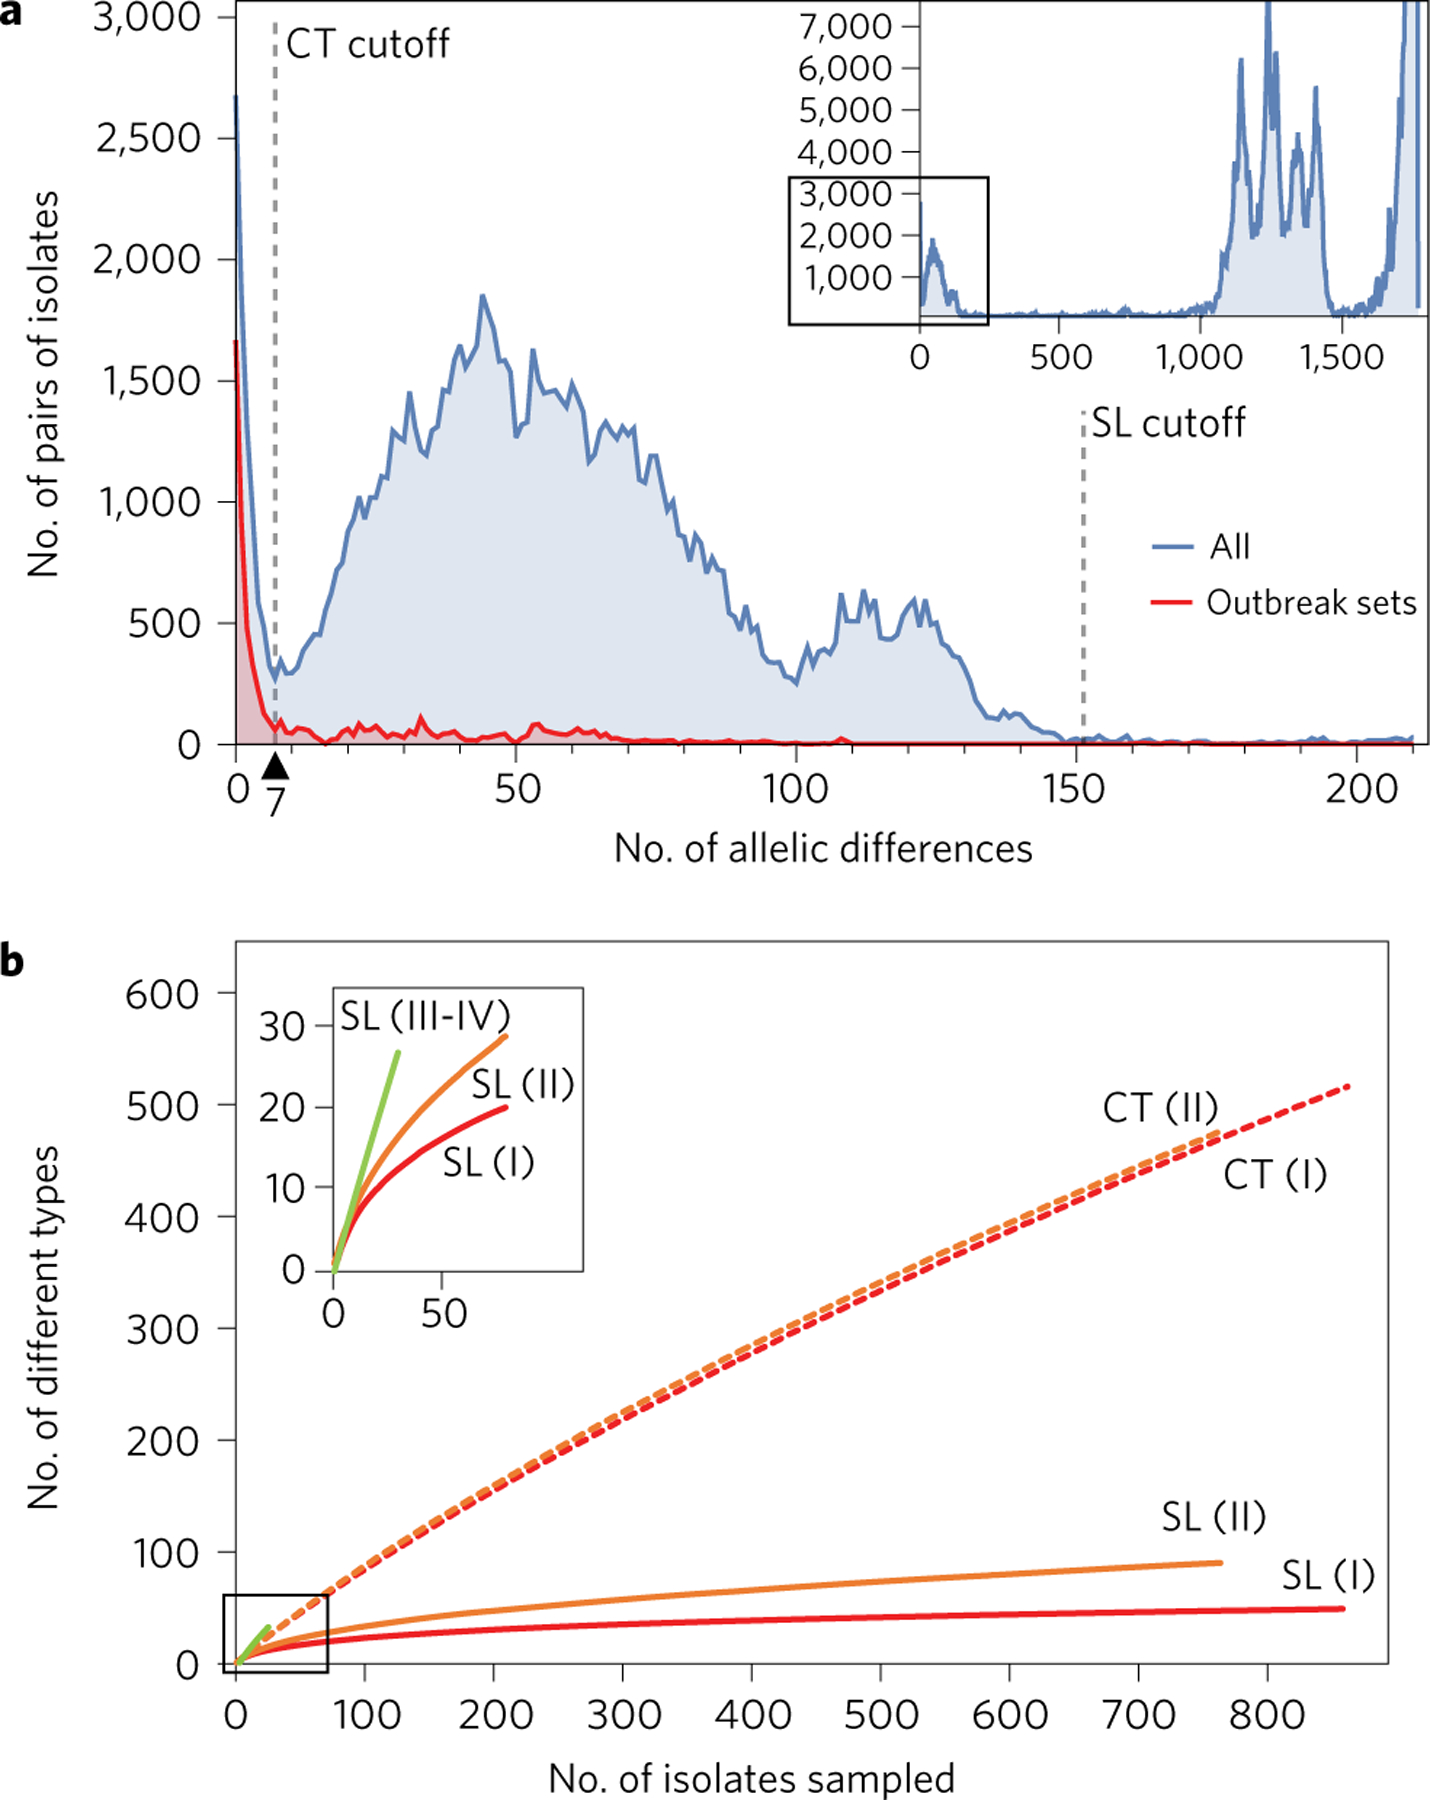
a, Distribution of the number of cgMLST allelic differences between pairs of isolates among the 1,696 genomes (blue) and within 49 sets of epidemiologically related isolates (426 isolates in total; red). Dashed vertical bars represent cutoff values for cgMLST types (CT, 7 allelic mismatches) and sublineages (SL, 150 allelic mismatches). Inset: global data set. Main figure: up to 200 allelic mismatches. b, Rarefaction curves of the number of sublineages and cgMLST types identified, broken down per main phylogenetic lineage (I–IV). Curves were estimated using 100 random samples per point. Inset: zoom on the 0–50 x-axis values. Lineages III and IV were pooled but must be sampled more extensively to determine the shape of the curve.
Comparison of cgMLST and PFGE genotyping.
PFGE is the current reference method for Lm epidemiological surveillance and outbreak investigation6. Among the 100 Lm isolates used for cgMLST and PFGE comparison, only 36 distinct AscI-ApaI combined PFGE profiles (Simpson’s diversity index = 0.944, 95% confidence interval CI = [0.926, 0.963]) were identified, whereas cgMLST distinguished 68 CTs (Simpson’s index = 0.987; 95% CI = [0.981, 0.994]). This indicates that cgMLST greatly improves discrimination among Lm isolates compared with PFGE (P < 0.001; Supplementary Section 2.5). Consistent with this, PFGE did not subtype any CT, whereas multiple PFGE types could be subdivided using cgMLST (adjusted Wallace index of concordance = 0.215; 95% CI = [0.156, 0.304]). Retrospective analysis indicated no epidemiological link among isolates that were grouped by PFGE but not by cgMLST (NRC and Santé Publique France (SPF), France). These results are consistent with previous work that reported improved discrimination of genome sequence typing over PFGE18,19, and our collective unpublished experience covering more than one year with WGS for real-time surveillance of listeriosis in Denmark, France, the UK and the USA. Implementation of cgMLST in Lm surveillance therefore shows great promise to improve the definition of clusters of cases, thus facilitating investigations of contamination sources.
Phylogenetic structure and nomenclature of Lm sublineages.
A unified nomenclature of Lm subtypes is critically needed for real-time exchange of information on the emergence and geographic dispersal of strains. To provide an optimized subtype definition, we analysed the phylogenetic structure of Lm. The four major phylogenetic lineages of Lm were clearly separated (Fig. 2a). cgMLST-based clustering of isolates into lineages and their sublineages was highly concordant with the sequence-based phylogenetic tree (Fig. 2b). Whereas the strains of lineages III and IV (which are rarely isolated in the context of surveillance) were scattered into multiple rare sublineages, lineages I and II were strongly structured into major sublineages, each comprising multiple closely related isolates (Fig. 3a). Two atypically divergent sublineages within lineage II were identified (sublineages SL842 and SL843, Fig. 2a), showing that lineage II is more diverse than previously reported.
Figure 2 |. Phylogenetic structure of the global Lm data set.
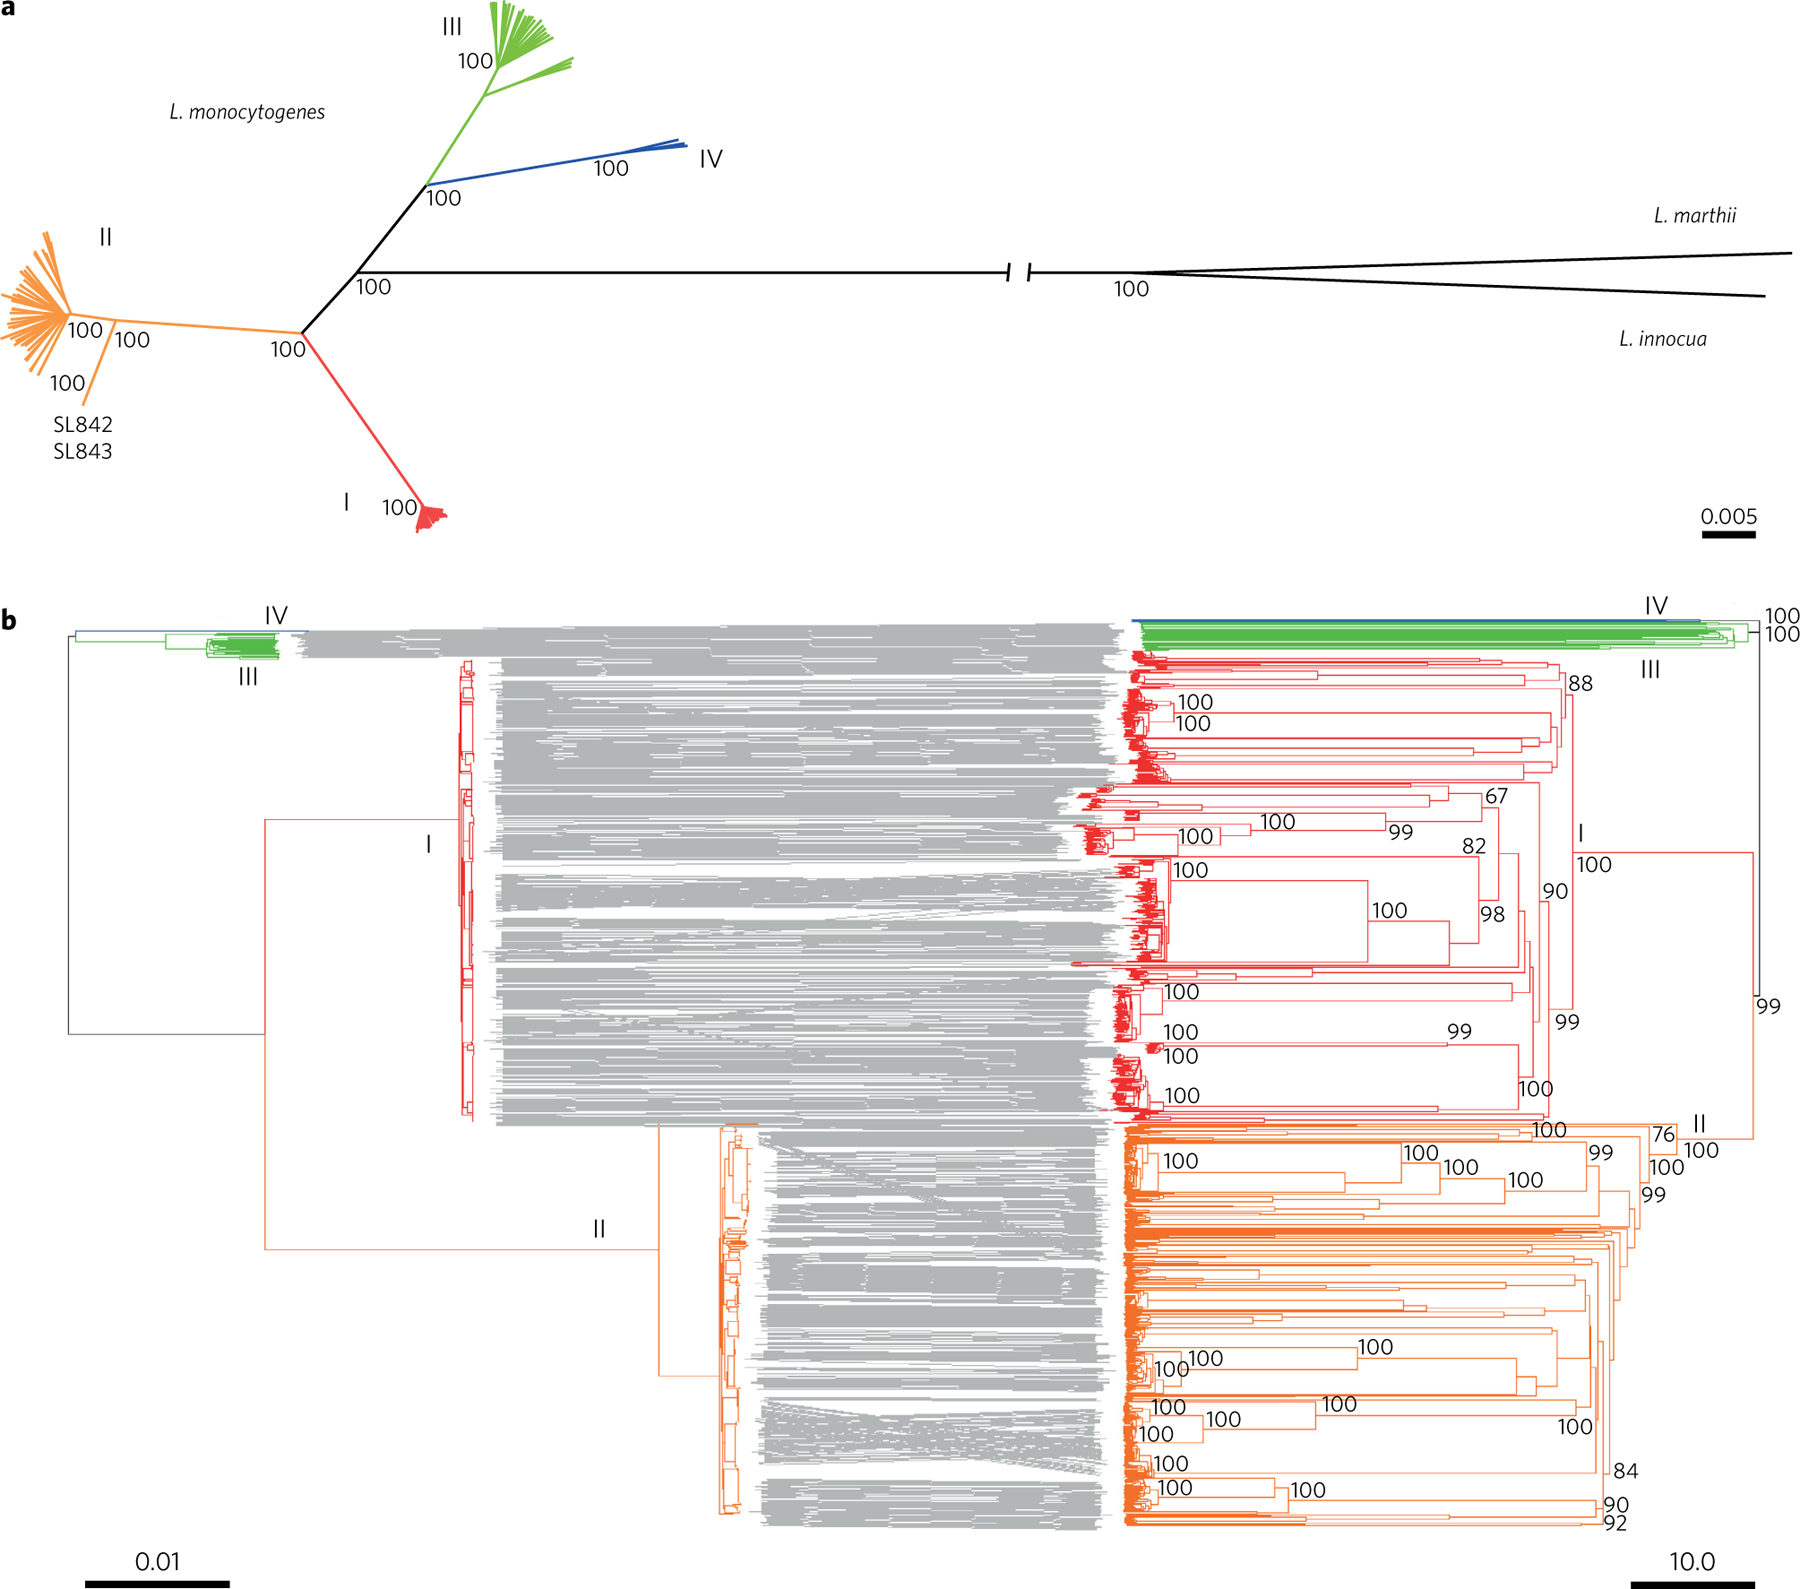
a, Phylogeny of the four phylogenetic lineages (I, red; II, orange; III, green; IV, blue). Representative isolates of the four lineages were used to determine the location of the root, using L. innocua and L. marthii as outgroups. The tree was obtained using FastME on the p-distance of the 1,748 concatenated alignments. b, Comparison of the phylogeny obtained from 1,748 recombination-purged sequence alignments (left) and from cgMLST allelic profile distances (right). To reduce redundancy, only one strain per outbreak set was used. Scale bars indicate the percentage of nucleotide substitutions (a right and b left) and the percentage of allelic mismatches (b right). For practical reasons, bootstrap values (based on 500 replicates) are shown only for long internal branches.
Figure 3 |. International distribution of Lm sublineages.
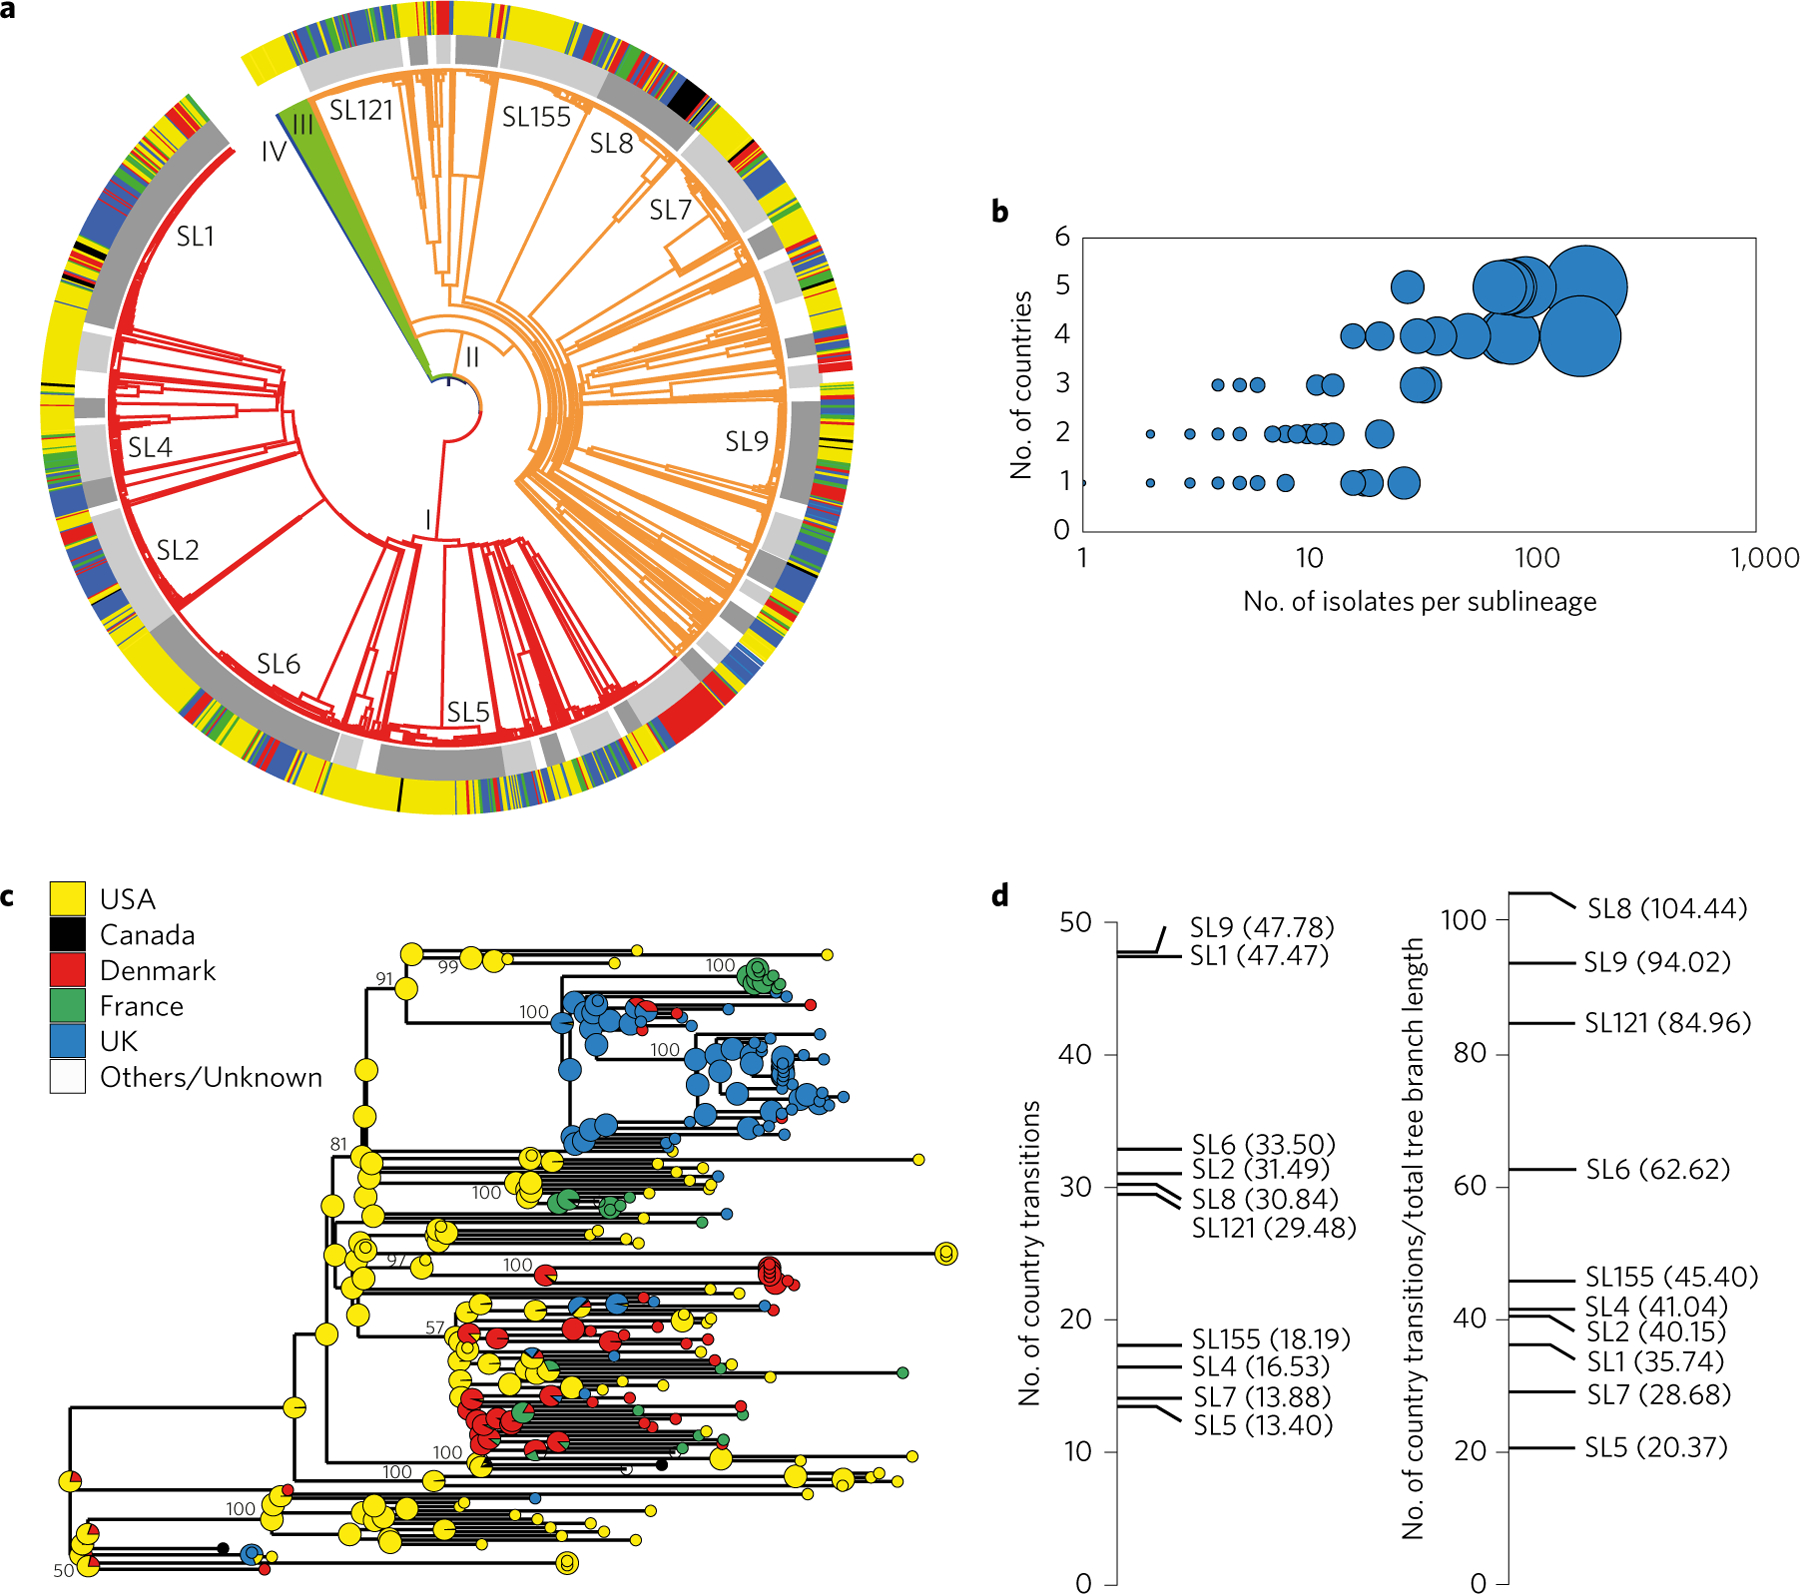
a, Clustering of 1,696 Lm isolates based on single-linkage analysis of the cgMLST profiles. Lineage branch colours are as in Fig. 2. Light and dark grey alternation (inner circle) delimits sublineages with more than 10 isolates (main sublineages are labelled). Source country is represented in the external ring using the colour key from c. b, Number of countries from which a sublineage was isolated, as a function of number of isolates per sublineage. Disk size is a function of number of isolates per sublineage. c, Inferred geographical origin of ancestral nodes of the phylogeny of SL1. Pie charts represent the likelihood proportion of geographical origins. The tree was constructed using minimum evolution based on cgMLST profiles. Bootstrap values above 50% (based on 500 replicates) are shown for the major nodes. d, Absolute number of geographical transitions (left) and number of geographical transitions normalized by total branch length (right) within the ten most frequent sublineages, as inferred by stochastic ancestral state reconstructions (numbers in parentheses indicate the precise values inferred for each sublineage).
The observed trimodal distribution of allelic mismatches among all pairs of isolates (Fig. 1a) was consistent with phylogenetic structure: isolates belonging to distinct major phylogenetic lineages differed by 1,500 loci or more out of 1,748 loci, isolates from different sublineages within a given lineage typically showed between 1,000 and 1,400 allelic differences, and most isolates within the same sublineage were up to 150 allelic mismatches distant. Moreover, clustering efficiency was optimal between 140 and 150 allelic mismatches (Supplementary Section 2.7). Therefore, a threshold of 150 allelic mismatches (8.58% dissimilarity) was chosen to define sublineages. This cutoff value led to the identification of 163 sublineages. Remarkably, the flat rarefaction curve obtained for sublineages within lineages I and II suggests that this study has captured most of the phylogenetic sublineages of these two epidemiologically major lineages (Fig. 1b). In contrast, the almost linear rarefaction curve of CT richness indicates that the 1,013 CTs sampled represent only a small fraction of those expected to be uncovered upon further sampling (Fig. 1b), underlining the fine subtyping power of cgMLST and its ability to subdivide Lm biodiversity into a multitude of epidemiologically relevant genotypic groups.
We next analysed the correspondence of sublineages with classical 7-genes MLST nomenclature10–12. A total of 156 sequence types (STs) were previously defined in the Institut Pasteur MLST database (now in BIGSdb-Lm, http://bigsdb.pasteur.fr/listeria), but 63 new ones were identified, revealing a significant amount of novel diversity of Lm strains. MLST-defined CCs were mapped onto the cgMLST-based phylogenetic structure (Supplementary Section 2.7), largely revealing a one-to-one correspondence with cgMLST sublineages. Therefore, the MLST nomenclature was mapped onto sublineages where possible (Supplementary Table 4). As expected, frequent sublineages corresponded to previously recognized major MLST clones10–12,25,26. As a result, the sublineage cgMLST-based nomenclature can be easily matched with the widely used MLST nomenclature, which remains a valuable tool for first-line identification of sublineages27.
Evidence for international spread of Lm strains.
To investigate the international transmission of Lm strains, we first mapped the geographic origin of isolates onto the phylogeny (Fig. 3a). All sublineages represented by more than 50 isolates were recovered from at least four distinct countries (Fig. 3b). Using a stochastic mapping approach to reconstruct ancestral states, we estimated the average number of cross-country transmission events as ranging from 13 to 48 in the ten most frequent sublineages (Fig. 3c,d). These results show that subsequent to the evolutionary origin of major sublineages, geographical shifts have occurred repeatedly. When normalizing the number of geographical transitions by taking into account the number of isolates and evolutionary time (jointly approximated by total tree length), large differences in cross-country transition rates were apparent (Fig. 3d). Interestingly, the most food-associated sublineages SL9 and SL121 (ref. 25) had among the highest geographical transition rates.
To investigate international transmission at a more recent epidemiological timescale, we searched for internationally distributed CTs. Interestingly nine CTs, comprising a total of 34 isolates, included isolates from at least two countries (Fig. 4 and Supplementary Table 6). These results demonstrate the international distribution of genotypic groups of Lm isolates that exhibit levels of genetic divergence typical of those observed within documented outbreaks and transmission events.
Figure 4 |. International groups of isolates classified into the same cgMLST type.
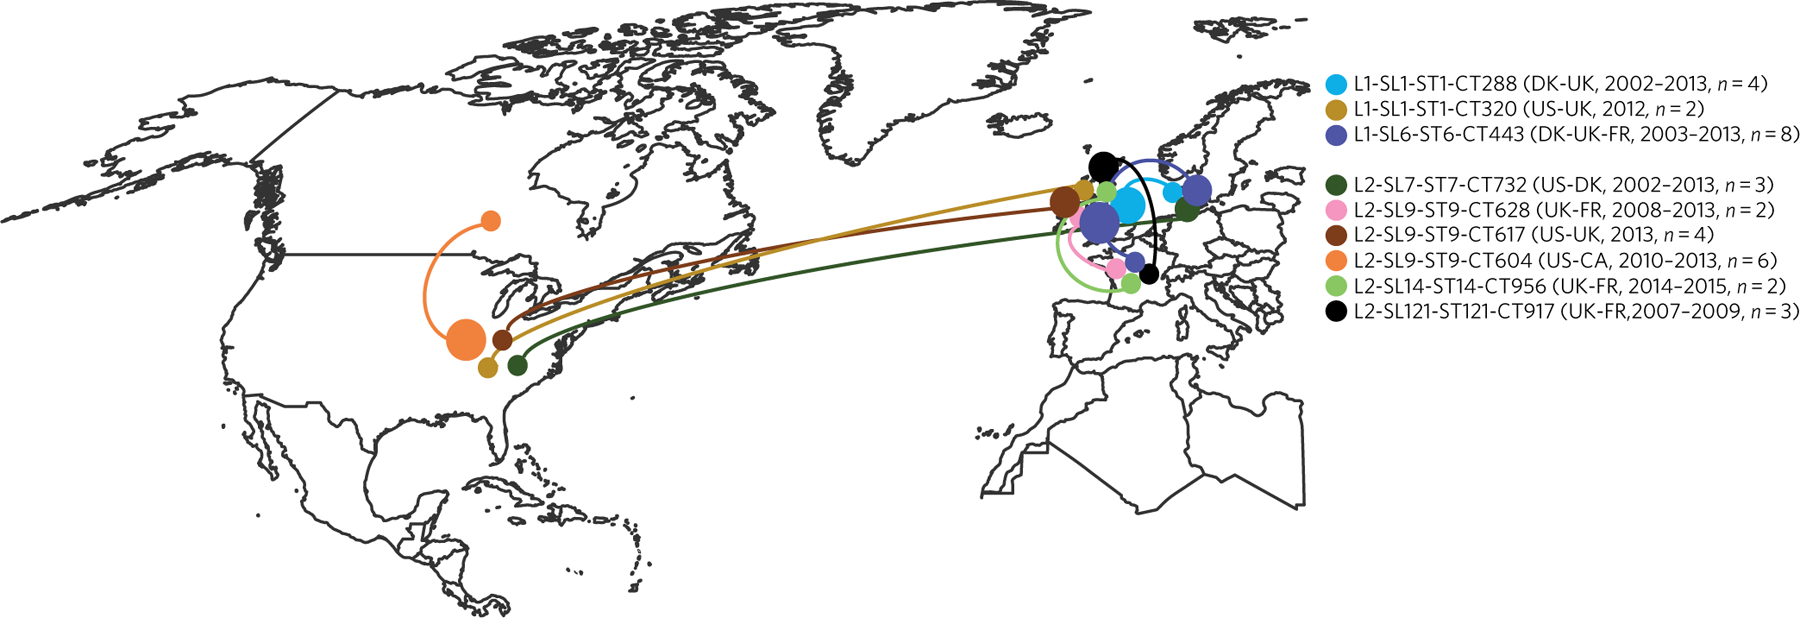
The nine groups of isolates are indicated by a specific colour. The genotype is indicated as a string consisting of a succession of lineage (for example, L1), sublineage (for example, SL1), sequence type (for example, ST1) and cgMLST type (for example, CT288). Countries of isolation, isolation year range and total number of isolates are given after the genotype string. Circles on the map indicate the country where a particular CT was isolated and their size is related to the number of isolates from that country. The details for each CT are given in Supplementary Table 6. Abbreviations: US, United States of America; CA, Canada; DK, Denmark; UK, United Kingdom; FR, France.
Temporal accumulation of variation within Lm lineages and outbreaks.
Phylogenetic analysis of the most prevalent sublineage (SL1) (Supplementary Table 5) showed that the root-to-tip distances were significantly associated (P < 0.0001, F-test) with the isolation year of isolates (Fig. 5b). The inferred slope of the linear regression indicated an accumulation of 0.23 allelic mismatches per cgMLST profile (1.58 Mb) per year. BEAST analysis of the concatenated multiple sequence alignments confirmed the existence of a temporal signal (Supplementary Section 2.8) and estimated an evolutionary rate of 2.6 × 10⁻⁷ substitutions per site per year (0.41 substitutions per 1.58 Mb per year), that is, one substitution on the core genome every 2.5 years (95% highest posterior density (HPD) = [1.9–3.4]). We also estimated independently the rate of SL9, as a representative of major lineage II. Remarkably, the SL9 rate was 2.4 × 10⁻⁷ substitutions per site per year (0.38 substitutions per 1.58 Mb per year), indicating a highly similar rate in SL1 and SL9. These results demonstrate measurable evolution of Lm genomes over a few decades and provide an estimate of the short-term rate of accumulation of genetic variation in representative sublineages of the two major lineages of Lm. Based on the hypothesis that the substitution rate is conserved in Lm, we estimated that the root of the other major sublineages was 50–150 years old (Supplementary Section 2.8). Note that these estimates must be taken with care: the rate may vary in some sublineages and it is likely that our sampling has missed some divergent branches, implying that our estimates are minimal ages. Nevertheless, our current age estimates suggest an expansion of major sublineages in modern times. Whether the dissemination of Lm was driven by an increase in the intensity of exchange of people, animals and food in recent times is an intriguing possibility.
Figure 5 |. Temporal analysis of cgMLST profile evolution.
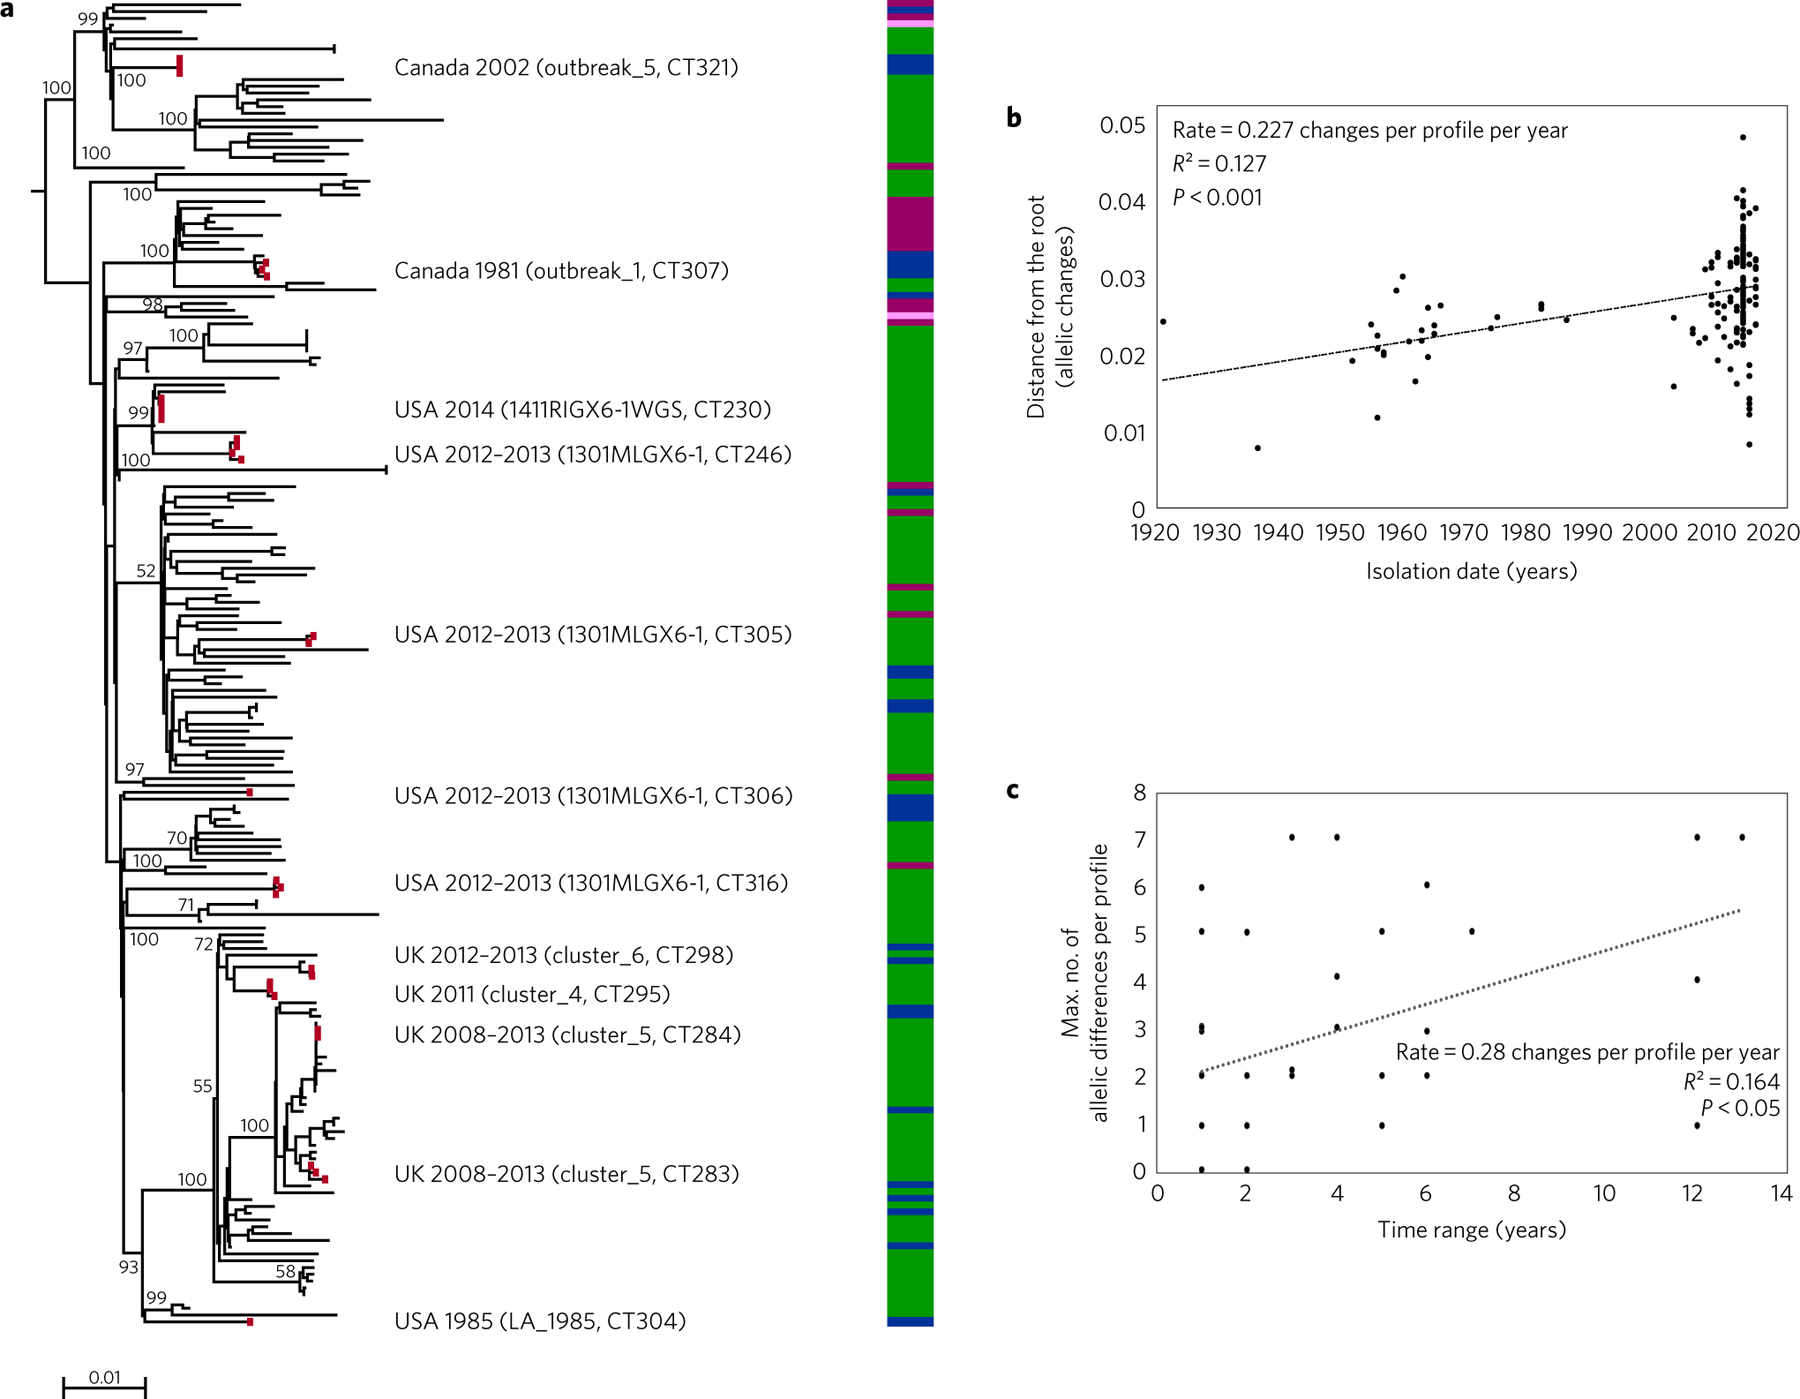
a, Best-fitting rooted phylogeny of SL1 isolates (n = 195), including the historical isolates. The tree was obtained using FastME on cgMLST profiles. Coloured blocks represent the isolation time range (1921–1950, pink; 1951–1980, purple; 1981–2010, blue; 2011–2015, green). Outbreak reference strains are indicated by red dots. Outbreak identifier, country, year and cgMLST type are provided on the right. The scale bar indicates the number of allelic substitutions per locus. Statistical significance was assessed using F-test. b, Linear regression of isolation year with root-to-tip cgMLST distance. c, Accumulation of cgMLST variation over time, determined based on the international CTs (n = 9) and outbreak sets (n = 49). Statistical significance was assessed using F-test.
Lm can survive for long periods of time in various sources, where genetic diversification from a single population founder can occur15,20,28. Consistently, we observed that allelic divergence within outbreak sets and international clusters was positively associated with the time span between the first and last isolate collected (P < 0.05, F-test; Fig. 5c), with an accumulation of 0.28 allelic mismatch per year, highly consistent with the phylogenetic tree-based evolutionary rate estimate. These results illustrate the importance and possibility of taking the temporal dimension into account when interpreting genomic data in the context of persistent contaminations20.
The phylogeny of SL1 (Fig. 5a) showed that outbreaks strains were dispersed in multiple branches, suggesting that all SL1 isolates have the potential to cause outbreaks. Moreover, it demonstrated that the multiple outbreaks caused by this sublineage, previously called ‘epidemic clone ECI’26 are actually independent epidemiological events. The most recent common ancestor of SL1 was estimated to have existed around 1876 (95% HPD = [1861–1891]), reinforcing the idea that extant SL1 isolates do not derive from a single recent epidemic.
Biological features of Lm sublineages and CTs.
Important genomic differences among sublineages are shown in Fig. 6. The PCR-serogroup distribution across the phylogenetic tree was consistent with previous knowledge, with major PCR-serogroups being strong markers of the main divisions of Lm diversity10,29,30. In contrast, PCR-serogroup variant IVb-v1 (ref. 31) was found in various branches. Similarly, and as expected, serogroup L (ref. 31) was present in lineages III and IV, but also in lineage I. These results underline that caution is needed when interpreting molecular serotyping data for Lm epidemiological purposes.
Figure 6 |. Virulence and resistance profiles across the phylogeny of the 1,696 Lm isolates.
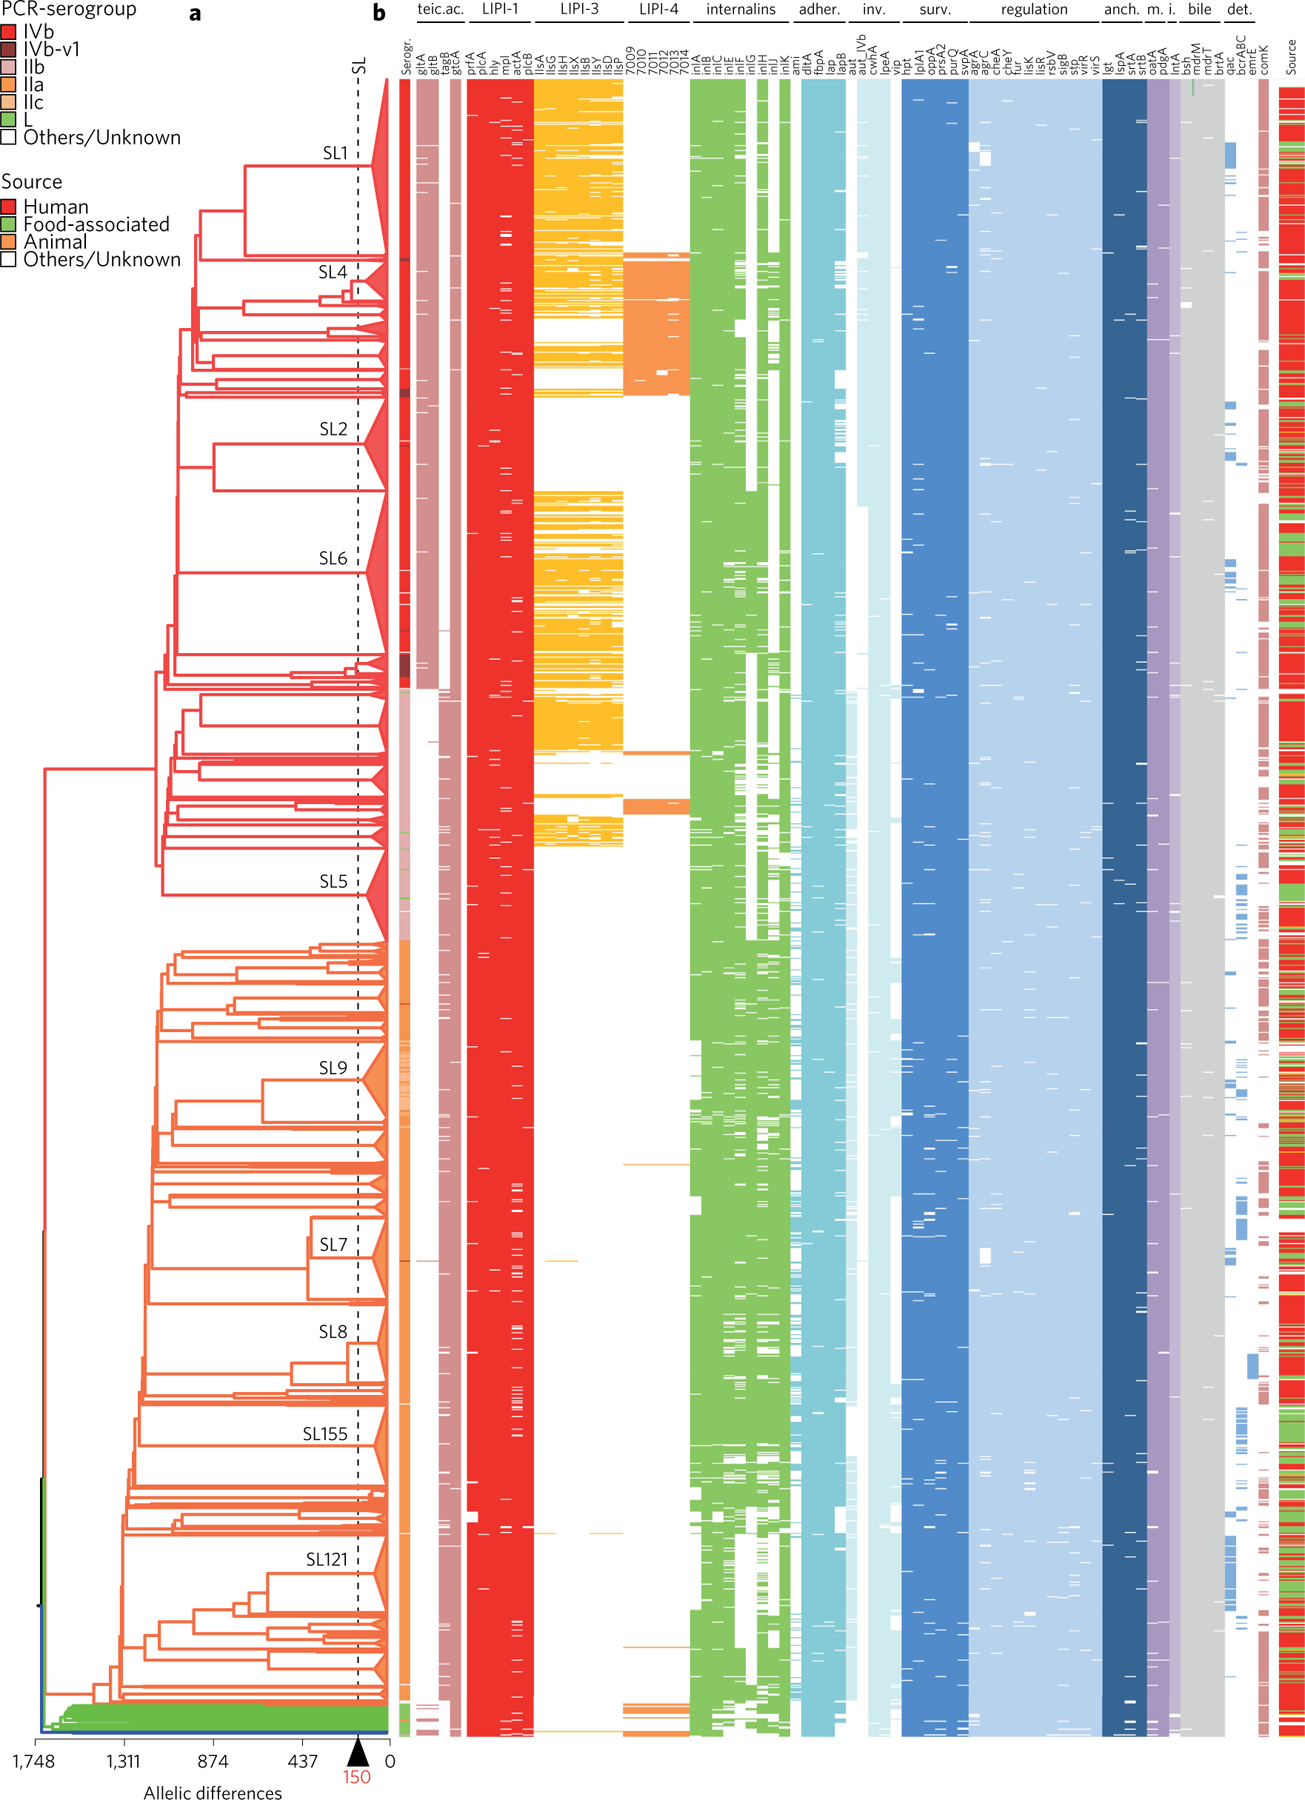
a, Cluster analysis based on cgMLST profiles. The dashed vertical bar indicates the cgMLST mismatch cutoff for sublineages. The ten most frequent sublineages are highlighted. b, Pattern of gene presence (colour line) or absence (white). The first and last columns correspond to the serogroup and sample source, respectively, represented by colour codes (upper left key). The presence/absence gene matrix represents, from left to right, genes involved in teichoic acid biosynthesis (gltAB, tagB, gtcA), genes located in the pathogenicity islands LIPI-1 (prfA, plcA, hly, mpl, actA, plcB), LIPI-3 (llsAGHXBYDP) and LIPI-4 (LM9005581_70009 to LM9005581_70014), genes coding for internalins (inlABCEFGHJK) and other genes involved in adherence (ami, dltA, fbpA, lap, lapB), invasion (aut, aut_IVb, cwhA, lpeA, vip), intracellular survival (hpt, lplA1, oppA, prsA2, purQ, svpA), regulation of transcription and translation (agrAC, cheAY, fur, lisKR, rsbV, sigB, stp, virRS), surface protein anchoring (lgt, lspA, srtAB), peptidoglycan modification (oatA, pdgA), immune modulation (lntA), bile-resistance (bsh, mdrM, mdrT, brtA), resistance to detergents (qac, bcrABC, ermE) and biofilm formation and virulence (comK).
The screening for virulence and stress resistance genes showed important differences among Lm lineages and sublineages (Fig. 6). As expected, the major pathogenicity island LIPI-1 was highly conserved. A complete LIPI-3 (ref. 32) was almost exclusively detected within lineage I. The recently described LIPI-4 (ref. 25) was nearly universally present in SL4 and closely related sublineages (Fig. 6) and was also found in a few other isolates, including in lineages III and IV. inlA alleles encoding truncated InlA variants, which are associated with hypovirulence33, were observed in most isolates of lineage II sublineages SL9, SL31, SL121, SL199 and SL321 (Fig. 6 and Supplementary Section 2.9) and were significantly associated with food and food-production isolates (P < 0.0001). The presence of a non-disrupted form of the comK gene, involved in intracellular survival switch and biofilm formation34,35, was dispersed across multiple sublineages and far more frequent in lineage I than in lineage II (79 versus 38%, respectively, P < 0.0001, Fisher’s exact test). Finally, genes that confer resistance to benzalkonium chloride, a major disinfectant applied on food-industry surfaces36, were significantly associated (P < 0.0001, Fisher’s exact test) with lineage II and particularly frequent in SL121, consistent with the persistence of this clonal complex in food processing plants37. Taken together, these results demonstrate the strong heterogeneity among Lm sublineages with regard to genomic features involved in either pathogenesis or food contamination.
Discussion
Listeriosis surveillance is currently organized almost exclusively at national levels, thereby limiting our capacity to trace sources of infections involving international transmission through food trade or human travel. An efficient global laboratory surveillance system would consist of three parts: standardized methods and databases, open sharing of data between public health laboratories, and rapid communication about outbreaks. Here, we have addressed these issues by developing a genome-wide genotyping system validated on a large international collection of Lm strains. Furthermore, we have set up an openly accessible database and analysis tool (BIGSdb-Lm at http://bigsdb.pasteur.fr/listeria), which provides a unified nomenclature that will ease global communication on Lm genotypes. Real-time incorporation of genotypic variation of future Lm isolates uncovered through prospective genomic surveillance will enable global coordination of epidemiological surveillance.
Although alternative sets of cgMLST loci (Supplementary Section 2.3) have recently been proposed for Lm typing19,24, the scheme developed here in the context of a global collaboration contains more genes, was validated using isolates from diverse origins, and was extremely reproducible when comparing the results from independent allele calling approaches. We also show that cgMLST has a far greater discriminative power than PFGE when applied to the prospective surveillance of isolates. It is worth noting that although we have already identified 1,013 CTs, they represent only a small fraction of existing CTs that will be revealed by future genomic surveillance (Fig. 1b), indicating that referenced CTs should rapidly surpass the number of PFGE types distinguished during 20 years of PulseNet surveillance (4,119 unique ApaI/AscI combinations among 21,158 isolates with PFGE as of 21 December 2015). The largely improved refinement of Lm genotyping using cgMLST is expected to (1) reduce in size clusters accurately detected by PFGE, (2) erase clusters falsely inferred from PFGE and (3) allow earlier detection of clusters that would probably remain ignored when belonging to hyper-prevalent PFGE profiles. Together, these highly significant improvements in Lm typing will strongly reduce and even eliminate unnecessary epidemiological investigations, which is a major draw-back of the lack of discrimination of the current standard PFGE and will help to identify the food source of clusters of human cases by refining the definition of cases in case–control studies.
The analysis of a large and geographically diverse collection of Lm genomes also allowed us to determine the population structure of this species with unprecedented precision. The sharp discontinuities observed within the phylogenetic diversity of Lm allowed the unambiguous identification and definition of sublineages, which will constitute the basis of a universal genome-based nomenclature. This nomenclature has the advantage of being congruent with the previously widely adopted 7-genes MLST nomenclature and the corresponding major clinically- and food-associated CCs (refs 10,25). In addition, by including a large number of sets of epidemiologically related isolates, we could also define cgMLST types relevant for epidemiological purposes using a statistically optimized cutoff. As cgMLST dissimilarity is highly congruent with phylogenetic relationships, Lm strains can be assigned with high confidence to sublineages and types based on their cgMLST profile. Because this does not require a multiple sequence alignment step, this approach is considerably faster than sequence-based identification and easier to interpret by microbiologists, epidemiologists and public health professionals. Thus, CT classification is poised to become a universal tool for cluster detection and international communication during regional or global Lm outbreaks.
By applying genomic sequencing to a large collection of Lm isolates from diverse geographic origins, we were able to clearly demonstrate repeated international transmission of multiple sublineages of Lm. Furthermore, we identified international groups of genetically highly related isolates, suggestive of recent cross-country and intercontinental transmissions. These results provide a unique population-level based snapshot of Lm international transmission and suggest that cross-country outbreaks that have been recognized so far17,38 are only the tip of the iceberg of Lm long-distance dissemination39. Given the retrospective nature of our analyses, we were not able to identify the epidemiological links among isolates of these international clusters, but these observations suggest that their detection in real time would allow tracing back to common sources and firmly establish the importance of monitoring in real time the diffusion of Lm genotypes at the international level. The cgMLST collaborative approach developed here makes this goal achievable and paves the way for future research aimed at better understanding the routes and contributing factors of Lm dissemination.
We calibrated the short-term evolutionary rate of Lm genomes, and could therefore provide a quantitative estimate of the widely recognized view that Lm genomes are highly stable12,40,41. Because cgMLST types diversify slowly (roughly 0.2 alleles per year), greater discrimination may be needed to decipher short-term patterns of transmission17,18. Therefore, to fully harness the power of genomic sequencing for Lm epidemiology, multi-approach strategies can be applied, including the use of pan-genomic MLST and reference-based SNP-calling. However, in contrast to MLST, genome-wide SNP-based approaches do not rely on predefined genomic loci and require ad hoc reference sequences, thus being more complex to standardize. In this context, the genotyping method and publicly shared nomenclature developed herein will represent a pivotal element of collaborative approaches to control the burden of Lm infections at the global scale.
Methods
Bacterial isolates.
A total of 1,696 Lm genomes were included in the main data set (1,055 human isolates, 475 isolates from food and food-processing environments and 166 isolates from other or unknown sources; Supplementary Table 1 and Supplementary Fig. 1), comprising isolates collected between 1960 and 2015, mostly from North America and Europe. This set included the 104 genomes representative of the clonal diversity of Lm used for core genome definition25, genomic sequences from isolates collected in the context of Lm surveillance programmes in Canada (n = 36 isolates), Denmark (n = 224), France (n = 112), the UK (n = 448) and the USA (n = 758) and 14 genomes from a German–Austrian outbreak17. This collection included (1) prospectively collected isolates and (2) isolates collected in the frame of outbreak investigations or mother–child transmission cases (Supplementary Table 1 and Supplementary Fig. 1). In addition, 34 historical isolates (Supplementary Table 5) were included for analysis of Lm evolutionary rates. DNA extraction, library preparation and Illumina sequencing using MiSeq, NextSeq or HiSeq instruments were performed locally in each reference centre. Sequence assembly was performed using BioNumerics v.7.5 (Applied Maths NV) or CLC Assembly Cell 4.3.0 (Qiagen). Provenance data and genomic assembly details of the 1,696 isolates are listed in Supplementary Table 1.
Validation of a universal cgMLST scheme for Lm genotyping.
A previously defined Lm core genome with 1,791 loci25 was further refined by removing genes present in fewer than 95% of 957 high-quality genome sequences (Supplementary Fig. 1), genes with close paralogues and genes belonging to the 7-MLST scheme (Supplementary Section 2.1). This filtering procedure led to a final subset of 1,748 core genes, here referred to as the Lm cgMLST scheme (Supplementary Tables 2 and 3). The levels of diversity, selection and recombination were quantified for each cgMLST locus (Supplementary Section 2.2). The robustness of cgMLST genotyping was tested using both assembly-free and de novo assembly-based methods to ensure that the allelic profiles generated by the two approaches are consistent and to exclude potential assembly artefacts. The performance of different assemblers was also tested at different sequencing coverage depths (Supplementary Section 2.4).
Comparison of cgMLST and PFGE genotyping.
To compare cgMLST with PFGE for Lm strain typing, we analysed, in parallel, 100 isolates (57 human isolates, 33 food isolates and 10 isolates from food production environments) prospectively collected between January and April 2015 in the frame of the French listeriosis surveillance system by the National Reference Center for Listeria (Institut Pasteur, France). PFGE restriction profiles were obtained using the enzymes AscI and ApaI according to PulseNet standardized procedures (http://www.cdc.gov/pulsenet/PDF/listeria-pfge-protocol-508c.pdf) and were analysed using BioNumerics. PFGE and cgMLST typing results were compared using Simpson’s index of diversity and the adjusted Wallace index of concordance (see Supplementary Section 2.5 for details).
Phylogenetic and clustering analyses.
The phylogenetic relationships of the 1,696 isolates were inferred based either on the allelic profiles or on the recombination-purged multiple sequence alignments of the 1,748 loci (see Supplementary Section 2.6 for details). Single-linkage clustering analysis was performed from the p-distances among allelic profiles (cgMLST allelic distances, that is, proportion of mismatched loci among those that are called in both strains). Clustering efficiency (optimizing both compactness within clusters and separateness among clusters) was assessed with Dunn’s index (Supplementary Section 2.7) using different allelic mismatch thresholds.
Phylogeography and temporal analysis.
Geographical transitions within major sublineages were inferred from FastME v.2.07 trees using discrete trait transition modelling based on 100 simulations with the make.simmap tool in the phytools R package42,43. Once the ancestral states were estimated, the total number of character changes was computed from the resulting set of trees, using the count.simmap function within the same R package43.
To estimate the evolutionary rate of sequences and cgMLST profiles, 22 historical isolates belonging to MLST clonal complex CC1 and 12 isolates from clonal complex CC9, collected between 1921 and 1974, were analysed jointly with the isolates from sublineages SL1 and SL9 (see below) from the main data set (Supplementary Section 2.8, Supplementary Tables 1 and 5). Phylogenetic analyses were performed using FastME on p-distances estimated from either concatenated multiple sequence alignments or cgMLST profiles. Linear regression of the root-to-tip distances against the year of isolation was carried out using Path-O-Gen v1.4 (http://tree.bio.ed.ac.uk/software/pathogen/). The rate of evolution of SL1 and SL9 genomes were independently estimated from the concatenated multiple sequence alignments of the 1,748 loci using BEAST v.2.3.1 (ref. 44). For this analysis, Gubbins45 was used to detect recombination within the alignments. Isolates with recombinant regions were discarded from the alignments (Supplementary Section 2.8). Subsequently, the mean of the rates of SL1 and SL9 (2.5 × 10⁻⁷ substitutions per site per year) was used to estimate the age of all major sublineages using BEAST v.2.3.1 (ref. 44). Details of the temporal analysis methods are provided in Supplementary Section 2.8. Genetic divergence as a function of the time span between the first and last isolate of outbreak sets and international clusters was evaluated using regression analysis.
Determination of PCR serogroups, virulence and resistance genes profiles.
To investigate the biological differences among sublineages, the PCR-serogroup and the presence of 76 loci involved in virulence or resistance were deduced in silico from genomic sequences using the BIGSdb platform23 for each of the 1,696 genomes (see Supplementary Section 2.9 for details).
Online implementation of an open bioinformatics platform for Lm strain nomenclature and genome analysis.
To make the cgMLST-based nomenclature sharable and expandable, the Lm cgMLST scheme was implemented in an integrative database and analysis platform (BIGSdb-Lm) powered by the BIGSdb v.1.10 (ref. 23) bioinformatics tool. To unify Lm genotyping resources, the classical 7-gene MLST scheme was transferred into the BIGSdb-Lm platform. Openly accessible predefined schemes for molecular serogrouping and for virulence and resistance gene analyses were also incorporated into the BIGSdb-Lm platform. BIGSdb-Lm is publicly accessible at http://bigsdb.pasteur.fr/listeria.
Supplementary Material
Acknowledgements
The authors thank K. Jolley (Oxford University) for assistance with BIGSdb implementation, PulseNet International Network members for continuous surveillance and data sharing, the Genomics platform (PF1, Institut Pasteur) for assistance with sequencing, D. Mornico (Institut Pasteur) for assistance with the submission of raw data, J. Haase and M. Achtman (Environmental Research Institute, Ireland) for providing cultures of historical isolates of SL1. The authors also thank N. Tessaud-Rita, G. Vales and P. Thouvenot (National Reference Centre for Listeria, Institut Pasteur) for recovering and extracting DNA from historical isolates of SL9.This work was supported by Institut Pasteur, INSERM, Public Health France, French government’s Investissement d’Avenir program Laboratoire d’Excellence “Integrative Biology of Emerging Infectious Diseases” (grant ANR-10-LABX-62-IBEID), European Research Council, Swiss National Fund for Research and the Advanced Molecular Detection (AMD) initiative at CDC.
Footnotes
Supplementary information is available for this paper. Reprints and permissions information is available at www.nature.com/reprints. Correspondence and requests for materials should be addressed to M.L. and S.B.
Competing interests
H.P. and B.P. are co-developers of the BioNumerics software mentioned in the manuscript. The remaining authors declare no competing interests.
Data availability.
FASTQ data files have been deposited in NCBI-SRA and EBI-ENA public archives under the project’s accession numbers PRJEB12738 (Institut Pasteur), PRJEB14476 (Statens Serum Institut), PRJNA248549 (Public Health England) and PRJNA212117 (Centers for Disease Control and Prevention). The accession numbers of all isolates are provided in Supplementary Table 1.
References
- 1.Mutreja A et al. Evidence for several waves of global transmission in the seventh cholera pandemic. Nature 477, 462–465 (2011). [DOI] [PMC free article] [PubMed] [Google Scholar]
- 2.Grad YH et al. Genomic epidemiology of the Escherichia coli O104:H4 outbreaks in Europe, 2011. Proc. Natl Acad. Sci. USA 109, 3065–3070 (2012). [DOI] [PMC free article] [PubMed] [Google Scholar]
- 3.Woolhouse MEJ, Rambaut A & Kellam P Lessons from Ebola: improving infectious disease surveillance to inform outbreak management. Sci. Transl. Med 7, 307rv5 (2015). [DOI] [PMC free article] [PubMed] [Google Scholar]
- 4.van Belkum A et al. Guidelines for the validation and application of typing methods for use in bacterial epidemiology. Clin. Microbiol. Infect 13, 1–46 (2007). [DOI] [PubMed] [Google Scholar]
- 5.Bogner P, Capua I, Cox NJ, Lipman DJ & Others. A global initiative on sharing avian flu data. Nature 442, 981–981 (2006). [Google Scholar]
- 6.Gerner-Smidt P et al. Pulsenet USA: a five-year update. Foodborne Pathog. Dis 3, 9–19 (2006). [DOI] [PubMed] [Google Scholar]
- 7.Grundmann H et al. Geographic distribution of Staphylococcus aureus causing invasive infections in Europe: a molecular-epidemiological analysis. PLoS Med. 7, e1000215 (2010). [DOI] [PMC free article] [PubMed] [Google Scholar]
- 8.ECDP and Control Surveillance of Seven Priority Food- and Waterborne Diseases in the EU/EEA (ECDC, 2015). [Google Scholar]
- 9.Dalton CB et al. An outbreak of gastroenteritis and fever due to Listeria monocytogenes in milk. N. Engl. J. Med 336, 100–106 (1997). [DOI] [PubMed] [Google Scholar]
- 10.Ragon M et al. A new perspective on Listeria monocytogenes evolution. PLoS Pathog. 4, e1000146 (2008). [DOI] [PMC free article] [PubMed] [Google Scholar]
- 11.Chenal-Francisque V et al. Worldwide distribution of major clones of Listeria monocytogenes. Emerg. Infect. Dis 17, 1110–1112 (2011). [DOI] [PMC free article] [PubMed] [Google Scholar]
- 12.Haase JK, Didelot X, Lecuit M, Korkeala H & Achtman M The ubiquitous nature of Listeria monocytogenes clones: a large-scale multilocus sequence typing study. Environ. Microbiol 16, 405–416 (2014). [DOI] [PubMed] [Google Scholar]
- 13.Harris SR et al. Evolution of MRSA during hospital transmission and intercontinental spread. Science 327, 469–474 (2010). [DOI] [PMC free article] [PubMed] [Google Scholar]
- 14.Maiden MCJ et al. MLST revisited: the gene-by-gene approach to bacterial genomics. Nat. Rev. Microbiol 11, 728–736 (2013). [DOI] [PMC free article] [PubMed] [Google Scholar]
- 15.Orsi RH et al. Short-term genome evolution of Listeria monocytogenes in a non-controlled environment. BMC Genomics 9, 539 (2008). [DOI] [PMC free article] [PubMed] [Google Scholar]
- 16.Bergholz TM et al. Evolutionary relationships of outbreak-associated Listeria monocytogenes strains of serotypes 1/2a and 1/2b determined by whole genome sequencing. Appl. Environ. Microbiol 82, 928–938 (2015). [DOI] [PMC free article] [PubMed] [Google Scholar]
- 17.Schmid D et al. Whole genome sequencing as a tool to investigate a cluster of seven cases of listeriosis in Austria and Germany, 2011–2013. Clin. Microbiol. Infect 20, 431–436 (2014). [DOI] [PMC free article] [PubMed] [Google Scholar]
- 18.Kwong JC et al. Prospective whole genome sequencing enhances national surveillance of Listeria monocytogenes. J. Clin. Microbiol 54, 333–342 (2016). [DOI] [PMC free article] [PubMed] [Google Scholar]
- 19.Ruppitsch W et al. Defining and evaluating a core genome MLST scheme for whole genome sequence-based typing of Listeria monocytogenes. J. Clin. Microbiol 53, 2869–2876 (2015). [DOI] [PMC free article] [PubMed] [Google Scholar]
- 20.Stasiewicz MJ, Oliver HF, Wiedmann M & den Bakker HC Whole genome sequencing allows for improved identification of persistent Listeria monocytogenes in food associated environments. Appl. Environ. Microbiol 81, 6024–6037 (2015). [DOI] [PMC free article] [PubMed] [Google Scholar]
- 21.Fretz R et al. Update: multinational listeriosis outbreak due to ‘quargel’, a sour milk curd cheese, caused by two different L. monocytogenes serotype 1/2a strains, 2009–2010. Euro Surveill 15, 19543 (2010). [PubMed] [Google Scholar]
- 22.Pightling AW, Petronella N & Pagotto F Choice of reference sequence and assembler for alignment of Listeria monocytogenes short-read sequence data greatly influences rates of error in SNP analyses. PLoS ONE 9, e104579 (2014). [DOI] [PMC free article] [PubMed] [Google Scholar]
- 23.Jolley KA & Maiden MCJ BIGSdb: scalable analysis of bacterial genome variation at the population level. BMC Bioinformatics 11, 595 (2010). [DOI] [PMC free article] [PubMed] [Google Scholar]
- 24.Pightling AW, Petronella N & Pagotto F The Listeria monocytogenes core-genome sequence typer (LmCGST): a bioinformatic pipeline for molecular characterization with next-generation sequence data. BMC Microbiol. 15, 29 (2015). [DOI] [PMC free article] [PubMed] [Google Scholar]
- 25.Maury M et al. Uncovering Listeria monocytogenes hypervirulence by harnessing its biodiversity. Nat. Genet 48, 308–313 (2016). [DOI] [PMC free article] [PubMed] [Google Scholar]
- 26.Cantinelli T et al. ‘Epidemic clones’ of Listeria monocytogenes are widespread and ancient clonal groups. J. Clin. Microbiol 51, 3770–3779 (2013). [DOI] [PMC free article] [PubMed] [Google Scholar]
- 27.Chenal-Francisque V et al. Clonogrouping, a rapid multiplex PCR method for identification of major clones of Listeria monocytogenes. J. Clin. Microbiol 53, 3355–3358 (2015). [DOI] [PMC free article] [PubMed] [Google Scholar]
- 28.Ferreira V, Wiedmann M, Teixeira P & Stasiewicz MJ Listeria monocytogenes persistence in food-associated environments: epidemiology, strain characteristics, and implications for public health. J. Food Prot 77, 150–170 (2014). [DOI] [PubMed] [Google Scholar]
- 29.Piffaretti JC et al. Genetic characterization of clones of the bacterium Listeria monocytogenes causing epidemic disease. Proc. Natl Acad. Sci. USA 86, 3818–3822 (1989). [DOI] [PMC free article] [PubMed] [Google Scholar]
- 30.Wiedmann M et al. Ribotypes and virulence gene polymorphisms suggest three distinct Listeria monocytogenes lineages with differences in pathogenic potential. Infect. Immun 65, 2707–2716 (1997). [DOI] [PMC free article] [PubMed] [Google Scholar]
- 31.Leclercq A et al. Characterization of the novel Listeria monocytogenes PCR serogrouping profile IVb-v1. Int. J. Food Microbiol 147, 74–77 (2011). [DOI] [PubMed] [Google Scholar]
- 32.Cotter PD et al. Listeriolysin S, a novel peptide haemolysin associated with a subset of lineage I Listeria monocytogenes. PLoS Pathog. 4, e1000144 (2008). [DOI] [PMC free article] [PubMed] [Google Scholar]
- 33.Jacquet C et al. A molecular marker for evaluating the pathogenic potential of foodborne Listeria monocytogenes. J. Infect. Dis 189, 2094–2100 (2004). [DOI] [PubMed] [Google Scholar]
- 34.Verghese B et al. Comk prophage junction fragments as markers for Listeria monocytogenes genotypes unique to individual meat and poultry processing plants and a model for rapid niche-specific adaptation, biofilm formation, and persistence. Appl. Environ. Microbiol 77, 3279–3292 (2011). [DOI] [PMC free article] [PubMed] [Google Scholar]
- 35.Rabinovich L, Sigal N, Borovok I, Nir-Paz R & Herskovits AA Prophage excision activates Listeria competence genes that promote phagosomal escape and virulence. Cell 150, 792–802 (2012). [DOI] [PubMed] [Google Scholar]
- 36.Müller A et al. The Listeria monocytogenes transposon Tn6188 provides increased tolerance to various quaternary ammonium compounds and ethidium bromide. FEMS Microbiol. Lett 361, 166–173 (2014). [DOI] [PubMed] [Google Scholar]
- 37.Schmitz-Esser S, Müller A, Stessl B & Wagner M Genomes of sequence type 121 Listeria monocytogenes strains harbor highly conserved plasmids and prophages. Front. Microbiol 6, 380 (2015). [DOI] [PMC free article] [PubMed] [Google Scholar]
- 38.Acciari VA et al. Tracing sources of Listeria contamination in traditional Italian cheese associated with a US outbreak: investigations in Italy. Epidemiol. Infect 2, 1–9 (2015). [DOI] [PMC free article] [PubMed] [Google Scholar]
- 39.Leclercq A, Charlier C & Lecuit M Global burden of listeriosis: the tip of the iceberg. Lancet Infect. Dis 14, 1027–1028 (2014). [DOI] [PubMed] [Google Scholar]
- 40.Kuenne C et al. Reassessment of the Listeria monocytogenes pan-genome reveals dynamic integration hotspots and mobile genetic elements as major components of the accessory genome. BMC Genomics 14, 47 (2013). [DOI] [PMC free article] [PubMed] [Google Scholar]
- 41.Holch A et al. Genome sequencing identifies two nearly unchanged strains of persistent Listeria monocytogenes isolated at two different fish processing plants sampled 6 years apart. Appl. Environ. Microbiol 79, 2944–2951 (2013). [DOI] [PMC free article] [PubMed] [Google Scholar]
- 42.Bollback JP SIMMAP: stochastic character mapping of discrete traits on phylogenies. BMC Bioinformatics 7, 88 (2006). [DOI] [PMC free article] [PubMed] [Google Scholar]
- 43.Revell LJ Phytools: an R package for phylogenetic comparative biology (and other things). Methods Ecol. Evol 3, 217–223 (2012). [Google Scholar]
- 44.Bouckaert R et al. BEAST 2: a software platform for Bayesian evolutionary analysis. PLoS Comput. Biol 10, e1003537 (2014). [DOI] [PMC free article] [PubMed] [Google Scholar]
- 45.Croucher NJ et al. Rapid phylogenetic analysis of large samples of recombinant bacterial whole genome sequences using Gubbins. Nucleic Acids Res. 43, e15 (2015). [DOI] [PMC free article] [PubMed] [Google Scholar]
Associated Data
This section collects any data citations, data availability statements, or supplementary materials included in this article.
Supplementary Materials
Data Availability Statement
FASTQ data files have been deposited in NCBI-SRA and EBI-ENA public archives under the project’s accession numbers PRJEB12738 (Institut Pasteur), PRJEB14476 (Statens Serum Institut), PRJNA248549 (Public Health England) and PRJNA212117 (Centers for Disease Control and Prevention). The accession numbers of all isolates are provided in Supplementary Table 1.