

Abstract
Although previous studies showed that children are the primary source of old-age support in China, much less is known about the availability and sources of social support among childless elders. Also, little research has explored how older adults’ social support transitions over time by childless status. Using the 2005 and 2011 Chinese Longitudinal Healthy Longevity Survey (N=14,575), this study examined the transition of living arrangement and sources of social support by childless status among adults aged 65 and older. A series of multinomial logistic and linear regression models were used to analyze the data. Results show that compared to elders with children, childless elders were more likely to live alone or in an institution at baseline, but their probability of living alone decreased substantially while that of living in an institution increased modestly in the 6-year follow-up. Moreover, childless elders generally had fewer support sources, but this disadvantage became smaller over time. Although childless elders were significantly more likely to depend on nobody, the spouse, grandchildren (or other relatives), or nonrelatives for support at baseline, this pattern disappeared in the follow-up likely due to mortality selection. Findings imply that although the risk of social isolation among childless elders becomes lower as age progresses, garnering more social resources at younger ages may help reduce their premature mortality.
Keywords: childless, China, living arrangement, longitudinal analysis, social support
Introduction
Rapid population ageing has raised many concerns about old-age support in China mainly because institutional support such as pensions, long-term care, and other social services remains inadequate to meet the needs of elders in both rural and urban areas, though the situation is particularly severe in less resourceful rural villages (Korinek et al., 2011; Wang, 2006; Zimmer & Kwong, 2003). A particularly vulnerable group in old age in China is childless individuals as family members remain the primary source of instrumental, financial, and emotional support for elders (Feng, 2018; Guo, 2014; Korinek et al., 2011; Zhang & Liu, 2007). Because adult children play an indispensable role in elder care, childless Chinese may lack a major source of social support in later life. In 2011, an estimate of 5.10% of men and 3.84% women aged 65 and older had no biological children (Zhou et al., 2019). The childless population is expected to grow in the near future due to cultural changes (e.g. voluntary childlessness), increasing rates of low fertility or infertility, and unbalanced sex ratios at birth (Jiang et al., 2014; Zeng & Hesketh, 2016; Zhang, 2017). Although the Chinese government ended the one-child policy in 2015, the legacy of the 36-years policy will be felt keenly in the years to come as Chinese cohorts affected by the one-child policy enter old age. One potential consequence may be that a greater number of older adults will be childless. For example, it is estimated that over a million families lost their only child in 2010 alone (Feng 2018). The latest statistics indicate that childless older adults are going to reach 79 million around 2050 (Zhang, 2017).
Despite the increasing childless population in China, little attention has been given to the sources and levels of social support among childless elders. This lack of research may be explained by childless elders’ small representation in the studied population as a result of traditional pronatalist culture (e.g., preference for more children and continuation of family line), their higher likelihood of living in an institution, and their higher risk of mortality at younger ages (Cheng et al., 2014; Feng, 2018; Gu et al., 2007; Zhang & Liu, 2007). In addition, little research has explored how disadvantage in social support faced by childless elders, if any, grows or diminishes over time. If the gaps in social support by childless status widen as age advances, elderly support programs may need to plan more care resources for childless elders at older ages. However, if the gaps become smaller due to mortality selection, policies may need to focus on securing social support for middle-aged or young-old childless elders because they are at higher risk of premature mortality compared to elders with children. Using data spanning six years (2005–2011) from the Chinese Longitudinal Healthy Longevity Survey, this study aims to fill the gap in knowledge about the availability and sources of social support among childless elders as they age in China.
Childlessness, social support, and well-being
There are various reasons for not having a living child in late adulthood, including voluntary and involuntary infertility and death of one or more children over the life course (Feng, 2018; Rubinstein, 1987). An emerging number of studies have examined the psychological and physical well-being of childless elders, in comparison to elders with at least one child. Most of these studies showed that childless elders have poorer well-being, including higher levels of loneliness, anxiety, depression, and functional limitation and lower levels of life satisfaction and self-rated health (Cheng et al., 2014; Feng, 2018; Guo, 2014; Liu et al., 2015; Zhang & Liu, 2007). Notably, one of the significant factors underlying their disadvantage in well-being and health is a lack of social support. Some studies suggested that living alone or living with people other than children, having smaller social networks, lack of financial support from children, and lack of emotional closeness to children are associated with lower well-being among elders with or with no children (Cheng et al., 2014; Guo, 2014; Silverstein et al., 2006; Zhang & Liu, 2007).
It is not surprising that childless older adults may have difficulty getting social support compared to elders with living children. According to the hierarchical compensatory substitution model (Cantor, 1979; Shanas, 1979; Wu & Pollard, 1998), people turn to immediate family members, including the spouse and then children, as the primary source of support in times of need and crisis. As the spouse experiences health decline or death, adult children and their spouses often take over the responsibilities of elder care. Only when the spouse and adult children or children-in-law both become unavailable do distant kin, friends, neighbors, and finally formal organizations step in. For example, for Chinese elders whose children live far away for job opportunities, grandchildren or other relatives around may contribute to in-kind and emotional support, if not financial support (Silverstein et al., 2006). A few studies also suggest that childless elders are more likely to live in an institution such as nursing home than elders with multiple children due to having limited amounts of informal care resources (Gu et al., 2007), and that childless older men, particularly those being never-married and living in rural areas, may need to exchange resources in return for care from their extended family members including nieces and nephews (Zhang & Liu, 2007). In addition, recent research shows that compared to those with children, childless elders are less likely to receive economic support from any source (i.e., not only children but also grandchildren, other relatives, and friends) (Zhou et al., 2019). Therefore, according to the hierarchical compensatory substitution model, childless elders may rely more on the spouse if available followed by other relatives, friends, neighbors, live-in caregivers and social workers for support, as compared to elders with children relying more on adult children (Guo, 2014; Wu & Pollard, 1998). Overall, childless elders may have a smaller variety of support sources, and they may also have higher risks of not having any support at all because they lack a crucial source of old-age support in China—adult children.
Although quite a few studies have examined living arrangement and the benefit of having multiple children in late adulthood in China (Gustafson & Huang, 2014; Korinek et al., 2011; Xie & Zhu, 2009; Zimmer & Kwong, 2003), few have systemically examined access to support among childless elders in comparison to elders with children, and little is known about whom childless elders turn to in times of need. To our best knowledge, nearly no research has empirically explored how disparity in social support by childless status transitions over time as older adults age, and few studies have taken mortality selection and other sample attrition into account when assessing old-age support. Because childless elders have significantly higher mortality risk than elders with one or more children (Gu et al., 2007), childless people who survive to older ages may be highly selective of those who can garner more social support. In this sense, differences in access to social support by childless status may narrow as age advances. Alternatively, gaps in access to social support by childless status may grow with age because childless elders do not have children to rely on in the increasing need of help and/or in the face of losing their spouse. However, prior studies that rely on cross-sectional data are limited by observing gaps in social resources by childless status at one point in time only, and thus cannot assess how these gaps change over time. Whether the gaps in social support are closing or growing over time within a cohort of older adults is understudied but important for elder care policies. Our study will examine multiple aspects of old-age support, including living arrangement, variety of support sources, and the primary source of instrumental and emotional support using longitudinal data.
Hypotheses
Childless elders are more likely to live alone or in an institution than to live with someone in a household at baseline, compared to elders with children. This difference by childless status may change in the follow-up as more childless elders become frail, move into an institution, or die.
Childless elders have a smaller variety of support sources than elders with children at baseline and the follow-up. This difference in the variety of sources may change (increase or decrease) over time.
Childless elders are more likely to rely on spouse, grandchildren or other relatives, nonrelatives, or nobody for primary support than elders with children. The difference may change (grow or narrow) over time.
Data and methods
Data
The study uses data from the 2005 (4th wave) and 2011 (6th wave) Chinese Longitudinal Healthy Longevity Survey (CLHLS). The CLHLS, started in 1998, was originally designed to study the demographic, socioeconomic, psychological, and health status of the oldest old (aged 80 and above), but the sample has been expanded to include the young-old (aged 65–79) since 2002 (Zeng et al., 2002, 2015). We set the 2005 survey as our baseline because it has more detailed information about social support. Our presented analysis does not include the 2008 data (5th wave) because there are few statistically significant changes in living arrangement and the sources of social support during the 3-year period (2005–2008), although the direction of changes is largely consistent with the 6-year period (2005–2011). Therefore, in this paper we only show results based on data from the 2005 and 2011 waves.
The CLHLS was fielded in a randomly selected half of the counties/cities in 22 of the 31 provinces in China in 1998, and the survey areas covered 85% of the total Chinese population (Zeng et al., 2015). Local ageing committees provided name lists of centenarians in the randomly selected counties/cities, including persons residing in institutions. For each centenarian with a pre-designated random code, one nearby octogenarian and one nearby nonagenarian with pre-designated age and sex were interviewed. The term ‘nearby’ typically indicates the same village or the same street if applicable, or the same town, county, or city. The procedure for sampling the young-old is similar to the process used for those aged 80 to 99. A more detailed description of the sampling design and data quality of the CLHLS appears elsewhere (Gu, 2008). In 2005, 15,638 older adults were interviewed. After removing cases without being assigned a weight due to inability to validate the age (i.e., cases aged 106 and older) and cases with missing values on any covariates, our final sample includes 14,575 respondents. In this final sample, 26% (3,834 cases) were re-interviewed while 48% (6,997 cases) were dead and the rest of 26% (3,744 cases) were lost to follow-up in 2011. Although the CLHLS added new respondents in follow-up surveys to replenish the sample (i.e., replacing those deceased or lost to follow-up), our analysis does not include these new cases because they do not have longitudinal observations for the study of change.
Measures
Childless status, our key independent variable, is a binary variable indicating whether or not the respondent had a surviving child at the time of the survey in 2005 (1=yes, 0=no). We created multiple social support variables for our analysis. Living arrangement has three categories, indicating whether the respondent was living with someone in a household (reference), alone, or in an institution. Number of unique support sources is used to measure the variety of social ties that the respondent can rely on for instrumental, companionate, and emotional support. The variable represents the diversity of support network across three domains based on the following questions: “who do you ask first for help when you have problems/difficulties?”, “to whom do you usually talk most frequently in daily life?”, and “to whom do you talk first when you need to tell something of your thoughts?”. For each of these questions, respondents can nominate up to three kinds of relationships that provide them support by the order of importance/frequency. There were ten kinds of relationships respondents can select from, including: spouse, sons, daughters, daughters-in-law, sons-in-law, grandchildren and their spouses, other relatives, friends/neighbors, social workers, and housekeepers. The variable counts the number of unique relationship types respondents asked for help, talked in daily life, and shared thoughts. The relationship type that repeatedly appeared in two or three support domains was counted only once.
Four variables of primary source of social support are examined. Three of them were derived from the same set of questions for the number of unique support sources above, including primary person to ask for help, primary person to talk daily, and primary person to share thoughts. Additionally, the fourth variable—primary source of sick care—was measured by the following question: “when you are sick, who usually takes care of you?” Respondents can nominate one relationship that provides the most care to them. To simply the analysis, all these variables were grouped into five categories: children or children-in-law (reference), spouse, grandchildren or other relatives, nonrelatives (including friends, neighbors, social workers, and live-in caregivers), and nobody.
Because childless status, living arrangement, and social support may differ by sociodemographic characteristics and health status, our regression analysis controls for age (in years, 65–105), gender (1=female, 0=male), education (in years, 0–25), marital status (widowed [reference], married, or divorced/separated/never married), geographic location (1=rural, 0=urban), and difficulty in activities of daily living/ADLs (scale 0–12). Difficulty in ADLs was measured by the sum of six functioning items—bathing, dressing, toileting, indoor transferring, continence, and self-feeding, each of which was scored 0 (fully independent), 1 (partially dependent), or 2 (fully dependent).
Methods
We first used multinomial logistic regression models to study the relationship between childless status and living arrangement. We estimated the effects of childlessness in 2005 on living arrangement in 2005 and 2011, respectively. To take into account of sample attrition between 2005 and 2011, a category “dead or lost to follow-up” was added to the outcome variable in 2011 so we can examine the competing risks between living with someone, living alone, living in an institution, and being dead or lost to follow-up. Due to concerns about the violation of the Independence of Irrelevant Alternatives (IIA) assumption in multinomial logistic regression models, we performed Small-Hsiao tests to determine if adding a category to the dependent variable would significantly alter the relative risks of the existent categories. Test results suggest that the IIA assumption is not violated (see Appendix A, Model 1). While we prefer to apply the two-step Heckman selection method (Heckman, 1977) to adjust for sample attrition, this method was only developed for continuous outcomes, but not for categorical outcomes. Note that we did not include childless status in 2011 in any analysis throughout the paper because childless status barely changed between 2005 and 2011: only ten people in the sample became childless during this period. To avoid multicollinearity, we included only childless status in 2005 as a predictor in all the models.
For the analysis of number of unique support sources, we first used linear regression models to estimate how childlessness in 2005 predicts the number of unique support sources in 2005. Because the outcome variable is continuous, we adopt two-step Heckman selection models to adjust for potential sample selection bias in 2011 (Heckman, 1977). In the first-step, the selection equation predicted a nonselection hazard (the inverse of the Mills’ ratio) with childless status, age, gender, education, marital status, geographic location, and difficulty in ADLs. Additionally, for the identification of the selection equation, at least one more variable that is not in the main equation is required. Therefore, we also included living arrangement and financial insecurity (measured by whether or not all financial sources are enough to cover daily expenses) in 2005 in the selection equation. In the second-step, the predicted nonselection hazard was entered as a control variable in the equation of number of unique support sources in 2011.
Finally, we used multinomial logistic regression models to examine the relationship between childless status in 2005 and primary sources of social support in 2005 and 2011, respectively. In all the 2011 models, we included an additional category “dead or lost to follow-up” to the outcome variable. Again, we used Small-Hsiao tests to examine any potential violation of the IIA assumption in these multinomial logistic regression models; we found little evidence for violation (see Appendix A, Models 2–5). Because there are totally eight models (four outcomes × two periods), for parsimony and ease of interpretation, we only reported predicted probabilities for the outcome categories by childless status. Full results are available upon request. Lastly, we applied sampling weights to our analyses because the CLHLS oversampled elders, particularly men, at advanced ages.
Results
Descriptive statistics
Descriptive statistics by childless status are presented in Table 1. First, among the sampled adults who completed the interview in 2005, many of them died by the 2011 follow-up or dropped out of the survey. In particular, childless elders are less likely than elders with children to complete the follow-up survey in 2011 (38% vs. 51%) mainly because childless elders are almost twice as likely to die before the 2011 interview (41% vs. 21%). This suggests the importance of considering sample attrition in our longitudinal analysis. Further, Table 1 shows that in 2005 childless elders are more likely to live alone or in an institution than elders with children. However, in 2011 among those who are re-interviewed, childless elders become less likely to live alone (although they remain more likely to live in an institution). In addition, childless elders have fewer sources of social support they can turn to for help, to have daily conversation, and to share thoughts than elders with children in both baseline and follow-up. But regardless of childless status, the average number of sources is larger in 2011 than 2005. Compared to elders with children, childless elders are also more likely to rely on grandchildren or other relatives, nonrelatives such as friends, neighbors, and social workers as their primary source of support in 2005. Notably, childless elders exhibit higher rates of having no one to rely on. For example, although 34% of childless respondents reported the spouse as the primary person who provides them with sick care and 19% of them reported that children-in-law assume this role, another 15%, 15%, and 17%, respectively, relied primarily on grandchildren/other relatives, nonrelatives, and nobody for sick care. In contrast, the majority of elders with children received sick care from children or children-in-law (49%) and the spouse (46%), while only a very small portion of them relied on grandchildren and other relatives (1%), nonrelatives (1%), or no one (2%). In the 2011 follow-up, however, the difference in who to provide primary sick care by childless status becomes insignificant. In particular, among those who are re-interviewed in 2011, gaps in the percentage of relying on the spouse, grandchildren/other relatives, nonrelatives, or even nobody become negligible. This pattern is also shown in other types of instrumental or emotional support, including the primary persons to ask for help, to talk daily, and to share thoughts.
Table 1:
Sample characteristics by childless status (N=14,575)
| Childless status in 2005 | ||
|---|---|---|
| Childless elders | Elders with children | |
|
| ||
| Follow-up status in 2011 (%)* | ||
| Completed survey | 38.2 | 50.6 |
| Dead | 40.8 | 20.7 |
| Lost to follow-up | 21.0 | 28.7 |
| Living arrangement in 2005 (%)*** | ||
| Living with someone | 68.2 | 87.4 |
| Living alone | 25.7 | 11.9 |
| Living in an institution | 6.2 | 0.7 |
| Living arrangement in 2011 (%)*** | ||
| Living with someone | 29.8 | 42.4 |
| Living alone | 0.7 | 7.8 |
| Living in an institution | 7.8 | 0.4 |
| Dead/lost to follow-up | 61.8 | 49.4 |
| Number of unique support sources, 2005*** | 2.2 | 3.1 |
| Number of unique support sources, 2011*** | 2.4 | 2.9 |
| Primary source of sick care, 2005 (%)*** | ||
| Children/children-in-law | 18.8 | 49.0 |
| Spouse | 34.3 | 46.4 |
| Grandchildren or other relatives | 14.5 | 1.1 |
| Nonrelatives | 15.3 | 1.3 |
| Nobody | 17.1 | 2.3 |
| Primary source of sick care, 2011 (%) | ||
| Children/children-in-law | 14.5 | 29.0 |
| Spouse | 18.5 | 19.0 |
| Grandchildren or other relatives | 2.8 | 0.8 |
| Nonrelatives | 2.2 | 0.7 |
| Nobody | 0.3 | 1.2 |
| Dead/lost to follow-up | 61.8 | 49.4 |
| Primary person to ask for help, 2005 (%)*** | ||
| Children/children-in-law | 19.1 | 52.5 |
| Spouse | 30.9 | 43.0 |
| Grandchildren or other relatives | 14.7 | 1.2 |
| Nonrelatives | 18.2 | 1.8 |
| Nobody | 17.1 | 1.6 |
| Primary person to ask for help, 2011 (%)*** | ||
| Children/children-in-law | 12.5 | 29.9 |
| Spouse | 13.9 | 17.6 |
| Grandchildren or other relatives | 5.7 | 0.8 |
| Nonrelatives | 5.9 | 1.1 |
| Nobody | 0.3 | 1.3 |
| Dead/lost to follow-up | 61.8 | 49.4 |
| Primary person to talk daily, 2005 (%)*** | ||
| Children/children-in-law | 11.1 | 30.1 |
| Spouse | 41.2 | 51.2 |
| Grandchildren or other relatives | 13.9 | 3.0 |
| Nonrelatives | 32.1 | 13.7 |
| Nobody | 1.8 | 2.1 |
| Primary person to talk daily, 2011 (%) | ||
| Children/children-in-law | 4.8 | 14.8 |
| Spouse | 18.9 | 23.3 |
| Grandchildren or other relatives | 5.7 | 1.6 |
| Nonrelatives | 8.3 | 9.3 |
| Nobody | 0.7 | 1.6 |
| Dead/lost to follow-up | 61.8 | 49.4 |
| Primary person to share thoughts, 2005 (%)*** | ||
| Children/children-in-law | 14.1 | 39.1 |
| Spouse | 41.3 | 53.1 |
| Grandchildren or other relatives | 12.5 | 1.4 |
| Nonrelatives | 12.0 | 3.5 |
| Nobody | 20.1 | 2.9 |
| Primary person to share thoughts, 2011 (%)* | ||
| Children/children-in-law | 8.7 | 21.1 |
| Spouse | 18.9 | 23.1 |
| Grandchildren or other relatives | 4.7 | 1.0 |
| Nonrelatives | 0.7 | 3.0 |
| Nobody | 5.4 | 2.4 |
| Dead/lost to follow-up | 61.8 | 49.4 |
| Age in 2005 (years)*** | 76.6 | 72.5 |
| Gender in 2005 (% female) | 66.8 | 52.4 |
| Education in 2005 (years)*** | 2.3 | 3.2 |
| Marital status in 2005 (%)* | ||
| Widowed | 58.6 | 38.7 |
| Married | 39.9 | 59.9 |
| Divorced/separated/never married | 1.6 | 3.4 |
| Difficulty in ADLs in 2005*** | 0.3 | 0.2 |
| Rural residence in 2005 (%) | 58.3 | 57.3 |
|
| ||
| N | 296 | 14,279 |
Note:
p<.05
p<.01
p<.001.
Differences by childless status are tested using Pearson’s chi-square statistics for categorical variables and t statistics for continuous variables. The number of unique support sources in 2011 is calculated only for those who were re-interviewed in 2011 (n=3,834).
There are quite a few differences in sociodemographic characteristics and health status by childless status. Notably, childless elders are older, less educated, less likely to be married (more likely to be widowed), and have more difficulty in ADLs than elders with children.
Living arrangement
Table 2 shows how childlessness is related to living arrangement in 2005 and 2011, adjusted for sociodemographic characteristics and functional health. In 2005, childless elders are more likely to live alone than live with someone in a household compared to their counterparts with children (relative risk ratios/RRR=2.3); they are also more likely to stay in an institution than with someone in a household (RRR=9.6). This residential pattern changed six years later. In 2011, compared to elders with children, childless elders became less likely to live alone than live with someone (RRR=0.09); however, they became much more likely to live in an institution than live with someone (RRR=24.0). Although childless elders exhibit higher risks of mortality or dropout from the 2011 survey, this tendency is not statistically significant when sociodemographic and health characteristics are all adjusted for.
Table 2:
Multinomial logit regression models of living arrangement on childless status, relative risk ratios (N=14,575)
| 2005 |
2011 |
||||
|---|---|---|---|---|---|
| Alone vs. with someone | In an Institution vs. with someone | Alone vs. with someone | In an Institution vs. with someone | Dead or lost to follow-up vs. with someone | |
|
| |||||
| Childless | 2.31* | 9.62*** | 0.09** | 23.95*** | 1.43 |
| (0.94) | (3.57) | (0.08) | (20.67) | (0.67) | |
| Age | 0.98*** | 1.03 | 0.99 | 1.05 | 1.07*** |
| (0.01) | (0.03) | (0.01) | (0.03) | (0.01) | |
| Female | 0.76** | 0.80 | 1.50** | 0.60 | 1.06 |
| (0.08) | (0.27) | (0.20) | (0.24) | (0.07) | |
| Years of education | 1.00 | 1.05 | 0.99 | 1.00 | 1.03** |
| (0.02) | (0.04) | (0.02) | (0.04) | (0.01) | |
| Martial status (Ref: widowed) | |||||
| Married | 0.01*** | 0.03*** | 0.28*** | 0.35* | 0.72*** |
| 0.00 | (0.02) | (0.04) | (0.18) | (0.05) | |
| Divorced/separated | 0.54** | 1.78 | 0.61 | 2.43 | 1.55* |
| (0.10) | (0.83) | (0.20) | (1.93) | (0.28) | |
| Difficulty in ADLs | 0.82** | 0.92* | 0.52** | 0.80 | 1.25*** |
| (0.05) | (0.04) | (0.13) | (0.20) | (0.05) | |
| Rural residence | 1.14 | 0.26*** | 1.23 | 0.40* | 0.65*** |
| (0.11) | (0.09) | (0.15) | (0.16) | (0.04) | |
| Constant | 2.44 | 0.00*** | 0.56 | 0.00** | 0.01*** |
| (0.38) | 0.00 | (0.01) | |||
Note:
p<.05
p<.01
p<.001.
All the independent variables are measured in 2005. Robust standard errors are in parentheses.
Considering that relative risk ratios may be hard to interpret, we also calculated predicted probabilities for each living arrangement type by childless status and year (Table 3). In 2005, when socioeconomic and health statuses are held the same, most childless elders and elders with children live with someone (78% vs. 87%), and childless elders are more likely to live alone (18% vs. 12%) or live in an institution (4% vs. 1%). In 2011, childless elders actually become less likely to live alone than elders with children (1% vs. 8%) while more childless elders live in an institution (7% vs. 0%). Because of death or loss of contact, the percentage of living with someone for both groups decreases substantially by about half (35% vs. 42%).
Table 3:
Predicted probabilities of living arrangement by childless status (N=14,575)
| 2005 |
2011 |
|||
|---|---|---|---|---|
| Dependent variables | Childless | With children | Childless | With children |
|
| ||||
| Living with someone | 0.78 | 0.87 | 0.35 | 0.42 |
| Living alone | 0.18 | 0.12 | 0.01 | 0.08 |
| Living in an institution | 0.04 | 0.01 | 0.07 | 0.00 |
| Dead/lost to follow-up | -- | -- | 0.57 | 0.49 |
Note: Predicted probabilities are estimated based on the multinomial logit regression models in Table 2.
Sources of social support
Table 4 examines how childless status is linked to the number of unique support sources across three domains in 2005 and 2011. On average, childless elders have fewer sources to ask for help, to talk daily, and to share thoughts with than elders with children in 2005. While this difference by childless status persists over time (as shown by the main equation in 2011), the size of difference becomes smaller in 2011. Notably, the coefficient of nonselection hazard suggests that sample selection effects are not significantly related to the number of unique support sources. This is likely because factors associated with participating in the follow-up study (i.e., being “selected”), such as age, education, marital status, functional limitation, and rural residence as shown in the selection equation, are controlled for in the main equation of 2011.
Table 4:
OLS regression models of number of unique support sources on childless status (N=14,575)
| 2005 |
2011 |
||
|---|---|---|---|
| (main equation) | (selection equation) | ||
| Childless | −1.07*** | −0.46* | −0.17 |
| (0.13) | (0.23) | (0.25) | |
| Age | 0.00 | −0.01 | −0.04*** |
| (0.00) | (0.01) | (0.00) | |
| Female | 0.07* | −0.04 | −0.01 |
| (0.03) | (0.05) | (0.04) | |
| Years of education | 0.00 | −0.02* | −0.02** |
| (0.00) | (0.01) | (0.01) | |
| Martial status (ref: widowed) | |||
| Married | 0.23*** | 0.09 | 0.05 |
| (0.03) | (0.05) | (0.04) | |
| Divorced/separated | 0.27** | −0.10 | −0.33** |
| (0.09) | (0.15) | (0.10) | |
| Difficulty in ADLs | −0.03** | −0.09* | −0.15*** |
| (0.01) | (0.04) | (0.02) | |
| Rural residence | 0.11*** | 0.12 | 0.27*** |
| (0.03) | (0.07) | (0.04) | |
| Constant | 2.93*** | 3.36*** | 2.90*** |
| (0.19) | (0.41) | (0.23) | |
| Nonselection hazard a | 0.16 | -- | |
| (0.24) | -- | ||
| Living arrangement (ref: with someone) | |||
| Alone | −0.04 | ||
| (0.06) | |||
| In an institution | −0.55* | ||
| (0.22) | |||
| Financial insecure | 0.04 | ||
| (0.06) | |||
Note:
p<.05
p<.01
p<.001.
All the independent variables are measured in 2005. Robust standard errors are in parentheses.
Nonselection hazard (i.e., inverse of the Mill’s ratio) is estimated from the selection equation.
Finally, Table 5 presents predicted probabilities of primary sources of support by childless status. Overall, differences in primary sources by childless status narrow over time. In 2005, childless elders are significantly more likely to rely on grandchildren, other relatives, nonrelatives, or nobody for instrumental support (sick care and help with problems) and emotional support (talking and sharing thoughts); they are also more likely to rely on the spouse for emotional support. In contrast, elders with children are much more likely to have children or children-in-law to provide support of different sorts. However, most of these gaps disappear in 2011. Although the gaps in relying on children/children-in-law as primary support remain significant in the follow-up, childless elders become no more likely to depend on the spouse, grandchildren and other relatives, nonrelatives, or even nobody as compared to elders with children. As the risk of death and dropout is incorporated into the 2011 models, differences in sources of social support are compressed. It suggests that most of the childless elders who rely on grandchildren/other relatives, nonrelatives, or nobody in 2005 transition to the category “dead/lost to follow-up” in 2011.
Table 5:
Predicted probabilities of primary sources of social support by childless status (N=14,575)
| 2005 |
2011 |
|||
|---|---|---|---|---|
| Dependent variables | Childless | With children | Childless | With children |
|
| ||||
| Rely on for sick care | ||||
| Children/children-in-law | 0.14* | 0.49 | 0.17 | 0.29 |
| Spouse | 0.53 | 0.46 | 0.29 | 0.19 |
| Grandchildren or other relatives | 0.08* | 0.01 | 0.01 | 0.01 |
| Nonrelatives | 0.10* | 0.01 | 0.00 | 0.01 |
| Nobody | 0.15* | 0.02 | 0.00 | 0.01 |
| Dead/lost to follow-up | 0.52 | 0.49 | ||
| Ask for help when having problems | ||||
| Children/children-in-law | 0.15* | 0.53 | 0.15* | 0.30 |
| Spouse | 0.46 | 0.43 | 0.22 | 0.18 |
| Grandchildren or other relatives | 0.09* | 0.01 | 0.02 | 0.01 |
| Nonrelatives | 0.15* | 0.02 | 0.05 | 0.01 |
| Nobody | 0.15 | 0.02 | 0.00 | 0.01 |
| Dead/lost to follow-up | 0.56 | 0.49 | ||
| Talk frequently in daily life | ||||
| Children/children-in-law | 0.06* | 0.30 | 0.04* | 0.15 |
| Spouse | 0.61* | 0.51 | 0.29 | 0.23 |
| Grandchildren or other relatives | 0.09* | 0.03 | 0.05 | 0.02 |
| Nonrelatives | 0.23* | 0.14 | 0.07 | 0.09 |
| Nobody | 0.01 | 0.02 | 0.00 | 0.02 |
| Dead/lost to follow-up | 0.55 | 0.49 | ||
| Share thoughts | ||||
| Children/children-in-law | 0.09* | 0.39 | 0.09* | 0.21 |
| Spouse | 0.62* | 0.53 | 0.29 | 0.23 |
| Grandchildren or other relatives | 0.07* | 0.01 | 0.03 | 0.01 |
| Nonrelatives | 0.09 | 0.03 | 0.01* | 0.03 |
| Nobody | 0.13* | 0.03 | 0.05 | 0.02 |
| Dead/lost to follow-up | 0.55 | 0.49 | ||
Note:
refers to significant difference in predicted probabilities between childless elders and elders with children at least at the p<.05 significance level. Predicted probabilities are calculated based on multinomial logit regression models of primary support sources, assuming all the covariates at their means. The covariates include age, gender, years of education, marital status, difficulty in ADLs, and rural (vs. urban) residence in 2005.
Discussion
Based on the hierarchical compensatory substitution (HCS) model, we investigated the availability and sources of social support of childless older adults over time using nation-wide longitudinal data in China. Our hypotheses are largely supported with a few exceptions, and several important conclusions can be drawn from our results. First, consistent with previous research (Gu et al., 2007), we find that childless elders were more likely to live in institutions than elders with children at both baseline and 6-year follow-up (Hypothesis 1). Despite that the probability of staying in an institution remains low in both years (4% in 2005 and 7% in 2011), this finding supports the HCS model that childless people rely more on formal support than do people with children (Cantor, 1979; Wu & Pollard, 1998). However, to our surprise, although childless elders were more likely to live alone at baseline than elders with living children, they became less likely to live alone in the follow-up. This may result from higher rates of mortality and institutionalization over time among the childless who lived alone at baseline. As age further advances, living alone is no longer a viable option for childless elders. Another possibility is that for older adults with children, coresidence with children has been steadily declining over time as more and more adult children move away from their hometowns to look for jobs or prefer to live apart from their parents due to rapid social, cultural and economic changes (Zhu & Xie, 2017).
Second, our finding supports that childless elders have fewer sources they can turn to for emotional and instrumental support than elders with children at both baseline and the follow-up (Hypothesis 2). However, this disadvantage for childless people narrows between 2005 and 2011. The finding suggests that as age progresses, some childless elders are able to gain formal support through institutions, thereby compensating for some of the disadvantage. This reflects that social welfare programs funded by the government have primarily targeted the most vulnerable groups, including elders with “three-nos”—no children, no income, and no relatives (Zhan et al., 2008; Zhang, 2017). However, as the use of institutional elder care becomes less stigmatized and more private facilities become available in China, older adults with children will increasingly seek institutional care as an option to complement extant informal care they receive (Zhan et al., 2008, 2011). This trend may widen the gap in sources of care by childless status in the future because older adults with children benefit from having an additional care source.
Third, our results show that childless elders are more likely to rely on spouse, grandchildren or other relatives, nonrelatives, or nobody for social support than elders with children at baseline, but this difference by childless status narrows or disappears over time when sample attrition is taken into account (Hypothesis 3). Notably, childless elders were vulnerable in terms of having no one to take care of them in sickness or to share thoughts at baseline (the rates are 17–20%), but this disadvantage no longer existed in 2011. Differences in the probability of depending on other relatives or nonrelatives also turn negligible over time. Our results suggest that sample attrition, particularly resulting from mortality among the childless, compresses the differences in social support by childless status in old age.
Overall, our findings based on longitudinal analysis indicate that the impact of childlessness on the availability and sources of social support tend to decline as age advances. Although the narrowing gaps in social support by childless status relieve some concerns about the provision of elder care for childless people, our results also imply that higher mortality among childless elders may contribute to the closing gaps in social support. Consistent with previous research on the link between lack of social support, loneliness, and morbidity and mortality (Berkman & Glass, 2000; Hawkley et al., 2008; Umberson & Montez, 2010), our study suggests that strengthening social support in an earlier life stage (e.g., middle adulthood and the beginning of late adulthood) might help reduce premature mortality among childless elders.
There are several limitations in our study. Because of small sample size for childless elders, our analysis was not further stratified by urban vs. rural residence. However, in supplementary analysis, we tested the interaction between childless status and the location of residence and found that the effects of childlessness on social resources are not statistically different between rural and urban older adults (results are available upon request). Although all our presented analysis has controlled for urban vs. rural residence, we acknowledge that our results may understate the lack of social resources among rural childless elders. As previous research noted, because fewer social facilities exist where rural elders can socialize with others or engage in community activities (Li et al., 2015), rural childless elders may have even less social support than urban childless elders. Similarly, the small sample size does not allow us to distinguish elders who have never had a child from those whose children died. These two groups my have different experience of social support access (Zhang, 2017). Moreover, because the 2005 CLHLS is not the first wave of the longitudinal data collection, we may underestimate the true effects of mortality selection that has already accumulated over previous waves. Supplementary analysis suggests that among the old-old cohort (age 80 and above) who first participated in the study in 1998, there was no difference in dropout rates by childless status (Appendix B, Figure B1). But among the young-old cohort (age 65–79) who first joined the study in 2002, childless people experienced higher dropout due to mortality and other reasons than people with children (Appendix B, Figure B2). The gap in the proportion of respondents remaining in the study grew over time, and it became statistically significant by 2011. These findings suggest that mortality selection largely happens at younger rather than older ages and support our argument that differences in social resources by childless status narrow or even disappear at more advanced ages due to the selection. Lastly, while the current study examines multiple dimensions of social resources, including living arrangement, number of unique support sources, and primary sources of support, it focuses mainly on the structural aspect (i.e., availability, diversity, and sources) rather than the quality aspect of old-age support (e.g., the perceived sufficiency of support). Future research should continue to explore how quality of social support may vary by childless status. Due to data limitation, we only examined a few aspects of instrumental, emotional, and companionate support. Also, our measures of support sources are based on relationships rather than individuals and thus may underestimate the number of support sources. Future studies would benefit from exploring more comprehensive and refined aspects of social support suggested in previous research (Gottlieb & Bergen, 2010; Wellman & Wortley, 1990).
Despite these limitations, our study expands the understanding of access to social support among childless elders in China. It is one of the few studies that explore changes in social resources in late adulthood using longitudinal survey data. The longitudinal approach allows us to conclude that childless elders generally have fewer social resources than elder parents, but many of their disadvantages diminish with age due to their higher rates of institutionalization and mortality. The findings imply that while risks of social isolation such as living alone and having nobody to provide social support among childless elders become lower as age progresses, garnering more social resources at younger ages may help reduce their premature mortality.
Appendix A. Small-Hsiao tests of IIA assumption (N=14,575)
| Model 1. Living arrangement in 2005 | |||||
| lnL(full) | lnL(omit) | chi2 | P>chi2 | Evidence | |
| Living with someone (reference) | |||||
| Living alone | −521.87 | −515.67 | 12.39 | 0.19 | for IIA |
| Living in an institution | −2272.55 | −2267.16 | 10.77 | 0.29 | for IIA |
| Model 2. Primary source of sick care in 2005 | |||||
| lnL(full) | lnL(omit) | chi2 | P>chi2 | Evidence | |
| Children/children-in-law (reference) | |||||
| Spouse | −2718.97 | −2698.32 | 41.30 | 0.04 | against IIA |
| Grandchildren or other relatives | −2895.67 | −2876.42 | 38.49 | 0.07 | for IIA |
| Nonrelatives | −3186.23 | −3169.03 | 34.40 | 0.16 | for IIA |
| Nobody | −3615.56 | −3602.40 | 26.33 | 0.50 | for IIA |
| Model 3. Primary source of help when having trouble in 2005 | |||||
| lnL(full) | lnL(omit) | chi2 | P>chi2 | Evidence | |
| Children/children-in-law (reference) | |||||
| Spouse | −2505.95 | −2492.46 | 26.98 | 0.47 | for IIA |
| Grandchildren or other relatives | −2981.45 | −2969.92 | 23.07 | 0.68 | for IIA |
| Nonrelatives | −3218.22 | −3204.13 | 28.18 | 0.40 | for IIA |
| Nobody | −3488.27 | −3473.89 | 28.76 | 0.37 | for IIA |
| Model 4. Primary person to talk frequently in daily life in 2005 | |||||
| lnL(full) | lnL(omit) | chi2 | P>chi2 | Evidence | |
| Children/children-in-law (reference) | |||||
| Spouse | −4869.29 | −4859.46 | 19.66 | 0.85 | for IIA |
| Grandchildren or other relatives | −4662.48 | −4652.66 | 19.64 | 0.85 | for IIA |
| Nonrelatives | −3361.51 | −3348.80 | 25.42 | 0.55 | for IIA |
| Nobody | −4819.05 | −4811.18 | 15.75 | 0.96 | for IIA |
| Model 5. Primary person to share thoughts in 2005 | |||||
| lnL(full) | lnL(omit) | chi2 | P>chi2 | Evidence | |
| Children/children-in-law (reference) | |||||
| Spouse | −3266.25 | −3259.44 | 13.62 | 0.99 | for IIA |
| Grandchildren or other relatives | −3357.32 | −3347.28 | 20.09 | 0.83 | for IIA |
| Nonrelatives | −3275.52 | −3267.59 | 15.85 | 0.96 | for IIA |
| Nobody | −3302.95 | −3295.18 | 15.56 | 0.96 | for IIA |
Note: All the models control for age, gender, years of education, marital status, difficulty in ADLs, and rural (vs. urban) residence in 2005.
Appendix B. Percentages of CLHLS respondents who remained in the study over time.
Figure B1.

Percentage of old-old respondents (age 80 and above) who remained in the study since 1998.
Figure B2.
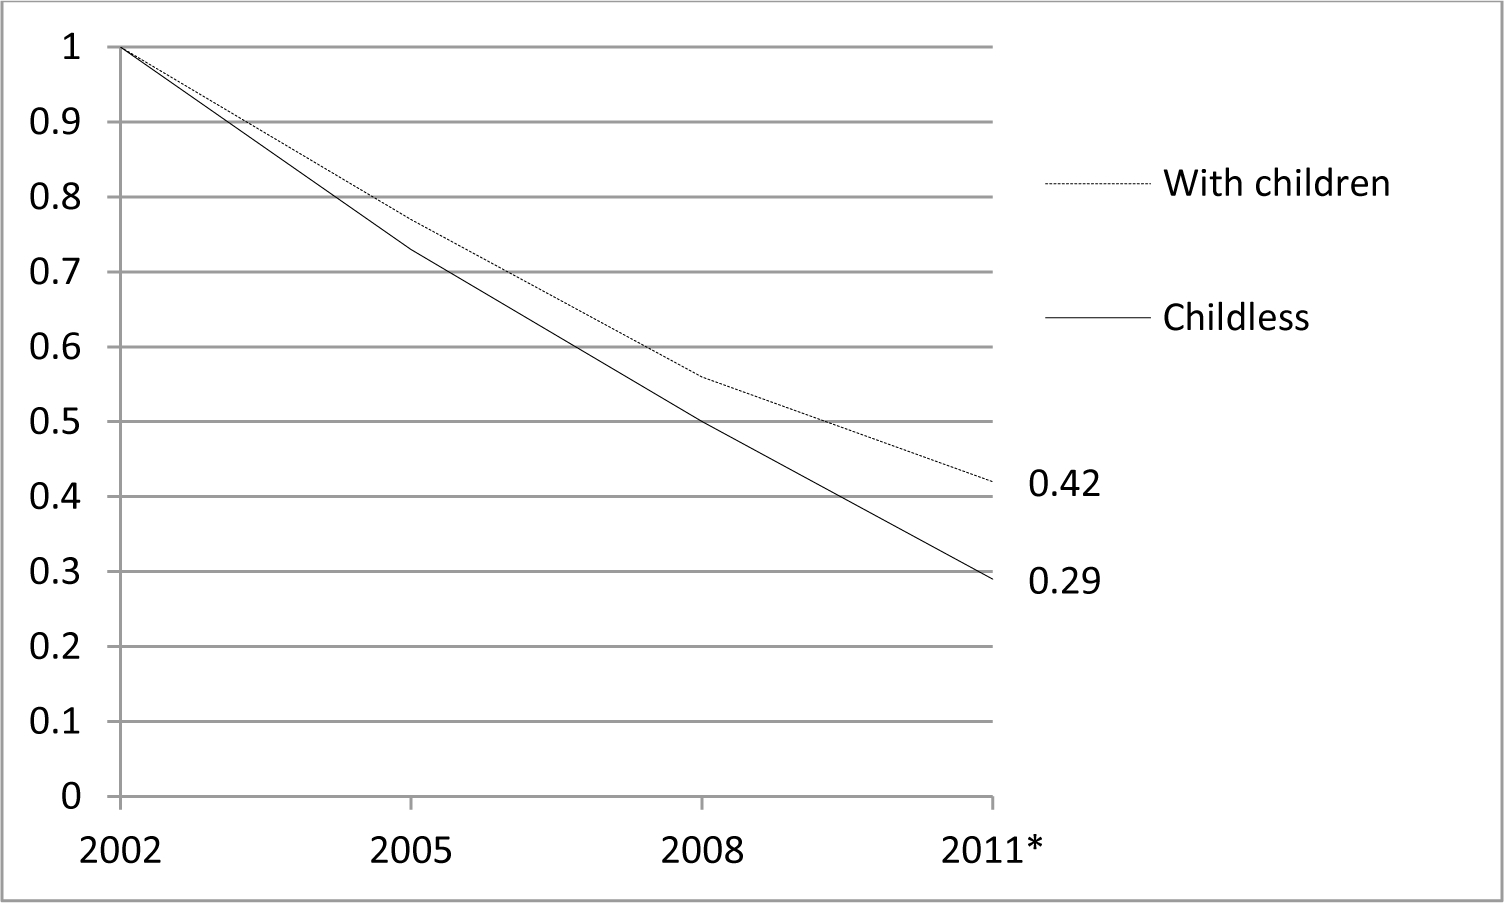
Percentage of young-old respondents (age 65–79) who remained in the study since 2002.
* Difference between respondents with and without children is statistically significant at p<0.05 level.
Contributor Information
Ning Hsieh, Michigan State University, East Lansing, USA
Zhenmei Zhang, Michigan State University, East Lansing, USA
References
- Berkman LF, & Glass T (2000). Social integration, social networks, social support, and health. In Social Epidemiology, edited by Berkman LF and Kawachi I (pp. 137–173). Oxford University Press. [Google Scholar]
- Cantor MH (1979). Neighbors and Friends: An Overlooked Resource in the Informal Support System. Research on Aging, 1(4), 434–463. 10.1177/016402757914002 [DOI] [Google Scholar]
- Cheng S-T, Chan TWS, Li GHK, & Leung EMF (2014). Childlessness and Subjective Well-being in Chinese Widowed Persons. The Journals of Gerontology: Series B, 69B(1), 48–52. 10.1093/geronb/gbt049 [DOI] [PubMed] [Google Scholar]
- Feng Z (2018). Childlessness and vulnerability of older people in China. Age and Ageing, 47(2), 275–281. 10.1093/ageing/afx137 [DOI] [PMC free article] [PubMed] [Google Scholar]
- Gottlieb BH, & Bergen AE (2010). Social support concepts and measures. Journal of Psychosomatic Research, 69(5), 511–520. 10.1016/j.jpsychores.2009.10.001 [DOI] [PubMed] [Google Scholar]
- Gu D (2008). General data assessment of the Chinese Longitudinal Healthy Longevity Survey. In Zhen Y, Poston DL, Vlosky DA, & Gu D (Ed.), Healthy Longevity in China: Demographic, Socioeconomic, and Psychological Dimensions (pp. 39–59). Springer Science & Business Media. [Google Scholar]
- Gu D, Dupre ME, & Liu G (2007). Characteristics of the institutionalized and community-residing oldest-old in China. Social Science & Medicine, 64(4), 871–883. 10.1016/j.socscimed.2006.10.026 [DOI] [PubMed] [Google Scholar]
- Guo M (2014). Parental status and late-life well-being in rural China: The benefits of having multiple children. Aging & Mental Health, 18(1), 19–29. 10.1080/13607863.2013.799117 [DOI] [PMC free article] [PubMed] [Google Scholar]
- Gustafson K, & Huang B (2014). Elderly Care and the One-Child Policy: Concerns, Expectations and Preparations for Elderly Life in a Rural Chinese Township. Journal of Cross-Cultural Gerontology, 29(1), 25–36. 10.1007/s10823-013-9218-1 [DOI] [PubMed] [Google Scholar]
- Hawkley LC, Hughes ME, Waite LJ, Masi CM, Thisted RA, & Cacioppo JT (2008). From Social Structural Factors to Perceptions of Relationship Quality and Loneliness: The Chicago Health, Aging, and Social Relations Study. The Journals of Gerontology Series B: Psychological Sciences and Social Sciences, 63(6), S375–S384. 10.1093/geronb/63.6.S375 [DOI] [PMC free article] [PubMed] [Google Scholar]
- Heckman JJ (1977). Sample Selection Bias As a Specification Error (with an Application to the Estimation of Labor Supply Functions) (Working Paper No. 172). National Bureau of Economic Research. 10.3386/w0172 [DOI] [Google Scholar]
- Jiang Q, Feldman MW, & Li S (2014). Marriage Squeeze, Never-Married Proportion, and Mean Age at First Marriage in China. Population Research and Policy Review, 33(2), 189–204. 10.1007/s11113-013-9283-8 [DOI] [PMC free article] [PubMed] [Google Scholar]
- Korinek K, Zimmer Z, & Gu D (2011). Transitions in Marital Status and Functional Health and Patterns of Intergenerational Coresidence Among China’s Elderly Population. The Journals of Gerontology Series B: Psychological Sciences and Social Sciences, 66B(2), 260–270. 10.1093/geronb/gbq107 [DOI] [PubMed] [Google Scholar]
- Li LW, Liu J, Zhang Z, & Xu H (2015). Late-life depression in Rural China: Do village infrastructure and availability of community resources matter? International Journal of Geriatric Psychiatry, 30(7), 729–736. 10.1002/gps.4217 [DOI] [PMC free article] [PubMed] [Google Scholar]
- Liu H, Han X, Xiao Q, Li S, & Feldman MW (2015). Family Structure and Quality of Life of Elders in Rural China: The Role of the New Rural Social Pension. Journal of Aging & Social Policy, 27(2), 123–138. 10.1080/08959420.2014.977662 [DOI] [PMC free article] [PubMed] [Google Scholar]
- Rubinstein RL (1987). Childless elderly: Theoretical perspectives and practical concerns. Journal of Cross-Cultural Gerontology, 2(1), 1–14. 10.1007/BF00117173 [DOI] [PubMed] [Google Scholar]
- Shanas E (1979). The Family as a Social Support System in Old Age. The Gerontologist, 19(2), 169–174. 10.1093/geront/19.2.169 [DOI] [PubMed] [Google Scholar]
- Silverstein M, Cong Z, & Li S (2006). Intergenerational Transfers and Living Arrangements of Older People in Rural China: Consequences for Psychological Well-Being. The Journals of Gerontology Series B: Psychological Sciences and Social Sciences, 61(5), S256–S266. [DOI] [PubMed] [Google Scholar]
- Umberson D, & Montez JK (2010). Social Relationships and Health A Flashpoint for Health Policy. Journal of Health and Social Behavior, 51(S), S54–S66. [DOI] [PMC free article] [PubMed] [Google Scholar]
- Wang D (2006). China’s Urban and Rural Old Age Security System: Challenges and Options. China & World Economy, 14(1), 102–116. 10.1111/j.1749-124X.2006.00001.x [DOI] [Google Scholar]
- Wellman B, & Wortley S (1990). Different Strokes from Different Folks: Community Ties and Social Support. American Journal of Sociology, 96(3), 558–588. 10.1086/229572 [DOI] [Google Scholar]
- Wu Z, & Pollard MS (1998). Social Support among Unmarried Childless Elderly Persons. The Journals of Gerontology: Series B, 53B(6), S324–S335. 10.1093/geronb/53B.6.S324 [DOI] [PubMed] [Google Scholar]
- Xie Y, & Zhu H (2009). Do Sons or Daughters Give More Money to Parents in Urban China? Journal of Marriage and Family, 71(1), 174–186. 10.1111/j.1741-3737.2008.00588.x [DOI] [PMC free article] [PubMed] [Google Scholar]
- Zeng Y, & Hesketh T (2016). The effects of China’s universal two-child policy. The Lancet, 388(10054), 1930–1938. 10.1016/S0140-6736(16)31405-2 [DOI] [PMC free article] [PubMed] [Google Scholar]
- Zeng Y, Vaupel JW, Zhenyu X, Chunyuan Z, & Yuzhi L (2002). Sociodemographic and Health Profiles of the Oldest Old In China. Population and Development Review, 28(2), 251–273. 10.1111/j.1728-4457.2002.00251.x [DOI] [Google Scholar]
- Zeng Y, Vaupel J, Xiao Z, Liu Y, & Zhang C (2015). Chinese Longitudinal Healthy Longevity Survey (CLHLS), 1998–2012. ICPSR - Interuniversity Consortium for Political and Social Research. 10.3886/ICPSR36179.v1 [DOI] [Google Scholar]
- Zhan HJ, Feng X, & Luo B (2008). Placing Elderly Parents in Institutions in Urban China: A Reinterpretation of Filial Piety. Research on Aging, 30(5), 543–571. 10.1177/0164027508319471 [DOI] [Google Scholar]
- Zhan HJ, Feng Z, Chen Z, & Feng X (2011). The role of the family in institutional long-term care: Cultural management of filial piety in China. International Journal of Social Welfare, 20, S121–S134. 10.1111/j.1468-2397.2011.00808.x [DOI] [Google Scholar]
- Zhang W (2017). Childlessness and the well-being of Chinese seniors. In Zang X & Zhao LX (Ed.), Handbook on the Family and Marriage in China (pp. 237–250). Edward Elgar Publishing. [Google Scholar]
- Zhang W, & Liu G (2007). Childlessness, Psychological Well-being, and Life Satisfaction Among the Elderly in China. Journal of Cross-Cultural Gerontology, 22(2), 185–203. 10.1007/s10823-007-9037-3 [DOI] [PubMed] [Google Scholar]
- Zhou Z, Verdery AM, & Margolis R (2019). No spouse, no son, no daughter, no kin in contemporary China: Prevalence, correlates, and differences in economic support. The Journals of Gerontology: Series B, 74(8), 1453–1462. [DOI] [PMC free article] [PubMed] [Google Scholar]
- Zhu H, & Xie Y (2017). Buying out of familial obligation: The tradeoff between financially supporting versus living with elderly parents in Urban China. Chinese Journal of Sociology, 3(1), 56–73. 10.1177/2057150X16685499 [DOI] [PMC free article] [PubMed] [Google Scholar]
- Zimmer Z, & Kwong J (2003). Family size and support of older adults in urban and rural China: Current effects and future implications. Demography, 40(1), 23–44. 10.1353/dem.2003.0010 [DOI] [PubMed] [Google Scholar]