Abstract
Background
Polycomb group factor 1 (PCGF1) plays a vital role in the self-renewal of cancer stem cells (CSCs). However, the prognostic value and potential function of PCGF1 in glioma progression, especially in tumor immunity, remain unclear.
Methods
This study investigated PCGF1 expression in pan-cancers and glioma using The Cancer Genome Atlas Project data, and conducted a logistic regression analysis to analyze the association between PCGF1 expression and the clinicopathological features of glioma patients. Kaplan-Meier and Cox regression analyses were used to assess the prognostic roles of PCGF1. The functional analysis using gene ontology and Kyoto Encyclopedia of Genes and Genomes databases and a gene set enrichment analysis (GSEA) were conducted to examine the PCGF1-related biological processes and signaling pathways. Finally, the roles of PCGF1 in immune infiltration were analyzed by a single sample GSEA (ssGSEA).
Results
PCGF1 expression was upregulated in glioma tissues. The high expression of PCGF1 was significantly associated with an age >60 years (P<0.001), an increased World Health Organization grade (P<0.001), and wildtype isocitrate dehydrogenase (IDH) status (P<0.001), and predicted poor overall survival (OS) [hazards ratio (HR) =2.90, 95% confidence interval (CI): 2.25–3.74; P<0.001], the progression-free interval (PFI) (HR =1.99, 95% CI: 1.60–2.46; P<0.001), and disease specific survival (DSS) (HR =2.84, 95% CI: 2.18–3.71; P<0.001). The multivariate regression analysis confirmed that PCGF1 expression was an independent prognostic factor of OS (HR =1.581, 95% CI: 1.161–2.153; P=0.004). Based on the functional enrichment analysis, we identified the PCGF1-related differentially expressed genes (DEGs), and found that PCGF1 was involved in regulating many oncogenic signaling pathways, such as the phosphatidylinositol 3-kinase and protein kinase B pathway, the Janus kinase/signal transducers and activators of transcription (JKT-STAT) signaling pathway, notch signaling and integrin signaling pathway. In addition, we found that PCGF1 expression was positively associated with the abundance of Th2, but negatively associated with T follicular helper, T central memory, and T gamma delta cells. Additionally, PCGF1 participated in the regulation of numerous immune-related processes in glioma.
Conclusions
PCGF1 is a promising prognostic biomarker, and as it governs cancer-related pathways and tumor immunity, it plays an important role in glioma development.
Keywords: PCGF1, prognosis, function, immune infiltration, glioma
Introduction
Gliomas are the most common primary brain tumors arising from supportive glial cells or precursor cells (1-3), and include astrocytomas, oligodendrogliomas, and ependymomas. Following recent advances in the molecular biology of gliomas, the 2016 World Health Organization (WHO) revised the classification of gliomas according to a combination of histology and molecular characteristics, such as isocitrate dehydrogenase (IDH) and 1p/19q codeletion. The application of these molecular factors optimizes the diagnosis and treatment of glioma, but patients still exhibit poor outcomes with a 5-year overall survival (OS) rate of <35% (3). Thus, more effective molecular glioma targets need to be identified to improve diagnosis, and prognostic prediction, and provide treatment guidance.
Polycomb group factor 1 [PCGF1, also known as nervous system polycomb 1 (Nspc1)] is a member of the Polycomb Repressive Complex 1 (PRC1) and is involved in transcriptional gene silencing via the epigenetic modification of histones (4,5). PCGF1 is confirmed to be highly homologous to Bmi1 (PCGF4), another core component of the PRC1 that participates in regulating cancer stem cell (CSC) self-renewal (6,7), and which suggests that both proteins may exert similar roles. PCGF1 has been reported to be highly expressed in stem cell-like side population cells in oral squamous cell carcinoma (8). PCGF1 is also involved in maintaining cell pluripotency by regulating the expression of stem cell markers, including Nanog homeobox (Nanog), octamer-binding transcription factor 4 (Oct4), and SRY-box transcription factor 2 (Sox2) in embryonal carcinoma cells (9). A recent study showed that PCGF1 positively regulates CSC self-renewal by repressing the synthesis of all-trans retinoic acid (10). In addition, PCGF1 is also regarded as a cell growth regulator that promotes cell proliferation by repressing c-cyclin dependent kinase inhibitor 1A (CDKN2A, also known as p21Waf1/Cip1), or activating the c-Myc signaling pathway in malignant tumors (11,12). PCGF1 plays important roles in cell stemness and proliferation in tumors, but the relationship between PCGF1 and clinical prognosis, as well as other underlying functions of PCGF1, especially in tumor immunity, remains unclear.
In the present study, we not only comprehensively explored the effects of PCGF1 on patient’s survival and the relationship between PCGF1 and clinicopathological factors, but investigated its value in prognostic prediction in glioma by Nomogram model. Further, we identified the differentially expressed genes (DEGs), and enriched the PCGF1-related signaling pathways based on a bioinformatic analysis. Importantly, we firstly revealed the correlation between PCGF1 and immune infiltration in gliomas-. Our findings provide insights into the roles of PCGF1 in gliomas, and can be used to guide novel directions for investigating the underlying mechanisms in glioma carcinogenesis and development. We present the following article in accordance with the REMARK reporting checklist (available at https://atm.amegroups.com/article/view/10.21037/atm-22-198/rc).
Methods
Data acquisition
In the analysis of PCGF1 expression in pan-cancers and gliomas, PCGF1 expression data were extracted from the University of California Santa Cruz (UCSC) Xena database (https://xenabrowser.net/datapages/). the gene expression profiles of the tumor tissues were derived from The Cancer Genome Atlas Project (TCGA), and those of normal tissues were obtained from TCGA and GTEx databases. The ribonucleic acid sequencing (RNA-seq) data (Workflow Type: level 3 HTSeq-FPKM) were transformed into transcripts per million reads, and used to compare PCGA1 expression between tumor tissues and normal tissues. In a subsequent investigation of the relationship between PCGF1 expression and the clinical characteristics and prognosis of gliomas, the PCGF1 expression data and the clinical information of glioma patients were directly acquired from the TCGA database. The study was conducted in accordance with the Declaration of Helsinki (as revised in 2013).
Survival analysis
PCGF1 expression data with clinicopathological information from glioma projects (696 cases) were extracted from TCGA database (13) (https://portal.gdc.cancer.gov/). Some cases with missing prognostic information or unknown clinical characteristics were not included in the statistical analysis of patient survival. Kaplan-Meier and univariate Cox proportional hazard regression analyses were conducted to assess the prognostic roles of PCGF1 in terms of OS, the progression-free interval (PFI), and disease-specific survival (DSS). A multivariate Cox regression analysis was conducted to determine whether PCGF1 expression is an independent prognostic factor of glioma.
To predict 1-, 3-, and 5-year survival, a nomogram plot was established using RMS R package (https://cran.r-project.org/web/packages/rms/index.html) based on the independent prognostic factors acquired from the multivariate Cox analysis. To assess the predicted probability of the nomogram, the calibration curve was depicted. The 45-degree line represented the best predictive values. The predictive accuracy was evaluated by calculating a concordance index (C-index).
DEG analysis
The DEGs between high and low PCGF1 expression groups were identified by comparing the expression profiles (HTSeq-Counts) using R package DESeq2 (14). The results of the differential analysis are displayed in a volcano plot. A |log2 fold change (FC)| >1 and an adjusted P value <0.05 were regarded as threshold values for DEGs. 6,065 genes that satisfied the threshold condition were extracted, including 4,751 genes with high expression, and 1,314 genes with low expression.
A Spearman correlation analysis was conducted to examine genes related to PCGF1 expression. The top 50 genes that were positively or negatively correlated with PCGF1 are displayed in heat maps.
Functional enrichment analysis
The gene ontology (GO) and Kyoto Encyclopedia of Genes and Genomes (KEGG) enrichment analyses of DEGs of glioma significantly related to PCGF1 expression was performed using R package (V3.6.3) ggplot2 (3.3.3) for visualization or clusterProfiler (3.14.3) for analysis of selected data. The top ten terms with an adjusted P value <0.05 are listed based on gene count.
GSEA
A gene set enrichment analysis (GSEA) was used to identify significant differences in the signaling pathways between the PCGF1-high and -low groups. It was conducted using R package ggplot2 (3.3.3) or clusterProfiler (3.14.3) (15,16) in which permutations of the gene set were performed 1,000 times. The PCGF1 expression level is generally considered a phenotype label. Significantly related genes were considered enriched if they had an adjusted P value <0.05 and a false discovery rate (FDR) q value <0.25.
Immune infiltration analysis
The infiltration of 24 types of immune cells that were identified based on the published immunocyte signatures (17) was analyzed by single sample GSEA (ssGSEA) using GSVA package (18) (R 3.6.3) in glioma samples via a Spearman correlation analysis. The correlation between PCGF1 expression and these immune cells are shown in scatter plots. The enrichment score of each immunocyte was compared in the PCGF1-high and -low samples using the Wilcoxon rank-sum test.
Statistical analysis
In this study, R package (V3.6.3) was used to conduct the statistical analyses. The expression levels of PCGF1 between tumor tissues and their non-paired normal tissues were compared using the Wilcoxon rank-sum test. The relationships between PCGF1 and the clinicopathological characteristics were evaluated by the Wilcoxon rank-sum test and logistic regression. The prognosis analysis was performed using a Cox proportional-hazard model and the Kaplan-Meier method. The multivariate Cox analysis was conducted to determine the effect of PCGF1 expression and other clinical factors on survival. The cut-off value dividing PCGF1-high and -low expression was defined according to the median value of PCGF1. In all tests, a P value <0.05 was considered significantly different.
Results
The expression levels of PCGF1 in human cancers
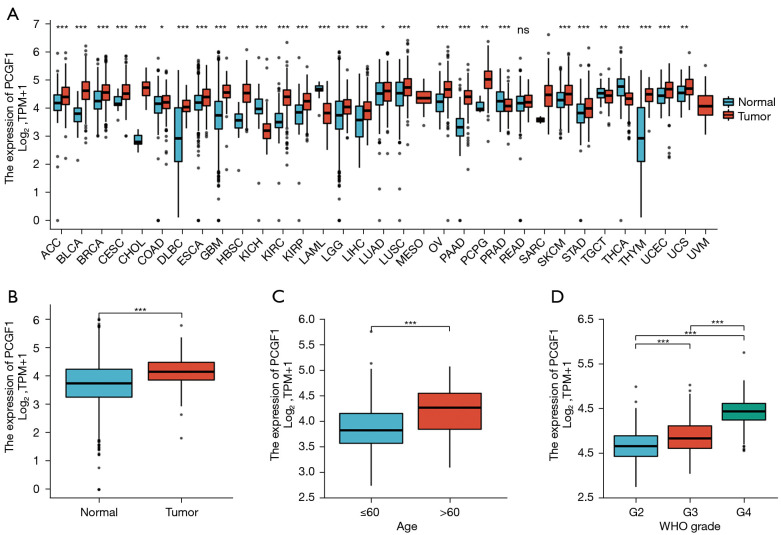
To determine the levels of PCGF1 expression in cancers, the pan-cancer analysis was conducted according to the TCGA and GTEx data from the UCSC XENA database. Compared to normal tissues, PCGF1 was highly expressed in a majority of tumors, including adrenocortical carcinoma, bladder urothelial carcinoma, breast infiltrating carcinoma, cervical squamous cell carcinoma and adenocarcinoma, cholangiocarcinoma, colon adenocarcinoma, diffuse large B-cell lymphoma, esophageal carcinoma, pleomorphic glioma, head and neck squamous cell carcinoma, renal clear cell carcinoma, renal papillary cell carcinoma, brain low grade glioma, liver hepatocellular carcinoma, lung adenocarcinoma, lung squamous cell carcinoma, ovarian serous cystadenocarcinoma, pancreatic cancer, pheochromocytoma and paraganglioma, skin melanoma, gastric cancer, thymic cancer, endometrial cancer, and uterine sarcoma (P<0.05), but lowly expressed in a few tumors containing renal chromophobe cell carcinoma, acute myeloid leukemia, prostate cancer, testicular germ cell tumors, and thyroid carcinoma (P<0.05; see Figure 1A).
Figure 1.
PCGF1 expression in pan-cancers, and its association with the clinicopathological characteristics of glioma patients. (A) The differential expression of PCGF1 in 33 types of tumors and the corresponding normal tissues. (B) PCGF1 expression in glioma tissues. (C,D) Correlation of PCGF1 expression with patient age and the WHO grade of glioma. ns, P≥0.05; *, P<0.05; **, P<0.01; ***, P<0.001. WHO, World Health Organization.
PCGF1 has been shown to be highly expressed in the developing nervous system (19). To further investigate its expression in nervous system tumors, we extracted the gene expression data of glioma tissues and normal controls from TCGA and GTEx databases. We discovered that PCGF1 expression was more upregulated in glioma tissues than normal tissues (P=0.001; see Figure 1B), which suggests that PCGF1 may play important roles in tumorigenesis and the development of gliomas.
Association of PCGF1 expression with the clinicopathological characteristics of glioma patients
To elucidate the significance of PCGF1 in gliomas, we first investigated its relationship with patient characteristics. Based on the clinical data of the 696 cases from TCGA (see Table 1), we found that the high expression of PCGF1 was largely correlated with an age >60 years (>60 vs. ≤60; P<0.001), an increased WHO grade (G4 vs. G3 vs. G2; P<0.001), and wildtype IDH status (wildtype vs. mutant; P<0.001) (see Figure 1C,1D and Figure S1A). No significant correlations were observed between PCGF1 expression with other clinicopathological characteristics, such as gender (P=0.939) and 1p/19q codeletion (P=0.742; see Figure S1B,S1C). Subsequently, we conducted a logistic regression analysis to further assess whether PCGF1 expression was related to poor prognostic clinical factors. As Table 2 shows, there was a positive relationship between the enhanced expression of PCGF1 and WHO grade [G3 and G4 vs. G2, odds ratio (OR) =5.518, 95% confidence interval (CI): 3.852–8.002; P<0.001] and age (>60 vs. ≤60, OR =3.105, 95% CI: 2.097–4.669; P<0.001); however, in terms of IDH status, a negative correlation was found (mutant vs. wildtype, OR =0.205, 95% CI: 0.145–0.288; P<0.001). Together, these findings showed that gliomas with high PCGF1 expression are more likely to have higher malignant grades and wildtype IDH status than gliomas with low PCGF1 expression.
Table 1. Association of PCGF1 expression with clinical pathological characteristics in 696 glioma patients.
| Characteristic | Low expression of PCGF1 | High expression of PCGF1 | P value |
|---|---|---|---|
| N | 348 | 348 | |
| WHO grade, n (%) | <0.001a,b | ||
| G2 | 169 (26.6) | 55 (8.7) | |
| G3 | 137 (21.6) | 106 (16.7) | |
| G4 | 10 (1.6) | 158 (24.9) | |
| IDH status, n (%) | <0.001a,b | ||
| WT | 65 (9.5) | 181 (26.4) | |
| Mut | 280 (40.8) | 160 (23.3) | |
| 1p/19q codeletion, n (%) | 0.742b | ||
| Codel | 84 (12.2) | 87 (12.6) | |
| Non-codel | 264 (38.3) | 254 (36.9) | |
| Gender, n (%) | 0.939b | ||
| Female | 150 (21.6) | 148 (21.3) | |
| Male | 198 (28.4) | 200 (28.7) | |
| Age, median [IQR] | 39 [31, 49] | 53 [41, 63] | <0.001a,c |
a, statistically significant; b, χ2 test; c, Wilcoxon rank-sum test. WHO, world health organization; IDH, isocitrate dehydrogenase; WT, wildtype; Mut, mutant.
Table 2. Logistic regression results showing the relationship between PCGF1 expression and clinical pathological characteristics.
| Characteristics | Total (N) | OR | P value |
|---|---|---|---|
| WHO grade (G3 and G4 vs. G2) | 635 | 5.518 (3.852–8.002) | <0.001 |
| 1p/19q codeletion (non-codel vs. codel) | 689 | 0.929 (0.657–1.313) | 0.676 |
| IDH status (Mut vs. WT) | 686 | 0.205 (0.145–0.288) | <0.001 |
| Gender (male vs. female) | 696 | 1.024 (0.758–1.383) | 0.878 |
| Age (>60 vs. ≤60) | 696 | 3.105 (2.097–4.669) | <0.001 |
OR, odds ratio; WHO, World Health Organization; IDH, isocitrate dehydrogenase; WT, wildtype. Mut, mutant.
PCGF1 expression was associated with the prognosis of glioma patients
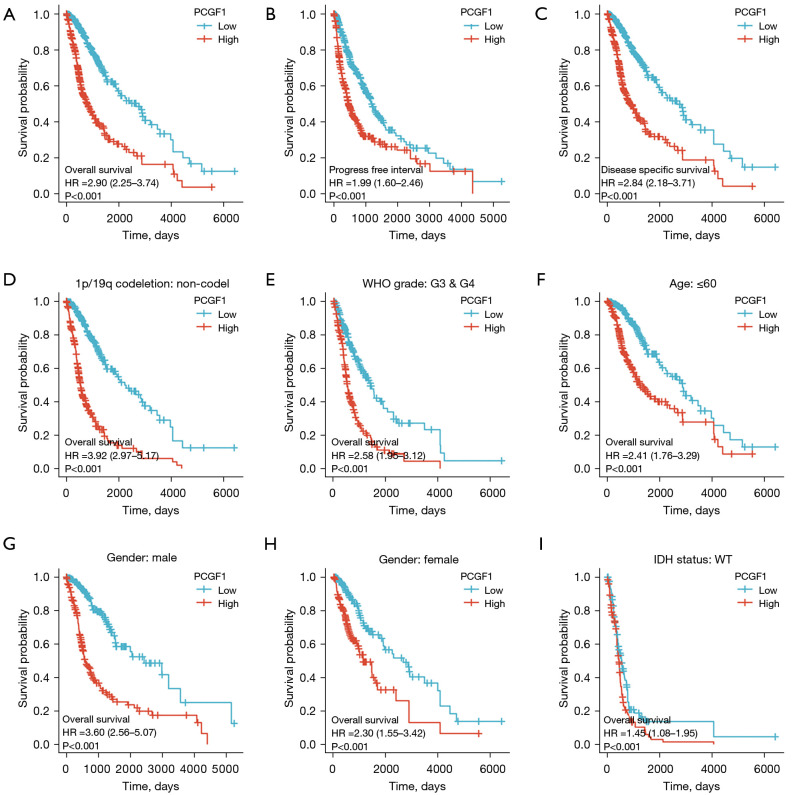
To identify the effects of PCGF1 expression on the prognosis of glioma patients, OS, PFI, and DSS were evaluated by Kaplan-Meier plot and log-rank tests. As Figure 2A-2C shows, patients with high expressions of PCGF1 exhibited a poorer prognosis than those with low expressions of PCGF1 (OS, HR =2.90, 95% CI: 2.25–3.74; P<0.001; PFI, HR =1.99, 95% CI: 1.60–2.46; P<0.001; DSS, HR =2.84, 95% CI: 2.18–3.71; P<0.001). Next, a subgroup analysis of OS was performed in terms of clinical features. Glioma patients with high expressions of PCGF1 were more likely to have worse OS in subgroups of 1p/19q non-codeletion (OS, HR =3.92; P<0.001) (see Figure 2D), G3 and G4 (OS, HR =2.58; P<0.001) (see Figure 2E), if aged ≤60 years (OS, HR =2.41; P<0.001) (see Figure 2F) ,if male (OS, HR =3.60; P<0.001) (see Figure 2G) , if female (OS, HR =1.45; P<0.015) (see Figure 2H) and wildtype IDH status (OS, HR =1.45; P=0.015;) (see Figure 2I). Additionally, patients with high expressions of PCGF1 were more likely to have worse PFI in subgroups of 1p/19q non-codeletion (PFI, HR =2.90; P<0.001) (see Figure S2A), G3 and G4 (PFI, HR =2.11; P<0.001) (see Figure S2B), if aged ≤60 years (PFI, HR =1.70; P<0.001) (see Figure S2C), if male (PFI, HR =2.68; P<0.001) (see Figure S2D). Meanwhile, patients with low expressions of PCGF1 were more likely to have better DSS in subgroups of 1p/19q non-codeletion (DSS, HR =3.89; P<0.001) (see Figure S2E), G3 and G4 (DSS, HR =2.48; P<0.001) (see Figure S2F), if aged ≤60 years (DSS, HR =2.45; P<0.001) (see Figure S2G), if male (DSS, HR =3.48; P<0.001) (see Figure S2H), if female (DSS, HR =2.29; P<0.001) (see Figure S2I) and wildtype IDH status (DSS, HR =1.40; P=0.033;) (see Figure S2J). There were no significant survival differences in other subgroups with high- or low-expressions of PCGF1 (P>0.05; see Figures S3A-S3J,S4A-S4D).
Figure 2.
The effect of differential PCGF1 expression levels on the prognosis of patients with glioma. (A-C) Kaplan-Meier curves of OS, PFI, and DSS between the PCGF1-high and -low expression cohorts. (D-I) Analysis of OS in 1p/19q non-codeletion, G3 and G4, age ≤60 years, male, female and wildtype IDH status between the PCGF1-high and -low expression cohorts. OS, overall survival; PFI, progression-free interval; DSS, disease specific survival; IDH, isocitrate dehydrogenase; WT, wildtype.
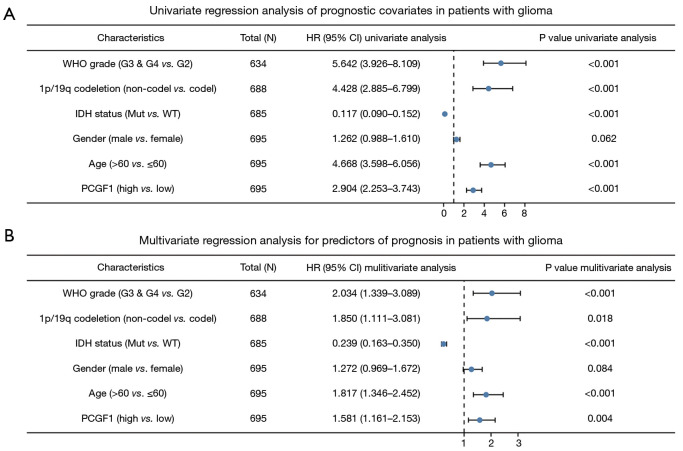
Next, a Cox regression univariate analysis was conducted and the results showed that G3 and G4 grade, 1p/19q non-codeletion, wildtype IDH status, an age >60 years old, and high PCGF1 expression were statistically correlated with shorter OS in glioma patients (HR =5.642, 95% CI: 3.926–8.109; P<0.001; HR =4.428, 95% CI: 2.885–6.799; P<0.001; HR =0.117, 95% CI: 0.090–0.152; P<0.001; HR =4.668, 95% CI: 3.598–6.056; P<0.001; HR =2.904, 95% CI: 2.253–3.743; P<0.001, respectively; see Figure 3A). Subsequently, based on the multivariate regression analysis, these factors were considered independent prognostic factors in predicting worse OS (P<0.05; see Figure 3B).
Figure 3.
Univariate and multivariate regression analyses of prognostic factors in patients with glioma. (A) Univariate regression analysis. (B) Multivariate regression analysis. WHO, World Health Organization; IDH, isocitrate dehydrogenase; Mut, mutant; WT, wildtype.
Nomogram construction and validation
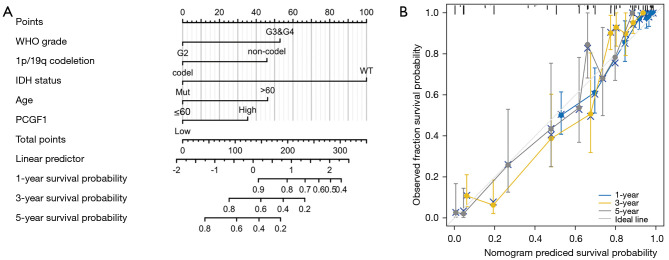
In this study, a nomogram was used to predict disease prognosis by integrating the relevant variables. According to the multivariate Cox analysis, PCGF1 and 4 other independent prognostic factors were selected for the construction of the nomogram. As Figure 4A shows, each variable was appointed to a point ranging from 1 to 100. The total point was calculated by summing up these points corresponding to each variable. Next, the patients’ probabilities of 1-, 3- and 5-year survivals were confirmed by drawing a straight line based on the total point score to acquire the clinical outcomes of glioma patients. For example, a glioma patient with high PCGF1 expression (35 points), G3 and G4 grade (52.5 points), 1p/19q non-codeletion (45.8 points), and an age >60 years (46.2 points) obtained a total point score of 179.5, which endowed the patient with approximate probabilities of 1-, 3-, 5-year survivals of 83%, 45%, and 24%, respectively.
Figure 4.
Construction and validation of the nomogram for glioma patients. (A) A nomogram to predict the survival probability at 1-, 3- and 5-year in glioma patients. (B) Calibration curve of the nomogram. WHO, World Health Organization; IDH, isocitrate dehydrogenase.
In this cohort, the C-index value of the nomogram was 0.847 (95% CI: 0.836–0.858), which implied that the model had moderate accuracy in predicting the prognosis of glioma patients. Afterwards, a calibration curve was used to assess the goodness-of-fit between the prediction and the observation. We uncovered that the bias-corrected lines of 1-, 3-, and 5-year survival were close to the ideal curve (the 45-degree line), which demonstrated good consistency between the predicted- and observed-probability (see Figure 4B). Together, these findings verified the advantage of the nomogram in predicting the survival of glioma patients, and revealed the prognostic value of PCGF1 expression. Given its significance, the function of PCGF1 expression in glioma progression needs to be further explore.
Identification of PCGF1-related DEGs in gliomas
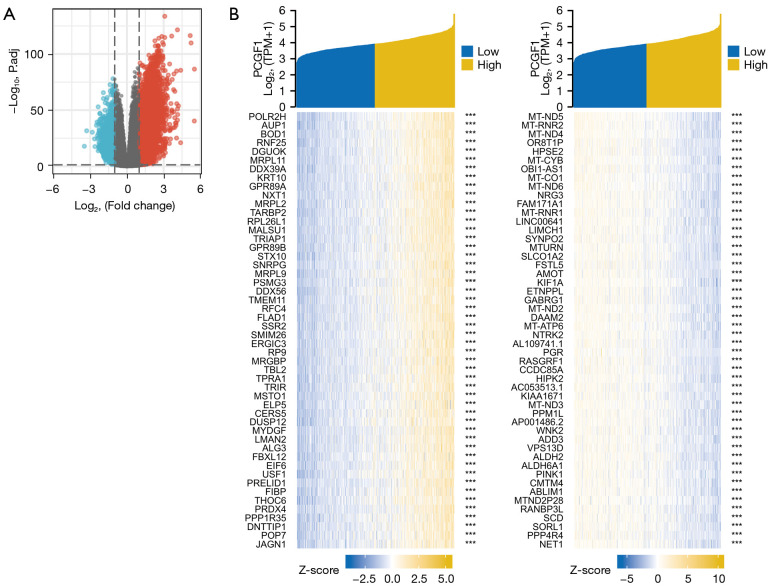
To examine the roles of PCGF1 in gliomas, we first identified the DEGs between high- and low-PCGF1 expression groups according to the TCGA RNA-seq data. A total of 6,065 DEGs were screened out, including 4,751 upregulated and 1,314 downregulated genes (|log2 FC| >1, adjusted P value <0.05; see Figure 5A and https://cdn.amegroups.cn/static/public/atm-22-198-1.xlsx). Next, we conducted a correlation analysis and selected the DEGs significantly associated with PCGF1. The top 50 genes that were positively or negatively correlate with PCGF1 are shown in a heat map (see Figure 5B and https://cdn.amegroups.cn/static/public/atm-22-198-2.xlsx).
Figure 5.
Identification of DEGs between the PCGF1-high and -low expression cohorts. (A) A volcano plot to show the DEGs between different PCGF1 expression groups. (B) A hot map of the top 50 DEGs significantly correlated with PCGF1 expression. ***, P<0.001. DEGs, differentially expressed genes.
Functional enrichment analysis of PCGF1 in gliomas
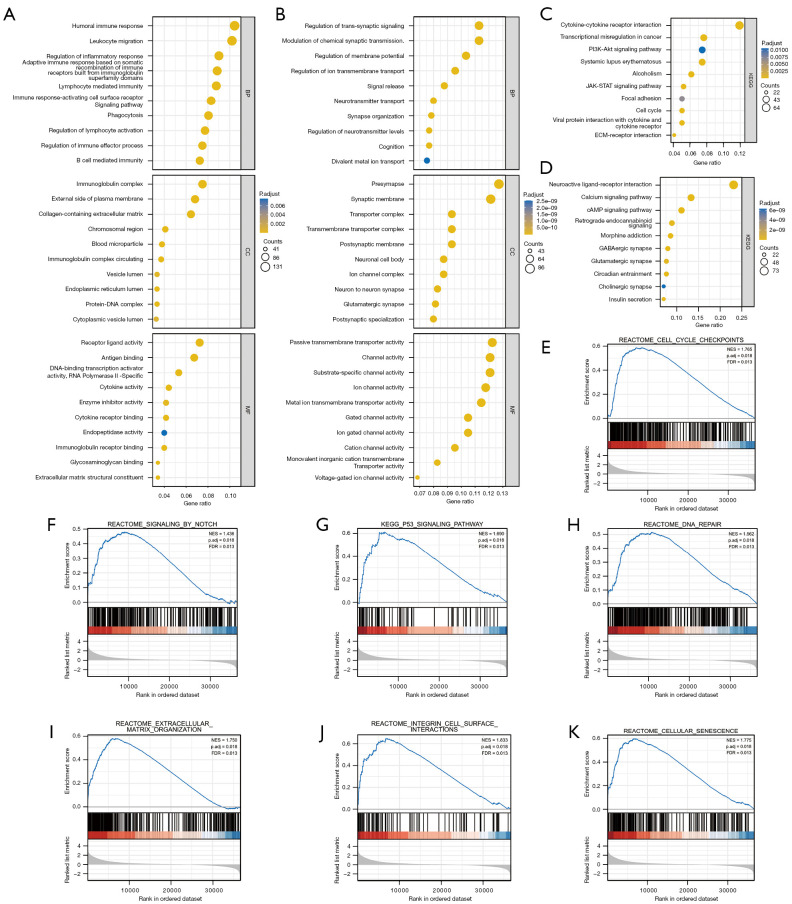
Metascape was use for the GO and KEGG enrichment analyses aimed at the PCGF1-related DEGs in gliomas. Based on the positively associated DEGs, the 30 significant processes by the GO analysis were divided into biological processes (BPs), cellular compositions (CCs), and molecular functions (MFs), which are mainly involved in immune-related regulation, the extracellular matrix, cellular structure, and receptor-ligand binding (see Figure 6A and https://cdn.amegroups.cn/static/public/atm-22-198-3.xlsx). However, synaptic signaling, transmembrane transport and channel activity were primarily regulated by the genes negatively associated with PCGF1 (see Figure 6B and https://cdn.amegroups.cn/static/public/atm-22-198-4.xlsx). In addition, a KEGG analysis was also performed to enrich the important 10 processes that were positively or negatively correlated with PCGF1, including some oncogenic signaling pathways, such as the PI3K-AKT pathway and JAK-STAT signaling pathway (see Figure 6C and https://cdn.amegroups.cn/static/public/atm-22-198-5.xlsx), and the regulation of signaling transduction containing receptor-ligand interaction and cyclic adenosine monophosphate (cAMP) signaling (see Figure 6D and https://cdn.amegroups.cn/static/public/atm-22-198-5.xlsx).
Figure 6.
Functional enrichment analysis of PCGF1 in glioma. (A) 30 processes positively related to PCGF1 by the GO analysis, including BPs, CCs, and MFs in glioma. (B) 30 processes negatively related to PCGF1 by the GO analysis, including BPs, CCs, and MFs in glioma. (C) Significantly enriched KEGG pathways based on positively PCGF1-related DEGs in glioma. (D) Significantly enriched KEGG pathways based on negatively PCGF1-related DEGs in glioma. (E-K) The PCGF1-related signaling pathways enriched by GSEA. GO, gene ontology; BPs, biological processes; CCs, compositions; MFs, molecular functions; KEGG, Kyoto Encyclopedia of Genes and Genomes; DEGs, differentially expressed genes; GSEA, gene set enrichment analysis.
PCGF1-related signaling pathways by GSEA
To further determine the crucial cancer-related pathways affected by PCGF1 in gliomas, GSEA was performed using the high- and low-PCGF1 expression data sets. We found that multiple signaling pathways involved in tumorigenesis and progression were enriched in the PCGF1-high expression phenotype, including cell cycle checkpoints, notch signaling, the P53 pathway, deoxyribonucleic acid (DNA) repair, extracellular matrix organization, integrin signaling, and cellular senescence (see Figure 6E-6K and https://cdn.amegroups.cn/static/public/atm-22-198-6.xlsx).
PCGF1 expression was correlated with immune infiltration in glioma
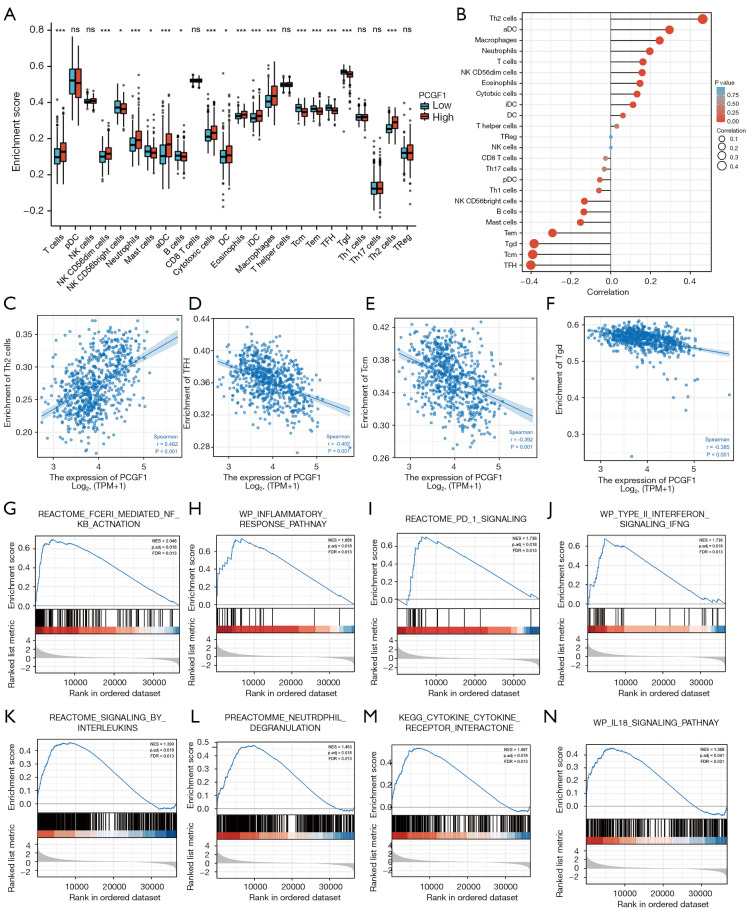
Previous studies have confirmed that tumor-infiltrating lymphocytes (TILs) are independent predictors of survival in cancer patients (20,21). We explored the relationship of PCGF1 with immune infiltration in gliomas. Figure 7A displays the enrichment scores of 24 subtypes of immune cells in high- and low-PCGF1 expression samples. We observed that T cells, immature dendritic cells (DCs), macrophages, neutrophils, natural killer CD56dim cells, Th2 cells, cytotoxic cells, DCs, eosinophils, and activated DCs were significantly increased in the high-PCGF1 expression group (P<0.05). Conversely, mast cells, T central memory (Tcm) cells, T follicular helper (TFH) cells, T effector memory (Tem) cells, T gamma delta (Tgd) cells, B cells and natural killer CD56bright cells were significantly enriched in the low expression group (P<0.05).
Figure 7.
PCGF1 expression was correlated with immune infiltration in glioma. (A) Enrichment scores of 24 subtypes of TILs in high- and low-PCGF1 expression samples. ns, P≥0.05; *, P<0.05; ***, P<0.001. (B) A forest plot showing the correlations between PCGF1 expression and the infiltration level of 24 TILs using the Spearman correlation analysis. (C-F) Significant correlations of Th2, TFH, Tcm, and Tgd cells with the expression level of PCGF1 displayed by scatter plots. (G-N) Immune-related pathways mediated by PCGF1 expression using GSEA. TILs, tumor-infiltrating lymphocytes; TFH, T follicular helper; Tcm, T central memory; Tgd, T gamma delta; GSEA, gene set enrichment analysis.
Next, we investigated the correlation between PCGF1 expression and the infiltration levels of TILs using Spearman analysis (see Figure 7B-7F and Figure S5). PCGF1 expression was positively associated with the abundance of Th2 cells (r=0.460; P<0.001; see Figure 7C). However, there were negative correlations between PCGF1 and 3 subtypes of T cells including TFH cells (r=–0.400; P<0.001), Tcm cells (r=–0.390; P<0.001), and Tgd cells (r=–0.380; P<0.001; see Figure 7D-7F).
To clarify how PCGF1 affects immune infiltration, we conducted an analysis of the immune-related pathways via GSEA. We found that many pathways, including FcεRI-mediated nuclear factor kappa-light-chain-enhancer of activated B cells (NF-κB) activation, inflammatory response pathway, programmed cell death protein 1 (PD-1) signaling, type II interferon signaling, signaling by interleukins, neutrophil degranulation, cytokine-cytokine receptor interaction, interlukin-18 signaling pathways, showed significant enrichment in the PCGF1-high expression phenotype (see Figure 7G-7N and https://cdn.amegroups.cn/static/public/atm-22-198-7.xlsx), which suggests that PCGF1 has an underlying role in regulating tumor immunity.
Discussion
PCGF1, which belongs to the PcG protein family, has been shown to be highly expressed in the developing nervous system, and involved in the regulation of cell self-renewal and embryonic development (22-24). However, its roles in nervous system tumors have not yet been fully elucidated. In this study, we found that PCGF1 expression was upregulated in multiple human cancers containing glioma. The high expression of PCGF1 was associated with more malignant clinicopathological features, and was indicative of a poor prognosis among glioma patients. Afterwards, based on a bioinformatic analysis, we identified the PCGF1-related DEGs, and found that PCGF1 participated in regulating numerous oncogenic signaling pathways, such as the PI3K-AKT pathway, JAK-STAT signaling, notch signaling, and integrin signaling. In addition, PCGF1 expression was found to be correlated with the infiltration of immune cells and immune-related processes in glioma. Thus, the present study shed some light on the potential prognostic values and functions of PCGF1 in the tumorigenesis and progression of gliomas.
The PcG protein family, which is generally classified into 2 complexes (i.e., PRC1 and PRC2), plays a crucial role in transcriptional gene silencing (5,25). PRC1 is mainly involved in the monoubiquitylation of histone H2A on lysine 119 (H2AK119) that includes 2 subgroups [i.e., canonical PRC1 (cPRC1) and non-canonical PRC1 (ncPRC1)], while PRC2 is associated with the methylation of histone H3 on lysine 27 (H3K27) (25,26). Among them, PCGF1 is a core component of the BCL6 corepressor (BCOR) complex, an ncPRC1 subgroup called PCR1.1, and stimulates the activity of E3 ligase ring finger protein 2 (RNF2, also called as RING1B) by binding to lysine (K)-specific demethylase 2B (KDM2B), thereby promoting the monoubiquitylation of H2AK119 by RING1B (27,28).
PCGF1 has been reported to play an important role in stem cell maintenance, and its aberrant expression is instrumental in cancer development (10,11,23). In colorectal cancer, PCGF1 has been shown to be more highly expressed in tumor tissues than normal controls. Moreover, PCGF1 expression has been positively linked with the clinical stage of tumors. The elevated expression of PCGF1 indicates worse OS for cancer patients (29). Hu et al. found that PCGF1 expression was upregulated in a higher grade of glioma and stem cell-like glioma cells (SLCs). Further, PCGF1 enhanced SLC self-renewal by upregulating the expression of stemness markers NESTIN, CD133, and SOX2 (10). There have been preliminary studies of PCGF1 in gliomas, but the clinical values of PCGF1 and its roles in the progression of glioma still need to be investigated in depth. In the present study, we revealed that the expression levels of PCGF1 were generally enhanced in most tumor tissues, including glioma. In addition to being associated with a high grade of glioma, PCGF1 was also significantly correlated with an age >60 years or wildtype IDH status. Conversely, PCGF1 was not significantly correlated with 1p/19q codeletion or gender. Further, the high expression of PCGF1 was prone to predict poor OS, PFI, and DSS, and is considered an independent prognostic factor. These findings strongly suggest that PCGF1 is a potential biomarker in tumor diagnosis and predicting clinical outcomes of glioma patients.
Accumulating evidence has demonstrated that PcG proteins play an important role in cancer progression. For example, BMI1 (PCGF4) has been reported to be overexpressed in many malignances (30,31) and CSC populations, and it is often regarded as a promotor of stem cell self-renewal (32,33). Mel-18 (PCGF2), another PcG member, is downregulated in several human cancers and functions as a tumor suppressor by downregulating BMI1 to induce cell senescence and inhibit migration (30). PCGF6 participates in the maintenance of embryonic stem cells (ESC) identity by modulating expression of the core ESC regulators Oct4, Sox2, and Nanog (34). Concerning the roles of PCGF1 in cancers, several studies have shown that PCGF1 is implicated in the regulation of CSC self-renewal via targeting stemness markers (9,10,29), and promotes the proliferation of cancer cells by suppressing CDK inhibitors or activating oncoprotein c-Myc (11,12).
In our study, we also found that PCGF1 may regulate a variety of signaling pathways to facilitate tumorigenesis and development. Based on the GO analysis, PCGF1 expression was positively linked to immune-related regulation, the extracellular matrix, cellular structure, and receptor-ligand binding, but negatively linked to synaptic signaling, transmembrane transport, and channel activity. The KEGG and GESA analysis revealed that PCGF1 participated in the regulation of numerous cancer-related pathways, such as the PI3K-AKT pathway, JAK-STAT signaling, notch signaling, and integrin signaling. These pathways have been proven to play central roles in malignant phenotypes of glioma, including cell proliferation, apoptosis, invasion, stemness, and metabolism (35-41). Thus, these results emphasize the importance of PCGF1 in glioma progression, and hint at the necessity to further explore its functions.
Tumor initiation and progression occurs in line with alterations of the surrounding microenvironment. The tumor microenvironment (TME) can be remodeled by cancer cells via the secretion of numerous factors and the activation of some signaling pathways. The altered TME promotes malignant phenotypes and impinges on tumor survival and development (42,43). TILs are important components in the TME, and can help construct an immunosuppressive microenvironment, and provoke tumor cells to escape immune response, thereby promoting carcinogenesis and progression (44,45). Our results revealed that PCGF1 expression was positively associated with the abundance of Th2 cells, but negatively associated with TFH, Tcm, and Tgd enrichment. Th1 and Th2 are 2 functional subtypes of T helper cells. Under normal circumstances, Th1/Th2 cells exist in a relatively balanced state, but this balance is impaired in some disorders, such as malignancies, in which there is a dominant state of Th2, which is called the Th1/Th2 shift (46-48). The Th1/Th2 shift is an important mechanism leading to tumor immune evasion, and has been found in many cancers (49,50). Thus, PCGF1-mediated Th2 enrichment may be an underlying factor that helps tumor cells evade immune surveillance. Further, TFH, Tcm, and Tgd cells that belong to adaptive immune cells, are known to have positive effects on anti-tumor immunity (51-53), which suggests that the suppression of adaptive immunity by PCGF1 by decreasing TFH, Tcm, and Tgd cells may contribute to glioma progression. Additionally, the GSEA x analysis revealed several immune-related pathways, including fceri-mediated NF-κB activation, the inflammatory response pathway, PD-1 signaling, type II interferon signaling, signaling by interleukins, neutrophil degranulation, cytokine-cytokine receptor interaction, and interlukin-18 signaling pathways. Together, these findings indicate that PCGF1 may play critical roles in regulating the tumor immune response of gliomas by various mechanisms.
Taken together, we revealed the high expression and prognostic value of PCGF1 in gliomas, and elaborated on its potential functions in glioma development and the regulatory roles in tumor immunity via a bioinformatic analysis. PCGF1 may be a novel diagnostic and prognostic marker of glioma. Future research in this direction is required, which will provide more insights into the molecular mechanisms underlying glioma carcinogenesis and progression.
Supplementary
The article’s supplementary files as
Acknowledgments
Funding: This work was supported by the Natural Science Foundation of Shandong Province (Grant Nos. ZR2021QH356 and ZR2021LSW023).
Ethical Statement: The authors are accountable for all aspects of the work in ensuring that questions related to the accuracy or integrity of any part of the work are appropriately investigated and resolved. The study was conducted in accordance with the Declaration of Helsinki (as revised in 2013).
Footnotes
Reporting Checklist: The authors have completed the REMARK reporting checklist. Available at https://atm.amegroups.com/article/view/10.21037/atm-22-198/rc
Conflicts of Interest: All authors have completed the ICMJE uniform disclosure form (available at https://atm.amegroups.com/article/view/10.21037/atm-22-198/coif). The authors have no conflicts of interest to declare.
References
- 1.Eckel-Passow JE, Lachance DH, Molinaro AM, et al. Glioma Groups Based on 1p/19q, IDH, and TERT Promoter Mutations in Tumors. N Engl J Med 2015;372:2499-508. 10.1056/NEJMoa1407279 [DOI] [PMC free article] [PubMed] [Google Scholar]
- 2.Omuro A, DeAngelis LM. Glioblastoma and other malignant gliomas: a clinical review. JAMA 2013;310:1842-50. 10.1001/jama.2013.280319 [DOI] [PubMed] [Google Scholar]
- 3.Lapointe S, Perry A, Butowski NA. Primary brain tumours in adults. Lancet 2018;392:432-46. 10.1016/S0140-6736(18)30990-5 [DOI] [PubMed] [Google Scholar]
- 4.Sparmann A, van Lohuizen M. Polycomb silencers control cell fate, development and cancer. Nat Rev Cancer 2006;6:846-56. 10.1038/nrc1991 [DOI] [PubMed] [Google Scholar]
- 5.Levine SS, Weiss A, Erdjument-Bromage H, et al. The core of the polycomb repressive complex is compositionally and functionally conserved in flies and humans. Mol Cell Biol 2002;22:6070-8. 10.1128/MCB.22.17.6070-6078.2002 [DOI] [PMC free article] [PubMed] [Google Scholar]
- 6.Chen D, Wu M, Li Y, et al. Targeting BMI1+ Cancer Stem Cells Overcomes Chemoresistance and Inhibits Metastases in Squamous Cell Carcinoma. Cell Stem Cell 2017;20:621-634.e6. 10.1016/j.stem.2017.02.003 [DOI] [PMC free article] [PubMed] [Google Scholar]
- 7.Jia L, Zhang W, Wang CY. BMI1 Inhibition Eliminates Residual Cancer Stem Cells after PD1 Blockade and Activates Antitumor Immunity to Prevent Metastasis and Relapse. Cell Stem Cell 2020;27:238-253.e6. 10.1016/j.stem.2020.06.022 [DOI] [PMC free article] [PubMed] [Google Scholar]
- 8.Zhang P, Zhang Y, Mao L, et al. Side population in oral squamous cell carcinoma possesses tumor stem cell phenotypes. Cancer Lett 2009;277:227-34. 10.1016/j.canlet.2008.12.015 [DOI] [PubMed] [Google Scholar]
- 9.Li H, Fan R, Sun M, et al. Nspc1 regulates the key pluripotent Oct4-Nanog-Sox2 axis in P19 embryonal carcinoma cells via directly activating Oct4. Biochem Biophys Res Commun 2013;440:527-32. 10.1016/j.bbrc.2013.09.095 [DOI] [PubMed] [Google Scholar]
- 10.Hu PS, Xia QS, Wu F, et al. NSPc1 promotes cancer stem cell self-renewal by repressing the synthesis of all-trans retinoic acid via targeting RDH16 in malignant glioma. Oncogene 2017;36:4706-18. 10.1038/onc.2017.34 [DOI] [PubMed] [Google Scholar]
- 11.Gong Y, Yue J, Wu X, et al. NSPc1 is a cell growth regulator that acts as a transcriptional repressor of p21Waf1/Cip1 via the RARE element. Nucleic Acids Res 2006;34:6158-69. 10.1093/nar/gkl834 [DOI] [PMC free article] [PubMed] [Google Scholar]
- 12.Yan R, Cui F, Dong L, et al. Repression of PCGF1 Decreases the Proliferation of Glioblastoma Cells in Association with Inactivation of c-Myc Signaling Pathway. Onco Targets Ther 2020;13:253-61. 10.2147/OTT.S234517 [DOI] [PMC free article] [PubMed] [Google Scholar]
- 13.Liu J, Lichtenberg T, Hoadley KA, et al. An Integrated TCGA Pan-Cancer Clinical Data Resource to Drive High-Quality Survival Outcome Analytics. Cell 2018;173:400-416.e11. 10.1016/j.cell.2018.02.052 [DOI] [PMC free article] [PubMed] [Google Scholar]
- 14.Love MI, Huber W, Anders S. Moderated estimation of fold change and dispersion for RNA-seq data with DESeq2. Genome Biol 2014;15:550. 10.1186/s13059-014-0550-8 [DOI] [PMC free article] [PubMed] [Google Scholar]
- 15.Subramanian A, Tamayo P, Mootha V K, et al. Gene set enrichment analysis: a knowledge-based approach for interpreting genome-wide expression profiles. Proc Natl Acad Sci U S A 2005;102:15545-15550. 10.1073/pnas.0506580102 [DOI] [PMC free article] [PubMed] [Google Scholar]
- 16.Yu G, Wang LG, Han Y, et al. clusterProfiler: an R package for comparing biological themes among gene clusters. OMICS 2012;16:284-7. 10.1089/omi.2011.0118 [DOI] [PMC free article] [PubMed] [Google Scholar]
- 17.Bindea G, Mlecnik B, Tosolini M, et al. Spatiotemporal dynamics of intratumoral immune cells reveal the immune landscape in human cancer. Immunity 2013;39:782-95. 10.1016/j.immuni.2013.10.003 [DOI] [PubMed] [Google Scholar]
- 18.Hänzelmann S, Castelo R, Guinney J. GSVA: gene set variation analysis for microarray and RNA-seq data. BMC Bioinformatics 2013;14:7. 10.1186/1471-2105-14-7 [DOI] [PMC free article] [PubMed] [Google Scholar]
- 19.Nunes M, Blanc I, Maes J, et al. NSPc1, a novel mammalian Polycomb gene, is expressed in neural crest-derived structures of the peripheral nervous system. Mech Dev 2001;102:219-22. 10.1016/S0925-4773(01)00288-X [DOI] [PubMed] [Google Scholar]
- 20.Azimi F, Scolyer RA, Rumcheva P, et al. Tumor-infiltrating lymphocyte grade is an independent predictor of sentinel lymph node status and survival in patients with cutaneous melanoma. J Clin Oncol 2012;30:2678-83. 10.1200/JCO.2011.37.8539 [DOI] [PubMed] [Google Scholar]
- 21.Ohtani H. Focus on TILs: prognostic significance of tumor infiltrating lymphocytes in human colorectal cancer. Cancer Immun 2007;7:4. [PMC free article] [PubMed] [Google Scholar]
- 22.Yan Y, Zhao W, Huang Y, et al. Loss of Polycomb Group Protein Pcgf1 Severely Compromises Proper Differentiation of Embryonic Stem Cells. Sci Rep 2017;7:46276. 10.1038/srep46276 [DOI] [PMC free article] [PubMed] [Google Scholar]
- 23.Ross K, Sedello AK, Todd GP, et al. Polycomb group ring finger 1 cooperates with Runx1 in regulating differentiation and self-renewal of hematopoietic cells. Blood 2012;119:4152-61. 10.1182/blood-2011-09-382390 [DOI] [PubMed] [Google Scholar]
- 24.Li X, Ji G, Zhou J, et al. Pcgf1 Regulates Early Neural Tube Development Through Histone Methylation in Zebrafish. Front Cell Dev Biol 2021;8:581636. 10.3389/fcell.2020.581636 [DOI] [PMC free article] [PubMed] [Google Scholar]
- 25.Di Croce L, Helin K. Transcriptional regulation by Polycomb group proteins. Nat Struct Mol Biol 2013;20:1147-55. 10.1038/nsmb.2669 [DOI] [PubMed] [Google Scholar]
- 26.Chan HL, Morey L. Emerging Roles for Polycomb-Group Proteins in Stem Cells and Cancer. Trends Biochem Sci 2019;44:688-700. 10.1016/j.tibs.2019.04.005 [DOI] [PubMed] [Google Scholar]
- 27.Yamamoto Y, Abe A, Emi N. Clarifying the impact of polycomb complex component disruption in human cancers. Mol Cancer Res 2014;12:479-84. 10.1158/1541-7786.MCR-13-0596 [DOI] [PubMed] [Google Scholar]
- 28.Wu X, Johansen JV, Helin K. Fbxl10/Kdm2b recruits polycomb repressive complex 1 to CpG islands and regulates H2A ubiquitylation. Mol Cell 2013;49:1134-46. 10.1016/j.molcel.2013.01.016 [DOI] [PubMed] [Google Scholar]
- 29.Ji G, Zhou W, Du J, et al. PCGF1 promotes epigenetic activation of stemness markers and colorectal cancer stem cell enrichment. Cell Death Dis 2021;12:633. 10.1038/s41419-021-03914-2 [DOI] [PMC free article] [PubMed] [Google Scholar]
- 30.Zhang XW, Sheng YP, Li Q, et al. BMI1 and Mel-18 oppositely regulate carcinogenesis and progression of gastric cancer. Mol Cancer 2010;9:40. 10.1186/1476-4598-9-40 [DOI] [PMC free article] [PubMed] [Google Scholar]
- 31.Song LB, Zeng MS, Liao WT, et al. Bmi-1 is a novel molecular marker of nasopharyngeal carcinoma progression and immortalizes primary human nasopharyngeal epithelial cells. Cancer Res 2006;66:6225-32. 10.1158/0008-5472.CAN-06-0094 [DOI] [PubMed] [Google Scholar]
- 32.Smith LL, Yeung J, Zeisig BB, et al. Functional crosstalk between Bmi1 and MLL/Hoxa9 axis in establishment of normal hematopoietic and leukemic stem cells. Cell Stem Cell 2011;8:649-62. 10.1016/j.stem.2011.05.004 [DOI] [PubMed] [Google Scholar]
- 33.Chen H, Zhou L, Dou T, et al. BMI1'S maintenance of the proliferative capacity of laryngeal cancer stem cells. Head Neck 2011;33:1115-25. 10.1002/hed.21576 [DOI] [PubMed] [Google Scholar]
- 34.Yang CS, Chang KY, Dang J, et al. Polycomb Group Protein Pcgf6 Acts as a Master Regulator to Maintain Embryonic Stem Cell Identity. Sci Rep 2016;6:26899. 10.1038/srep26899 [DOI] [PMC free article] [PubMed] [Google Scholar]
- 35.Shahcheraghi SH, Tchokonte-Nana V, Lotfi M, et al. Wnt/beta-catenin and PI3K/Akt/mTOR Signaling Pathways in Glioblastoma: Two Main Targets for Drug Design: A Review. Curr Pharm Des 2020;26:1729-41. 10.2174/1381612826666200131100630 [DOI] [PubMed] [Google Scholar]
- 36.Cao LJ, Xie HT, Chu ZX, et al. Tubeimoside 1 induces apoptosis in human glioma U251 cells by suppressing PI3K/Akt mediated signaling pathways. Mol Med Rep 2020;22:1527-35. 10.3892/mmr.2020.11224 [DOI] [PMC free article] [PubMed] [Google Scholar]
- 37.Wang D, Yang T, Liu J, et al. Propofol Inhibits the Migration and Invasion of Glioma Cells by Blocking the PI3K/AKT Pathway Through miR-206/ROCK1 Axis. Onco Targets Ther 2020;13:361-70. 10.2147/OTT.S232601 [DOI] [PMC free article] [PubMed] [Google Scholar]
- 38.Cheng Z, Luo C, Guo Z. LncRNA-XIST/microRNA-126 sponge mediates cell proliferation and glucose metabolism through the IRS1/PI3K/Akt pathway in glioma. J Cell Biochem 2020;121:2170-83. 10.1002/jcb.29440 [DOI] [PubMed] [Google Scholar]
- 39.Parmigiani E, Taylor V, Giachino C. Oncogenic and Tumor-Suppressive Functions of NOTCH Signaling in Glioma. Cells 2020;9:2304. 10.3390/cells9102304 [DOI] [PMC free article] [PubMed] [Google Scholar]
- 40.Swiatek-Machado K, Kaminska B. STAT Signaling in Glioma Cells. Adv Exp Med Biol 2020;1202:203-22. 10.1007/978-3-030-30651-9_10 [DOI] [PubMed] [Google Scholar]
- 41.Ellert-Miklaszewska A, Poleszak K, Pasierbinska M, et al. Integrin Signaling in Glioma Pathogenesis: From Biology to Therapy. Int J Mol Sci 2020;21:888. 10.3390/ijms21030888 [DOI] [PMC free article] [PubMed] [Google Scholar]
- 42.Hinshaw DC, Shevde LA. The Tumor Microenvironment Innately Modulates Cancer Progression. Cancer Res 2019;79:4557-66. 10.1158/0008-5472.CAN-18-3962 [DOI] [PMC free article] [PubMed] [Google Scholar]
- 43.Wu T, Dai Y. Tumor microenvironment and therapeutic response. Cancer Lett 2017;387:61-8. 10.1016/j.canlet.2016.01.043 [DOI] [PubMed] [Google Scholar]
- 44.Lin B, Du L, Li H, et al. Tumor-infiltrating lymphocytes: Warriors fight against tumors powerfully. Biomed Pharmacother 2020;132:110873. 10.1016/j.biopha.2020.110873 [DOI] [PubMed] [Google Scholar]
- 45.Yu YR, Imrichova H, Wang H, et al. Disturbed mitochondrial dynamics in CD8+ TILs reinforce T cell exhaustion. Nat Immunol 2020;21:1540-51. 10.1038/s41590-020-0793-3 [DOI] [PubMed] [Google Scholar]
- 46.Murakami H, Ogawara H, Hiroshi H. Th1/Th2 cells in patients with multiple myeloma. Hematology 2004;9:41-5. 10.1080/10245330310001652437 [DOI] [PubMed] [Google Scholar]
- 47.Sheu BC, Lin RH, Lien HC, et al. Predominant Th2/Tc2 polarity of tumor-infiltrating lymphocytes in human cervical cancer. J Immunol 2001;167:2972-8. 10.4049/jimmunol.167.5.2972 [DOI] [PubMed] [Google Scholar]
- 48.Shurin MR, Lu L, Kalinski P, et al. Th1/Th2 balance in cancer, transplantation and pregnancy. Springer Semin Immunopathol 1999;21:339-59. 10.1007/BF00812261 [DOI] [PubMed] [Google Scholar]
- 49.Bais AG, Beckmann I, Lindemans J, et al. A shift to a peripheral Th2-type cytokine pattern during the carcinogenesis of cervical cancer becomes manifest in CIN III lesions. J Clin Pathol 2005;58:1096-100. 10.1136/jcp.2004.025072 [DOI] [PMC free article] [PubMed] [Google Scholar]
- 50.Zhao X, Liu J, Ge S, et al. Saikosaponin A Inhibits Breast Cancer by Regulating Th1/Th2 Balance. Front Pharmacol 2019;10:624. 10.3389/fphar.2019.00624 [DOI] [PMC free article] [PubMed] [Google Scholar]
- 51.Cicalese MP, Salek-Ardakani S, Fousteri G. Editorial: Follicular Helper T Cells in Immunity and Autoimmunity. Front Immunol 2020;11:1042. 10.3389/fimmu.2020.01042 [DOI] [PMC free article] [PubMed] [Google Scholar]
- 52.Klebanoff CA, Gattinoni L, Torabi-Parizi P, et al. Central memory self/tumor-reactive CD8+ T cells confer superior antitumor immunity compared with effector memory T cells. Proc Natl Acad Sci U S A 2005;102:9571-6. 10.1073/pnas.0503726102 [DOI] [PMC free article] [PubMed] [Google Scholar]
- 53.Pauza CD, Liou ML, Lahusen T, et al. Gamma Delta T Cell Therapy for Cancer: It Is Good to be Local. Front Immunol 2018;9:1305. 10.3389/fimmu.2018.01305 [DOI] [PMC free article] [PubMed] [Google Scholar]
Associated Data
This section collects any data citations, data availability statements, or supplementary materials included in this article.
Supplementary Materials
The article’s supplementary files as


