Abstract
The RecQ DNA helicase WRN is a synthetic lethal target for cancer cells with microsatellite instability (MSI), a form of genetic hypermutability that arises from impaired mismatch repair1–4. Depletion of WRN induces widespread DNA double-strand breaks in MSI cells, leading to cell cycle arrest and/or apoptosis. However, the mechanism by which WRN protects MSI-associated cancers from double-strand breaks remains unclear. Here we show that TA-dinucleotide repeats are highly unstable in MSI cells and undergo large-scale expansions, distinct from previously described insertion or deletion mutations of a few nucleotides5. Expanded TA repeats form non-B DNA secondary structures that stall replication forks, activate the ATR checkpoint kinase, and require unwinding by the WRN helicase. In the absence of WRN, the expanded TA-dinucleotide repeats are susceptible to cleavage by the MUS81 nuclease, leading to massive chromosome shattering. These findings identify a distinct biomarker that underlies the synthetic lethal dependence on WRN, and support the development of therapeutic agents that target WRN for MSI-associated cancers.
MSI is characterized by hypermutability of short repetitive DNA sequences that are scattered throughout the genome. MSI arises from deficiency in DNA mismatch repair (MMR) and contributes to the formation of many types of cancer including colorectal cancer (15%), endometrial cancer (20–30%), gastric cancers (15%), and ovarian cancers (12%)6. Recent studies have shown that several cancer types with MSI are reliant on activity of the WRN helicase for survival1–4. WRN is a member of the RecQ family of DNA helicases that includes WRN, BLM, and RECQL4, which when mutated cause the distinct chromosome instability disorders Werner syndrome, Bloom syndrome, and Rothmund–Thomson syndrome, respectively7. RecQ helicases do not display sequence specificity but resolve non-canonical secondary DNA structures such as bubbles, Holliday junctions, and G-quadruplexes that may be encountered during replication and recombination. However, the mechanism by which WRN helicase is required to protect chromosomal integrity of MSI, but not microsatellite stable (MSS), cancers is not understood.
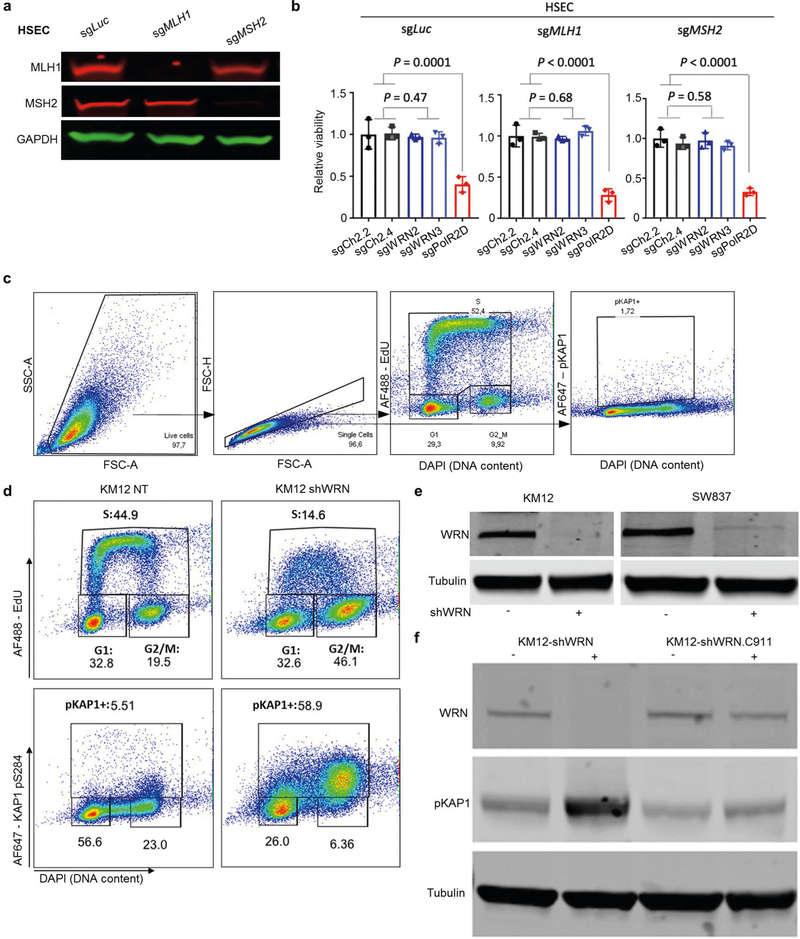
MMR restoration was previously shown to only partially rescue MSI cells from WRN depletion2. Recent studies have reported inconsistent results on the effect of acute MLH1 silencing to sensitize MSS cells to WRN depletion1,3. We therefore evaluated WRN dependency in human primary stomach epithelial cells (HSEC) after knockout of the MMR genes MLH1 or MSH2. After 4 months of culture, MLH1 or MSH2 knockout cells failed to develop a dependency on WRN for survival (Extended Data Fig. 1a, b). These data suggest that instead of WRN loss being simply synthetic lethal with impaired MMR, a ‘genomic scar’ may gradually accumulate in MSI cancers that requires WRN as a structure-specific helicase.
WRN loss causes DSBs and end-resection in MSI cells
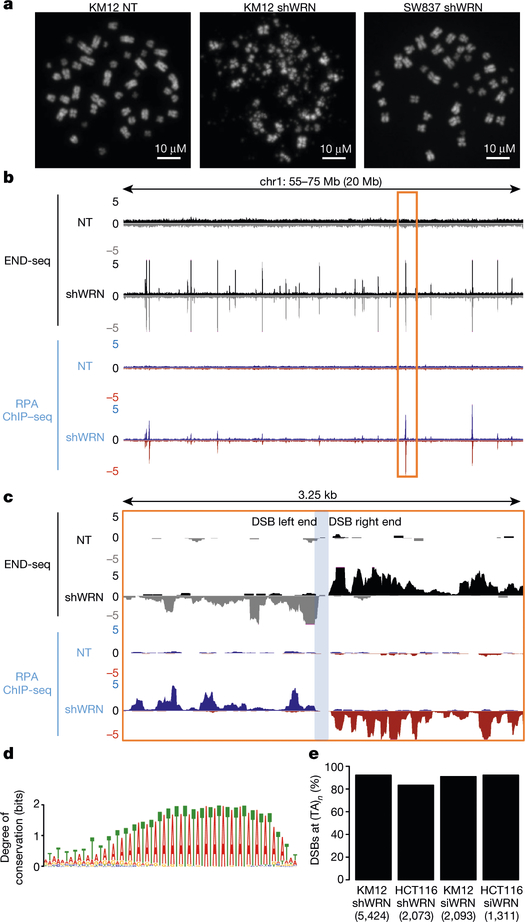
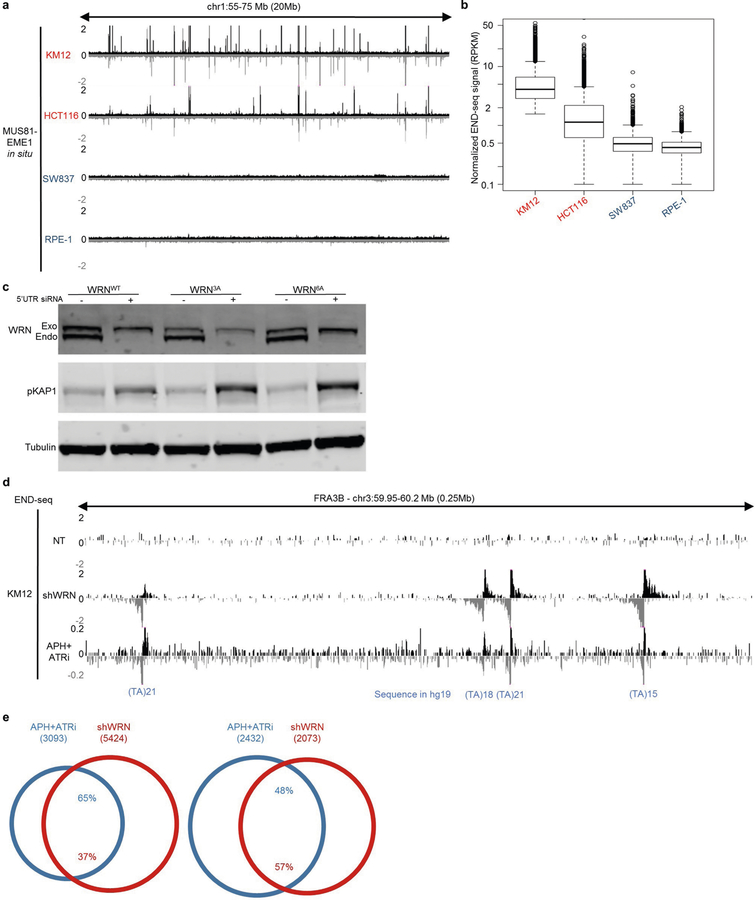
Loss of viability in MSI cells after silencing of WRN is associated with a decrease in the proliferation and accumulation of DNA double-strand breaks (DSBs)1–4. Consistently, we found that WRN depletion using a doxycycline-inducible WRN short hairpin RNA (shRNA) expressed in the MSI KM12 cell line2 resulted in decreased DNA synthesis and high levels of the DSB marker, KAP1 phosphorylation at Ser824 (pKAP1)8, predominantly in the G2/M phase of the cell cycle (Extended Data Fig. 1c–e). By contrast, expression of a non-targeting control shRNA (WRN.C911)2 did not substantially induce DSBs in KM12 cells (Extended Data Fig. 1f). Analysis of mitotic spreads (n = 100) showed that all chromosomes were shattered in approximately 35% of WRN-depleted KM12 cells (Figs. 1a, 2a). By contrast, chromosome shattering was not evident in the microsatellite stable (MSS) colon cancer line SW837 after WRN depletion (n = 100 metaphases) (Fig. 1a, Extended Data Fig. 1e).
Fig. 1 |. WRN depletion in MSI cells induces recurrent DSBs at (TA)n dinucleotide repeats.
a, Representative metaphase spreads from KM12 and SW837 cells containing an inducible WRN shRNA (shWRN) cassette. Cells were treated with DMSO (NT) or doxycycline (shWRN) for 48 h. Data are representative of three independent experiments, n = 100 metaphases for each condition. b, Genome browser screenshots displaying END-seq (n = 5) and RPA-bound ssDNA ChIP–seq (n = 1) profiles as normalized read density (reads per million, RPM) for KM12-shWRN cells. Positive- and negative-strand END-seq reads are displayed in black and grey, and positive- and negative-strand RPA–ssDNA ChIP–seq reads are in blue and red, respectively. c, Genome browser screenshot zoomed in on the highlighted region in b (orange box). The light-blue shading indicates the gap region between the left and right ends of the DSB. d, Motif analysis for sequence enrichment in the gap between positive and negative END-seq peaks in KM12-shWRN cells. e, Fraction of END-seq peaks occurring at sites of (TA)n repeats for KM12-shWRN and HCT116-shWRN cells treated with either doxycycline (shWRN, n = 2 for HCT116) or WRN siRNAs (siWRN, n = 1) for 72 h. Numbers in parentheses indicate number of peaks identified by peak-calling.
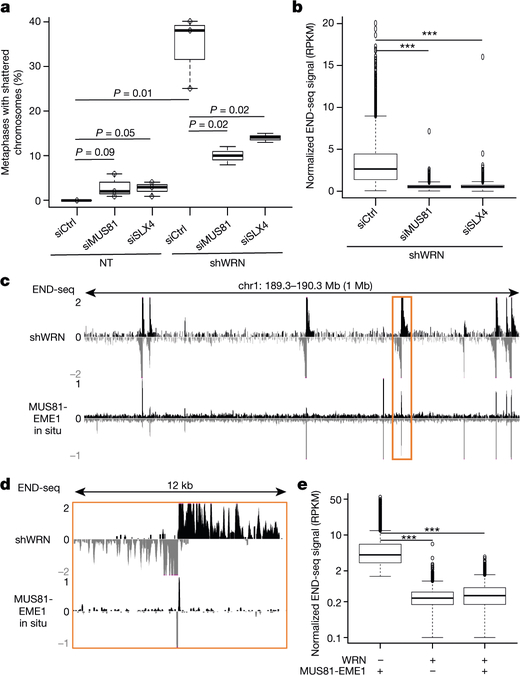
Fig. 2 |. TA breaks are dependent on structure-specific endonucleases MUS81–EME1 and SLX4.
a, Quantification of metaphases displaying chromosome shattering (defined as the absence of intact chromosomes) in KM12-shWRN cells treated with doxycycline plus siRNAs against MUS81 (siMUS81) or SLX4 (siSLX4), or non-targeting control (siCtrl) siRNAs for 72 h (n = 3). The top, centre mark, and bottom hinges of the box plots, respectively, indicate the 75th, median, and 25th percentile values. Whiskers represent minimum and maximum values. P values were calculated using Student’s t-test. b, Quantification of END-seq signal intensity (n = 2) at broken TA repeats in KM12-shWRN cells with treatment as in a. n = 5,001 peaks were examined. Boxplots are as in a, with outliers beyond 1.5 times the interquartile range shown. ***P < 2.2 × 10⁻¹⁶, one-sided Wilcoxon rank sum. c, Genome browser screenshot for KM12-shWRN cells treated with doxycycline (shWRN, top), and DMSO-treated cells processed with purified recombinant MUS81–EME1 enzyme in situ (bottom, n = 2). d, Genome browser screenshot zoomed in on the highlighted region in c (orange box). e, Quantification of END-seq peak intensity for DMSO-treated KM12-shWRN cells processed in situ with purified recombinant MUS81–EME1, WRN or WRN followed by MUS81–EME1 (n = 2). For the latter, proteinase K digestion was performed between the two enzymatic treatments. n = 5,496 peaks were examined. Box plots are as in a and b. ***P < 2.2 × 10⁻¹⁶, one-sided Wilcoxon rank sum test.
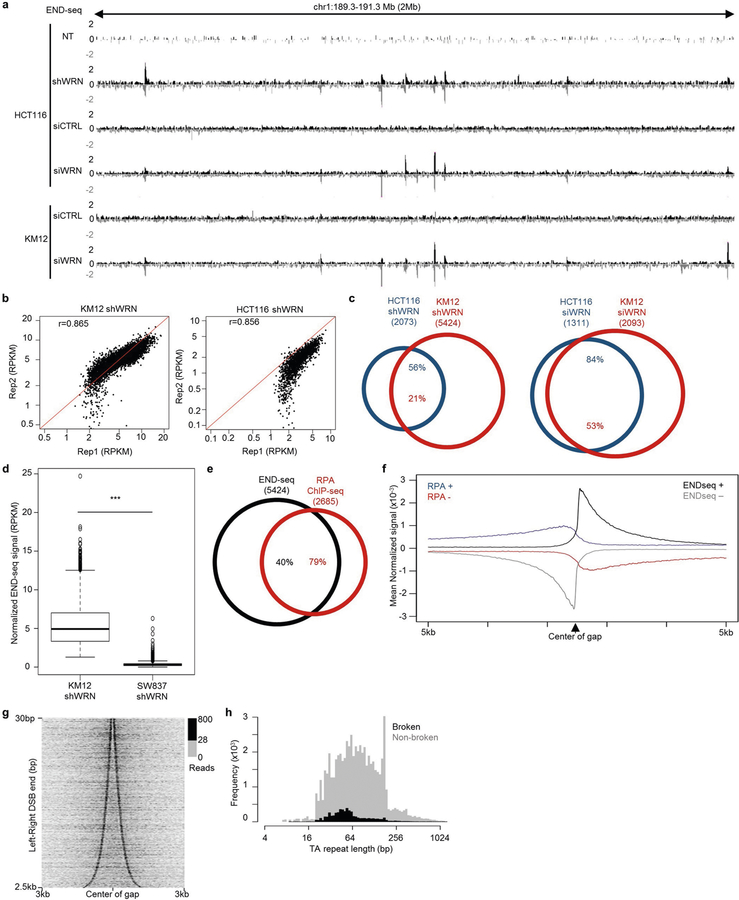
To determine whether WRN is necessary to unwind specific regions of the genome to prevent DNA breakage, we analysed sites of recurrent DSBs by END-seq9. The MSI cell lines KM12 and HCT116 show little endogenous DNA breakage; however, after WRN depletion by either shRNA or small interfering RNA (siRNA), recurrent DSBs were detected at specific locations throughout the genome (Fig. 1b, Extended Data Fig. 2a). Moreover, END-seq peak intensities were highly reproducible among different experiments (Extended Data Fig. 2b). Using the criteria of 20-fold enrichment compared with non-treated cells (WRN proficient), END-seq peaks overlapped significantly between HCT116 and KM12 cells (Extended Data Fig. 2a, c). By contrast, WRN depletion in SW837 cells did not substantially induce DSBs (Extended Data Fig. 2d). Thus, the loss of WRN induces DSBs at recurrent genomic loci that are reproducible across distinct MSI cancer cell lines.
DNA breaks accumulate around (TA)n repeats
END-seq peaks displayed the characteristic pattern of positive- and negative-strand reads representing the right and left ends of DSBs, respectively (Fig. 1c). END-seq reads spread outwards from DSB sites in a pattern consistent with DNA end resection9,10. To confirm this, we mapped sites of single-stranded DNA (ssDNA) bound by replication protein A (RPA)11,12. Notably, 79% of ssDNA peaks overlapped with END-seq peaks, with resection lengths averaging 500 bp and extending up to 5 kb (Fig. 1b, c, Extended Data Fig. 2e, f). Moreover, the polarity of RPA binding was indicative of the accumulation of 3′-overhangs (Extended Data Fig. 2f). Thus, the loss of WRN in MSI cells leads to DSBs with extensive 5′–3′ end-processing.
The left- and right-end of the DSBs were separated from each other by a variable distance (Fig. 1c, Extended Data Fig. 2g). Notably, this ‘gap’ contained a major reduction in sequencing reads, suggesting that DSBs occur at the borders of these regions. We therefore searched for specific DNA motifs in the gap region in the hg19 reference genome, which revealed a dominant TA-dinucleotide repeat motif (Fig. 1d) with a median repeat length of 51 bp (Extended Data Fig. 2h). Nearly all breaks associated with WRN deficiency in both KM12 and HCT116 cells occurred at TA dinucleotide repeats (Fig. 1e). However, only about 8% of all (TA)n repeats in the reference genome (5,400 out of 66,644) were associated with DSBs (Extended Data Fig. 2h). We conclude that DSBs flank a fraction of (TA)n repeats. Hereafter, we refer to these sites as ‘broken’ (TA)n repeats, and to the DSBs themselves as ‘TA breaks’.
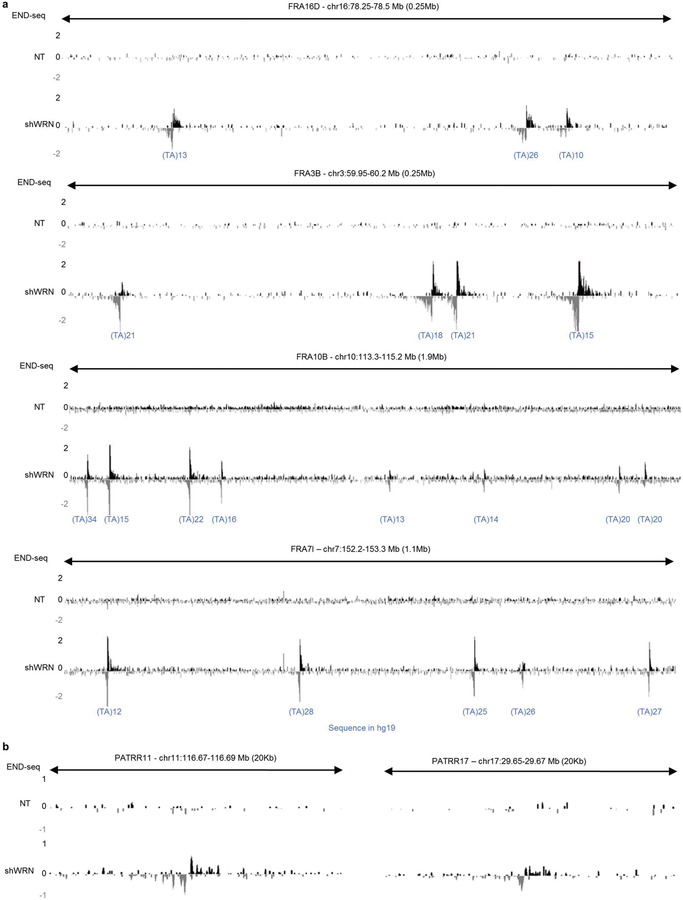
Cruciform structures form at (TA)n repeats in plasmids in Escherichia coli and yeast when their length exceeds roughly 20–22 repeat units13–15. Long (TA)n tracts also cause stalling of replication forks and chromosome fragility at late replicating common fragile sites (CFSs)16–18. Exogenous replication stress further enhances replication fork collapse at simple repeats12,19, including CFSs. Accordingly, we found that WRN depletion induces DNA breakage precisely at (TA)n repeats within several CFSs (Extended Data Fig. 3a) and at palindromic TA-rich repeats (Extended Data Fig. 3b), which have been proposed to form cruciform structures20. These data suggest that (TA)n repeats at these sites might fold into secondary structures that are targeted by WRN.
MUS81 shatters chromosomes in WRN-minus MSI cells
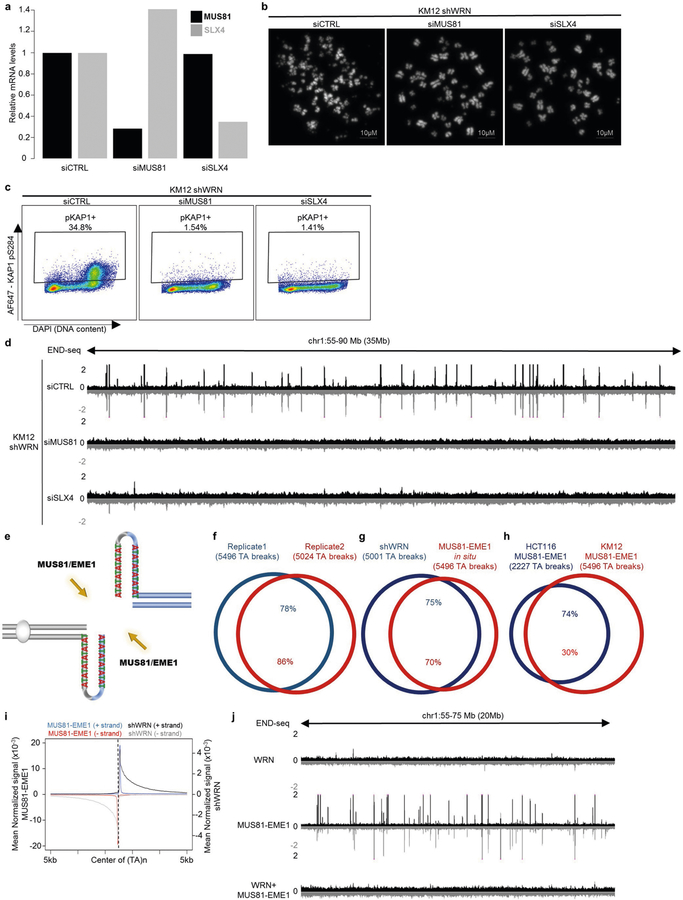
MUS81–EME1 is a structure-specific endonuclease complex that processes late recombination intermediates at CFSs21. MUS81–EME1 forms a complex with the scaffolding protein SLX4 that hyperactivates it at the G2/M boundary22. Recent studies indicate that the yeast MUS81–EME1 homologue (Mus81–Mms4) causes DSBs at (TA)n repeats when the tract exceeds a threshold length for forming cruciform structures17. To determine whether the DSBs that accumulate in WRN-depleted MSI cells are dependent on MUS81 and SLX4, we depleted these factors before WRN depletion (Extended Data Fig. 4a). Depletion of MUS81 or SLX4 markedly reduced chromosome shattering (Fig. 2a, Extended Data Fig. 4b). Consistent with this result, depletion of MUS81 and SLX4 also strongly reduced pKAP1 signalling (Extended Data Fig. 4c) and the formation of DSBs at (TA)n repeats (Fig. 2b, Extended Data Fig. 4d). Thus, MUS81 and SLX4 induce toxic chromosome breakage when WRN is depleted from MSI cells.
MSI genomes are cleaved by recombinant MUS81–EME1
To test whether MUS81–EME1 acts directly on secondary structures in MSI cells, we treated agarose-embedded genomic DNA from KM12 cells with recombinant MUS81–EME1 in situ before performing END-seq. MUS81–EME1 promotes the resolution of cruciform structures by a nick and counter-nick mechanism (Extended Data Fig. 4e), and we found that MUS81–EME1 generated recurrent and reproducible DSBs (Fig. 2c, d, Extended Data Fig. 4f). These overlapped markedly with DSBs generated by WRN depletion in these cells (Extended Data Fig. 4g, h). These data show that secondary structures accumulate and can be cleaved by MUS81–EME1 even at baseline conditions in MSI cells. Unlike DSBs that were highly resected after WRN depletion, in situ cleavage by MUS81–EME1 led to accumulation of reads precisely adjacent to the border of (TA)n repeats (Fig. 2d, Extended Data Fig. 4i). Thus, the broad distribution of END-seq reads in the WRN-depleted samples is indeed caused by 5′ end-processing in vivo after MUS81 cleavage.
We hypothesized that WRN is recruited to unwind DNA secondary structures before they can be cleaved by physiologically active MUS81. To test this, we incubated agarose-embedded DNA from KM12 cells with recombinant human WRN before MUS81–EME1 treatment in situ, followed by END-seq detection of DSBs. Incubation with WRN alone did not result in DSB formation, but pre-treatment with WRN substantially decreased cleavage by MUS81–EME1 (Fig. 2e, Extended Data Fig. 4j). These results suggest that WRN melts secondary DNA structures at (TA)n repeats in MSI cells.
If structure-forming (TA)n repeats are responsible for massive breakage in MSI lines, there should be fewer such structures in MSS cells. To test this, we performed the in situ MUS81–EME1 cleavage assay in two MSS cell lines (SW837 and RPE-1) and compared these to MSI cell lines KM12 and HCT116. MSI cells displayed an overlapping set of strong MUS81–EME1 cleavage sites (Extended Data Fig. 5a, b); by contrast, manifold fewer substrates for MUS81–EME1 cleavage were detected in the MSS cells. Thus, structure-forming (TA)n repeats accumulate in much higher abundance in MSI than in MSS cells.
(TA)n repeats are prone to replication fork stalling
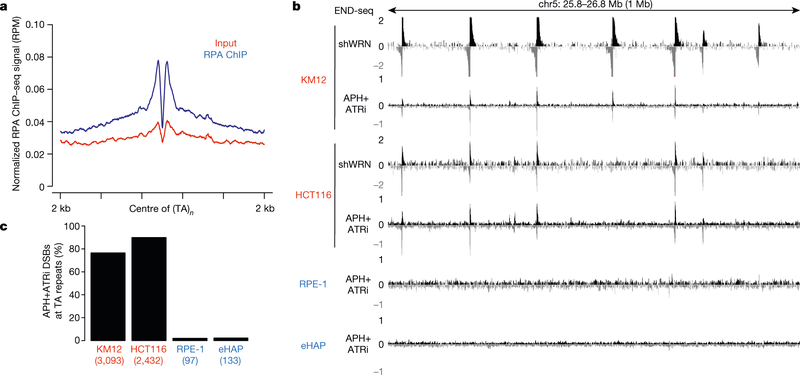
DNA polymerase stalling generates RPA-bound ssDNA, which activates the checkpoint kinase ATR to protect the replication fork. RPA chromatin immunoprecipitation followed by high-throughput sequencing (ChIP–seq) analysis in WRN-proficient KM12 cells demonstrated an enrichment of RPA in the vicinity of broken (TA)n sites, which suggests that stalled forks spontaneously accumulate at these sites (Fig. 3a). WRN is recruited to stalled replication forks in a manner that requires ATR phosphorylation23. Consistent with this, HCT116 cells expressing the WRN mutants WRN(3A) or WRN(6A) that contain alanine substitutions at identified ATR phosphorylation sites23 showed an increase in KAP1 phosphorylation when endogenous WRN was ablated by an siRNA that targeted the 5′ untranslated region (Extended Data Fig. 5c). We therefore hypothesized that stalled forks at structure-forming (TA)n repeats would be susceptible to fork collapse after inhibition of the ATR kinase. To test this, we treated MSI and MSS cells with a combination of ATR inhibitor and low-dose aphidicolin to partially inhibit DNA polymerase elongation. As determined by END-seq analysis, replication forks collapsed into DSBs preferentially at (TA)n repeats, including those within CFSs (Fig. 3b, c, Extended Data Fig. 5d). The frequency of fork collapse at (TA)n repeats in MSI cells was at least 30-fold higher than in MSS cells (Fig. 3b, c), and these sites largely overlapped with DSBs generated in the absence of WRN (Extended Data Fig. 5e). Thus, secondary structure-forming (TA)n repeats are associated with replication fork stalling that is overcome by WRN, possibly through activation by ATR.
Fig. 3 |. Replication stalling and collapse at (TA)n repeats in MSI cell lines.
a, Composite plot of RPA-bound ssDNA ChIP–seq signal around broken (TA)n repeats in KM12 cells treated with DMSO. b, Genome browser screenshot displaying END-seq profiles for KM12, HCT116, RPE-1, and eHAP cells containing an inducible shWRN cassette. Cells were treated with doxycycline (shWRN) for 72 h, or with a combination of aphidicolin (APH) and ATR inhibitor (ATRi) (n = 1) for 8 h. MSI cells are in red; MSS cell lines are in blue. c, Percentage of total DSBs located at (TA)n repeats after treatment with APH plus ATRi, as shown in b. MSI cell are in red; MSS cell lines are in blue.
(TA)n repeats inhibit DNA synthesis in vitro
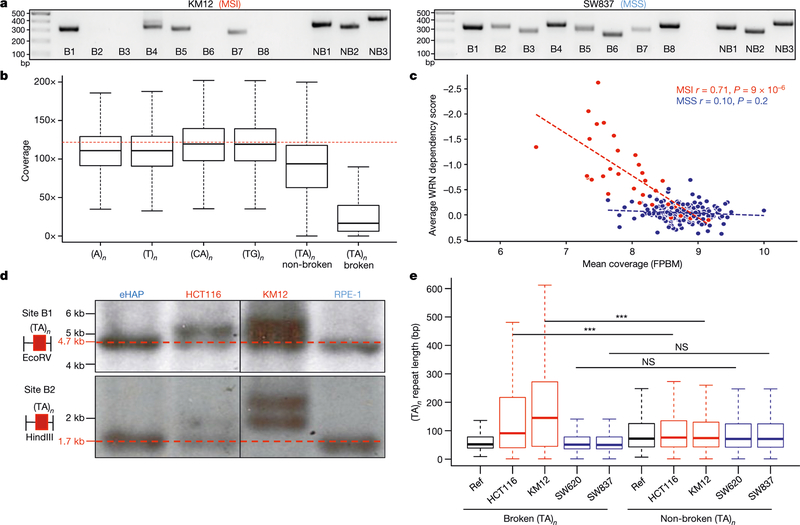
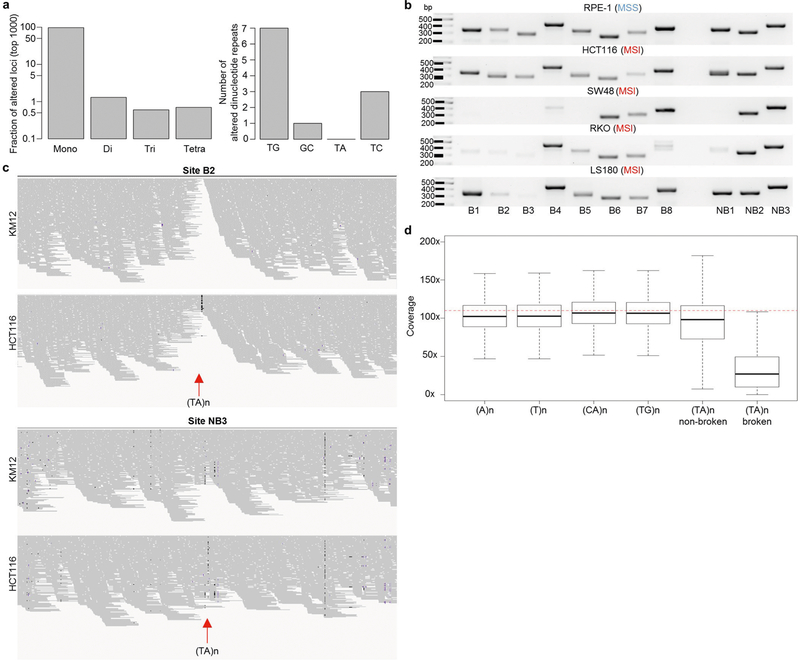
In cancers associated with MSI, insertions or deletions of a few nucleotides are commonly found at mononucleotide repeats5. Among dinucleotides, (TA)n repeats are reported to be the least frequently altered24 (Extended Data Fig. 6a). To determine why (TA)n repeats are susceptible to breakage, we performed a PCR-based size analysis of several (TA)n repeats in a panel of MSI and MSS cell lines (Fig. 4a, Extended Data Fig. 6b, Supplementary Table 1). We examined eight (TA)n repeats that were broken and three that were not broken after WRN depletion in MSI cells. All 11 sites that we analysed contained uninterrupted stretches of more than 20 (TA)n units (in the hg19 reference genome), and were amplified with primers flanking the (TA)n repeat.
Fig. 4 |. (TA)n repeats undergo large-scale expansion in MSI cell lines.
a, Agarose gels showing PCR fragments (or lack thereof) at (TA)n repeats in KM12 (MSI) and SW837 (MSS) cells. B1–B8 were chosen based on the presence of END-seq peaks after WRN depletion in KM12 cells. NB1–NB3 were chosen for similar (TA)n repeat lengths as broken sites without breakage after WRN depletion in KM12 cells. Ladder fragment sizes (in bp) are displayed. Data are representative of three independent experiments. For gel source data, see Supplementary Fig. 1. b, Box plots displaying coverage at different classes of repeats in WGS data from KM12 cells (n = 1). Dotted red lines indicate the average coverage over the genome. c, Cell lines plotted by their average WRN dependency score and sequencing coverage of broken (TA)n loci. FPBM, fragments per base per million. Pearson correlation coefficients were used to calculate r values and two-sided P values. d, Southern blots (n = 2) for two different genomic regions containing broken (TA)n repeats corresponding to the same sites in a. Red markers and dotted lines represent expected fragment sizes. For gel source data, see Supplementary Fig. 1. e, Box plot of long-read sequencing data (n = 1) demonstrating total length of broken and non-broken (TA)n in indicated cell lines compared with the hg19 reference genome. MSI (red), MSS (blue). n = 5,400 (broken), n = 61,244 (non-broken). Box plots are as in Fig. 2a, b. ***P < 2.2 × 10⁻¹⁶, one-sided Wilcoxon rank sum test. NS, not significant. Wilcox testing for the alternative hypothesis that the broken (TA)n has a greater group mean than the non-broken (TA)n was used. P values were corrected for multiple testing using the Benjamini–Hochberg method.
Although MSS cell lines showed the predicted PCR products at broken and non-broken sites (Fig. 4a, Extended Data Fig. 6b), many recurrently broken sites were not amplified in KM12 cells (Fig. 4a). These same sites frequently could not be amplified using genomic DNA from other MSI cell lines, which highlights that identical sites are affected across distinct cancers (Extended Data Fig. 6b). A notable exception was HCT116 cells, which showed the expected banding pattern. However, as discussed below, this probably reflects the fact that one of the two alleles is of normal size and can therefore be amplified.
The absence of PCR products at several broken (TA)n repeats using genomic DNA from MSI cell lines was unlikely to be caused by large deletions that included primer-binding sites, as these primer-binding sites were highly covered in END-seq and whole-genome sequencing data (below). We therefore speculated that these sites contain large, structure-forming expansions that might inhibit polymerase extension during PCR amplification. To test this hypothesis, we performed PCR-free whole-genome sequencing on KM12 and HCT116 cells, enabling us to reach an average sequencing depth of greater than 100×. By visual inspection, it was immediately clear that broken (TA)n repeats had a markedly lower read depth than flanking regions and non-broken (TA)n repeats (Extended Data Fig. 6c). Broken (TA)n repeats (mapped in WRN-depleted MSI cells) displayed the most significant drop in coverage compared with other classes of mono- and di-nucleotide repeats (Fig. 4b, Extended Data Fig. 6d). Finally, as assessed by CRISPR–Cas9 and RNA interference fitness screens2, the degree of dependence on WRN for the survival of human cancer cells was inversely correlated with sequencing coverage at broken (TA)n sites (Fig. 4c). Thus, structure-forming (TA)n repeats are highly recalcitrant to sequencing. Although not previously documented as mutated in MSI-associated cancers, (TA)n repeats are nevertheless predictive of WRN dependency.
MSI cells accumulate large (TA)n repeat expansions
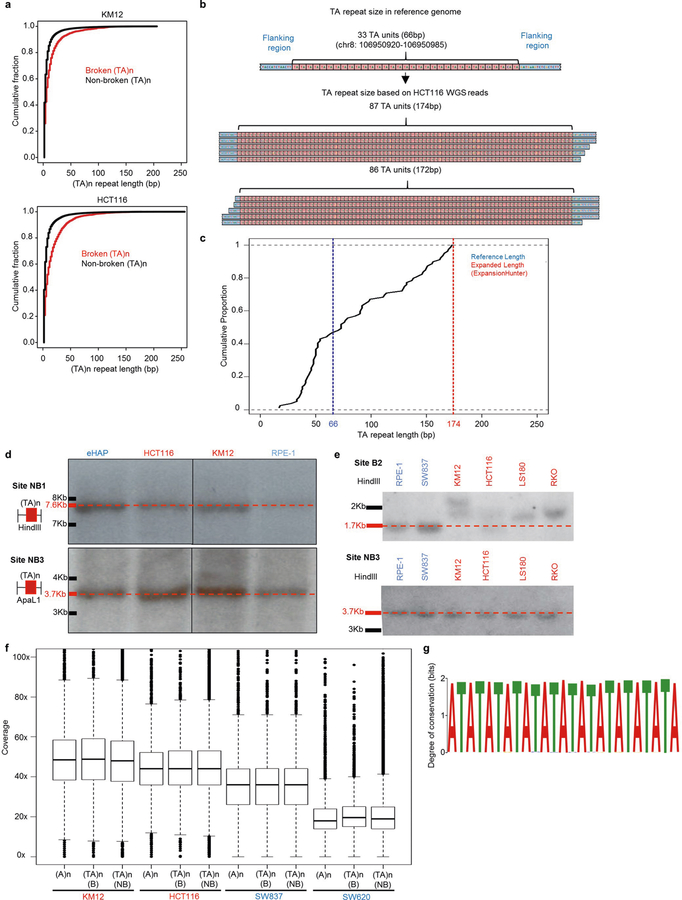
Because the identification of large-scale changes in short tandem repeats is challenging with short-read sequencing, we used the ExpansionHunter algorithm25, which has been used to detect various large pathogenic repeat expansions. This analysis showed that broken (TA)n repeats exhibit large-scale expansions compared to non-broken (TA)n repeats (Extended Data Fig. 7a, b). Consistent results were obtained with the expanded short tandem repeat algorithm (exSTRa)26 (Extended Data Fig. 7c).
As large expansions should increase the size of (TA)n repeats relative to the reference genome, we performed Southern blotting with probes that spanned two broken (B1 and B2) and two non-broken (NB1 and NB3) sites previously analysed by PCR (Fig. 4d, Extended Data Fig. 7d, e). For this analysis, we compared two MSI (KM12 and HCT116) and two MSS (RPE-1 and eHAP) cell lines. At the non-broken (TA)n repeats, we detected bands that corresponded to the expected sizes in all cell lines (Extended Data Fig. 7d). In addition, neither of the broken (TA)n regions was altered in control RPE-1 or eHAP cell lines (Extended Data Fig. 7d). For the B1 broken site, we detected one allele of the expected size, but also one expanded allele in both KM12 and HCT116 cells (Fig. 4d, Extended Data Fig. 6b). The shorter, non-expanded allele probably corresponds to the PCR product detected at B1 in both cell lines. At the B2 broken site, we detected one expanded allele in HCT116, whereas the other allele was the expected size (Fig. 4d), corresponding to the product detected by PCR (Extended Data Fig. 6b). In KM12 cells, broken site B2 exhibited distinct expansions on the two alleles (Fig. 4d, Extended Data Fig. 7e), and no PCR product was detectable at this site (Fig. 4a). Together, our data suggest that (TA)n repeats undergo large-scale expansion, and that expanded alleles inhibit DNA synthesis during PCR and short read whole-genome sequencing.
Long-read sequencing technology has successfully characterized expansions of simple tandem repeats that are responsible for various diseases27. To determine whether a similar approach could uncover variations in secondary structure-forming (TA)n repeats in MSI cells, we used the Pacific Biosciences (PacBio) continuous long-read (CLR) sequencing platform27. With this platform, MSI (HCT116 and KM12) and MSS (SW620 and SW837) colon cancer cell lines displayed similar coverage at broken (TA)n and other simple repeats (Extended Data Fig. 7f). We detected a large range of expansions at different broken (TA)n sites in MSI cells, with median repeat lengths expanding from 54 bp in the hg19 reference genome to 91 bp and 125 bp in HCT116 and KM12 cells, respectively (Fig. 4e). By contrast, the median lengths of non-broken (TA)n repeats in HCT116 (75 bp) and KM12 (74 bp) cells were much more similar to the reference genome (72 bp). MSS cell lines did not show substantial expansions at either broken or non-broken (TA)n sites (Fig. 4e). Motif analysis within the broken sites showed that the expanded alleles consisted of almost pure (TA)n repeats (Extended Data Fig. 7g). Thus, MMR deficiency predisposes (TA)n repeat tracts to undergo large-scale expansions.
(TA)n repeat length and purity contribute to breakage
Of all the annotated (TA)n repeats in the reference genome, only 8% display DSBs after WRN depletion in MSI cells (Extended Data Fig. 2h). Thus, it remains unclear what characterizes the underlying expansion and breakage specifically at these sites and why susceptible sites are recurrent across several distinct MSI cell lines. Changes in the length of microsatellite DNA are thought to arise from replication slippage caused by the transient dissociation of the polymerase from replicating DNA strands followed by self-annealing and misaligned reassociation28. Because the probability of self-annealing increases with the purity and length of the repeat sequence and decreases with repeat interruptions28, we speculated that predisposition to large-scale expansions of (TA)n repeats, and therefore breakage, would be influenced by the exact sequence composition of the repeat.
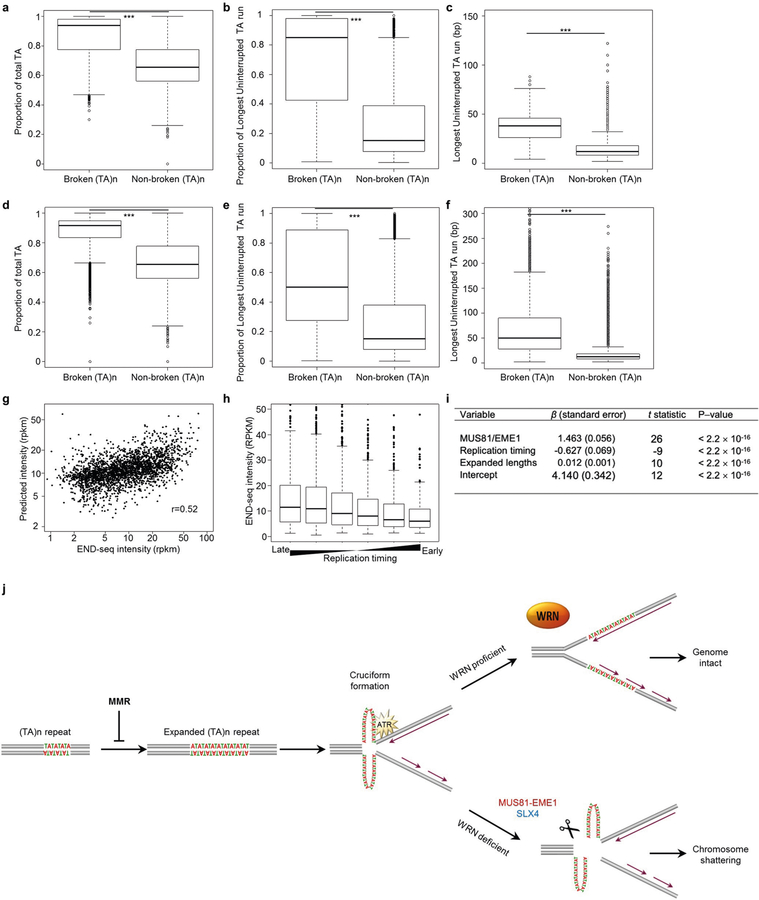
We found that broken sites have a higher TA content, fewer interruptions in the (TA)n repeat, and longer uninterrupted (TA)n sequences compared with non-broken sites as assessed both in the reference genome (Extended Data Fig. 8a–c) and in long-read sequencing reads from MSI cells (Extended Data Fig. 8d–f). Quantitative modelling showed that three features of (TA)n repeats were predictive of breakage in WRN-deficient cells: the probability that they form secondary structures as measured by MUS81–EME1 cleavage in situ; the sizes of expansions determined by long-read sequencing; and the likelihood that they occur in late replicating regions (Extended Data Fig. 8g–i). Although these features cannot fully predict the propensity of (TA)n repeats to break after WRN deficiency, the analysis demonstrates that longer, uninterrupted (TA)n repeats are more likely to undergo expansion in MSI cell lines, where they form secondary structures and disrupt DNA replication. In the absence of WRN, (TA)n repeats that are replicated in late S phase are less likely to be resolved before mitosis, when they are recognized and cleaved by MUS81 to generate DSBs.
Expandable repeats and genome stability
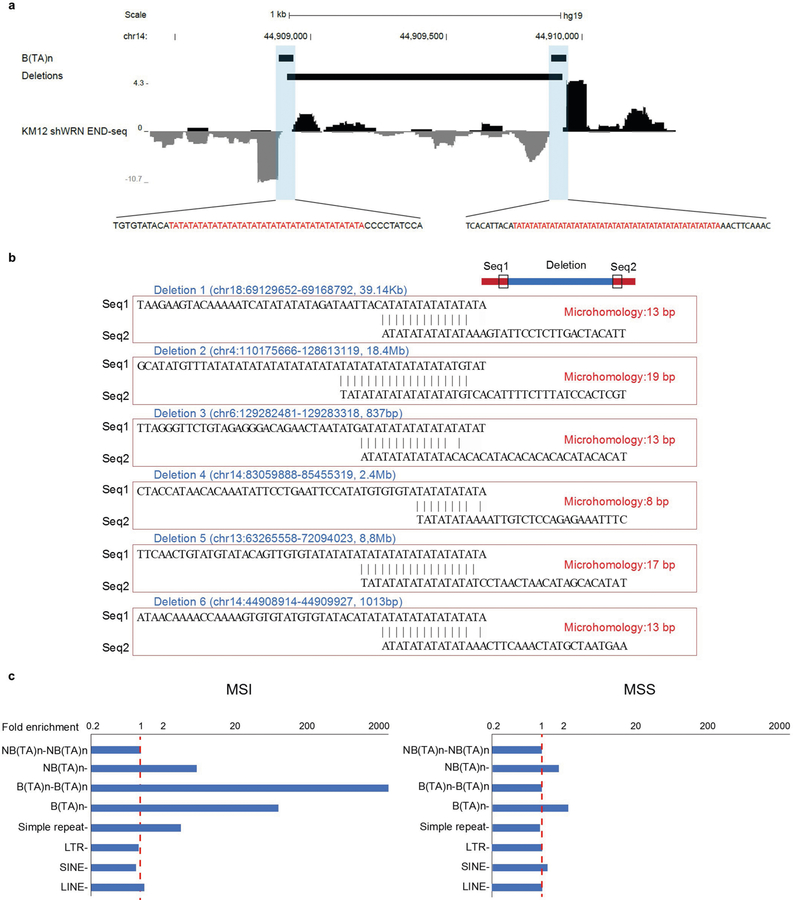
Secondary structure-forming (TA)n tracts within CFSs cause replication fork stalling and chromosome breakage. CFSs are also associated with deletions in several tumour types29, probably owing to their susceptibility to replication fork collapse. Because broken (TA)n sites in MSI cells are also susceptible to replication fork stalling and collapse (Fig. 3), we hypothesized they could be hotspots for deletions in MSI-associated cancers. Although genomic instability in MSI cancers is most frequently associated with small insertions and deletions, large kilobase-to-megabase scale deletions of unknown aetiology have been detected30. We therefore analysed data from pan-cancer whole genome sequencing cohorts in uterine corpus endometrial carcinoma (UCEC), colon adenocarcinoma (COAD) and gastric adenocarcinoma (STAD)31. Breakpoints associated with deletions (ranging in size from 459 bp to 176 Mb) in MSI (24) and MSS (93) cancers were identified5. In several cases, one or both deletion breakpoints mapped precisely to broken (TA)n repeats (Extended Data Fig. 9a, b). We then calculated the enrichment of different annotated repeats at the tumour breakpoints compared to their enrichment at random breakpoints with comparable chromosome and size distributions, and found that MSI tumour breakpoints showed the greatest enrichment at broken (TA)n repeats (Extended Data Fig. 9c). By contrast, these sites were not enriched for deletion breakpoints in MSS tumours (Extended Data Fig. 9c). Thus, in cancers associated with MSI, large-scale deletions are frequently associated with broken (TA)n sites, which suggest that they are inherently fragile.
On the basis of our results, we propose the following model (Extended Data Fig. 8j): MMR-deficient cells undergo microsatellite instability, which gradually manifests as large-scale expansions at (TA)n repeats. The most susceptible sites are those that contain pure, uninterrupted TA-dinucleotide repeats. Over the course of months to years, (TA)n repeats reach a threshold length above which they extrude into cruciform structures, perhaps as a result of negative supercoiling during nucleosome removal ahead of the replication fork. These structures would stall replication forks and trigger ATR-dependent WRN phosphorylation, which promotes unwinding of the secondary structure to complete replication. In the absence of WRN, the structure-specific MUS81–EME1 endonuclease, in conjunction with its scaffold SLX4, cleave these structures in an attempt to salvage the replication fork. However, thousands of concerted MUS81 cleavage events lead to extensive DNA end-resection, RPA exhaustion8 (Fig. 1b, c), chromosomal fragmentation, and cell death.
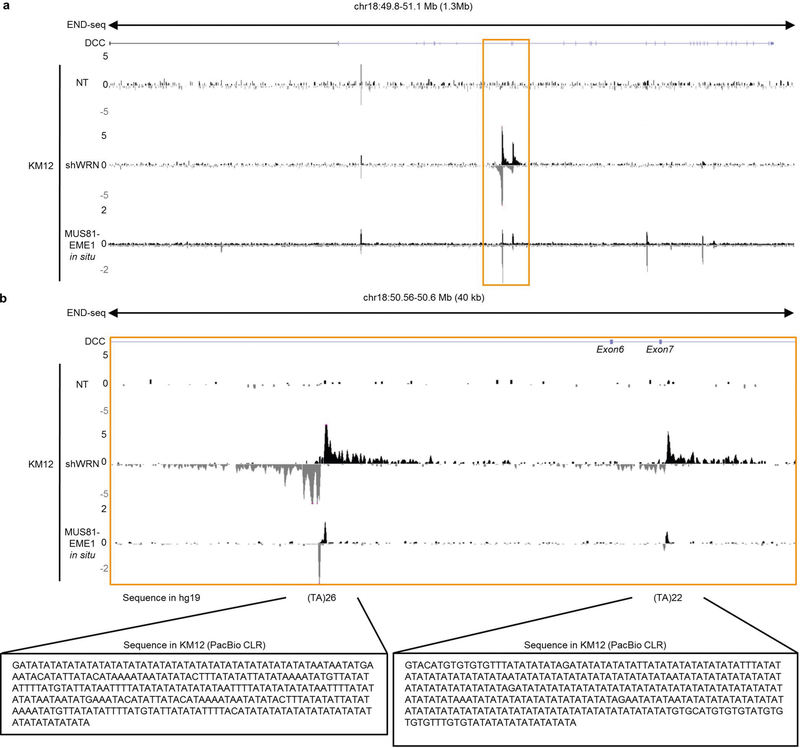
Thirty years ago, Vogelstein and colleagues discovered the DCC gene, which has vastly reduced expression in colon cancer32. By Southern blot analysis, several MSI tumour cell lines were shown to contain ‘insertions’ of up to 300 bp at a locus containing an uninterrupted (TA)22 repeat just downstream of DCC exon 7. However, numerous attempts to clone or amplify alleles with insertions failed, leading the authors to conclude that the inserted sequence might form an unusual DNA structure. Notably, we detected a MUS81–EME1-sensitive DNA structure at precisely the same (TA)n repeat (Extended Data Fig. 10a), and long-read sequencing confirmed a (TA)n expansion at that locus (Extended Data Fig. 10b, right highlighted sequence). Thus, our data demonstrate that rather than a non-templated insertion, DCC contains a structure-forming, MSI-expanded (TA)n repeat.
Anti-PD-1 antibodies have been approved for use in patients with cancers with mismatch repair deficiency or MSI, independent of the cancer lineage. The therapeutic response is correlated with the number of indels in coding regions, which can generate immunogenic neoantigens33,34. (TA)n repeat expansions are mostly localized outside of coding regions, and therefore might not generate immunogenic neoantigens. However, DSBs at (TA)n motifs can trigger innate cytosolic DNA- and RNA-dependent sensing and signalling pathways35,36, which indicates that WRN inhibition has the potential for further stimulating immune responses. Although indel mutations of a few nucleotides and large-scale (TA)n expansions are both features of MSI, further studies will be necessary to determine whether these defects arise through different mechanisms, in distinct MSI tumours, or within different subclones. In summary, our findings provide a mechanistic explanation for WRN dependence with MSI and identify a new biomarker to guide the selection of patients in which WRN inhibition may be effective in combination with immune checkpoint blockade or as an independent line of therapy.
Online content
Any methods, additional references, Nature Research reporting summaries, source data, extended data, supplementary information, acknowledgements, peer review information; details of author contributions and competing interests; and statements of data and code availability are available at https://doi.org/10.1038/s41586-020-2769-8.
Methods
Cell lines and cell culture
Cell lines containing doxycycline-inducible shWRN cassette (KM12, HCT116, SW837, RPE-1) were generated as previously described2. Cell lines were grown in medium supplemented with 10% fetal bovine serum (FBS), penicillin (100 μg ml−1), streptomycin (100 μg ml−1), and l-glutamine (Gibco, 292 μg ml−1) unless stated otherwise. KM12, SW837, and SW48 cells were grown in RPMI1640 (Gibco), HCT116 in McCoy’s 5A (Gibco), RPE-1 in DMEM/F12 (Gibco), SW620 in Leibovitz’s L-15 (Gibco), OVK18 and LS180 in MEMα (Gibco) supplemented with 15% FBS. HSECs were obtained from Cell Biologics (H-6039) and cultured with complete human epithelial cell medium (CellBiologics H6621). Independent HCT116 clones were used for whole genome sequencing and continuous long-read sequencing. Cell lines were tested for mycoplama contamination.
Generation of MMR-deficient HSEC cell lines
Transduction of HSEC with Cas9 was performed with pLX311-Cas9 (Addgene 118018) followed by blasticidin (4 μg ml−1) selection. Subsequently, we transduced pXPR_BRD003 carrying sgRNAs targeting MLH1 (target sequence TTTGGCCAGCATAAGCCATG), MSH2 (CCGGTCGAAAAGGCGCACTG), or luciferase (ACAACTTTACCGACCGCGCC) to generate stable cell lines after puromycin selection (2 μg ml−1).
Cell viability assay
Cas9-expressing HSEC with sgRNAs targeting MLH1, MSH2, or luciferase were transduced with pXPR_BRD003 harbouring the following sgRNAs. sgRNAs targeting WRN include sgWRN2 (ATCCTGTGGAACATACCATG) and sgWRN3 (GTAGCAGTAAGTGCAACGAT). Two negative controls targeting intergenic sites on chromosome 2 were used: Chr.2–2 sgRNA (GGTGTGCGTATGAAGCAGTG) and Chr.2–4 sgRNA (GCAGTGCTAACCTTGCATTG). sgRNA targeting POLR2D (AGAGACTGCTGAGGAGTCCA) was used as a pan-essential control. All sgRNAs were inserted in the pXPR_BRD003 lentiviral vector and inserts were verified by Sanger sequencing. Viability was determined using CellTiter-Glo (Promega G7572) 7 days after lentiviral transduction.
Protein depletion and exogenous replication stress
Expression of shWRN was induced by adding 1 μg ml−1 doxycycline to cell culture medium for indicated time. The following siRNAs were used for experiments: siGenome Human siRNA Smartpool targeting WRN, MUS81, and SLX4, as well as non-targeting control pool (Horizon Discovery). WRN 5′ UTR (AAACCCGAGAAGAUCCAGUCCAACA) was described previously3 and ordered from ThermoFisher. Cells were transfected using RNAiMax Transfection Reagent (ThermoFisher) according to manufacturer’s instructions. To induce exogenous replication fork collapse, cells were treated with aphidicolin (0.2 μg ml−1, Sigma Aldrich) for 24 h, and ATR inhibitor AZ20 (10μM, SelleckChem) was added for the final 8 h.
RNA isolation and qRT–PCR
Total RNA was extracted from cells using Trizol Reagent (Invitrogen), and cDNA was made using SuperScript II Reverse Transcriptase (ThermoFisher), according to manufacturer’s instructions. qPCR was performed using iTaq Universal SyBR Green (BioRad), samples were run and analysed on a BioRad CFX96 Real-Time PCR detection system. Primer sequences were as follows.
MUS81 forward: 5′ GCTGCTCCGAGAGCTACAG 3′ MUS81 reverse: 5′ CAGGGTTTGCTGGGTCTCTA 3′ SLX4 forward: 5′AGTGTGCTGTGAAGATGGAG 3′ SLX4 reverse: 5′ CCGTTTCAGACCTCTACTGTG 3′ ACTB forward: 5′ CGTCACCAACTGGGACGACA 3′ ACTB reverse: 5′ CTTCTCGCGGTTGGCCTTGG 3′
Metaphase analysis
Cells were arrested at mitosis with 0.04 μg ml−1 colcemid (Roche) for 16 h and metaphase chromosome spreads were prepared as previously described37.
Western blotting
Cells were lysed in a buffer containing 50 mM Tris-HCl (pH 7.5), 200 mM NaCl, 5% Tween-20, 2% Igepal CA-630, 2 mM PMSF, 50 mM β-glycerophosphate (Merck) and protease inhibitor cocktail tablet (cOmplete Mini, Roche Diagnostics). Equal amounts of lysates were loaded into precast mini-gels (Invitrogen) and resolved by SDS–PAGE. Transfer of proteins onto nitrocellulose membranes and incubation with primary/secondary antibodies were performed according to standard procedures. Visualization of protein bands was achieved by fluorescence imaging on the Odyssey Clx system (LI-COR Biosciences). Antibodies and dilutions used were as follows: anti-WRN (1:5,000, Novus), anti-pKAP1 (Bethyl Laboratories, 1:100), anti-tubulin (1:5,000, sigma), anti-MLH1 (Cell Signaling Technology, 3515, 1:1,000), anti-MSH2 (Abcam, ab52266, 1:1,000), anti-GAPDH (Cell Signaling Technology, 5174, 1:5,000), IRDye 680RD Goat anti-Mouse IgG (1:2,000, LI-COR Biosciences), IRDye 800CW Goat anti-Rabbit IgG (1:2,000, LI-COR Biosciences), Goat anti-Rabbit Alexa Fluor 647 (ThermoFisher, A27040, 1:5,000).
Flow cytometry
For cell cycle analysis, exponentially growing cells were incubated with 10 μM (5-ethynyl-2’ -deoxyuridine) for 30 min at 37 °C and stained using the Click-IT EdU Alexa Fluor 488 Flow Cytometry Assay Kit (ThermoFisher) according to the manufacturer’s instructions. DNA content was measured by DAPI (4′,6-diamidino-2-phenylindole, 0.5 μg ml−1). For pKAP1 staining, fixed and permeabilized cells were washed in PBS plus 2% FBS, incubated for 1 h with pKAP1 antibody (Bethyl Laboratories, 1:100), washed, stained with anti-rabbit Alexa Fluor 647 antibody (ThermoFisher, 1:2,000). Data were analysed using FlowJo v10 software.
Protein purification
Expression and purification of MUS81–FLAGEME122 and WRN38 were performed as previously described. Human MUS81 (residues 246–551) and double 8×His-EME1 (residues 246–570) were expressed in a bicistronic expression vector and purified as previously described39, minus the cation exchange chromatography step.
Enzymatic reactions
For enzymatic reactions, END-seq plugs were incubated in the presence of 50 nM of the indicated enzyme for 1.5 h at 37 °C. MUS81-EME1 enzyme reactions were done in buffer consisting of 25 mM Tris-HCl pH 8.0, 30 mM NaCl, 3 mM MgCl2, 100 ng μl−1 BSA, 5% glycerol, and 1 mM DTT. WRN enzyme reactions were done in buffer consisting of 30 mM HEPES pH 7.4, 40 mM KCl, 8 mM MgCl2, 100 ng μl−1 BSA, 5% glycerol and 2 mM ATP. For in situ experiments in which plugs were treated with both WRN and MUS81–EME1, after WRN incubation, agarose plugs were treated with proteinase K in lysis buffer at 50 °C for 1 h and then washed in 10 mM Tris-HCl pH 8.0 solution, before incubation with MUS81–EME1.
END-seq
For END-seq, 7–8 million cells were collected, embedded in 1% agarose plugs, and processed as previously reported9,12.
RPA ChIP–seq
Approximately 20 million cells were collected and ChIP–seq was performed as previously reported using anti-RPA32/RPA2 (Abcam, ab10359)12.
PCR-free whole-genome sequencing
Genomic DNA was isolated from cultured cells by phenol–chloroform extraction. To provide sufficient mass and maximize library diversity, two identical library preparations were performed in parallel and combined for each sample. DNA (1,000 ng) was fragmented on a Covaris S2 sonicator, using 50 μl microTUBE AFA Snap-Caps (intensity = 5, duty cycle = 5%, cycles per burst = 200, time = 35 s). Sequencing libraries were prepared using PCR-free KAPA HyperPrep Kit (Roche) according to the manufacturer’s instructions. During ligation, standard adaptors were substituted for xGen Dual Index UMI Adapters (IDT). Following ligation, libraries were size selected using SPRIselect Beads (Beckman Coulter) twice, at concentrations of 0.7× and 0.5× by volume.
Sequencing of END-seq and ChIP–seq libraries
END-seq and ChIP–seq libraries were sequenced on the Nextseq 500 or Nextseq 550 platform (Illumina), using 75-bp single-end read kits. WGS libraries were sequenced on the Novaseq 6000 platform (Illumina), using 250-bp paired-end kits. Data were processed using bcl2fastq software.
CLR sequencing
High molecular mass genomic DNA was purified using the MagAttract HMW DNA kit (Qiagen). For CLR library preparation, at least 5 μg of high molecular mass genomic DNA (more than 50% of fragments ≥40 kb) was sheared to approximately 40 kb using the Megaruptor 3 (Diagenode B06010003), followed by DNA repair and ligation of PacBio adapters using the PacBio SMRTbell Express Template Prep Kit 2.0 (100–938-900). Libraries were then size-selected for >30 kb using a BluePippin instrument with 0.75% agarose cassettes (Sage Science). After quantification with the Qubit dsDNA High Sensitivity assay (Thermo Q32854), libraries were diluted to 50 pM per SMRT cell, hybridized with PacBio V2 sequencing primer, and bound with SMRT seq polymerase using Sequel II Binding Kit 2.0 (PacBio 101–842-900). CLR sequencing was performed on the Sequel II instrument using 8M SMRT Cells (101–389-001) and Sequel II Sequencing 2.0 Kit (101–820-200), with a 15 h movie time per SMRT cell. Initial quality filtering, basecalling, and adaptor marking were done automatically on board the Sequel II.
PCR
PCR reactions consisted of 1× KAPA LongRange Buffer, 0.5 U KAPA LongRange HotStart Polymerase (Roche), 1.75 mM MgCl2, 300 μM dNTPs, 0.4 μM of each primer, and 75 ng of genomic DNA used as template. Samples were initially denatured at 95 °C for 3 min, underwent 32 cycles of: 1) denaturation at 95 °C for 30 s and 2) annealing/extension at 60 °C for 3 min, followed by a final extension at 60 °C for 10 min. PCR products were separated on a 2% agarose gel and visualized by 0.5 μg ml−1 ethidium bromide staining.
PCR primer sequences are as follows: B1 forward: 5′-GCAACCAGCTGTTTTTGTGA-3′, B1 reverse: 5′-GCAATAGTATGCAGCTTGCCC-3′; B2 forward: 5′-TTTGCATCCTGCTTTTCTCATCT-3′, B2 reverse: 5′-GAAGAGGTGCCTGGTAGCTG-3′; B3 forward: 5′-TTTGGCTTAGGGGAAGTGTGG-3′, B3 reverse: 5′-GTTTTGAGCATGCTGACCTGA-3′; B4 forward: 5′-GCAAGAACCAAATGCTGCAC-3′, B4 reverse: 5′-ACTCCTGTTGCTCAGGCAAT-3′; B5 forward: 5′-TGTCCGTGTCTCGAGGAGT-3′, B5 reverse: 5′-GTGTCTCCATCCATTGTTCTGC-3′; B6 forward: 5′-TGCTTTCAACCTGCCCAAAC-3′, B6 reverse: 5′-GCACTTGAGCCTTGCTGGTA-3′; B7 forward: 5′-TGTGGTTGTCTTCTCCACCC-3′, B7 reverse: 5′-AGCTGGGTGTTAAGGGATGAA-3′; B8 forward: 5′-ATGGGATGGCCACACTGAAG-3′, B8 reverse: 5′-AACTTGCCTTTCACCTGCCT-3′; NB1 forward: 5′-ATAGTCTGTCTCCCGCAGTCT-3′, NB1 reverse: 5′-GAGACCGCCGATTAGCATTC-3′; NB2 forward: 5′-TACCTGACAGAACCACTGGC-3′, NB2 reverse: 5′-GACAAGGATTCCCCTCCTGC-3′; NB3 forward: 5′-GTGGTGTGGTAAAGGGACCA-3′, NB3 reverse: 5′-CCTCTCCCTGTTAAGTCATTACC-3′.
Genomic location and reference genome size for TA loci amplified by PCR
Genomic location and reference genome size of sites selected for PCR amplification are shown below. Each site amplified contains an uninterrupted stretch of (TA)n repeats and was amplified with primers localized in flanking areas outside of the (TA)n repeat. Broken sites B1–B8 were chosen based on the presence of END-seq peaks after WRN depletion in KM12 cells. Sites NB1–NB3 were chosen with similar TA repeat lengths as broken sites but were not broken after WRN depletion in KM12 cells.
Southern blotting
Native (1% agarose) Southern blot analyses of broken and non-broken (TA)n dinucleotide lengths were carried out using standard Southern blot techniques. Genomic DNA (10 μg) from indicated cell lines were digested with the indicated restriction enzymes: B1: EcoRV; B2: HindIII; NB1: ApaLI; NB3: HindIII. Probes were generated by PCR amplification using genomic DNA from the RPE-1 cell line using the following oligonucleotides:
B1 forward: 5′-GTCAAGGAAAGCCAAGAATTGGAA-3′, B1 reverse: 5′-AGAGTTGGAATTTGAACCAAAGC-3′; B2 forward: 5′-GAAACTGCCAAACACAGGGC-3′, B2 reverse: 5′-TCTTCAGCACAGGAGCAAGG-3′; NB1 forward: 5′-GTAAGGAGTGTGTGTGGGGG-3′, NB1 reverse: 5′-ACTCATGGAGAATAGACTACGACT-3′; NB3 forward: 5′-AGCCATGGTGTGTTTCTGGT-3′, NB3 reverse: 5′-GCCGTCTTCGAACCTGTAGA-3′.
Quantification and statistical analysis
Genome alignment.
For single-end sequencing, NextSeq 500/550 was used for single end sequencing using 75-bp reads. The sequenced tags were aligned using Bowtie240 with the parameters −N 0 −k 1 −q--local--fast-local. For paired end sequencing: NovoSeq 6000 was used for paired-end sequencing using 2 × 250-bp reads. The sequenced tags were aligned using Bowtie2 with the parameters −N 0--local.
Peak calling.
Peaks were called for single end sequencing experiments using MACS 1.4.341 using the parameters −p 1e-5--nolambda--nomodel--keep-dup = all (keep all redundant reads). For each case the experimental sample was doxycycline (shWRN) treated sample compared with DMSO (NT) sample as control. There were some additional filtering criteria as explained below:
For shWRN END-seq and RPA ChIP–seq, the output of the peak calling was filtered by a 20-fold enrichment over background and a minimum size of 1 kb. The resulting regions were merged using bedtools42 merge −d 1000 function to define the list of regions.
For siWRN and MUS81–EME1 END-seq, the output of the peak calling was filtered by a 20-fold enrichment over background. The resulting regions were merged using bedtools merge −d 1000 function to define the list of regions. For each region defined above the summit in positive and negative strand reads was evaluated using bedtools coverage −d function. The bedtools intersect function was used to filter the regions for which the positive summit was downstream of the negative summit and the distance between the two summits was set to be between 30 and 2,500 bp. This defined the final list of peaks for each experiment.
Motif finding.
For each peak the taller of the positive or negative summit was identified. From this taller summit a 1-kb window was generated downstream (upstream) if the summit was on negative (positive) strand. MEME suite43 was used to identify the common sequence motif in these genomic windows.
For motif analysis from pacbio data, the nucleotide sequences (greater than equal to 5) corresponding to the broken TA sites were used. For each annotated (TA)n repeat sequence extracted from the hg19 genome sequence, three parameters were calculated: (a) TA proportion—that is, the cumulative TA length divided by the length of the full annotated (TA)n repeat; (b) uninterrupted (TA)n proportion—that is, the length of the longest continuous TA sequence divided by the length of the full annotated (TA)n repeat; (c) uninterrupted (TA)n length—that is, the length of the longest continuous TA sequence within the annotated (TA)n repeat. These three parameters were plotted separately to compare between (TA)n repeats at broken and non-broken sites of shWRN-KM12 cells. Data are plotted in Extended Fig. Data 8a–c. The same was done to calculate the proportion and length of (TA)n repeats at annotated (TA)n sequences in the KM12 cell line using long-read sequencing data (Extended Data Fig. 8d–f).
Visualization of sequencing data.
The alignment output sam files were converted and sorted into bam files using samtools44 view function. For WGS paired-end data, the bam files are directly visualized using IGV45 from the Broad Institute. The following steps were carried out for single end sequencing experiments: The bamtobed function in bedtools package was used to convert the bam files to bed files. The genomecov function in bedtools package was used to convert the bedfiles into bedGraph. This file was converted to bigwig file using the UCSC tools package and visualized on the UCSC Genome Browser46.
Expansion detection by ExpansionHunter and exSTRa.
Expansions are identified for broken and non-broken (TA)n from the HCT116 and KM12 whole genome sequencing data by ExpansionHunter v.3.2.225,47. The supporting reads for expansions are visualized by GraphAlignmentViewer (https://github.com/Illumina/GraphAlignmentViewer). Empirical cumulative distribution function for the TA repeat located at hg19 coordinates chr8:106950919–106950985 was generated using exSTRa v.0.89.026 and Bio-STR-exSTRa v.1.1.0 using the default parameter settings.
Long-read sequencing data processing.
We aligned CLR reads to the hg19 reference sequence using minimap248 (with parameters -ayYL--MD--eqx -x map-pb) and called indel/structural variants with the pbsv tool using the -tandem-repeats argument for increased sensitivity to repeat expansion/contraction variants in accordance with the software’s documentation (Pacific Biosciences, pbsv https://github.com/PacificBiosciences/pbsv). We extracted indel variants passing built-in filters and overlapping with repetitive loci of interest using the bedtools closest utility42. We computed coverage over each interval using the mosdepth49 package and determined the repetitive motifs present using the tandem repeat finder (trf) tool50, lowering the score threshold to see all possible motifs (that is, with parameters 2 5 7 80 10 0 2000 −l 6 −ngs −h). We quantified the copy number of each motif in the reference haplotype and the alternate haplotype (computed by permuting the reference haplotype with the variants detected in each locus). We report the copy number change for the highest copy number motif per locus.
Cancer Cell Line Encyclopedia whole-genome sequencing analysis.
For 321 cancer cell lines from the Cancer Cell Line Encyclopedia (CCLE) 2 project51 that had whole-genome sequencing data, we determined the number of reads at each AT-rich interval using ‘samtools bedcov’44. For each interval, we then defined: fragments per base (FPB) = number of reads covering the interval/(length of the interval in bases × 2). We then normalized this value across all intervals within the genome as: fragments per base per million (FPBM) = (FPB/total FPB) × 1 million. This latter quantity (FPBM) was used to determine the read coverage at broken/non-broken loci. We determined overall read counts at loci for with high AT repeats.
MSI deletion analysis.
MSI deletions in UCEC, COAD, and STAD5 were identified from ICGC (https://dcc.icgc.org/releases/PCAWG/msi and https://dcc.icgc.org/releases/PCAWG/consensus_sv). In total, 396 deletions from 24 MSI samples and 4,501 deletions from 93 MSS samples were analysed. 1,000 random sets were generated using the bedtools42 shuffle command in order to estimate enrichments for different repeat annotations relative to random.
Statistical analysis
For Venn diagrams, 1,000 random sites were generated for one of the peak lists (while keeping others the same) using bedtools shuffle command. The significance was generated using the fisher.test function in R. For box plots, the statistical significance of the data represented was calculated using the wilcox.test function in R. No statistical methods were used to predetermine sample size. The experiments were not randomized and investigators were not blinded to allocation during experiments and outcome assessment.
Reporting summary
Further information on research design is available in the Nature Research Reporting Summary linked to this paper.
Data availability
END-seq, ChIP–seq, whole-genome sequencing and Pacbio CLR data have been deposited in the Gene Expression Omnibus (GEO) database under the accession number GSE149709. Source data are provided with this paper.
Extended Data
Extended Data Fig. 1 |. WRN depletion induces DNA damage in different MSI cell lines.
a, Western blot analysis of MLH1, MSH2, and GAPDH protein levels in HSECs after CRISPR–Cas9 knockout. sgLuc, control single-guide RNA (sgRNA) targeting luciferase; sgMLH1 and sgMSH2, sgRNAs targeting MLH1 and MSH2, respectively. For gel source data, see Supplementary Fig. 1. b, Relative viability 7 days after sgRNA transduction in HSECs. sgCh2.2 and sgCh2.4 denote negative controls targeting chromosome 2 intergenic sites; sgPolR2D denotes a pan-essential control. sgWRN2 and sgWRN3 denote experimental sgRNA targeting WRN. Data are mean and s.d. P values were determined using two-tailed Student’s t-test (n = 3). c, Example of flow cytometry gating strategy used in d and Extended Data Fig. 4c. d, Flow cytometry profiles for exponentially growing KM12-shWRN cells treated with DMSO (NT) or doxycycline (shWRN) for 72 h. EdU was added during the last 30 min before collecting cells. Percentage of cells in the gates is indicated. Data are representative of three independent experiments. e, Western blot analysis of WRN protein levels in KM12-shWRN and SW837-shWRN treated with DMSO or doxycycline for 72 h. Data are representative of three independent experiments. For gel source data, see Supplementary Fig. 1. f, Western blot analysis of WRN and pKAP1 protein levels in KM12-shWRN and KM12-shWRN. C911 (non-targeting shRNA) treated with DMSO or doxycycline for 72 h. Data are representative of three independent experiments. For gel source data, see Supplementary Fig. 1.
Extended Data Fig. 2 |. WRN depletion induces recurrent and overlapping DSBs in MSI cells.
a, Genome browser screenshot displaying END-seq profiles as normalized read density (RPM) for HCT116-shWRN and KM12-shWRN cells treated with DMSO (NT) or doxycycline (shWRN), or transfected with non-targeting siRNAs (siCTRL) or WRN siRNAs (siWRN) for 72 h. b, Scatterplots of END-seq peak intensity between biological replicates of KM12-shWRN and HCT116-shWRN cells treated with doxycycline for 72 h. Pearson correlation coefficients are indicated. c, Venn diagrams showing overlap between peaks detected in HCT116-shWRN and KM12-shWRN cells treated with either doxycycline (shWRN) or WRN siRNAs (siWRN) for 72 h. n = 1,000 random datasets were generated to test significance of overlap using one-sided Fisher’s Exact test for both the Venn diagrams (P < 2.2 × 10⁻¹⁶ for both comparisons). d, Quantification of END-seq peak intensity for KM12-shWRN and SW837-shWRN cells treated with doxycycline for 72 h. n = 5,424 peaks were examined for statistical significance using one-sided Wilcoxon rank sum test. Box plots are as in Fig. 2a, b. ***P <2.2 × 10⁻¹⁶. e, Venn diagram showing overlap between peaks identified from END-seq and RPA-bound ssDNA ChIP–seq for KM12-shWRN cells treated with doxycycline for 72 h. n = 1,000 random datasets were generated to test significance of overlap using one-sided Fisher’s exact test (P < 2.2 × 10⁻¹⁶). f, Composite plot of END-seq (black: positive-strand reads, grey: negative-strand reads) and RPA-bound ssDNA ChIP–seq (blue: positive-strand reads, red: negative-strand reads) signal around DSB sites in KM12-shWRN cells treated with doxycycline for 72 h. g, Heat map displaying intensity of END-seq signal in KM12-shWRN cells treated with doxycycline for 72 h, relative to the centre of the gap between positive- and negative-strand peaks. Sites are ordered by the size of the gap, from smallest to largest. h, Calculated size distribution from the reference genome of (TA)n repeats either located in gaps between positive and negative END-seq peaks (black, broken sites) or located elsewhere in the genome (grey, non-broken sites), determined from KM12-shWRN cells treated with doxycycline for 72 h.
Extended Data Fig. 3 |. WRN depletion induces DNA breakage in common fragile sites and palindromic TA-rich repeats in MSI cells.
a, Genome browser screenshot displaying END-seq profiles of common fragile sites FRA16D, FRA3B, FRA10B and FRA7I as normalized read density (RPM) for KM12-shWRN cells treated with DMSO (NT) or doxycycline (shWRN) for 72 h. The number of uninterrupted (TA)n repeat units in the hg19 reference genome at DSB sites is indicated. b, Genome browser screenshot displaying END-seq profiles of PATRRs on chromosomes 11 and 22 as normalized read density (RPM) for KM12-shWRN cells treated with DMSO (NT) or doxycycline (shWRN) for 72 h.
Extended Data Fig. 4 |. (TA)n repeat-forming repeats in MSI cell lines are substrates for MUS81–EME1.
a, Quantitative PCR with reverse transcription (qRT–PCR) analysis quantification (n = 1) of MUS81 and SLX4 mRNA levels in KM12-shWRN cells transfected with non-targeting siRNAs (siCTRL), MUS81 siRNAs (siMUS81), or SLX4 siRNAs (siSLX4). b, Representative images of metaphase spreads from KM12-shWRN cells treated with doxycycline (shWRN) and non-targeting siRNAs (siCTRL), MUS81 siRNAs (siMUS81), or SLX4 siRNAs (siSLX4) for 48 h. Data are representative of three independent experiments, n = 100 metaphases for each condition. c, Flow cytometric profiles for KAP1 phosphorylation in exponentially growing KM12-shWRN cells treated with doxycycline (shWRN), plus non-targeting siRNAs (siCTRL), MUS81 siRNAs (siMUS81), or SLX4 siRNAs (siSLX4) for 72 h. Data are representative of three independent experiments. d, Genome browser screenshot displaying END-seq profiles as normalized read density (RPM) for KM12-shWRN cells treated with doxycycline (shWRN), plus non-targeting siRNAs (siCTRL), MUS81 siRNAs (siMUS81), or SLX4 siRNAs (siSLX4) for 72 h. e, Schematic representation of DNA cruciform cleavage by MUS81–EME1 structure-specific endonuclease. f, Venn diagram displaying overlap of END-seq TA breaks between two biological replicates of DMSO-treated KM12-shWRN cells processed with purified recombinant MUS81–EME1 enzyme in situ (MUS81–EME1). n = 1,000 random datasets were generated to test significance of overlap using one-sided Fisher’s exact test (P < 2.2 × 10⁻¹⁶). g, Venn diagram showing overlap in TA breaks between KM12-shWRN cells treated with doxycycline (shWRN) for 72 h, and DMSO-treated cells processed with MUS81–EME1 enzyme in situ (MUS81–EME1). n = 1,000 random datasets were generated to test significance of overlap using one-sided Fisher’s exact test (P < 2.2 × 10⁻¹⁶). h, Venn diagram displaying overlap between TA breaks from KM12-shWRN and HCT116-shWRN genomic DNA processed in situ with MUS81–EME1 in situ (n = 1 for HCT116). n = 1,000 random datasets were generated to test significance of overlap using one-sided Fisher’s exact test (P < 2.2 × 10⁻¹⁶). i, Genome-wide aggregate analysis of END-seq signal around TA breaks from KM12-shWRN cells treated with doxycycline for 72 h (shWRN) (black denotes positive-strand reads, grey denotes negative-strand reads), or DMSO-treated KM12-shWRN cells processed with purified recombinant MUS81–EME1 enzyme in situ (blue denotes positive-strand reads, red denotes negative-strand reads). j, Genome browser screenshot displaying END-seq profiles for DMSO-treated KM12-shWRN cells (WRN proficient) processed in situ with either purified recombinant WRN, MUS81–EME1, or WRN followed by MUS81–EME1. For the latter, proteinase K digestion was performed between the two enzymatic treatments.
Extended Data Fig. 5 |. Structure-forming repeats in MSI cells activate ATR.
a, Genome browser screenshot displaying END-seq profiles for DMSO-treated KM12, HCT116, SW837 and RPE-1 cells containing an inducible shWRN cassette processed in situ with purified recombinant MUS81–EME1. Cells are indicated as MSI (red) or MSS (blue, n = 1). b, Quantification of END-seq peak intensity for libraries displayed in a. Box plots are as in Fig. 2a, b. c, Western blot analysis of WRN and pKAP1 levels in HCT116 cells expressing wild-type WRN, or ATR phosphorylation mutants WRN(3A) or WRN(6A). Endogenous WRN was depleted using an siRNA targeting the WRN 5′ UTR. Data are representative of three independent experiments. For gel source data, see Supplementary Fig. 1. d, Genome browser screenshot displaying END-seq profiles within FRA3B on chromosome 3 as normalized read density (RPM) for KM12-shWRN, HCT116-shWRN, RPE-1-shWRN, and eHAP-shWRN cells treated with doxycycline (shWRN) for 72 h or APH plus ATRi for 8 h. e, Venn diagrams displaying overlap of DSBs detected after WRN depletion or APH plus ATRi treatment in KM12 and HCT116 cells. n = 1,000 random datasets were generated to test significance of overlap using one-sided Fisher’s exact test for both the Venn diagrams (P < 2.2 × 10⁻¹⁶).
Extended Data Fig. 6 |. (TA)n repeat sequences are underrepresented in whole-genome sequencing data from MSI cells.
a, Bar plots indicating the percentage of recurrent mutations in different classes of repeats (left; mono, di, tri and tetra) and a bar plot (right) showing the number of various dinucleotide repeats in the 1,000 altered loci. The plots were based on sequencing analysis from24, which considered microsatellites smaller than 40 bp. b, Agarose gels showing PCR fragments (or lack thereof) of sites of different (TA)n repeats in one MSS and four MSI cell lines. Broken sites B1–B8 were chosen based on the presence of END-seq peaks after WRN depletion in KM12 cells. Sites NB1–NB3 were chosen with similar (TA)− repeat lengths as broken sites, but were not broken after WRN depletion in KM12 cells. Fragment sizes (in bp) are displayed. Data are representative of three independent experiments. For gel source data, see Supplementary Fig. 1. c, Genome browser screenshots of short read PCR-free whole genome sequencing reads, indicating coverage, in KM12 and HCT116 cell lines (n = 1). Shown are two regions containing (TA)n repeats, one that displays END-seq peaks after WRN depletion in KM12 (site B2), and one that does not (site NB3). Regions correspond to equivalent PCR sites in Fig. 4a and Extended Data Fig. 5b. d, Box plots displaying coverage at different classes of mono- and di-nucleotide repeats in PCR-free whole-genome sequencing libraries made from HCT116 cells. (TA)n repeats are split into those that overlap END-seq peaks after shWRN induction, and those that do not contain DSBs. Dotted red lines indicate the average coverage over the genome.
Extended Data Fig. 7 |. (TA)n repeats undergo large-scale expansions in MSI cells.
a, Cumulative fraction of expanded (TA)n repeats in KM12 and HCT116, based on ExpansionHunter analysis of PCR-free whole genome sequencing data. (TA)n repeats were split into broken (red) and non-broken (black) based on presence or absence of END-seq peaks after WRN depletion in KM12 cells. b, Graphical representation of a (TA)n repeat expansion in HCT116. This site has 33 (TA)n repeat units in the reference genome; ExpansionHunter identified an expansion to 86–87 repeat units based on PCR-free whole-genome sequencing of HCT116. c, Empirical cumulative distribution function based on the length by which each read overlaps the (TA)n repeat shown in b as identified by exSTRa. d, Southern blots for two different genomic regions containing non-broken (TA)n repeats corresponding to the same sites in Fig. 4a and Extended Data Fig. 6b. Red markers and dotted lines represent expected fragment sizes. For gel source data, see Supplementary Fig. 1. e, Southern blots for broken (TA)n repeat B2 (top) and non-broken (TA)n repeat NB3 (bottom) in MSS (blue) and MSI (red) cell lines, confirming expansion of broken (TA)n repeats in MSI cell lines. Red markers and dotted lines represent expected fragment sizes based on the reference genome. For gel source data, see Supplementary Fig. 1. f, Box plots displaying coverage at different classes of repeats in long-read sequencing libraries made from MSI (red) and MSS (blue) cells (n = 1). g, Motif analysis for sequence enrichment at broken (TA)n in the KM12 cell line from long-read sequencing data.
Extended Data Fig. 8 |. Large-scale expansions occur at long, uninterrupted (TA)n repeat sequences.
(a) Boxplot showing, in the hg19 reference genome, the proportion of (TA)n repeat units found within the full annotated sequence at broken or non-broken (TA)n repeats in KM12 cells. n = 5,400 (broken) and n = 59,729 (non-broken) sites were examined for statistical significance using one-sided Wilcoxon rank sum test. ***P < 2.2 × 10⁻¹⁶. b, Box plot showing, in the hg19 reference genome, the proportion of the longest run of uninterrupted (TA)n within the full annotated sequence at broken or non-broken (TA)n repeats in KM12 cells. n = 5,400 (broken) and n = 59,729 (non-broken) sites were examined for statistical significance using one-sided Wilcoxon rank sum test. ***P < 2.2 × 10⁻¹⁶. c, Box plot showing, in the hg19 reference genome, the length (bp) of the longest uninterrupted (TA)n dinucleotide repeats within the full annotated sequence at broken or non-broken (TA)n repeats in KM12 cells. n = 5,400 (broken) and n = 59,729 (non-broken) sites were examined for statistical significance using one-sided Wilcoxon rank sum test. ***P < 2.2 × 10⁻¹⁶. d, Box plot showing, in long read sequencing data, the proportion of (TA)n repeat units found within the full sequence at broken or non-broken (TA)n repeats in KM12 cells. n = 5,400 (broken) and n = 61,244 (non-broken) sites were examined for statistical significance using one-sided Wilcoxon rank sum test. ***P < 2.2 × 10⁻¹⁶. e, Box plot showing, in long-read sequencing data, the proportion of the longest run of uninterrupted (TA)n within the full sequence at broken or non-broken (TA)n repeats in KM12 cells. n = 5,400 (broken) and n = 61,244 (non-broken) sites were examined for statistical significance using one-sided Wilcoxon rank sum test. ***P < 2.2 × 10⁻¹⁶. f, Boxplot showing, in long-read sequencing data, the length (bp) of the longest uninterrupted (TA)n dinucleotide repeat within the full sequence at broken or non-broken (TA)n repeats in KM12 cells. n = 5,400 (broken) and n = 61,244 (non-broken) sites were examined for statistical significance using one-sided Wilcoxon rank sum test. ***P < 2.2 × 10⁻¹⁶. g, Multiple linear regression model predicting END-seq peak intensity of KM12-shWRN cells treated with doxycycline (shWRN) for 72 h derived from END-seq intensity of MUS81–EME1 cleavage in situ, replication timing, and expanded length of broken (TA)n. The Pearson correlation coefficient is indicated (see i). h, END-seq intensity of broken (TA)n repeats in KM12-shWRN cells treated with doxycycline for 72 h grouped by replication timing values from late replicating to early replicating. i, Multiple linear regression was performed to predict END-seq peak intensity of KM12-shWRN cells treated with doxycycline for 72 h based on following parameters: END-seq intensity of MUS81–EME1 cleavage in situ, replication timing, and expanded length of broken (TA)n. END-seq intensity upon shWRN induction and MUS81–EME1 cleavage were calculated using RPKM in ±1 kb window around broken (TA)n. Mean value was used for replication timing quantification. Expanded lengths were identified from long read sequencing data. Estimates of the standardized regression coefficients (β) are shown, along with t-statistics and P values based on the standardized coefficients. j, Model for MSI cell dependence on WRN. Large-scale expansions of (TA)n repeats are associated with MSI in MMR-deficient cells. When (TA)n reach above a critical length, they extrude into cruciform-like structures, which stall replication forks and activate ATR kinase, which in turn phosphorylates WRN and other substrates to complete DNA replication. In the absence of WRN, MUS81–EME1 or SLX4 cleaves secondary structures at (TA)n repeats, thereby shattering the chromosomes. All box plots are as in Fig. 2a, b.
Extended Data Fig. 9 |. Deletion breakpoints in MSI cancers are enriched at (TA)n repeats.
a, Genome browser screenshot of a broken (TA)n (defined from KM12), MSI deletion (derived from a patient sample), and END-seq profile (in WRN-depleted KM12 cells). The sequences around the breakpoints are shown in the inset. b, Junctions associated with six different MSI deletions from patients. Seq1 represents the sequence from −50 bp to left breakpoint and Seq2 represents the sequence from right breakpoint to +50 bp. c, Enrichment of simple repeats, broken and non-broken (TA)n, and long interspersed nuclear element (LINE), short interspersed nuclear element (SINE) and long terminal repeat (LTR) elements at patient deletion breakpoints relative to their overlap with random deletion breakpoints of the same size (enrichment value = 1). B(TA)n–B(TA)n represents cases in which both breakpoints overlap with broken (TA)n repeats; B(TA)n– represents cases in which only one breakpoint overlaps with a broken (TA)n repeat. B(TA)n, broken TA repeat; NB(TA)n, non-broken TA repeat.
Extended Data Fig. 10 |. DNA breaks within DCC gene body.
a, Genome browser screenshots within DCC gene displaying END-seq profiles as normalized read density (RPM) for KM12-shWRN cells treated DMSO (NT), doxycycline (shWRN) for 72 h, or MUS81–EME1 in situ. b, Zoom-in view of region including exons 6 and 7 of DCC gene, containing two (TA)n repeats displaying END-seq peaks. The highlighted sequences below were extracted from long read sequencing reads in KM12 cells. The (TA)n repeat in intron 7 is where Vogelstein and colleagues previously detected an insertion.
Supplementary Material
Acknowledgements
We thank R. Awasthi for assistance with Southern blotting; D. Goldstein, B. Tran and the CCR Genomics core for sequencing support; M. Lawrence for computational assistance; and F. Alt, B. Vogelstein and J. Haber for helpful discussions. Work in the S.C.W. laboratory is supported by the Francis Crick Institute (FC10212) and the European Research Council (ERC-ADG-666400). The Francis Crick Institute receives core funding from Cancer Research UK, the Medical Research Council, and the Wellcome Trust. K. Fugger is the recipient of fellowships from the Benzon Foundation and the Lundbeck Foundation. The P.J.M. laboratory is funded by the MRC MR/R009368/1; A.C.-M. is the recipient of a fellowship from AstraZeneca; E.M.C. is supported by the Damon Runyon Cancer Research Foundation, and E.M.C. and A.J.B. are supported by a pilot grant from the Dana-Farber Department of Medical Oncology. The A.N. laboratory is supported by the Intramural Research Program of the NIH, an Ellison Medical Foundation Senior Scholar in Aging Award (AG-SS-2633-11), the Department of Defense Idea Expansion (W81XWH-15-2-006) and Breakthrough (W81XWH-16-1-599) Awards, the Alex’s Lemonade Stand Foundation Award, and an NIH Intramural FLEX Award.
Footnotes
Competing interests A.J.B. has research support from Bayer, Merck and Novartis.
Additional information
Supplementary information is available for this paper at https://doi.org/10.1038/s41586-020-2769-8.
Peer review information Nature thanks Sergei Mirkin and the other anonymous reviewer(s) for their contribution to the peer review of this work.
Reprints and permissions information is available at http://www.nature.com/reprints.
Publisher’s note Springer Nature remains neutral with regard to jurisdictional claims in published maps and institutional affiliations.
© This is a U.S. government work and not under copyright protection in the U.S.; foreign copyright protection may apply 2020
References
- 1.Behan FM et al. Prioritization of cancer therapeutic targets using CRISPR–Cas9 screens. Nature 568, 511–516 (2019). [DOI] [PubMed] [Google Scholar]
- 2.Chan EM et al. WRN helicase is a synthetic lethal target in microsatellite unstable cancers. Nature 568, 551–556 (2019). [DOI] [PMC free article] [PubMed] [Google Scholar]
- 3.Kategaya L, Perumal SK, Hager JH & Belmont LD Werner syndrome helicase is required for the survival of cancer cells with microsatellite instability. iScience 13, 488–497 (2019). [DOI] [PMC free article] [PubMed] [Google Scholar]
- 4.Lieb S et al. Werner syndrome helicase is a selective vulnerability of microsatellite instability-high tumor cells. eLife 8, e43333 (2019). [DOI] [PMC free article] [PubMed] [Google Scholar]
- 5.Fujimoto A et al. Comprehensive analysis of indels in whole-genome microsatellite regions and microsatellite instability across 21 cancer types. Genome Res. (2020). [DOI] [PMC free article] [PubMed] [Google Scholar]
- 6.Dudley JC, Lin MT, Le DT & Eshleman JR Microsatellite instability as a biomarker for PD-1 blockade. Clin. Cancer Res 22, 813–820 (2016). [DOI] [PubMed] [Google Scholar]
- 7.Chu WK & Hickson ID RecQ helicases: multifunctional genome caretakers. Nat. Rev. Cancer 9, 644–654 (2009). [DOI] [PubMed] [Google Scholar]
- 8.Toledo LI et al. ATR prohibits replication catastrophe by preventing global exhaustion of RPA. Cell 155, 1088–1103 (2013). [DOI] [PubMed] [Google Scholar]
- 9.Canela A et al. DNA breaks and end resection measured genome-wide by end sequencing. Mol. Cell 63, 898–911 (2016). [DOI] [PMC free article] [PubMed] [Google Scholar]
- 10.Paiano J et al. ATM and PRDM9 regulate SPO11-bound recombination intermediates during meiosis. Nat. Commun 11, 857 (2020). [DOI] [PMC free article] [PubMed] [Google Scholar]
- 11.Khil PP, Smagulova F, Brick KM, Camerini-Otero RD & Petukhova GV Sensitive mapping of recombination hotspots using sequencing-based detection of ssDNA. Genome Res. 22, 957–965 (2012). [DOI] [PMC free article] [PubMed] [Google Scholar]
- 12.Tubbs A et al. Dual roles of Poly(dA:dT) tracts in replication initiation and fork collapse. Cell 174, 1127–1142 (2018). [DOI] [PMC free article] [PubMed] [Google Scholar]
- 13.Bowater R, Aboul-ela F & Lilley DM Large-scale stable opening of supercoiled DNA in response to temperature and supercoiling in (A + T)-rich regions that promote low-salt cruciform extrusion. Biochemistry 30, 11495–11506 (1991). [DOI] [PubMed] [Google Scholar]
- 14.Dayn A et al. Formation of (dA-dT)n cruciforms in Escherichia coli cells under different environmental conditions. J. Bacteriol 173, 2658–2664 (1991). [DOI] [PMC free article] [PubMed] [Google Scholar]
- 15.McClellan JA, Boublíková P, Palecek E & Lilley DM Superhelical torsion in cellular DNA responds directly to environmental and genetic factors. Proc. Natl Acad. Sci. USA 87, 8373–8377 (1990). [DOI] [PMC free article] [PubMed] [Google Scholar]
- 16.Zlotorynski E et al. Molecular basis for expression of common and rare fragile sites. Mol. Cell. Biol 23, 7143–7151 (2003). [DOI] [PMC free article] [PubMed] [Google Scholar]
- 17.Kaushal S et al. Sequence and nuclease requirements for breakage and healing of a structure-forming (AT)n sequence within fragile site FRA16D. Cell Rep. 27, 1151–1164 (2019). [DOI] [PMC free article] [PubMed] [Google Scholar]
- 18.Wang H et al. CtIP maintains stability at common fragile sites and inverted repeats by end resection-independent endonuclease activity. Mol. Cell 54, 1012–1021 (2014). [DOI] [PMC free article] [PubMed] [Google Scholar]
- 19.Shastri N et al. Genome-wide identification of structure-forming repeats as principal sites of fork collapse upon ATR inhibition. Mol. Cell 72, 222–238 (2018). [DOI] [PMC free article] [PubMed] [Google Scholar]
- 20.Inagaki H et al. Chromosomal instability mediated by non-B DNA: cruciform conformation and not DNA sequence is responsible for recurrent translocation in humans. Genome Res. 19, 191–198 (2009). [DOI] [PMC free article] [PubMed] [Google Scholar]
- 21.Minocherhomji S & Hickson ID Structure-specific endonucleases: guardians of fragile site stability. Trends Cell Biol. 24, 321–327 (2014). [DOI] [PubMed] [Google Scholar]
- 22.Wyatt HD, Laister RC, Martin SR, Arrowsmith CH & West SC The SMX DNA repair tri-nuclease. Mol. Cell 65, 848–860 (2017). [DOI] [PMC free article] [PubMed] [Google Scholar]
- 23.Ammazzalorso F, Pirzio LM, Bignami M, Franchitto A & Pichierri P ATR and ATM differently regulate WRN to prevent DSBs at stalled replication forks and promote replication fork recovery. EMBO J. 29, 3156–3169 (2010). [DOI] [PMC free article] [PubMed] [Google Scholar]
- 24.Cortes-Ciriano I, Lee S, Park WY, Kim TM & Park PJ A molecular portrait of microsatellite instability across multiple cancers. Nat. Commun 8, 15180 (2017). [DOI] [PMC free article] [PubMed] [Google Scholar]
- 25.Dolzhenko E et al. Detection of long repeat expansions from PCR-free whole-genome sequence data. Genome Res. 27, 1895–1903 (2017). [DOI] [PMC free article] [PubMed] [Google Scholar]
- 26.Tankard RM et al. Detecting expansions of tandem repeats in cohorts sequenced with short-read sequencing data. Am. J. Hum. Genet 103, 858–873 (2018). [DOI] [PMC free article] [PubMed] [Google Scholar]
- 27.Mitsuhashi S & Matsumoto N Long-read sequencing for rare human genetic diseases. J. Hum. Genet 65, 11–19 (2020). [DOI] [PubMed] [Google Scholar]
- 28.Khristich AN & Mirkin SM On the wrong DNA track: molecular mechanisms of repeat-mediated genome instability. J. Biol. Chem 295, 4134–4170 (2020). [DOI] [PMC free article] [PubMed] [Google Scholar]
- 29.Glover TW, Wilson TE & Arlt MF Fragile sites in cancer: more than meets the eye. Nat. Rev. Cancer 17, 489–501 (2017). [DOI] [PMC free article] [PubMed] [Google Scholar]
- 30.The Cancer Genome Atlas Network. Comprehensive molecular characterization of human colon and rectal cancer. Nature 487, 330–337 (2012). [DOI] [PMC free article] [PubMed] [Google Scholar]
- 31.The ICGC/TCGA Pan-Cancer Analysis of Whole Genomes Consortium. Pan-cancer analysis of whole genomes. Nature 578, 82–93 (2020). [DOI] [PMC free article] [PubMed] [Google Scholar]
- 32.Fearon ER et al. Identification of a chromosome 18q gene that is altered in colorectal cancers. Science 247, 49–56 (1990). [DOI] [PubMed] [Google Scholar]
- 33.Ding L & Chen F Predicting tumor response to PD-1 blockade. N. Engl. J. Med 381, 477–479 (2019). [DOI] [PubMed] [Google Scholar]
- 34.Mandal R et al. Genetic diversity of tumors with mismatch repair deficiency influences anti-PD-1 immunotherapy response. Science 364, 485–491 (2019). [DOI] [PMC free article] [PubMed] [Google Scholar]
- 35.Feng X et al. ATR inhibition potentiates ionizing radiation-induced interferon response via cytosolic nucleic acid-sensing pathways. EMBO J. 39, e104036 (2020). [DOI] [PMC free article] [PubMed] [Google Scholar]
- 36.Harding SM et al. Mitotic progression following DNA damage enables pattern recognition within micronuclei. Nature 548, 466–470 (2017). [DOI] [PMC free article] [PubMed] [Google Scholar]
- 37.Callen E et al. 53BP1 enforces distinct pre- and post-resection blocks on homologous recombination. Mol. Cell 77, 26–38 (2020). [DOI] [PMC free article] [PubMed] [Google Scholar]
- 38.Palermo V et al. CDK1 phosphorylates WRN at collapsed replication forks. Nat. Commun 7, 12880 (2016). [DOI] [PMC free article] [PubMed] [Google Scholar]
- 39.Chang JH, Kim JJ, Choi JM, Lee JH & Cho Y Crystal structure of the Mus81-Eme1 complex. Genes Dev. 22, 1093–1106 (2008). [DOI] [PMC free article] [PubMed] [Google Scholar]
- 40.Langmead B & Salzberg SL Fast gapped-read alignment with Bowtie 2. Nat. Methods 9, 357–359 (2012). [DOI] [PMC free article] [PubMed] [Google Scholar]
- 41.Zhang Y et al. Model-based analysis of ChIP-Seq (MACS). Genome Biol. 9, R137 (2008). [DOI] [PMC free article] [PubMed] [Google Scholar]
- 42.Quinlan AR & Hall IM BEDTools: a flexible suite of utilities for comparing genomic features. Bioinformatics 26, 841–842 (2010). [DOI] [PMC free article] [PubMed] [Google Scholar]
- 43.Bailey TL et al. MEME SUITE: tools for motif discovery and searching. Nucleic Acids Res. 37, W202–8 (2009). [DOI] [PMC free article] [PubMed] [Google Scholar]
- 44.Li H et al. The Sequence Alignment/Map format and SAMtools. Bioinformatics 25, 2078–2079 (2009). [DOI] [PMC free article] [PubMed] [Google Scholar]
- 45.Robinson JT et al. Integrative genomics viewer. Nat. Biotechnol 29, 24–26 (2011). [DOI] [PMC free article] [PubMed] [Google Scholar]
- 46.Kent WJ et al. The human genome browser at UCSC. Genome Res. 12, 996–1006 (2002). [DOI] [PMC free article] [PubMed] [Google Scholar]
- 47.Dolzhenko E et al. ExpansionHunter: a sequence-graph-based tool to analyze variation in short tandem repeat regions. Bioinformatics 35, 4754–4756 (2019). [DOI] [PMC free article] [PubMed] [Google Scholar]
- 48.Li H Minimap2: pairwise alignment for nucleotide sequences. Bioinformatics 34, 3094–3100 (2018). [DOI] [PMC free article] [PubMed] [Google Scholar]
- 49.Pedersen BS & Quinlan AR Mosdepth: quick coverage calculation for genomes and exomes. Bioinformatics 34, 867–868 (2018). [DOI] [PMC free article] [PubMed] [Google Scholar]
- 50.Benson G Tandem repeats finder: a program to analyze DNA sequences. Nucleic Acids Res. 27, 573–580 (1999). [DOI] [PMC free article] [PubMed] [Google Scholar]
- 51.Ghandi M et al. Next-generation characterization of the Cancer Cell Line Encyclopedia. Nature 569, 503–508 (2019). [DOI] [PMC free article] [PubMed] [Google Scholar]
Associated Data
This section collects any data citations, data availability statements, or supplementary materials included in this article.
Supplementary Materials
Data Availability Statement
END-seq, ChIP–seq, whole-genome sequencing and Pacbio CLR data have been deposited in the Gene Expression Omnibus (GEO) database under the accession number GSE149709. Source data are provided with this paper.


