Abstract
N6-methyladenine (6mA) is associated with important roles in DNA replication, DNA repair, transcription, regulation of gene expression. Several experimental methods were used to identify DNA modifications. However, these experimental methods are costly and time-consuming. To detect the 6mA and complement these shortcomings of experimental methods, we proposed a novel, deep leaning approach called BERT6mA. To compare the BERT6mA with other deep learning approaches, we used the benchmark datasets including 11 species. The BERT6mA presented the highest AUCs in eight species in independent tests. Furthermore, BERT6mA showed higher and comparable performance with the state-of-the-art models while the BERT6mA showed poor performances in a few species with a small sample size. To overcome this issue, pretraining and fine-tuning between two species were applied to the BERT6mA. The pretrained and fine-tuned models on specific species presented higher performances than other models even for the species with a small sample size. In addition to the prediction, we analyzed the attention weights generated by BERT6mA to reveal how the BERT6mA model extracts critical features responsible for the 6mA prediction. To facilitate biological sciences, the BERT6mA online web server and its source codes are freely accessible at https://github.com/kuratahiroyuki/BERT6mA.git, respectively.
Keywords: 6mA modification prediction, BERT, word2vec, GRU, LSTM, CNN
Introduction
N6-methyladenine (6mA) is one of the essential epigenetic modifications and involves important roles in DNA replication, DNA repair, transcription, regulation of gene expression [1–4]. For example, the newly synthesized strands and templates are distinguished with or without methylation in the DNA mismatch repair [5] and methylation works as a mark to discriminate self DNAs from incoming foreign DNAs in the restriction-modification system [6]. Furthermore, a previous study reported that 6mA is associated with several diseases such as cancer [7]. Therefore, the identification of 6mA is crucial for understanding epigenetic modification processes and revealing the epigenetic regulation related to the diseases.
High-throughput experimental methods, including the single-molecule real-time (SMRT) sequencing technology [8, 9], methyl-DNA immunoprecipitation and liquid chromatography-tandem mass spectrometry [7, 10, 11], have been used for identifying the DNA methylation sites. They provide an efficient way to detect DNA methylation at a single-nucleotide resolution. However, they cover only a portion of genomic DNA and have not detected 6mA sites across the whole genome, and some of them have problems with sequencing quality and signal-to-noise ratio [12]. In addition, experimental methods are costly and time-consuming. For this reason, it is valuable to develop computational prediction models to reduce the experimental cost and compensate for the shortcomings of experimental methods.
Several machine learning and deep learning-based models have been developed for the prediction of the DNA 6mA modification sites. Recently, Lv et al. have proposed the iDNA-MS that predicted 6mA sites for 11 species using the random forest (RF) model with the mono-nucleotide binary encoding (MNBE) and nucleotide chemical property and nucleotide frequency (NCPNF) encoding methods [12]. Such machine learning methods with composition-based and chemical property-based encoding methods were applied to the prediction of the modification sites of 4mC and 5mC [12–14].
On the other hand, the overall aforementioned methods still remain to be improved by using the latest deep learning. Hence, it is necessary to develop an effective DNA predictor that can learn the features buried between 6mAs and non-6mAs in multiple species, which can be successfully applied to identify characteristic patterns. In addition to these encoding methods, embedding techniques in natural language processing have been used. In particular, the word2vec is regarded as one of the best embedding methods [15] and utilized for various classification and predictions in bioinformatics classifications [16, 17].
Deep learning-based models realized robust and accurate predictions by capturing the features significantly related to 6mA from input sequences. Wahab et al. predicted 6mA sites in rice and Mus musculus by using a 1-dimensional convolutional neural network (1D-CNN) [18] and obtained the area under the ROC curve (AUC) of greater than 0.9 in both species. A long- and short-term memory (LSTM)-based [15] and gated recurrent units (GRU)-based model [19] presented stable performances by extracting information regarding the order of nucleotides with the memory mechanism. Recently, Li et al. [20] have introduced a combining model of CNN and LSTM that outperformed previous state-of-the-art models. In addition, Bidirectional Encoder Representations from Transformers (BERT) is one of the most powerful predictive models and it can achieve faster inference because BERT does not require the continuous recursive computations that are executed on recurrent neural network (RNN)-based models like LSTM and GRU. Devlin et al. first proposed a BERT model and trained their model on pretraining and fine-tuning to construct models with high generalization performance by using less data [21]. Zhang et al. used a BERT-based model and identified the 6mA sites in Escherichia coli and Homo sapiens [22] with high performances. Yu et al. have developed the iDNA-ABT that predicted 6mAs using BERT and adaptive embedding method [23] and compared it with previous models including SNNRice6mA [24] and DeepTorrent [25].
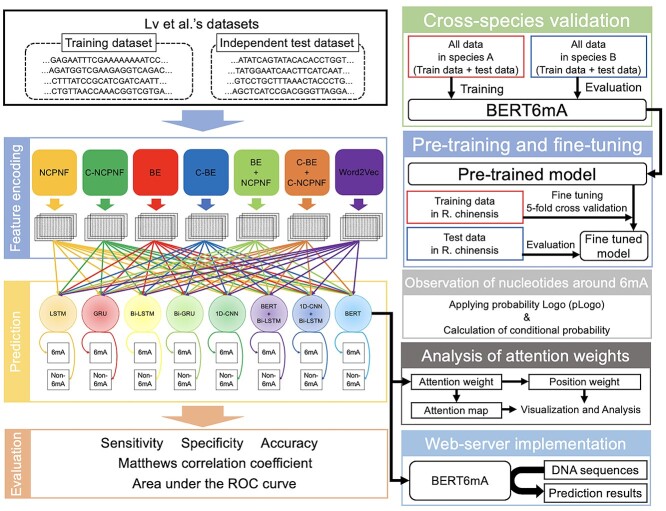
In this study, we proposed the BERT6mA (BERT with word2vec), a novel, deep leaning approach that identifies 6mA sites, as shown in Figure 1. We combined seven encoding methods including the DNA sequences composition [26, 27], nucleotide chemical property [28–30] and word2vec with eight deep learning models to compare the performance of Lv et al.’s iDNA-MS and Yu et al’s iDNA-ABT. In addition, we generated two novel encoding schemes of contextual- nucleotide chemical property and nucleotide frequency (C-NCPNF) and contextual-mono nucleotide binary encoding (C-MNBE). For many species, the BERT6mA outperformed the iDNA-MS, iDNA-ABT and other deep learning-based models, but performed poorly for the species with fewer 6mA data. To construct the BERT with fewer 6mA data, we employed the pretraining and fine-tuning methods. In addition to the prediction, we challenged the black box problem of deep learning. We analyzed the BERT-generated attention weights to identify some nucleotide distributions closely associated with 6mA modification. The BERT6mA is useful not only for predicting 6mA but also for revealing mechanisms by which BERT6mA discriminates 6mA and non-6mA. To the best of our knowledge, this is the first-time study that employs multiple deep learning algorithms for constructing a learning framework in 6mA prediction, which is potentially useful for assisting DNA epigenetics research.
Figure 1.
The overall flow of analysis in the present study. Our workflow was composed of feature encoding, deep learning-based prediction, evaluation, cross-species validation, pretraining and fine-tuning, observation of nucleotides around 6mA, analysis of attention weights and web-server implementation.
Materials and methods
Datasets
To compare the performance of deep learning with that of machine learning in multiple species with different data sizes, the benchmark datasets were taken from the recently published article of iDNA-MS [12]. The datasets of the 6mA site were obtained from several published references and databases including the MethSMRT database, MDR database, GEO database and NCBI Genome database [7, 31–34]. They contain 6mA and non-6mA data in 11 species including Arabidopsis thaliana (31 873 6mAs and non-6mAs), Caenorhabditis elegans (7961 6mAs and non-6mAs), Casuarina equisetifpolia (6066 6mAs and non-6mAs), Drosophila melanogaster (11 191 6mAs and non-6mAs), Fragaria vesca (3102 6mAs and non-6mAs), H. sapiens (18 335 6mAs and non-6mAs), Rosa chinensis (599 6mAs and non-6mAs), Saccharomyces cerevisiae (3786 6mAs and non-6mAs), Thermus thermophilus (107 600 6mAs and non-6mAs), Ts. SUP5–1 (3379 6mAs and non-6mAs) and Xoc. BLS256 (17 215 6mAs and non-6mAs). The 6mA samples of the employed 11 species were measured at a single-nucleotide resolution mainly by the SMRT. The length of sequence windows was set to 41 bp, which showed the highest performance in the previous study of 6mA prediction [26]. The methylated adenine is located at the center in 6mA samples, while that in non-6mA samples is not confirmed to be methylated by experiments. The datasets in each species were divided into training and independent test data at a ratio of 1:1. The curated datasets can be downloaded from the web application developed by Lv et al. [12].
Feature encoding methods
Feature encoding is associated with the performance of prediction models [35]. We transformed the DNA sequences into feature matrixes by five single encoding methods (NCPNF, MNBE, C-NCPNF, C-MNBE and word2vec) and two combined encoding methods.
Nucleotide chemical property and nucleotide frequency
NCPNF feature matrixes are generated by chemical properties and density of each nucleotide [12]. The chemical properties of the ith nucleotide in a DNA sequence are represented by a combination of three different features  ,
,  ,
,  and
and  are related to ring structure, hydrogen bonds and chemical functionality, respectively. In terms of the ring structure, nucleotides are grouped into purines and pyrimidines. In terms of hydrogen bonds, they are classified according to whether they form strong or weak hydrogen bonds. In terms of chemical functionality, they are divided into amino and keto groups. According to the above classification, each feature is represented by:
 |
(1) |
where chemical feature vectors of A, T, G and C correspond to (1,1,1), (0,1,0), (1,0,0) and (0,0,1), respectively. The density of the ith nucleotide is calculated by:
 |
(2) |
 |
where  ,
,  and
and  are the length of the DNA sequence, the length of the ith prefix string in the sequence and the concerned nucleotide, respectively. A feature vector of the ith nucleotide is generated by arranging chemical properties and density as follows:
 |
(3) |
Finally, the feature vectors in a DNA sequence are concatenated and each DNA sequence is represented by a 41 × 4 matrix.
Mono-nucleotide binary encoding
MNBE encodes the exact nucleotide position of a given sequence as a binary vector as follows:
 |
(4) |
The vectors of each nucleotide in a DNA sequence are concatenated and each DNA sequence is represented by a 41 × 4 matrix.
Contextual-NCPNF and contextual-MNBE
Furthermore, we generated two novel encoding methods of C-NCPNF and C-MNBE to predict 6mAs. As shown in Figure S1, available online at http://bib.oxfordjournals.org/, we arranged the vectors of consecutive k nucleotides of the NCPNF and MNBE-based feature matrixes in line and concatenated them to create the contextual NCPNF- and MNBE-based feature matrixes. Thus, each vector in the matrix includes information of consecutive multiple nucleotides. In this study, since k is set to 25, the sequence window was represented by a 17 × 100 matrix.
Word2vec
Word2vec is one of the powerful embedding methods in the field of natural language processing [36]. It encodes diverse linguistic regularities and patterns into distributed representations by learning word context [37]. There are two methods for learning the context of words: the Continuous Bag-of-Words Model (CBOW) and the Continuous Skip-Gram Model (Skip-Gram). In the learning process, CBOW predicts the current word based on the context, while Skip-Gram predicts the context from the current word. We used the Skip-Gram because Skip-Gram showed much better performance than CBOW [36].
In the encoding of DNA sequences using word2vec, the consecutive 4-mers were regarded as words, as shown in Figure S2 available online at http://bib.oxfordjournals.org/. The word2vec model was trained on the training data of all species to produce 100-dimensional vectors per each 4-mer. Feature matrixes were generated by concatenating them, thus each nucleotide sequence window is represented by a 38 × 100 matrix.
Deep learning models
Eight deep learning models including LSTM [38], bidirectional-LSTM (Bi-LSTM) [39], GRU [40], bidirectional-GRU (Bi-GRU), BERT [21], 1D-CNN, BERT with Bi-LSTM, and 1D-CNN with Bi-LSTM were constructed. We used pytorch of the python package to build the deep learning models. Each deep learning architecture is described below. All the parameters regarding the network structure are summarized in Table S1 available online at http://bib.oxfordjournals.org/.
LSTM and Bi-LSTM
RNN is useful for predictions of data with interdependencies among features, such as time-series data. However, RNN cannot learn long-term dependencies due to gradient disappearance and explosion. LSTM introduces gate structures and memory cells to solve this problem. The advantage of LSTM contributed to various classification and predictions. Bi-LSTM expands the LSTM units in two directions. As shown in Figure S3, available online at http://bib.oxfordjournals.org/, the feature vectors involving a nucleotide or multiple nucleotides were inputted to LSTM units at each step. The output vector from the LSTM unit at the final step is applied to a fully connected layer to generate a final output. In the Bi-LSTM, the outputs from LSTM units at the final step in the forward and reverse directions are concatenated and the final output was generated by applying the concatenated vector to a fully connected layer (Figure S4 available online at http://bib.oxfordjournals.org/). To obtain a value between 0 and 1 as the final output, the sigmoid function is used as an activation function at the fully connected layer. In the present study, the hidden size of the LSTM unit is set to 128.
GRU and Bi-GRU
LSTM overcomes the shortcomings of RNN to enable learning of long-term dependencies. On the other hand, LSTM has the problem of increasing computational cost. GRU is able to learn long-term dependencies with lower computational costs and fewer parameters than LSTM by using two gates. In several studies, the GRU-based model has shown higher performance than the LSTM-based model in some previous studies [41, 42]. Bi-GRU propagates the information in the forward and reverse directions in the same manner as Bi-LSTM. The GRU-based networks are constructed by substituting GRU units for the LSTM units in the LSTM-based network (Figures S3 and S4 available online at http://bib.oxfordjournals.org/). In the present study, the hidden size of the GRU unit is set to 128 in the same manner as LSTM.
Bidirectional encoder representations from transformers
BERT has received much attention in recent years because of its state-of-the-art technology applicable to a wide range of tasks in various fields. It consists of multiple encoder layers of Transformers, developed by Vaswani et al. in 2017 [43], and learns not only unidirectional dependencies but also bidirectional dependencies. The encoder part includes multihead attention and a feed-forward network. As shown in Figure S5, available online at http://bib.oxfordjournals.org/, the feature matrixes are inputted into BERT. The outputs from the BERT network are concatenated and transferred to a fully connected layer with a sigmoid function to produce the final output. As in the previous study [22], the number of layers, the number of attention heads and the hidden size are set to 3, 4 and 100, respectively.
One-dimensional convolutional neural network
CNNs are mainly composed of two types of layers: convolutional and pooling layers. In the convolutional layer, significant features necessary for prediction are extracted by the use of filters. The pooling layer provides robust prediction against pattern modification and suppresses overfitting by compressing information. We use the CNN model developed by Wahab et al. [18]. This CNN is composed of two convolutional layers and two max pooling layers (Figure S6 available online at http://bib.oxfordjournals.org/). The outputs from each convolutional layer with the ReLU function are sent to the max pooling layer. The outputs from each max pooling layer are applied to the dropout layers with a probability of 0.4. The output from the second max pooling layer is flattened and sent to the fully connected layer to generate the final output. A sigmoid function is used as the activation function. In the same manner as Wahab et al., the number of filters, filter size and stride of the filters in the convolutional layer are set to 32, 5 and 1, respectively, and the pool-size and stride of max pooling layers are 2 and 2, respectively.
Hybrid models
We constructed the hybrid models including the BERT with Bi-LSTM (Figure S7 available online at http://bib.oxfordjournals.org/) and the 1D-CNN with Bi-LSTM (Figure S8 available online at http://bib.oxfordjournals.org/). In both the hybrid models, the feature matrixes were firstly processed by BERT and 1D-CNN, respectively. Then the intermediate vectors from the third encoder layers in the BERT and the second max pooling layer in the 1D-CNN are inputted into the Bi-LSTM unit at each step, respectively. The outputs from forward and reverse LSTM units at the final step are concatenated, and the combined output is applied to a fully connected layer with a sigmoid function to produce the final output.
The hybrid model of BERT with Bi-LSTM was proposed in the previous studies for the prediction of bitter peptides [44]. To compare the BERT with Bi-LSTM to the BERT and the Bi-LSTM, the parameters, including the number of layers, attention heads and hidden size, of the BERT with Bi-LSTM are set to the same values as those of BERT and Bi-LSTM. The parameters of the 1D-CNN with Bi-LSTM are set to the same values as those of 1D-CNN and Bi-LSTM.
Training of deep learning models
We evaluated the predictive performances of the deep learning approaches in the same way as Lv et al. [12]. Five-fold cross-validation was applied to the training dataset, and the trained models were tested by independent test. In the 5-fold cross-validation, training data were divided into five subsets. Then, four subsets were used for training models; the remaining one was used for validation. The optimization was performed by the Adam optimizer with a learning rate of  . Mini-batch size was set to 128 and the losses were calculated by a binary cross-entropy loss function. To prevent overlearning, the training process was terminated when the minimum loss in the validation data was not updated for consecutive 20 epochs. All the parameters of the training are summarized in Table S1 available online at http://bib.oxfordjournals.org/.
Cross-species validation
To validate whether a species-specific trained model is effective in predicting 6mA sites of other species, cross-species validation was carried in the same manner as Lv et al.’s research [12]. The BERT6mA model that was trained on the whole data of one species was tested by the whole data of other species.
Pretraining and fine-tuning
In general, it is hard to train deep learning models with fewer data. To overcome this problem, pretraining and fine-tuning were carried. In detail, the BERT with wrod2vec models were trained on the whole data of species other than the target species as the pretrained models. The pretrained models were fine-tuned by 5-fold cross-validation on the training data of the target species. The fine-tuned model was evaluated on the test data of the target species. The trained models in the section of ‘Cross-species validation’ were used as pretrained models.
Evaluation
We evaluate the predictive model performances by five statistical measures: sensitivity, specificity, accuracy, Matthews correlation coefficient (MCC) and AUC. The measures other than the AUC are given by:
 |
(5) |
 |
(6) |
 |
(7) |
 |
(8) |
where TP, FP, TN and FN are true positive, false positive, true negative and false negative, respectively. The threshold to determine whether 6mA or non-6mA was set to 0.5. AUC is the area beneath the ROC curve. To calculate these measures, we used the scikit-learn of the python package.
Preferred nucleotide distribution patterns
The pLogo (probability logo) [45, 46] is generally employed to examine the distribution patterns of nucleotides and to present the appearance frequency or preference of specific nucleotides. In the pLogo, the height of each nucleotide indicates the statistical significance of its appearance frequency or preference, which is determined by the binomial test (Bonferroni corrected P-value < 0.01) using the negative samples as the background sequences.
To investigate co-occurring nucleotides in positive samples, the conditional probability of nucleotide pairs is given by:
 |
(9) |
 |
 is the number of positive samples in which nucleotide
  appears at position
  ,
,  is the number of positive samples in which two nucleotides
  and
and  simultaneously appear at positions
  and
and  , and
, and  is the number of positive samples.
Attention weight of BERT6mA
BERT consists of multiple bidirectional Transformer encoders that have a core mechanism called multihead attention [21, 43]. In the self-attention that constitutes the multihead attention, the word2vec-generated feature vector  at the ith k-mer position is transformed into query, key and value vectors
  ,
,  and
and  by linear functions
  ,
,  and
and  , respectively. Then, attention weight
  is computed as the softmax-normalized dot products of
  and
and  :
:
 |
(10) |
where  correspond to the dimension of
  . Output of self-attention
  is given as the weighted sum of the value:
 |
(11) |
where n is the number of the feature vectors in the feature matrix. To obtain the multihead attention, the outputs of multiple attentions, called ‘heads’, are calculated in parallel, concatenated and linearly transformed with  as follow:
 |
(12) |
where h is the total number of heads. Studies of natural language processing use the attention weight to explain the prediction and explore the critical features [47].
In this study, we analyzed the attention weights that were generated in the independent test of the five cross-validation models. In each sample, the attention weights of all layers and heads were averaged at each position. We referred to the averaged attention as attention maps (Figure S9 available online at http://bib.oxfordjournals.org/). Then, the attention maps of all samples were averaged at each position. To characterize the attentions, the deviation between the value at each position in the attention maps and the mean value overall positions in the attention maps was calculated at each position. Furthermore, to identify the critical k-mer position responsible for the prediction of 6mA, the position weights were defined as the averaged attention maps over the query direction at each key position (Figure S10 available online at http://bib.oxfordjournals.org/). Since the word2vec encodes nucleotide sequence per consecutive 4-mer, 41 nucleotide sites are transformed into 38 positions.
Effect size
To investigate the effect size, i.e. the difference in the position weights between the preferred nucleotides-including samples and the not-including ones, we calculated the effect size (Cohen’s d) at each position [48], given by:
 |
(13) |
 |
 and
and  are the numbers of the preferred nucleotides-including and not-including samples, respectively,
  and
and  are the means of the position weights at position
  over the preferred nucleotides-including and not-including samples, respectively;
  and
and  are the standard deviations of the position weights at position
  , respectively.
Results and discussion
Comparison of deep learning and machine learning approaches
To compare the deep learning-based prediction with the machine learning-based prediction, we used datasets provided by Lv et al. [12]. We predicted whether the adenine in the center of the sequence was methylated. We used 7 encoding methods of word2vec, NCPNF, C-NCPNF, MNBE, C-MNBE, combination of NCPNF and MNBE, and combination of C-NCPNF and C-MNBE and eight deep learning models of LSTM, GRU, Bi-LSTM, Bi-GRU, BERT, 1D-CNN, BERT with Bi-LSTM and 1D-CNN with Bi-LSTM. In the two combined encoding methods, we concatenated their feature vectors at each position. Totally, 56 (=7 × 8) deep learning models were generated in this study. After the DNA sequences were transformed into feature matrixes by using encoding methods, the deep learning models were trained and validated by 5-fold cross-validation on the training data. The prediction performances of the trained five models were averaged in the independent test. Out of 56, we plotted the AUCs of the top five deep learning models and the state-of-the-art models in the independent test in Figure 2. The prediction performances of all the employed deep learning methods were described in Tables S2–S12 available online at http://bib.oxfordjournals.org/.
Figure 2.
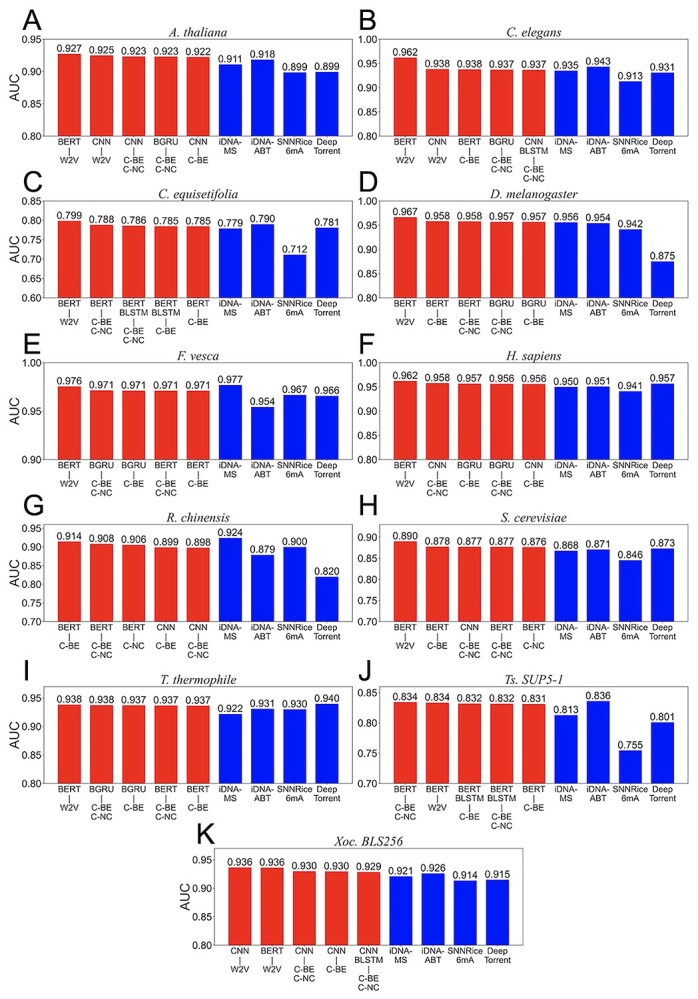
Performance comparison of deep learning and machine learning approaches in the independent test. The bar plots show AUCs of five deep learning-based methods with higher area under the curves (red bar) and previous models (blue bar) for 11 species including Arabidopsis thaliana (A), Caenorhabditis elegans (B), Casuarina equisetifpolia (C), Drosophila melanogaster (D), Fragaria vesca (E), Homo sapiens (F), Rosa chinensis (G), Saccharomyces cerevisiae (H), T. thermophile (I), Ts. SUP5–1 (J) and Xoc. BLS256 (K). W2V, C-BE, C-NC, BE, NC, BE+NC and C-BE+C-NC correspond to word2vec, contextual-binary encoding, contextual-NCPNF, binary encoding, NCPNF, combination of binary encoding and NCPNF, and combination of contextual-binary encoding and contextual-NCPNF, respectively. BERT, LSTM, GRU, BLSTM, BGRU, CNN, BERT+BLSTM, CNN+BLSTM correspond to BERT, LSTM, GRU, Bi-LSTM, Bi-GRU, 1D-CNN, BERT with Bi-LSTM and 1D-CNN with Bi-LSTM. The performances of the previous models were provided from Table S3, available online at http://bib.oxfordjournals.org/, of Lv et al.’s paper (iDNA-MS) and Table S2, available online at http://bib.oxfordjournals.org/, of Yu et al.’s paper (iDNA-ABT).
Among our proposed deep learning models, the BERT models presented higher performances for most of the species. Specifically, BERT with the word2vec method, named BERT6mA, showed the highest AUCs for eight species other than R. chinensis, Ts. SUP5-1 and Xoc. BLS256. It means that the BERT more effectively learns the word2vec-represented DNA context patterns than any other deep learning method. Second to BERT, 1D-CNNs and Bi-GRU presented higher performances for several species such as A. thaliana, C. elegans and H. sapiens. The Bi-GRU and GRU models showed higher performances than the Bi-LSTM and LSTM models for many species. The hybrid deep learning models of 1D-CNN with Bi-LSTM and BERT with Bi-LSTM did not outperform the single models of BERT and CNN under many conditions. These hybrid models may be too complex to predict the 6mA sites, and multiple hyperparameters such as the number of layers and dimension of hidden vectors may remain to be adjusted.
The BERT6mA presented higher AUCs than the previous models for the species other than F. vesca, R. chinensis, T. thermophile and Ts. SUP5-1 (Figure 2). Importantly, our BERT6mA outperformed the BERT-based iDNA-ABT for the species other than R. chinensis and Ts. SUP5-1, suggesting the effectiveness of the word2vec-employing BERT model. On the other hand, BERT6mA showed comparable and a little low performance to the iDNA-MS (Lv et al.’s RF models) for F. vesca and for R. chinensis, respectively. We considered that the low performance was due to the small number of data in R. chinensis.
Finally, to verify a sequence window length of 41, we investigated how a different length affected the prediction performance (AUC). The length of the window containing adenine in the center was varied as 41, 31 and 21. Significant differences in performance were hardly observed with respect to the lengths (Table S13 available online at http://bib.oxfordjournals.org/).
Comparison of encoding methods
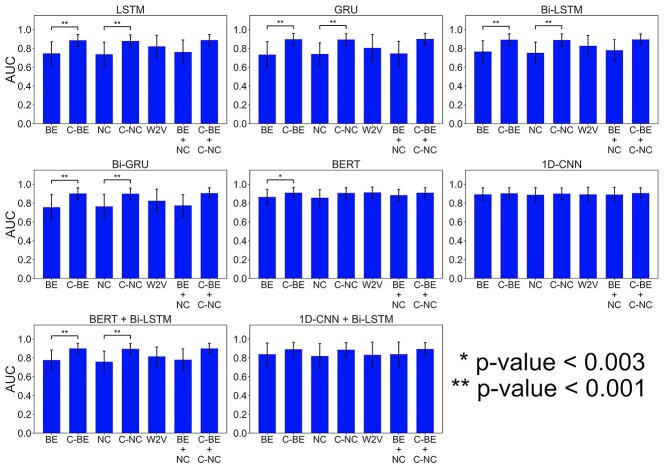
To characterize the encoding methods, AUCs of the 11 species by the independent test were averaged for different deep learning models. As Figure 3 and Table S14, available online at http://bib.oxfordjournals.org/, C-MNBE and C-NCPNF obtained higher AUCs than MNBE and NCPNF, respectively. It is probably because C-MNBE and C-NCPNF encode the information that involves multiple nucleotides, while MNBE and NCPNF encode only one nucleotide information. In particular, the AUCs of C-MNBE and C-NCPNF were significantly higher than those of MNBE and NCPNF in the RNN-based models (GRU, Bi-GRU, LSTM and Bi-LSTM) (one-sided, paired-sample t-test; P-value<0.003 or P-value<0.001). The contextual encoding methods (C-MNBE and C-NCPNF) increased the prediction performance more than non-contextual ones (MNBE and NCPNF) in the RNN-based models, indicating that it is effective to consider the contextual nucleotide patterns. Interestingly, 1D-CNN and BERT showed high prediction performance even when using the non-contextual encoding methods. It suggests that 1D-CNN is able to learn the consecutive nucleotide patterns by filters and BERT is able to well learn the contextual information or dependencies between nucleotides compared to the RNN-based models. In many deep learning models, the combination methods of NCPNF and BE and of C-NCPNF and C-BE showed higher performance than the single encoding methods.
Figure 3.
Performance comparison of different encoding methods. For deep learning models with different encoding methods, the area under the curves (AUCs) in the independent tests were averaged over all species and their variances were calculated. W2V, C-BE, C-NC, BE, NC, BE+NC and C-BE+C-NC correspond to word2vec, contextual-binary encoding, contextual-NCPNF, binary encoding, NCPNF, combination of binary encoding and NCPNF and combination of contextual-binary encoding and contextual-NCPNF, respectively. One-sided, paired-sample t-tests were conducted to compare the AUCs between MNBE and C-MNBE and the AUCs between NCPNF and C-NCPNF.
The word2vec presented very high performance when using BERT and 1D-CNN. We considered that BERT and 1D-CNN captured the dependencies and patterns of the word2vec-represented contextual information, respectively. These results suggest that the effectiveness of the encoding method depends on the architecture of deep learning.
Comparison of state-of-the-art models
Recently, deep learning-based models such as Deep6mA and 6mA-Pred have presented state-of-the-art performances. Deep6mA extracts the sequence features by CNN with Bi-LSTM to learn the dependence information among nucleotides. It outperformed SNNRice6mA [24] and MM-6mAPred [49]. 6mA-Pred extracted the related features to 6mAs by LSTM, and captured the sequence differences between 6mAs and non-6mAs by attention mechanisms. It presented better performances than SNNRice6mA [24] and iDNA6mA-rice [50]. To characterize the performances of BERT6mA, we compared BERT6mA with Deep6mA and 6mA-Pred by using Lv et al.’s datasets. These deep learning models were trained on 5-fold cross-validation on the training dataset and tested on the independent dataset. The source codes of Deep6mA and 6mA-Pred were used with the default parameter values.
As shown in Figure 4, BERT6mA showed high performance compared to the Deep6mA and 6mA-Pred in C. equisetifolia, F. vesca, S. cerevisiae and Ts. SUP5-1. In the other species, BERT6mA presented comparable performances. Although 6mA-Pred showed high performances for T. thermophile, it indicated low performance for other species. BERT6mA realized the robust prediction with respect to different species and data sizes due to the two mechanisms. One is that the 4-mer word2vec method-encoded feature matrixes include the contextual information related to 6mA, because the word2vec embeds the regularities of 4-mer amino acids as single words. The other is that BERT6mA considers the dependencies among all the 4-mer words in the sequence context.
Figure 4.
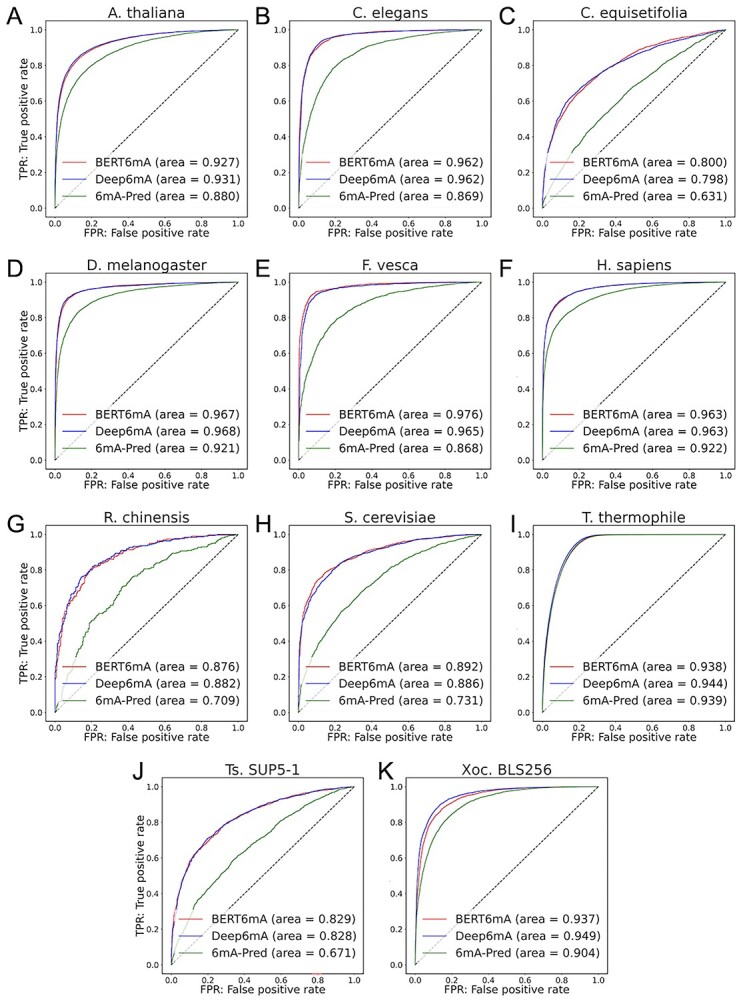
Comparison of BERT6mA with Deep6mA and 6mA-Pred. The ROC curves were generated in the independent test for 11 species including Arabidopsis thaliana (A), Caenorhabditis elegans (B), Casuarina equisetifpolia (C), Drosophila melanogaster (D), Fragaria vesca (E), Homo sapiens (F), Rosa chinensis (G), Saccharomyces cerevisiae (H), T. thermophile (I), Ts. SUP5–1 (J) and Xoc. BLS256 (K). The models that presented the highest area under the curve in the 5-fold cross-validation were used.
Cross-species validation
To investigate which species pairs share 6mA-specific features or sequence similarity, cross-species validation was carried out. As shown in Figure 5, the three plant species of A. thaliana, R. chinensis and F. vesca and the two animal species of H. sapiens and D. melanogaster presented higher AUCs, suggesting that they have similar nucleotides distribution patterns. On the other hand, the AUCs in T. thermophile, C. elegans and Xoc. BLS256 were low, suggesting that the nucleotides distributions are significantly different among these species. The variations in AUCs would be caused by the difference in the species because the 6mA data of the employed species were measured mainly by SMRT. These results were consistent with those of the machine learning-based cross-species validation presented by Lv et al. [12]. It was interesting that some plants and animals share very similar nucleotide patterns around 6mA.
Figure 5.
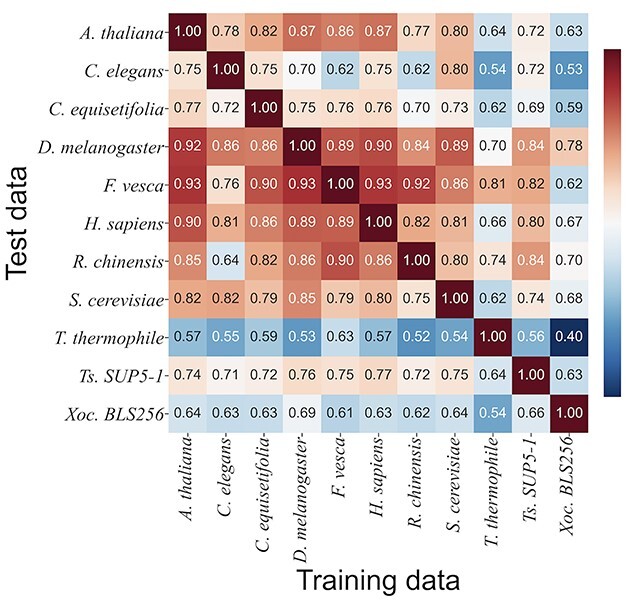
Area under the curve (AUC) performances of cross-species validation. The BERT model with word2vec that was trained on the whole data of one species was evaluated on the whole data of another species.
Construction of BERT6mA via pretraining and fine-tuning
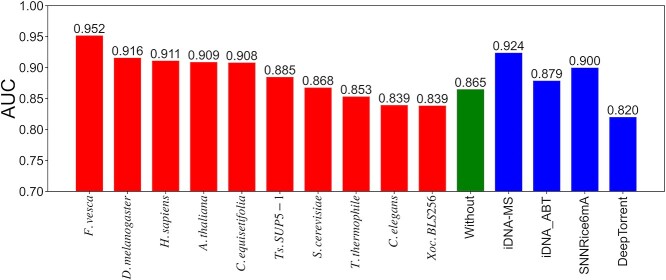
As far as R. chinensis is concerned, the BERT6mA showed low performances compared to Lv et al.’s machine learning models [12], probably due to insufficient data of it. To improve the prediction performance, pretraining and fine-tuning were employed. The pretrained model on each species was fine-tuned by 5-fold cross-validation using the training data of R. chinensis. The fine-tuned model was evaluated on the test data of R. chinensis. The AUC values in the independent test were improved by the pretraining on the data of F. vesca, D. melanogaster, H. sapiens, A. thaliana, C. equisetifpolia, Ts. SUP5-1 and S. cerevisiae. Specifically, the pretraining on F. vesca greatly improved the prediction performance of the fine-tuned model in the independent test (Figure 6 and Table S15 available online at http://bib.oxfordjournals.org/). The AUC of the pretrained model was higher than that of the non-pretrained models and the previous models. The pretraining and fine-tuning were very effective in increasing the prediction performance.
Figure 6.
Improvement of performances in Rosa chinensis via pretraining and fine-tuning in the independent test. The BERT6mA models were pretrained by the whole dataset of species other than R. chinensis. The pretrained model was fine-tuned on training data of R. chinensis by 5-fold cross-validation. The fine-tuned models were evaluated on the test data of R. chinensis. The bars show the area under the curve (AUCs) of pretrained models (red), the non-pretrained model (green) and previous models (blue).
Nucleotide preference analysis
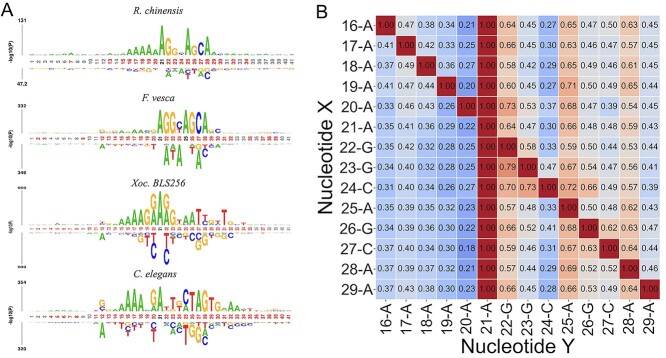
The pLogo [45, 46] was applied to the positive samples of four species including R. chinensis, F. vesca, Xoc. BLS256 and C. elegans to visualize and examine the preference pattern of nucleotides around 6mA. As shown in Figure 7A, the nucleotide distributions of R. chinensis and F. vesca were similar around the 6mA, while they were different from those of Xoc. BLS256 and C. elegans. It suggested that high AUCs of R. chinensis and F. vesca in cross-species validation resulted from similar nucleotide patterns around 6mA. Conversely, the low AUCs between R. chinensis and C. elegans, between F. vesca and C. elegans, between R. chinensis and Xoc. BLS256, and between F. vesca and Xoc. BLS256 in the cross-species validation could be caused by the different patterns. Through the same mechanism, the R. chinensis fine-tuned, pretrained model on F. vesca provided higher performance than the R. chinensis fine-tuned, pretrained models on C. elegans and on Xoc. BLS256. From these results, pretraining on the other species that have similar nucleotide patterns around 6mA is critically important for enhanced prediction performance.
Figure 7.
Nucleotide distribution around 6mA. (A) To identify key nucleotides around 6mA, the pLogo was applied to the positive data of Rosa chinensis (top), Fragaria vesca (second row), Xoc. BLS256 (third row) and Caenorhabditis elegans (bottom). The red-marked and black-mark positions indicate significantly critical positions with a Bonferroni corrected P-value < 0.01 and the positions that provide an appearance frequency of the specific nucleotide with >75%. (B) In the R. chinensis 6mA sequence, the conditional probabilities of nucleotide pairs (X and Y) were displayed. The presented nucleotide pairs more frequently appeared in the positive samples than the negative ones. The numbers and letters at the axes present the position and nucleotide, respectively.
As shown in Figure 7B, in R. chinensis, the conditional probability of G at site 22 was high. In addition, the conditional probabilities of A at sites 25 and 28 were high with respect to any nucleotides appearing around 6mA, suggesting that these As are critically responsible for 6mA. The conditional probabilities of G at position 26 and C at position 27 were high, suggesting that the two nucleotides co-occur. Multiple As were observed at sites from 16 to 20 in the pLogo (Figure 7A), while the conditional probabilities of them were not so high. Multiple As would appear in a relatively broad range from 16 to 20 rather than at specific sites.
Analysis of attention and position weights
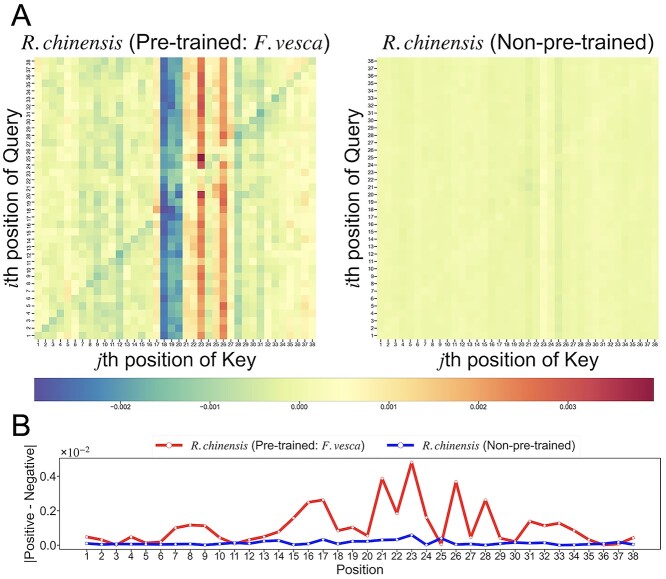
To identify the nucleotide distributions that the BERT6mA focuses on, we visualized the attention maps in the independent test of the five trained models via 5-fold cross-validation. Figure 8A shows the averaged attention map of the R. chinensis-fine-tuned, F. vesca-pretrained model and the R. chinensis-trained model without any pretraining. Note that the position is defined as the word2vec-transformed nucleotide site. One position includes information of 4-mer sites of nucleotide sequences because the consecutive 4-mer amino acids are encoded as single words. For example, position i has the information of sites from i to i + 3. The averaged attentions in the pretrained model presented high or low values at some specific positions of the key over the query (Figure 8A). The values at the specific positions were well weighted, which were observed more clearly in the pretrained model than in the non-pretrained model. This result suggests that the pretrained model pays attention to critical features at specific positions, enhancing prediction performances.
Figure 8.
Visualization of the deviation in attention maps and the differences in the averaged position weights between positive and negative samples. (A) Heatmap of the deviation in the averaged attention maps. The attention weight at position (i, j) was the softmax-normalized dot product of the ith positional vectors of the query and the jth positional vectors of the Key. The averaged attentions were calculated in the independent tests of the Rosa chinensis-fine-tuned, Fragaria vesca-pretrained model (left) and the R. chinensis-trained model without any pretraining (right). The horizontal bar indicates the deviations of the averaged attention map. (B) The differences in the averaged position weights between the positive and negative samples were calculated for both the models: the R. chinensis-fine-tuned, F. vesca-pretrained model (red line) and the R. chinensis-trained model without any pretraining (blue line).
To further identify which key positions generate different attention weights between 6mA and non-6mA, we analyzed the difference in the position weights between the positive and negative samples at each position, as shown in Figure 8B. The pretrained model provided higher peaks than the non-pretrained model. In the pretrained model, the differences in the position weights were larger at the positions where statistically significant nucleotides appeared in pLogo. It suggested the BERT6mA pays attention to discriminable nucleotide positions between the positive and negative samples.
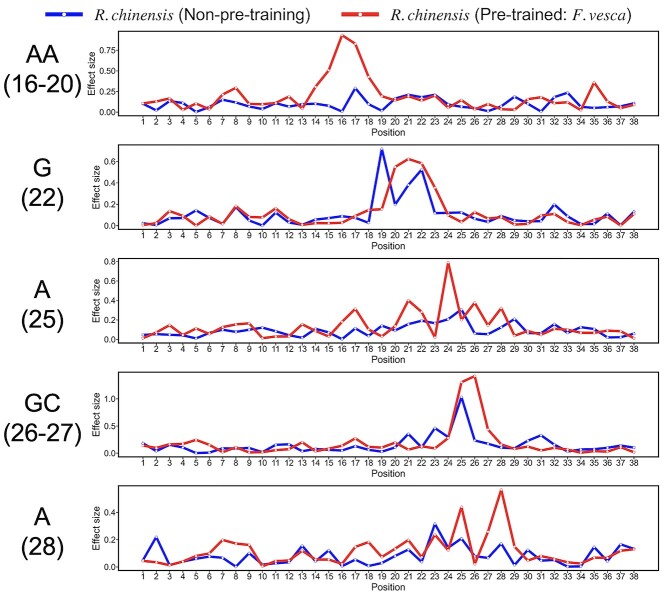
In the pretrained model, the effect sizes of position weights between the AA-including and AA not-including samples at positions from 16 to 20, between the G including and not-including samples at site 22, between the A including and not-including samples at position 25, between the GC including and not-including samples at positions of 26 and 27, and between the A including and not-including samples at position 28 were observed to have peaks (Figure 9), suggesting that the position weights reflect the presence of the 6mA-associated nucleotides. Furthermore, these peaks in the pretrained model were larger than in the non-pretrained model, respectively. It suggested that the pretrained BERT6mA model uses the attention weights to focus on the nucleotide preference sites responsible for the 6mA prediction as seen in pLogo (Figure 7A).
Figure 9.
Effect sizes of the position weights in the pretrained and non-pretrained models. To investigate the effect size, i.e. the difference in the position weights between the preferred nucleotides-including samples and the not-including ones, we calculated the effect size (Cohen’s d) at each position in both the models: the Rosa chinensis-fine-tuned, Fragaria vesca-pretrained model (red line) and the R. chinensis-trained model without any pretraining (blue line).
These results imply that BERT6mA generates the attention weights to understand which nucleotides are paid attention to. They contribute to extracting key sequence patterns around 6mAs and to solving the black box problem inherent in deep learning. The attention weights-presented DNA patterns or motifs are very useful for biologists to find some relationships between DNA patterns and their associated biological functions.
Webserver construction
To facilitate the community, we build a web server application of the BERT6mA by using apache (2.4.18) and flask (1.1.2). The users can access the server from http://kurata35.bio.kyutech.ac.jp/6mA-prediction and are necessary to input or upload the 41 bp long DNA sequences with adenine located in the center in the FASTA format. In addition to predictive labels and scores, the attention weights are presented. For other overviews, refer to the help of the website.
Conclusions
We constructed 56 deep learning models by combining 7 encoding methods with 8 deep learning models for 6mA site predictions of 11 species. Among these deep learning models, the BERT6mA presented the highest performance in the eight species in an independent test. On the other hand, for the species with the small sample sizes, BERT6mA did not outperform the machine learning models. To solve this problem, we successfully applied the pretraining and fine-tuning method to the BERT6mA. Note that it is not effective when the sample sequences used by fine-tuning show low similarity to those used by the pretraining. It is important to select the datasets of the two species that share sequence similarities around 6mAs. Finally, the BERT6mA showed higher or comparable performances to state-of-the-art deep learning models. In addition to the prediction, BERT6mA analyzed the attention weights to suggest key nucleotide patterns necessary for 6mA sites.
Key points
The BERT model with a word2vec encoding method, named BERT6mA, is created to predict N6-methyladenine (6mA) sites.
BERT6mA outperforms the state-of-the-art models for some species.
BERT6mA presents very high performances for even species with a small data size by using pretraining and fine-tuning approaches.
The attention weights are analyzed to reveal which sequence patterns are significantly responsible for 6mA site prediction.
Supplementary Material
Sho Tsukiyama is a student of Department of Interdisciplinary Informatics in the Kyushu Institute of Technology, Japan. His main research interests include deep learning and computational biology.
Md Mehedi Hasan received his PhD degree in bioinformatics from CAU, Beijing in 2016. He is currently a JSPS international PD fellow in the Kyushu Institute of Technology, Japan. Before his current position, he worked as a researcher at Chinese University of Hong Kong, Hong Kong. His main research interests include protein structure prediction, machine learning, data mining, computational biology and functional genomics.
Hong-Wen Deng is a professor of medicine in the Division of Biomedical Informatics and Genomics at the Tulane University. His main research interests include biostatistics and bioinformatics methodology research, big data, genomics, transcriptomics, epigenomics, proteomics, genetic epidemiology, complex traits and diseases (especially osteoporosis, sarcopenia and obesity), system biology, endocrinology, bone biology and recently, metabolomics and metagenomics.
Hiroyuki Kurata is a professor of Department of Bioscience and Bioinformatics in the Kyushu Institute of Technology, Japan. His research interests primarily focus on systems biology, synthetics biology, functional genomics, machine learning and their applications.
Contributor Information
Sho Tsukiyama, Department of Bioscience and Bioinformatics, Kyushu Institute of Technology, 680-4 Kawazu, Iizuka, Fukuoka 820-8502, Japan.
Md Mehedi Hasan, Tulane Center for Biomedical Informatics and Genomics, Division of Biomedical Informatics and Genomics, John W. Deming Department of Medicine, School of Medicine, Tulane University, New Orleans, LA 70112, USA.
Hong-Wen Deng, Tulane Center for Biomedical Informatics and Genomics, Division of Biomedical Informatics and Genomics, John W. Deming Department of Medicine, School of Medicine, Tulane University, New Orleans, LA 70112, USA.
Hiroyuki Kurata, Department of Bioscience and Bioinformatics, Kyushu Institute of Technology, 680-4 Kawazu, Iizuka, Fukuoka 820-8502, Japan.
Funding
Grant-in-Aid for Scientific Research (B) (19H04208); and the Grant-in-Aid for JSPS Research Fellow (19F19377); from Japan Society for the Promotion of Science (JSPS). NIH grant project of U19AG05537301 and R01AR069055 (to M.M.H. and H.W.D.).
References
- 1. Fu Y, He C. Nucleic acid modifications with epigenetic significance. Curr Opin Chem Biol 2012;16:516–24. [DOI] [PMC free article] [PubMed] [Google Scholar]
- 2. Campbell JL, Kleckner NE. Coli oriC and the dnaA gene promoter are sequestered from dam methyltransferase following the passage of the chromosomal replication fork. Cell 1990;62:967–79. [DOI] [PubMed] [Google Scholar]
- 3. Robbins-Manke JL, Zdraveski ZZ, Marinus M, et al. Analysis of global gene expression and double-strand-break formation in DNA adenine methyltransferase- and mismatch repair-deficient Escherichia coli. J Bacteriol 2005;187:7027–37. [DOI] [PMC free article] [PubMed] [Google Scholar]
- 4. Pukkila PJ, Peterson J, Herman G, et al. Effects of high levels of DNA adenine methylation on methyl-directed mismatch repair in Escherichia coli. Genetics 1983;104:571–82. [DOI] [PMC free article] [PubMed] [Google Scholar]
- 5. Wion D, Casadesús J. N6-methyl-adenine: an epigenetic signal for DNA-protein interactions. Nat Rev Microbiol 2006;4:183–92. [DOI] [PMC free article] [PubMed] [Google Scholar]
- 6. Vasu K, Nagaraja V. Diverse functions of restriction-modification systems in addition to cellular defense. Microbiol Mol Biol Rev 2013;77:53–72. [DOI] [PMC free article] [PubMed] [Google Scholar]
- 7. Xiao C-L, Zhu S, He M, et al. N6-Methyladenine DNA modification in the human genome. Mol Cell 2018;71:306–318.e307. [DOI] [PubMed] [Google Scholar]
- 8. Flusberg BA, Webster DR, Lee JH, et al. Direct detection of DNA methylation during single-molecule, real-time sequencing. Nat Methods 2010;7:461–5. [DOI] [PMC free article] [PubMed] [Google Scholar]
- 9. Eid J, Fehr A, Gray J, et al. Real-time DNA sequencing from single polymerase molecules. Science 2009;323:133–8. [DOI] [PubMed] [Google Scholar]
- 10. Yao B, Cheng Y, Wang Z, et al. DNA N6-methyladenine is dynamically regulated in the mouse brain following environmental stress. Nat Commun 2017;8:1122. [DOI] [PMC free article] [PubMed] [Google Scholar]
- 11. Boulias K, Greer EL. Detection of DNA methylation in genomic DNA by UHPLC-MS/MS, methods in molecular biology. Clifton, NJ 2021;2198:79–90. [DOI] [PMC free article] [PubMed] [Google Scholar]
- 12. Lv H, Dao FY, Zhang D, et al. iDNA-MS: an integrated computational tool for detecting DNA modification sites in multiple genomes. iScience 2020;23:100991. [DOI] [PMC free article] [PubMed] [Google Scholar]
- 13. Manavalan B, Basith S, Shin TH, et al. Meta-4mCpred: a sequence-based meta-predictor for accurate DNA 4mC site prediction using effective feature representation. Mol Ther Nucleic Acids 2019;16:733–44. [DOI] [PMC free article] [PubMed] [Google Scholar]
- 14. Manavalan B, Basith S, Shin TH, et al. 4mCpred-EL: an ensemble learning framework for identification of DNA N4-methylcytosine sites in the mouse genome. Cell 2019;8:1332. [DOI] [PMC free article] [PubMed] [Google Scholar]
- 15. Huang Q, Zhou W, Guo F, et al. 6mA-Pred: identifying DNA N6-methyladenine sites based on deep learning. PeerJ 2021;9:e10813–3. [DOI] [PMC free article] [PubMed] [Google Scholar]
- 16. Wu C, Gao R, Zhang Y, et al. PTPD: predicting therapeutic peptides by deep learning and word2vec. BMC Bioinformatics 2019;20:456. [DOI] [PMC free article] [PubMed] [Google Scholar]
- 17. Hamid MN, Friedberg I. Identifying antimicrobial peptides using word embedding with deep recurrent neural networks. Bioinformatics 2019;35:2009–16. [DOI] [PMC free article] [PubMed] [Google Scholar]
- 18. Wahab A, Ali SD, Tayara H, et al. iIM-CNN: intelligent identifier of 6mA sites on different species by using convolution neural network. IEEE Access 2019;7:178577–83. [Google Scholar]
- 19. Liu W, Li H. SICD6mA: identifying 6mA sites using deep memory network. bioRxiv 2002; 2020.2002.2002.930776. [Google Scholar]
- 20. Li Z, Jiang H, Kong L, et al. Deep6mA: a deep learning framework for exploring similar patterns in DNA N6-methyladenine sites across different species. PLoS Comput Biol 2021;17:e1008767. [DOI] [PMC free article] [PubMed] [Google Scholar]
- 21. Devlin J, Chang M-W, Lee K et al. BERT: pre-training of deep bidirectional transformers for language understanding. arXiv preprint arXiv:1810.04805. 2018.
- 22. Zhang Y-Z, Hatakeyama S, Yamaguchi K, et al. On the application of BERT models for nanopore methylation detection. bioRxiv 2021; 2021.2002.2008.430070. [Google Scholar]
- 23. Yu Y, He W, Jin J, et al. iDNA-ABT: advanced deep learning model for detecting DNA methylation with adaptive features and transductive information maximization. Bioinformatics 2021;37:4603–10. [DOI] [PubMed] [Google Scholar]
- 24. Yu H, Dai Z. SNNRice6mA: a deep learning method for predicting DNA N6-methyladenine sites in Rice genome. Front Genet 2019;10:1071–1. [DOI] [PMC free article] [PubMed] [Google Scholar]
- 25. Liu Q, Chen J, Wang Y, et al. DeepTorrent: a deep learning-based approach for predicting DNA N4-methylcytosine sites. Brief Bioinform 2021;22:bbaa124. [DOI] [PMC free article] [PubMed] [Google Scholar]
- 26. Hasan MM, Basith S, Khatun MS, et al. Meta-i6mA: an interspecies predictor for identifying DNA N6-methyladenine sites of plant genomes by exploiting informative features in an integrative machine-learning framework. Brief Bioinform 2020;22:bbaa202. [DOI] [PubMed] [Google Scholar]
- 27. Hasan MM, Manavalan B, Shoombuatong W, et al. i6mA-fuse: improved and robust prediction of DNA 6mA sites in the Rosaceae genome by fusing multiple feature representation. Plant Mol Biol 2020;103:225–34. [DOI] [PubMed] [Google Scholar]
- 28. Basith S, Manavalan B, Shin TH, et al. SDM6A: a web-based integrative machine-learning framework for predicting 6mA sites in the Rice genome. Mol Ther Nucleic Acids 2019;18:131–41. [DOI] [PMC free article] [PubMed] [Google Scholar]
- 29. Feng P, Yang H, Ding H, et al. iDNA6mA-PseKNC: identifying DNA N6-methyladenosine sites by incorporating nucleotide physicochemical properties into PseKNC. Genomics 2019;111:96–102. [DOI] [PubMed] [Google Scholar]
- 30. Huang Q, Zhang J, Wei L, et al. 6mA-RicePred: a method for identifying DNA N (6)-methyladenine sites in the Rice genome based on feature fusion. Front Plant Sci 2020;11:4–4. [DOI] [PMC free article] [PubMed] [Google Scholar]
- 31. Ye G, Zhang H, Chen B, et al. De novo genome assembly of the stress tolerant forest species Casuarina equisetifolia provides insight into secondary growth. Plant J 2019;97:779–94. [DOI] [PubMed] [Google Scholar]
- 32. Ye P, Luan Y, Chen K, et al. MethSMRT: an integrative database for DNA N6-methyladenine and N4-methylcytosine generated by single-molecular real-time sequencing. Nucleic Acids Res 2017;45:D85–9. [DOI] [PMC free article] [PubMed] [Google Scholar]
- 33. Liu Z-Y, Xing J-F, Chen W, et al. MDR: an integrative DNA N6-methyladenine and N4-methylcytosine modification database for Rosaceae. Horticulture Res 2019;6:78. [DOI] [PMC free article] [PubMed] [Google Scholar]
- 34. Wang Y, Chen X, Sheng Y, et al. N6-adenine DNA methylation is associated with the linker DNA of H2A.Z-containing well-positioned nucleosomes in pol II-transcribed genes in Tetrahymena. Nucleic Acids Res 2017;45:11594–606. [DOI] [PMC free article] [PubMed] [Google Scholar]
- 35. Yang H, Lv H, Ding H, et al. iRNA-2OM: a sequence-based predictor for identifying 2'-O-methylation sites in Homo sapiens. J Comput Biol 2018;25:1266–77. [DOI] [PubMed] [Google Scholar]
- 36. Mikolov T, Chen K, Corrado G, et al. Efficient estimation of word representations in vector space. arXiv preprint arXiv:13013781. 2013.
- 37. Mikolov T, Sutskever I, Chen K, et al. Distributed representations of words and phrases and their compositionality. arXiv preprint arXiv:13104546. 2013.
- 38. Hochreiter S, Schmidhuber J. Long short-term memory. Neural Comput 1997;9:1735–80. [DOI] [PubMed] [Google Scholar]
- 39. Graves A, Schmidhuber J. Framewise phoneme classification with bidirectional LSTM and other neural network architectures. Neural Netw 2005;18:602–10. [DOI] [PubMed] [Google Scholar]
- 40. Chung J, Gulcehre C, Cho K, et al. Empirical evaluation of gated recurrent neural networks on sequence Modeling. arXiv preprint arXiv:14123555. 2014.
- 41. Lynn HM, Pan SB, Kim P. A deep bidirectional GRU network model for biometric electrocardiogram classification based on recurrent neural networks. IEEE Access 2019;7:145395–405. [Google Scholar]
- 42. Jagannatha AN, Yu H. Bidirectional RNN for medical event detection in electronic health records, In: Proceedings of the conference. Association for Computational Linguistics. North American Chapter. Meeting 2016;2016:473–82. [DOI] [PMC free article] [PubMed] [Google Scholar]
- 43. Vaswani A, Shazeer N, Parmar N, et al. Attention is all you need. arXiv preprint arXiv:170603762. 2017.
- 44. Charoenkwan P, Nantasenamat C, Hasan MM, et al. BERT4Bitter: a bidirectional encoder representations from transformers (BERT)-based model for improving the prediction of bitter peptides. Bioinformatics 2021;37:2556–62. [DOI] [PubMed] [Google Scholar]
- 45. O'Shea JP, Chou MF, Quader SA, et al. pLogo: a probabilistic approach to visualizing sequence motifs. Nat Methods 2013;10:1211–2. [DOI] [PubMed] [Google Scholar]
- 46. Wu X, Bartel DP. kpLogo: positional k-mer analysis reveals hidden specificity in biological sequences. Nucleic Acids Res 2017;45:W534–8. [DOI] [PMC free article] [PubMed] [Google Scholar]
- 47. Clark K, Khandelwal U, Levy O, et al. What does BERT look at? An analysis of BERT's attention. arXiv preprint arXiv:1906.04341. 2019.
- 48. Cohen J. In: Hillsdale NJ (ed). Statistical Power Analysis for the Behavioral Sciences. Hillsdale, N.J.: L. Erlbaum Associates, 1988. [Google Scholar]
- 49. Pian C, Zhang G, Li F, et al. MM-6mAPred: identifying DNA N6-methyladenine sites based on Markov model. Bioinformatics 2019;36:388–92. [DOI] [PubMed] [Google Scholar]
- 50. Lv H, Dao F-Y, Guan Z-X, et al. iDNA6mA-Rice: a computational tool for detecting N6-methyladenine sites in Rice. Front Genet 2019;10:793–3. [DOI] [PMC free article] [PubMed] [Google Scholar]
Associated Data
This section collects any data citations, data availability statements, or supplementary materials included in this article.


