

Summary
Background:
Childhood obesity remains a prevalent public health concern. Executive control, a set of higher-order cognitive abilities for directing attention and behaviour, has been identified as a malleable factor potentially related to weight outcomes in youth. However, the directionality of this relationship remains unclear.
Objectives:
This study examined reciprocal associations between three executive control components—inhibitory control, working memory and flexible shifting—and BMI (body mass index) percentile during childhood.
Methods:
At four points throughout elementary school, a community sample (N = 294) completed executive control tasks and had their height and weight objectively measured. Controlling for sex and socioeconomic risk status, random intercept cross-lagged panel models were tested.
Results:
Better inhibitory control performance predicted lower subsequent BMI at each timepoint, and better working memory and flexible shifting performance in grade three both predicted lower subsequent BMI in grade 4. However, BMI did not predict subsequent executive control performance at any timepoint.
Conclusions:
Executive control abilities, including automatic response modulation, being able to hold and manipulate mental information, and being able to make flexible mental transitions, may be protective against weight problems, particularly in middle childhood when these abilities have had more time to mature and children begin to gain more independence.
Keywords: children, executive control, inhibitory control, longitudinal, obesity, weight
1 |. INTRODUCTION
Recent estimates have suggested that between one-fifth and one-third of American children and adolescents meet criteria for being overweight or obese.1,2 By adulthood, this proportion reaches two-thirds.3 To promote novel interventions, there is a need to investigate malleable factors that may contribute to obesity, such as executive control (also known as executive function). Defined as cognitive processes responsible for directing attention and other behaviours, executive control is comprised of three separate but related components: inhibitory control, or the capacity to regulate and/or redirect automatic responses; working memory, or the ability to hold and manipulate information in one’s immediate consciousness; and finally, flexible shifting, or the ability to transition easily between different mental tasks.4 Importantly, executive control is considered a modifiable construct5 with links to chronic disease risk6 and health behaviours, including weight problems.7 With few exceptions, however, research on executive control and obesity favours adult samples and rarely examines the directionality of this association, which has important implications for refining intervention targets. As such, the aim of the current study was to investigate reciprocal associations between executive control and BMI (body mass index) percentile during childhood.
An emerging literature points to an association between executive control and health outcomes among children, including psychopathology,8 sleep9 and obesity.10 Drawing on these findings, one recent conceptual model11 has argued that early executive control abilities may be important for current and future health outcomes via attentional, behavioural and emotional control. In the case of obesity, inhibitory control may be required to redirect focus and/or inhibit behavioural responses away from sugary and energy-dense food cues. Less intuitive but still relevant, working memory may be needed to keep track of dietary goals or to simply remember what one has already eaten in a given day, while flexible shifting may be useful for adapting to ever-changing environmental demands that require children to eat healthily while also juggling school and extracurricular activities. The dual-process model of obesity, which posits that eating behaviour arises from both automatic and reflective processes,12 aligns well with these mechanisms: inhibitory control abilities may contribute to the ability to override automatic impulses to eat highly palatable food, while flexible shifting and working memory may facilitate conscious reflection about eating behaviours.
In support of these theories, impairments in executive control have been noted in both children and adolescents with obesity.10,13 For example, cross-sectional and longitudinal studies involving performance-based cognitive tasks have shown that relative to healthy weight peers, children and adolescents who were overweight exhibited worse inhibitory control,14,15 cognitive flexibility,15,16 planning abilities17 and working memory.17,18 Relatedly, similar patterns have emerged with regard to eating behaviours, although differences in measures of executive control across studies make it difficult to draw firm conclusions, and the relatively small number of longitudinal studies with dietary measures precludes conclusions regarding directionality.19 Nonetheless, findings regarding both weight status and eating behaviours lend support to the hypothesis that the ability to regulate attention and behaviour towards diet-related goals in part requires strong cognitive oversight.
Executive control development begins in infancy but continues into adulthood, which has critical implications for leveraging cognitive abilities as a tool for obesity intervention. Starting as a unitary construct in preschool,4,20 specific abilities become more differentiated over time21 and continuously improve throughout preschool, childhood and adolescence.22 These maturation processes are likely mediated by parallel functional changes that characterize normative brain development, including the shift from more local recruitment of neural networks to increased specialization of connections between prefrontal regions and emotion/reward centres in support of greater cognitive efficiency.23 This extended developmental trajectory portends pockets of promise and vulnerability with regard to children’s health. Early neuroplasticity may provide opportunities to improve executive control abilities and protect against adverse health outcomes and behaviours. Conversely, impairments in executive control that emerge early on may continue into late childhood and adolescence, setting the stage for the formation of obesogenic habits and health consequences.
Importantly, the relationship between cognitive abilities and obesity is not necessarily unidirectional. Just as executive control deficits may contribute to unhealthy weight, obesity could likewise undermine the development of executive control abilities. Consistent with this hypothesis, diets high in saturated fats and refined carbohydrates have been associated with impaired cognitive functioning,24 and losing weight has improved certain cognitive abilities (e.g., selective and short-term attention and short-term verbal memory) in adolescents.25 The mechanisms for this direction of the relationship (i.e., obesity contributing to executive control abilities) are less understood, but neural pathways are likely at play. For example, inflammation associated with obesity may affect brain functioning and, by extension, cognitive abilities,26 and obesity has been related to decreases in prefrontal cortex volume among adolescents18 and children.27 The latter study also found that decreased cortical thickness in prefrontal regions partially mediated the association between higher BMI and lower performance on executive control tasks in a large sample of children aged 9 to 11 years. Combined with ample evidence for reductions in executive control performance among youth with obesity, executive control abilities and obesity could interact in a cyclical way: ongoing cognitive impairments across development may promote obesity risk, which may in turn further compromise cognitive abilities in a cycle with cascading health implications.
A significant limitation of research examining executive control and obesity among youth is the preponderance of cross-sectional studies, which preclude questions regarding the temporal order of this relationship.13 Rare exceptions include one study showing that worse executive control performance measured in preschool significantly predicted clinical weight problems (BMI-for-age percentile ≥85) by elementary school.28 Another long-term study found that higher levels of self-control (measured via teacher-report) in kindergarten were protective against increases in BMI in sixth through eighth grade and predicted lower odds of obesity in first through eighth grade.29 However, longitudinal studies examining the reverse association (i.e., weight status predicting executive control) are exceptionally rare. The only study to our knowledge to investigate bidirectional paths between these constructs during childhood found initial support for a reciprocal relationship between flexible shifting and BMI in a large sample of youth aged 6 to 11 years, but the path from BMI to flexible shifting became nonsignificant after accounting for socioeconomic status.30 In addition, only two timepoints spanning a one-year period were available, and age variability at each assessment precluded conclusions regarding possible sensitive periods in which associations in either direction may have been relatively weaker or more robust. Another recent investigation with a large sample of mid-life adults has found that higher waist-to-hip ratios predicted declines in episodic memory 9 years later, whereas lower scores on a latent factor with measures of working memory and flexible shifting predicted higher waist-to-hip ratios.31 These results hint at a domain-specific bidirectional relationship between cognitive abilities and obesity during adulthood. However, further research with simultaneous measures of executive control and weight at multiple timepoints during childhood is necessary to solidify our understanding of dynamic associations between these constructs earlier in development when interventions stand to be more impactful.
The current study aims at bridging this gap by applying panel analysis to repeated measures of cognitive abilities and BMI across four timepoints during childhood (i.e., grades one through four). Given extant theory11 and well-documented associations between cognitive abilities and weight outcomes,10 it was hypothesized that better performance in each aspect of executive control would predict lower subsequent BMI, particularly later in the study window (i.e., between grades three and four) when youth may have more opportunities to apply their knowledge of healthful foods and have more independence to choose meals/snacks. Regarding the opposite direction, the few studies that have tested this path do not converge on a clear picture. For example, although one study30 did not report any significant paths from BMI to domains of executive control, another study that did report a negative longitudinal association from BMI to executive control used a composite score, obscuring any domain-specific conclusions.27 Thus, no a priori hypotheses regarding paths from BMI to specific executive control components were formulated.
2 |. METHOD
2.1 |. Participants
Participants were 294 youth in a longitudinal study that began in preschool and continued into the elementary years. Initial recruitment involved targeted ads in local preschools and around the community. Because the original study focused on normative cognitive development, children with a diagnosed developmental, behavioural, or language disorder at the time of study intake in preschool were excluded from enrolment. Children diagnosed with a developmental or behavioural disorder (but not language disorder) after enrolment were retained. Parents completed a phone screening prior to enrolment. For more information about the recruitment phase, refer to James et al.32 The sample had equal sex representation (53.0% assigned female at birth), regionally representative racial/ethnic diversity (14.0% Hispanic, 63.6% White, 3.7% Black, 18.4% multiracial) and socioeconomic diversity (57.0% met federal poverty guidelines, qualified for free/reduced school lunch and/or used publicly subsidized health insurance during initial recruitment).
2.2 |. Procedures
During grades one (n = 218), two (n = 260), three (n = 271) and four (n = 252), participants completed executive control tasks and had their height and weight measured objectively. Sample sizes are lower in grades one and four due to study funding constraints and the lagged cohort sequential design of the original longitudinal study; some participants had aged out of the grade one assessment when data collection had begun, whereas others could not complete the grade four assessment because funding had ended. The total sample includes 294 children who completed in-person laboratory sessions, all of whom were assessed at least once during grades one through four. Parents or legal guardians provided informed, written consent for their children to participate. Study procedures were approved by the Institutional Review Board at the University of Nebraska-Lincoln.
2.3 |. Measures
2.3.1 |. Inhibitory control
In a developmentally modified version of Go/No-Go,33 youth “caught” fish with an animated net by pressing a button during the “go” trials. During the “No-Go” trials, a shark appeared, and youth were instructed not to press the button. Stimuli were separated by 500 ms and appeared for 750 ms. The outcome variable was d’ (i.e., the standardized difference between the false alarm rate and the hit rate, where the false alarm rate was the percent correct on the shark trials and the hit rate was the percent correct on the fish trials). Higher scores indicate better performance. Regarding test–retest reliability, the correlations between performance in grades 1 and 2, grades 2 and 3, and grades 3 and 4 were 0.35, 0.26 and 0.18, respectively. Furthermore, there was some evidence of a ceiling effect for this task, with the proportion of participants who achieved the maximum score increasing over time: 26.1% in grade 1, 38.5% in grade 2, 50.2% in grade 3, and 52.0% in grade 4. Despite this, group mean performance increased from grade to grade (see Table 1), providing support for developmental sensitivity.
TABLE 1.
Descriptive Statistics for Study Variables. With the exception of flexible shifting scores which were reverse-coded such that higher scores correspond to better performance, the values presented are untransformed. The sample was 53.0% female and 47% male, and 57.0% of the sample met criteria for socioeconomic risk (i.e., met federal poverty guidelines, qualified for free/reduced school lunch, and/or used publicly subsidized health insurance). BMI values ≤5th percentile = underweight; 5th to <85th percentile = healthy weight; 85th percentile to <95th percentile = overweight; ≥95th percentile = obesity.
| Variables | Grade 1 |
Grade 2 |
Grade 3 |
Grade 4 |
||||||||||||
|---|---|---|---|---|---|---|---|---|---|---|---|---|---|---|---|---|
| n | M (SD) | Range | Skewness/Kurtosis | n | M (SD) | Range | Skewness/Kurtosis | n | M (SD) | Range | Skewness/Kurtosis | n | M (SD) | Range | Skewness/Kurtosis | |
| Age | 218 | 7.12 (0.34) | 6–8 | −0.06/0.82 | 260 | 8.08 (0.36) | 7–9 | −0.19/−0.63 | 271 | 9.07 (0.37) | 8–10 | −0.12/−0.80 | 252 | 10.02 (0.35) | 9–10 | −0.20/−0.68 |
| BMI Percentile | 218 | 63.77 (27.41) | 0.00–99.79 | −0.50/−0.83 | 260 | 63.59 (28.12) | 0.00–99.79 | −0.58/−0.68 | 271 | 63.19 (28.52) | 0.01–99.71 | −0.50/−0.81 | 251 | 63.20 (29.10) | 0.00–99.84 | −0.47/−0.94 |
| Underweight | 1.8% | 3.1% | 3.7% | 3.6% | ||||||||||||
| Healthy | 71.1% | 68.4% | 66.1% | 64.5% | ||||||||||||
| Overweight | 12.4% | 12.3% | 15.1% | 14.0% | ||||||||||||
| Obese | 14.7% | 16.2% | 15.1% | 17.9% | ||||||||||||
| Inhibitory control (Go/No-Go) | 218 | 2.38 (0.65) | 0–3.12 | −0.68/−0.05 | 260 | 2.67 (0.53) | 0.98–3.12 | −1.09/0.44 | 271 | 2.90 (0.36) | 1.11–3.12 | −1.80/3.50 | 252 | 2.93 (0.32) | 1.57–3.12 | −1.73/2.46 |
| M (SD) by BMI Category | M (SD) by BMI Category | M (SD) by BMI Category | M (SD) by BMI Category | |||||||||||||
| Underweight | 2.43 (0.58) | 2.93 (0.37) | 3.00 (0.27) | 3.03 (0.25) | ||||||||||||
| Healthy | 2.38 (0.65) | 2.67 (0.54) | 2.89 (0.37) | 2.92 (0.33) | ||||||||||||
| Overweight | 2.37 (0.72) | 2.60 (0.58) | 2.93 (0.33) | 3.00 (0.23) | ||||||||||||
| Obese | 2.41 (0.62) | 2.66 (0.49) | 2.94 (0.23) | 2.90 (0.34) | ||||||||||||
| Working Memory (Nebraska Barnyard) | 217 | 11.74 (2.07) | 5.67–18 | −0.02/0.25 | 260 | 12.35 (1.99) | 6.67–18 | 0.03/0.32 | 271 | 13.08 (2.22) | 7–20 | 0.13/0.07 | 252 | 13.73 (2.21) | 8–21 | 0.04/−0.02 |
| Underweight | 12.08 (1.34) | 11.75 (2.31) | 13.93 (2.31) | 15.00 (2.73) | ||||||||||||
| Healthy | 11.85 (1.99) | 12.47 (1.99) | 13.11 (2.20) | 13.87 (2.13) | ||||||||||||
| Overweight | 11.31 (2.40) | 12.17 (2.26) | 13.15 (2.42) | 13.27 (1.98) | ||||||||||||
| Obese | 11.56 (2.19) | 12.10 (1.74) | 12.55 (2.11) | 13.41 (2.41) | ||||||||||||
| Flexible Shifting (Shape School) | 217 | 133.98 (44.43) | 0–249 | −0.48/0.14 | 260 | 201.28 (43.76) | 0–299 | −0.90/2.02 | 271 | 161.65 (41.36) | 0–261 | −0.72/1.49 | 252 | 157.35 (39.54) | 0–248 | −0.72/1.22 |
| Underweight | 131.00 (13.34) | 210.00 (40.84) | 151.80 (68.28) | 163.56 (27.08) | ||||||||||||
| Healthy | 135.14 (44.50) | 201.96 (44.11) | 164.19 (39.26) | 158.51 (38.44) | ||||||||||||
| Overweight | 136.00 (39.13) | 190.16 (37.10) | 161.39 (41.68) | 152.86 (36.89) | ||||||||||||
| Obese | 127.03 (51.15) | 205.19 (47.36) | 153.22 (42.18) | 155.76 (47.84) | ||||||||||||
Abbreviation: BMI, body mass index percentile.
2.3.2 |. Working memory
In Nebraska Barnyard (also known as Noisy Book),34 nine animal pictures were displayed on a touch-screen computer, which produced a corresponding animal sound when buttons were pressed. After training, the animals were removed, and children were instructed to press the coloured boxes corresponding to the animals from memory. Beginning with sequences of two, the number of animals increased until the discontinue criterion was met. The outcome variable was the number of correct trials. Regarding test–retest reliability, the correlations between performance in grades 1 and 2, grades 2 and 3, and grades 3 and 4 were 0.58, 0.50, and 0.58, respectively. The proportion of participants who reached the maximum score ranged from 0.40% to 0.80% across all timepoints, suggesting that ceiling effects were not present. Furthermore, group mean performance increased over time (see Table 1), suggesting the task had adequate developmental sensitivity.
2.3.3 |. Flexible shifting
In Shape School,35 youth were shown cartoon students whose bodies came in two colours (red or blue) and two shapes (squares or circles). Children were instructed to name stimuli by either shape or colour as quickly and accurately as possible. During the switching condition, youth identified students by colour or shape, depending on whether students were wearing hats. The outcome variable was a “bin score” derived from a rank-order binning procedure proposed elsewhere.36 This comprehensive score utilizes both accuracy and response time. Scores were reverse-coded such that higher scores indicate better performance. Regarding test–retest reliability, the correlations between performance in grades 1 and 2, grades 2 and 3, and grades 3 and 4 were 0.36, 0.36 and 0.31, respectively. There was minimal evidence of ceiling effects, with the proportion of participants who reached the maximum score ranging from 0.40% to 0.50% across all timepoints, and group mean performance was higher at grades 3 and 4 compared to grade 1 (see Table 1).
2.3.4 |. Elementary BMI
Height and weight were measured objectively with a high-quality scale and stadiometer by trained research staff at every timepoint. Measurements were taken while participants were clothed, but with shoes off. Based on the Center for Disease Control and Prevention (CDC) growth charts,37 height and weight were converted to BMI (weight(lb) / [height(in)]2 × 703) and then to BMI-for-age percentiles.
2.3.5 |. Socioeconomic risk
Caregivers reported on aspects of their family’s financial status during the initial preschool phase of the study, and a binary socioeconomic risk variable was created. Participants were categorized as at risk if any of the following applied: the family’s income-to-needs ratio was below the poverty line, the family qualified for free/reduced lunch at school, and/or the family used publicly subsidized health insurance.
3 |. DATA ANALYTIC STRATEGY
Bivariate correlations were examined, and instances of poor distribution (i.e., skewness and/or kurtosis greater than 3 or less than −3) were trimmed to three standard deviations above/below the mean. Panel analysis was applied to examine dynamic relationships between BMI percentile and each component of executive control, respectively, resulting in three separate models. Executive control and BMI percentile were covaried at each timepoint. In addition, sex (0 = female, 1 = male) and socioeconomic risk (0 = not at risk, 1 = at risk) were included as covariates in the autoregressive and cross-lagged paths at each timepoint.
Analyses were conducted in Mplus, version 8.1.38 Fit indices included the χ2 statistic, which is recommended to be nonsignificant; the comparative fit index (CFI) and Tucker–Lewis Index (TLI), which are recommended to be ≥0.90,39 and the root mean squared error of approximation (RMSEA) and the standard root mean residual (SRMR), which are recommended to be ≤0.05.40 In keeping with best practices for handling missing data,41 the complete sample of 294 youth who completed at least one elementary session was included using maximum-likelihood estimation with robust standard errors (MLR).
3.1 |. Model building steps
A key disadvantage of traditional cross-lagged panel models (CLPMs) is that they do not disaggregate within- and between-person processes, potentially resulting in convergence effects and misattribution of within-person processes.42 To account for the possibility of trait-like stability, random intercept cross-lagged panel models (RI-CLPMs) have been developed as an alternative. These models incorporate latent variables for key constructs in which all factor loadings are constrained to 1; in doing so, remaining autoregressive and cross-lagged associations can be interpreted as only representing within-person processes. After comparing the traditional CLPM and the RI-CLPM, fit indices were further assessed to determine whether the addition of lag-2 paths (i.e., from grade one to three and grade two to four) was warranted. Finally, in keeping with principles of parsimony, autoregressive and cross-lagged equality constraints were considered. All nested model comparisons were conducted with Satorra–Bentler scaled chi-square difference tests.
4 |. RESULTS
Table 1 includes descriptive statistics for all study variables, and Table 2 presents bivariate correlations. The Go/No-Go task in third grade had poor distribution (kurtosis = 3.49) that improved with trimming (kurtosis = 1.24). Due to large variances, the bin sum scores for the Shape School task were transformed (i.e., divided by 10) at all timepoints prior to analyses. The fit indices and nested model comparisons described in subsequent sections are summarized in Table 3, and the final models are presented in Figures 1–3. B refers to the unstandardized beta coefficient, and β refers to the standardized beta coefficient.
TABLE 2.
Bivariate correlations between study variables.
| Variable | 1 | 2 | 3 | 4 | 5 | 6 | 7 | 8 | 9 | 10 | 11 | 12 | 13 | 14 | 15 | 16 | 17 |
|---|---|---|---|---|---|---|---|---|---|---|---|---|---|---|---|---|---|
| 1. G1 BMI | — | ||||||||||||||||
| 2. G2 BMI | 0.84** | — | |||||||||||||||
| 3. G3 BMI | 0.85** | 0.88** | — | ||||||||||||||
| 4. G4 BMI | 0.82** | 0.85** | 0.90** | — | |||||||||||||
| 5. G1 WM | −0.13† | −0.08 | −0.11 | −0.22** | — | ||||||||||||
| 6. G2 WM | −0.18** | −0.12† | −0.13* | −0.25** | 0.58** | — | |||||||||||
| 7. G3 WM | −0.15* | −0.11 | −0.07 | −0.16** | 0.57** | 0.50** | — | ||||||||||
| 8. G4 WM | −0.17* | −0.13* | −0.11 | −0.16* | 0.47** | 0.54** | 0.58** | — | |||||||||
| 9. G1 INH | 0.02 | −0.02 | 0.03 | 0.01 | 0.14* | 0.12 | 0.17* | 0.24** | — | ||||||||
| 10. G2 INH | −0.10 | −0.13* | −0.14* | −0.11 | 0.20** | 0.17** | 0.28** | 0.24** | 0.35** | — | |||||||
| 11. G3 INH | −0.04 | 0.01 | −0.04 | 0.09 | 0.08 | 0.07 | 0.14* | 0.10 | 0.19** | 0.26** | — | ||||||
| 12. G4 INH | 0.01 | −0.01 | 0.00 | −0.02 | 0.03 | 0.06 | 0.10 | 0.14* | 0.11 | 0.27** | 0.18** | — | |||||
| 13. G1 FS | −0.04 | −0.10 | −0.07 | −0.08 | 0.16* | 0.19** | 0.16* | 0.20** | 0.13 | 0.10 | 0.07 | 0.04 | — | ||||
| 14. G2 FS | −0.01 | 0.00 | 0.03 | 0.04 | 0.08 | 0.10 | 0.14* | 0.17** | 0.09 | 0.13* | 0.09 | 0.12 | 0.36** | — | |||
| 15. G3 FS | −0.10 | −0.12 | −0.05 | −0.08 | 0.06 | 0.10 | 0.09 | 0.13* | 0.12 | 0.08 | 0.16* | 0.14* | 0.26** | 0.36** | — | ||
| 16. G4 FS | −0.03 | −0.04 | −0.02 | −0.05 | 0.21** | 0.24** | 0.24** | −0.29** | 0.08 | 0.24** | 0.02 | 0.13* | 0.17* | 0.30** | 0.31** | — | |
| 17. Sex | 0.09 | 0.07 | 0.06 | 0.14* | −0.08 | −0.09 | −0.11 | −0.03 | 0.01 | 0.05 | −0.09 | −0.02 | −0.11 | −0.06 | −0.04 | 0.11 | — |
| 18. Socioeconomic Risk | 0.10 | 0.07 | 0.06 | 0.08 | −0.22** | −0.20** | −0.17** | −0.24** | −0.19** | −0.12† | −0.11 | 0.01 | −0.06 | 0.05 | −0.08 | −0.12† | −0.03 |
Abbreviations: BMI, body mass index percentile; FS, flexible shifting; G1, grade 1; G2, grade 2; G3, grade 3; G4, grade 4; INH, inhibitory control; WM, working memory.
p < 0.05,
p < 0.01,
p = 0.05.
ns vary (see Table 1). Sex was coded such that 0 = female and 1 = male. Socioeconomic risk refers to whether a family met federal poverty guidelines, qualified for free/reduced school lunch, and/or used publicly subsidized health insurance during the recruitment phase (0 = not at risk, 1 = at risk).
TABLE 3.
Nested model comparisons. N = 294.
| Model | Free parameters | CFI | TLI | RMSEA [90% CI] | SRMR | χ2 | df | p | Δχ2 | Δdf | Δp |
|---|---|---|---|---|---|---|---|---|---|---|---|
| Inhibitory control (Go/No-Go task) | |||||||||||
| CLPM | 44 | 0.91 | 0.77 | 0.12 [0.10, 0.15] | 0.06 | 84.04 | 16 | <0.01 | – | – | – |
| vs. RI-CLPM | 47 | 0.99 | 0.96 | 0.05 [0.00, 0.08] | 0.05 | 21.08 | 13 | 0.07 | 27.89 | 3 | <0.01 |
| RI-CLPM | |||||||||||
| vs. RI-CLPM with autoregressive equality constraints | 43 | 0.96 | 0.90 | 0.08 [0.05, 0.10] | 0.07 | 47.59 | 17 | <0.01 | 24.96 | 4 | <0.01 |
| vs. RI-CLPM with cross-lagged equality constraints† | 43 | 0.99 | 0.98 | 0.04 [0.00, 0.07] | 0.05 | 23.26 | 17 | 0.14 | 3.39 | 4 | 0.50 |
| Working memory (Nebraska Barnyard task) | |||||||||||
| CLPM | 44 | 0.88 | 0.70 | 0.15 [0.13, 0.18] | 0.09 | 126.12 | 16 | <0.01 | — | — | — |
| vs. RI-CLPM | 47 | 0.98 | 0.93 | 0.07 [0.04, 0.11] | 0.06 | 39.67 | 13 | <0.01 | 48.70 | 3 | <0.01 |
| RI-CLPM | |||||||||||
| vs. RI-CLPM with lag-2 autoregressive paths† | 51 | 0.98 | 0.90 | 0.08 [0.05, 0.12] | 0.05 | 27.86 | 9 | <0.01 | 11.01 | 4 | 0.03 |
| RI-CLPM with lag-2 autoregressive paths | |||||||||||
| vs. RI-CLPM with lag-2 autoregressive paths and autoregressive equality constraints | 43 | 0.97 | 0.92 | 0.08 [0.05, 0.10] | 0.06 | 46.62 | 17 | <0.01 | 19.38 | 8 | <0.01 |
| vs. RI-CLPM with lag-2 autoregressive paths and cross-lagged equality constraints | 47 | 0.98 | 0.90 | 0.08 [0.05, 0.11] | 0.06 | 38.09 | 13 | <0.01 | 10.34 | 4 | 0.04 |
| Flexible shifting (Shape School task) | |||||||||||
| CLPM | 44 | 0.92 | 0.80 | 0.11 [0.09, 0.14] | 0.06 | 77.44 | 16 | <0.01 | — | — | — |
| vs. RI-CLPM† | 47 | 0.99 | 0.98 | 0.03 [0.00, 0.07] | 0.04 | 17.28 | 13 | 0.19 | 16.13 | 3 | <0.01 |
| RI-CLPM | |||||||||||
| vs. RI-CLPM with autoregressive equality constraints | 43 | 0.99 | 0.97 | 0.04 [0.00, 0.07] | 0.06 | 29.38 | 17 | 0.03 | 10.42 | 4 | 0.03 |
| vs. RI-CLPM with cross-lagged equality constraints | 43 | 0.93 | 0.90 | 0.07 [0.04, 0.11] | 0.07 | 32.09 | 17 | 0.01 | 14.51 | 4 | <0.01 |
Indicates the best-fitting, most parsimonious model. Lag-2 autoregressive paths describe non-consecutive autoregressive paths (i.e., from grades 1 to 3 and grades 2 to 4). Fit statistics include the χ2 statistic (recommended to be nonsignificant); the comparative fit index (CFI) and Tucker-Lewis Index (TLI; recommended to be 0.90 or higher)39; and the root mean squared error of approximation (RMSEA) and the standard root mean residual (SRMR, recommended to be 0.05 or lower).40 χ2 difference tests (Δχ2) were conducted using the Satorra–Bentler method.
Abbreviations: CI, confidence interval; CLPM, cross-lagged panel model; df, degrees of freedom; RI-CLPM, random intercept cross-lagged panel model.
FIGURE 1.

N = 294. *p < 0.05. χ2(17) = 23.26, p = 0.14, CFI = 0.99, TLI = 0.98, RMSEA = 0.04, and SRMR = 0.05. All paths report standardized beta weights (β). Significant paths are also denoted with bolded and dashed lines. BMI, body mass index percentile; BP, between person; Inh, inhibitory control; WP, within person. All cross-lagged and autoregressive paths control for sex and socioeconomic risk; none of the covariates were significant
FIGURE 3.
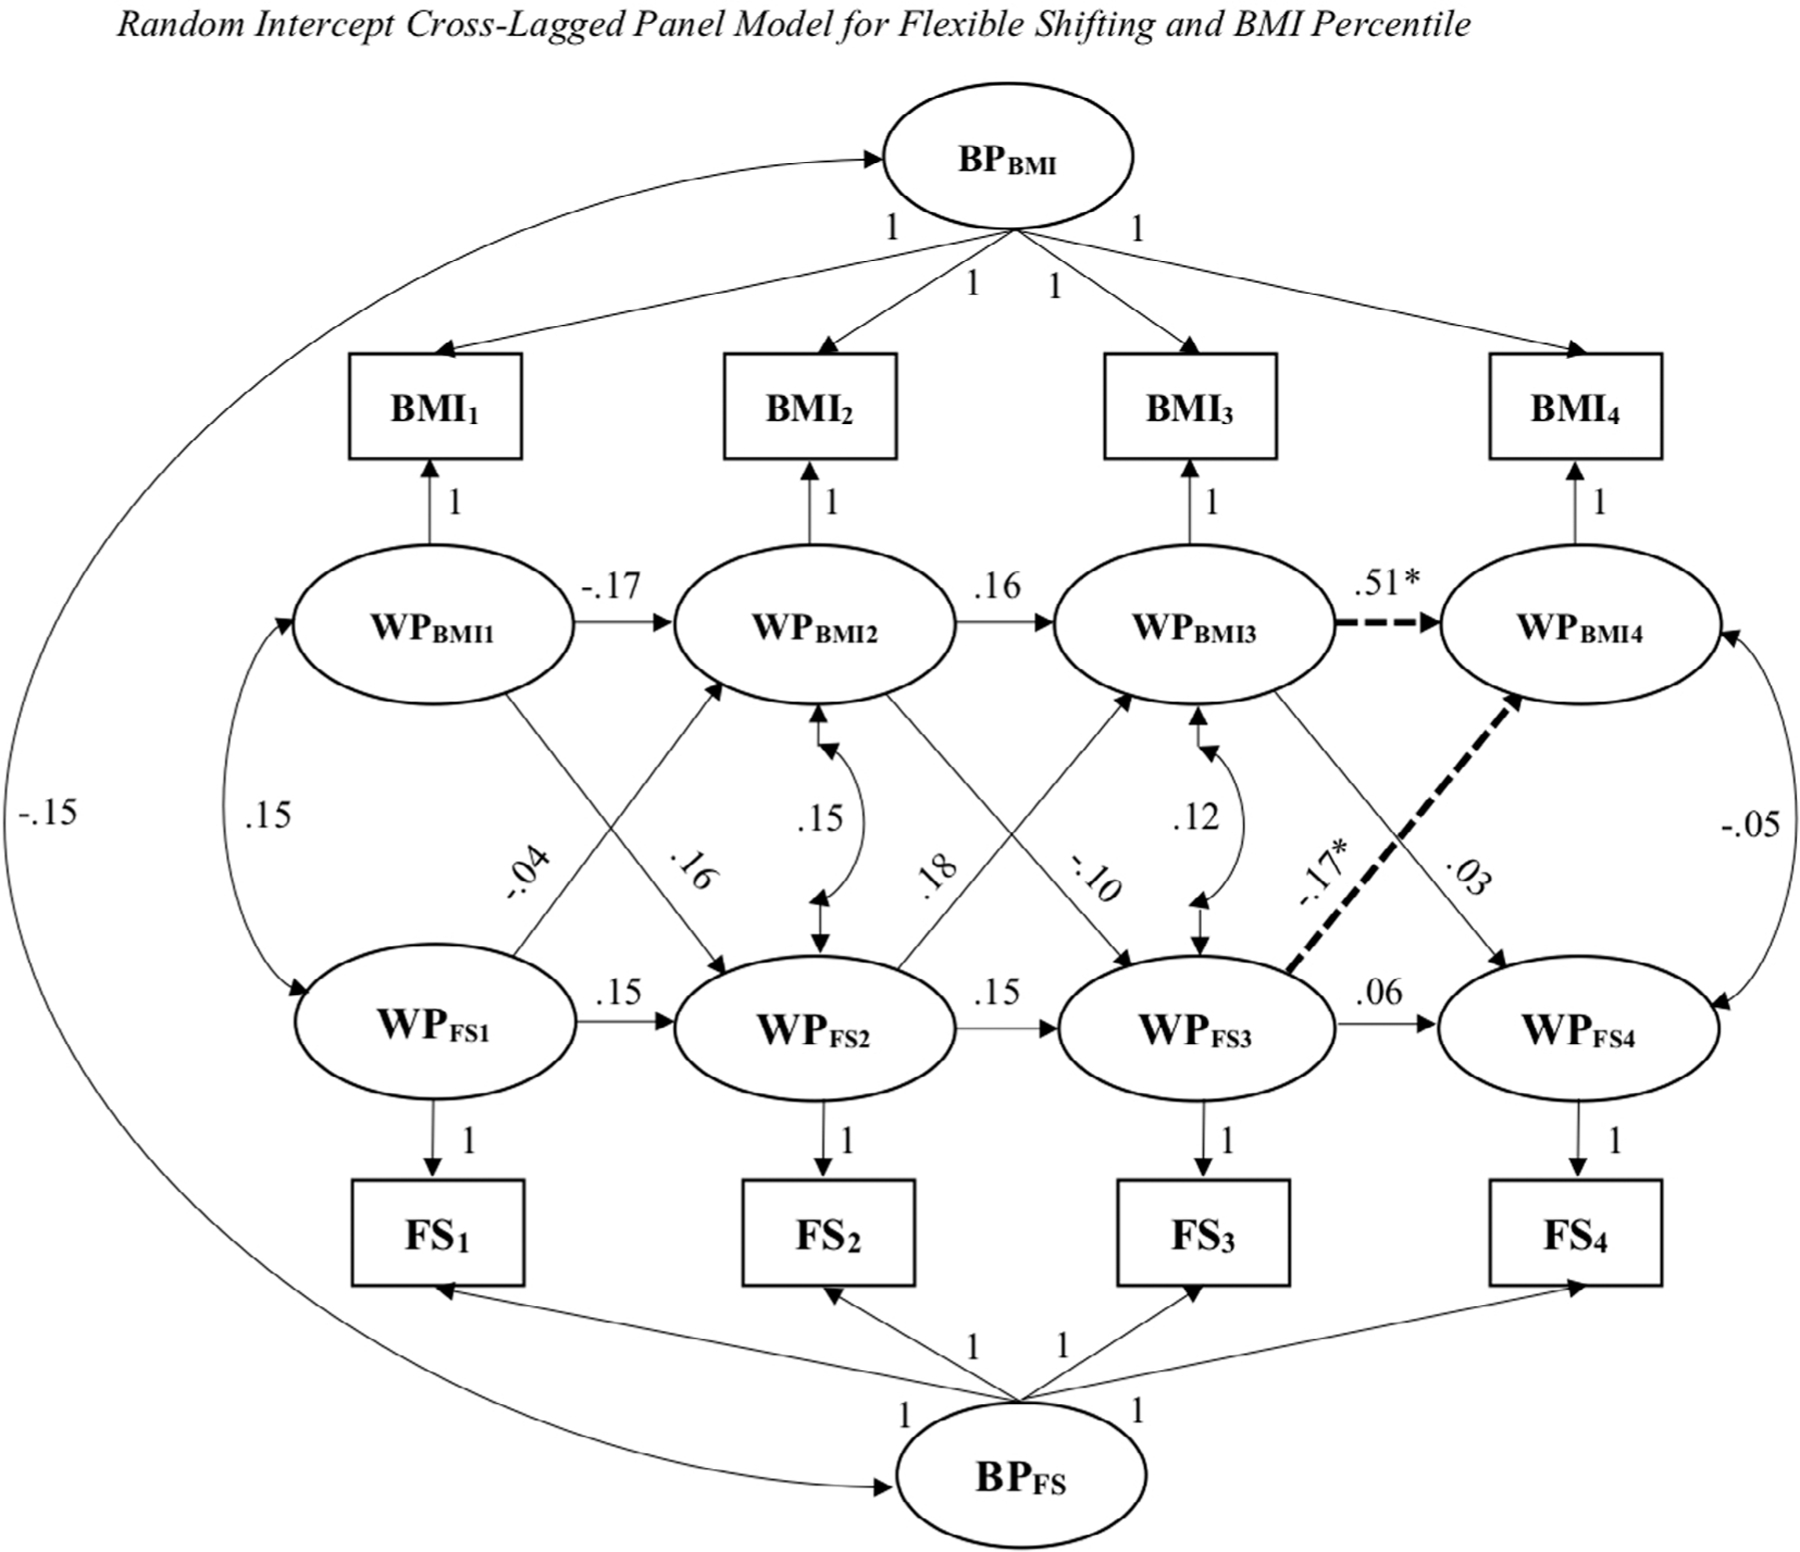
N = 294. *p < 0.05. χ2(13) = 17.28, p = 0.19, CFI = 0.99, TLI = 0.98, RMSEA = 0.03, and SRMR = 0.04. All paths report standardized beta weights (β). Significant paths are also denoted with bolded and dashed lines. BMI, body mass index percentile; BP, between person; FS, flexible shifting; WP, within person. All cross-lagged and autoregressive paths control for sex and socioeconomic risk. Sex was associated with flexible shifting performance at grade four, with males performing better, B = 0.12 (SE = 0.05), β = 0.18 (SE = 0.07), p = 0.01
4.1 |. Inhibitory control
4.1.1 |. Nested model comparisons
An RI-CLPM with relationships between inhibitory control and BMI percentile was examined. This model had good fit, χ2(13) = 21.08, p = 0.07, CFI = 0.99, TLI = 0.96, RMSEA = 0.05, and SRMR = 0.05. Within-person parameters and random intercepts were constrained to test a traditional CLPM. Model fit significantly worsened, suggesting that the RI-CLPM was preferred, χ2(3) = 27.89, p < 0.01. There was significant between-person variability in BMI percentile (σ2 = 672.59, p < 0.01) and inhibitory control abilities (σ2 = 0.04, p < 0.01) over time, lending support for random intercepts. Given that all indices for the RI-CLPM indicated excellent fit, lag-2 autoregressive paths were not considered. However, in keeping with principles of parsimony, autoregressive paths were constrained to be equal. Model fit significantly worsened, χ2(4) = 24.96, p < 0.01, and constraints were removed. Finally, the cross-lagged paths were constrained, which resulted in excellent fit, χ2(17) = 23.26, p = 0.14, CFI = 0.99, TLI = 0.98, RMSEA = 0.04, and SRMR = 0.05. Since model fit did not significantly worsen, the cross-lagged equality constraints were retained, χ2(4) = 3.39, p = 0.50. Thus, the RI-CLPM with cross-lagged equality constraints was the final model for inhibitory control.
4.1.2 |. Autoregressive paths
In the RI-CLPM, the autoregressive paths showed that BMI percentile was variable in early elementary school [grade one to two: B = −0.22 (SE = 0.27), β = −0.23 (SE = 0.25), p = 0.41; grades 2 to 3: B = 0.13 (SE = 0.21), β = 0.11 (SE = 0.18), p = 0.54], and then showed stability from grades 3 to 4 [B = 0.56 (SE = 0.13), β = 0.48 (SE = 0.12), p < 0.01]. Inhibitory control performance showed the opposite pattern, with stability in early elementary school from grades 1 to 2 [B = 0.22 (SE = 0.06), β = 0.28 (SE = 0.08), p < 0.01], followed by variability from grades 2 to 3 [B = −0.03 (SE = 0.05), β = −0.06 (SE = 0.10), p = 0.54] and grades 3 to 4 [B = −0.37 (SE = 0.23), β = −0.36 (SE = 0.21), p = 0.11].
4.1.3 |. Cross-lagged paths
Inhibitory control predicted subsequent BMI across all timepoints, such that better performance was consistently associated with lower BMI, B = −3.95 (SE = 1.44), β = −0.25 (SE = 0.08), p < 0.01. However, BMI percentile did not predict inhibitory control at subsequent timepoints.
4.1.4 |. Covariances and covariates
The covariances between inhibitory control and BMI at all timepoints were not significant, and neither sex nor socioeconomic risk was associated with BMI or inhibitory control at any timepoint.
4.2 |. Working memory
4.2.1 |. Nested model comparisons
An RI-CLPM with associations between working memory and BMI percentile was examined. This model had adequate fit, χ2(13) = 39.67, p < 0.01, CFI = 0.98, TLI = 0.93, RMSEA = 0.07, and SRMR = 0.06. Within-person parameters and random intercepts were constrained to test a traditional CLPM, which had poor fit. The chi-square difference test was significant, χ2(3) = 48.70, p < 0.01, suggesting that the RI-CLPM was preferred. There was significant between-person variability in BMI percentile (σ2 = 670.42, p < 0.01) and working memory (σ2 = 2.23, p < 0.01) over time, lending further support for the inclusion of random intercepts. Next, lag-2 autoregressive paths were added to the RI-CLPM, resulting in adequate fit, χ2(9) = 27.86, p < 0.01, CFI = 0.98, TLI = 0.90, RMSEA = 0.08, and SRMR = 0.05. Since these paths significantly improved fit, these paths were retained, χ2(4) = 11.01, p = 0.03. Next, all autoregressive paths within the RI-CLPM were constrained to be equal. Model fit deteriorated, so these constraints were removed, χ2(8) = 19.38, p < 0.01. Finally, equality constraints were added to cross-lagged paths. Model fit deteriorated, and the constraints were removed, χ2(4) = 10.34, p = 0.04. The RI-CLPM with lag-2 auto-regressive paths was the final model for working memory.
4.2.2 |. Autoregressive paths
The autoregressive paths indicated that BMI percentile was variable across timepoints [grade 1 to 2: B = −0.06 (SE = 0.69), β = −0.06 (SE = 0.58), p = 0.93; grades 1 to 3: B = 0.11 (SE = 0.35), β = 0.08 (SE = 0.28), p = 0.76, grades 2 to 3: B = 0.35 (SE = 0.34), β = 0.32 (SE = 0.32), p = 0.31; and grades 2 to 4: B = 0.14 (SE = 0.14), β = 0.11 (SE = 0.11), p = 0.30], with an exception between grades 3 and 4, B = 0.59 (SE = 0.11), β = 0.52 (SE = 0.10), p < 0.01. The pattern for working memory performance was less consistent, with variability across some timepoints [grades 1 to 2: B = 0.48 (SE = 0.28), β = 0.51 (SE = 0.30), p = 0.09; grades 2 to 3: B = 0.27 (SE = 0.13), β = 0.24 (SE = 0.13), p = 0.06; grades 2 to 4: B = 0.32 (SE = 0.18), β = 0.28 (SE = 0.17), p = 0.08], but stability across others [grades 1 to 3: B = 0.44 (SE = 0.14), β = 0.41 (SE = 0.15), p < 0.01; grades 3 to 4: B = 0.39 (SE = 0.10), β = 0.39 (SE = 0.09), p < 0.01].
4.2.3 |. Cross-lagged paths
Regarding working memory predicting subsequent BMI percentile, higher working memory performance was associated with lower BMI in grade 4, B = −1.10 (SE = 0.51), β = −0.16 (SE = 0.06), p = 0.01. However, BMI percentile did not predict subsequent working memory performance at any timepoint.
4.2.4 |. Covariances and covariates
The covariances between working memory and BMI across all timepoints were not significant. The only significant covariate was socioeconomic risk, such that children categorized as at risk performed worse on the working memory task during grade 4, B = −0.45 (SE = 0.22), β = −0.11 (SE = 0.06), p = 0.04.
4.3 |. Flexible shifting
4.3.1 |. Nested model comparisons
An RI-CLPM with relationships between flexible shifting and BMI percentile was examined; this model had excellent fit, χ2(13) = 17.28, p = 0.19, CFI = 0.99, TLI = 0.98, RMSEA = 0.03, and SRMR = 0.04. Within-person parameters and random intercepts were constrained to test a traditional CLPM. Model fit significantly worsened, showing that the RI-CLPM was preferred, χ2(3) = 16.13, p < 0.01. There was significant between-person variability in BMI percentile (σ2 = 660.76, p < 0.01) and flexible shifting abilities (σ2 = 0.05, p < 0.01) over time. Given that all indices indicated excellent fit for the RI-CLPM, lag-2 autoregressive paths were not considered. However, in keeping with principles of parsimony, the auto-regressive paths within the RI-CLPM were constrained to be equal. Fit significantly worsened, so the constraints were removed, χ2(4) = 10.42, p = 0.03. Finally, cross-lagged paths were constrained, but again model fit deteriorated, χ2(4) = 14.51, p < 0.01. Thus, the RI-CLPM without equality constraints was retained as the final model for flexible shifting.
4.3.2 |. Autoregressive paths
The autoregressive paths suggested that BMI percentile was variable in early elementary school [grade one to two: B = −0.17 (SE = 0.26), β = −0.17 (SE = 0.24), p = 0.50; grade 2 to 3: B = 0.19 (SE = 0.21), β = 0.16 (SE = 0.18), p = 0.36], and then showed stability from grades 3 to 4 [B = 0.59 (SE = 0.11), β = 0.51 (SE = 0.11), p < 0.01]. Flexible shifting was variable across all grades [grades 1 to 2: B = 0.14 (SE = 0.10), β = 0.15 (SE = 0.10), p = 0.13; grades 2 to 3: B = 0.14 (SE = 0.10), β = 0.15 (SE = 0.10), p = 0.17; grades 3 to 4: B = 0.06 (SE = 0.12), β = 0.06 (SE = 0.12), p = 0.63].
4.3.3 |. Cross-lagged paths
Higher grade three flexible shifting performance predicted lower BMI in grade four, B = −6.76 (SE = 3.12), β = −0.17 (SE = 0.08), p = 0.03. However, BMI did not predict flexible shifting performance at subsequent timepoints.
4.3.4 |. Covariances and covariates
The covariances between flexible shifting and BMI percentile across timepoints were not significant. Sex was associated with flexible shifting performance at grade 4, with males performing better, B = 0.12 (SE = 0.05), β = 0.18 (SE = 0.07), p = 0.01.
5 |. DISCUSSION
Despite public health efforts, obesity remains a prevalent concern. Identifying modifiable factors that contribute to weight problems, such as executive control, is important for informing treatment and prevention approaches. Childhood is an ideal window for both intervention and prevention since habits established early in development may become lifelong. Although it has also been proposed that the pathways between executive control and obesity are bidirectional in nature,11,19 studies positioned to investigate both directions of the relationship are rare, particularly during childhood. Therefore, the current investigation sought to examine the directionality of this relationship during elementary school.
Generally consistent with our study hypotheses, the results provided the strongest support for executive control abilities predicting future BMI, but not the reverse direction. In particular, better inhibitory control performance consistently predicted lower BMI at the subsequent grade. This finding is consistent with the idea that the ability to modulate impulses and resist palatable foods may be protective against unhealthy weight gain. Similarly, better performance during grade 3 on both the working memory and flexible shifting tasks, respectively, predicted lower BMI percentiles at grade four. Given that the hypothesized role of working memory and flexible shifting in health behaviours involves more higher-order cognitive processes, such as the ability to recall the day’s eating behaviours and being able to flexibly adapt to changing environmental demands that may influence dietary decisions, it makes developmental sense that these abilities might not become more salient for weight outcomes until later in childhood, when youth are just beginning to establish more dietary independence. It is also notable that although there was some support for concurrent associations between executive control abilities and BMI percentile at the bivariate level, covariances between executive control and BMI were nonsignificant across all panel models. This pattern tentatively suggests that inhibitory control and, at least later in the target developmental window, working memory and flexible shifting, are stronger predictors than concurrent correlates of weight status. This finding underscores the importance of strengthening executive control abilities early to support future healthy weight outcomes. Autoregressive paths and the distribution of BMI percentile categories also pointed to variability in BMI percentile across childhood. More specifically, although mean BMI percentile was largely the same at all timepoints, the variability of scores increased modestly, with fewer youth classified as having a healthy weight over time. Again, this pattern speaks to the importance of early intervention given that it is easier to maintain a healthy weight than it is to reduce weight and subsequently maintain reductions.43
When compared to findings from a similar study,30 some key questions regarding the nature of the relationship between executive control and BMI are answered, whereas others still remain. First, like the current investigation, better flexible shifting abilities predicted lower subsequent BMI, and no evidence was found for the reverse direction. However, unlike our findings, inhibitory control performance did not predict subsequent BMI. Key methodological differences between the earlier study30 and ours, such as the former’s more condensed developmental window and greater age variability at each timepoint, could explain these discrepant findings. In addition, the earlier study30 used similar but nonetheless different tasks to measure executive control. Regardless, our combined results converge on the impression that stronger executive control abilities—particularly flexible shifting, which was found to predict BMI in both studies, as well as inhibitory control, which consistently predicted BMI at each subsequent timepoint in the current study—are related to lower BMI. Regarding the opposite direction, conclusions remain more tentative given the null findings in the current study and the negligible effect sizes that did not reach significance after considering socioeconomic status reported in the earlier study.30
Study findings should be considered in light of certain limitations. First, BMI is an imperfect tool for measuring obesity: It does not indicate where body fat is located,44 and it is known to overestimate obesity in Black and, to a lesser degree, Hispanic women,45 with similar biases reported in youth samples.46 Future research should include measures of body fat and oversample for greater racial and ethnic diversity. In addition, obesity is an incredibly complex health concern with a multitude of factors that makes it difficult to treat, including inequitable availability of healthy foods, inequitable access to high-quality healthcare, and increasing levels of stationarity as a society.47 Thus, although targeting executive control appears to be a promising option for obesity interventions, no single study can account for the many other factors that also contribute to weight outcomes. We encourage clinicians to consider cognitive interventions in the broader context of other available tools, and we urge future research to take a holistic approach when considering the cognitive and psychosocial correlates of obesity. Furthermore, from a methodological perspective, although objective, task-based measurement of executive control is generally preferred, this approach may not capture the everyday application of regulatory abilities in real-world scenarios. Similarly, the use of food-specific tasks that measure executive control in appetitive contexts (e.g., food-specific Go/No-Go48) may yield more robust findings. Future research that incorporates multimodal cognitive measures is needed. Finally, the current study was not designed to test the neural, behavioural, attentional and/or emotional mechanisms underlying associations between executive control and BMI in either direction, which is an important avenue for future research.
Despite these limitations, our findings speak to the potential value in targeting executive control abilities as part of treatment and prevention efforts aimed at reducing obesity in children. There is still much work to be done in this area, including replication of our results later in development and the need to create developmentally appropriate interventions that harness the potential of strong cognitive abilities in shaping healthy weight outcomes. In the meantime, the promotion of better behaviour regulation and sharper mental flexibility in youth holds promise as one of many tools for fighting childhood obesity.
FIGURE 2.

N = 294. *p < 0.05. χ2(9) = 27.86, p < 0.01, CFI = 0.98, TLI = 0.90, RMSEA = 0.08, and SRMR = 0.05. All paths report standardized beta weights (β). Significant paths are also denoted with bolded and dashed lines. BMI, body mass index percentile; BP, between person; WM, working memory; WP, within person. The only significant covariate was socioeconomic risk, such that children categorized as at risk performed worse on the working memory task during grade 4, B = −0.45 (SE = 0.22), β = −0.11 (SE = 0.06), p = 0.04
Funding information
This work was supported by grants from the National Institute of Diabetes and Digestive and Kidney Diseases (Grant Nos. F31DK122636, R01DK116693 and R01DK125651) and the National Institute of Mental Health (Grant No. R01MH065668) of the National Institutes of Health. The content is solely the responsibility of the authors and does not necessarily represent the official views of the National Institutes of Health.
ACKNOWLEDGEMENTS
The authors would like to thank the families who participated in this research. Cara C. Tomaso and Timothy D. Nelson contributed to developing the research question, and Cara C. Tomaso conducted the data analysis and wrote the initial manuscript. Tiffany James created and maintained the data infrastructure for the entire longitudinal project. All authors were involved in interpreting the results and critically editing the article. All authors approved the submitted manuscript.
Footnotes
CONFLICT OF INTEREST
No conflict of interest was declared.
REFERENCES
- 1.Hales CM, Carroll MD, Fryar CD, Ogden CL. Prevalence of obesity among adults and youth: United States, 2015–2016. NCHS Data Brief, no. 288 National Center for Health Statistics; 2017. [PubMed] [Google Scholar]
- 2.Ogden CL, Carroll MD, Lawman HG, et al. Trends in obesity prevalence among children and adolescents in the United States, 1988–1994 through 2013–2014. JAMA 2016;315(21):2292–2299. [DOI] [PMC free article] [PubMed] [Google Scholar]
- 3.Flegal KM, Kruszon-Moran D, Carroll MD, Fryar CD, Ogden CL. Trends in obesity among adults in the United States, 2005 to 2014. JAMA 2016;315(21):2284–2291. [DOI] [PMC free article] [PubMed] [Google Scholar]
- 4.Espy KA. The changing nature of executive control in preschool. Monogr Soc Res Child Dev 2016;81(3):1–179. [DOI] [PubMed] [Google Scholar]
- 5.Hillman CH, Pontifex MB, Castelli DM, et al. Effects of the FITKids randomized controlled trial on executive control and brain function. Pediatrics 2014;134(4):e1063–e1071. [DOI] [PMC free article] [PubMed] [Google Scholar]
- 6.Hall PA, Marteau TM. Executive function in the context of chronic disease prevention: theory, research and practice. Prev Med 2014;68: 44–50. [DOI] [PubMed] [Google Scholar]
- 7.Fitzpatrick S, Gilbert S, Serpell L. Systematic review: are overweight and obese individuals impaired on behavioural tasks of executive functioning? Neuropsychol Rev 2013;23(2):138–156. [DOI] [PubMed] [Google Scholar]
- 8.Nelson TD, Kidwell KM, Nelson JM, Tomaso CC, Hankey M, Espy KA. Preschool executive control and internalizing symptoms in elementary school. J Abnorm Child Psychol 2018;46(7):1509–1520. [DOI] [PMC free article] [PubMed] [Google Scholar]
- 9.Tomaso CC, Nelson JM, Espy KA, Nelson TD. Associations between different components of executive control in childhood and sleep problems in early adolescence: a longitudinal study. J Health Psychol 2020;25(13–14):2440–2452. [DOI] [PubMed] [Google Scholar]
- 10.Reinert KR, Po’e EK, Barkin SL. The relationship between executive function and obesity in children and adolescents: a systematic literature review. J Obes 2013;820956:1–10. [DOI] [PMC free article] [PubMed] [Google Scholar]
- 11.Nelson TD, Mize Nelson J, Alex Mason W, Tomaso CC, Kozikowski CB, Andrews EK. Executive control and adolescent health: toward a conceptual framework. Adolesc Res Rev 2019;4(1): 31–43. [DOI] [PMC free article] [PubMed] [Google Scholar]
- 12.Kemps E, Goossens L, Petersen J, Verbeken S, Vervoort L, Braet C. Evidence for enhancing childhood obesity treatment from a dual-process perspective: a systematic literature review. Clin Psychol Rev 2020;77:101840. [DOI] [PubMed] [Google Scholar]
- 13.Favieri F, Forte G, Casagrande M. The executive functions in over-weight and obesity: a systematic review of neuropsychological cross-sectional and longitudinal studies. Front Psychol 2019;10:2126. [DOI] [PMC free article] [PubMed] [Google Scholar]
- 14.Verbeken S, Braet C, Claus L, Nederkoorn C, Oosterlaan J. Childhood obesity and impulsivity: an investigation with performance-based measures. Behav Chang 2009;26(3):153–167. [Google Scholar]
- 15.Verdejo-García A, Pérez-Exposito M, Schmidt-Río-Valle J, et al. Selective alterations within executive functions in adolescents with excess weight. Obesity 2010;18(8):1572–1578. [DOI] [PubMed] [Google Scholar]
- 16.Delgado-Rico E, Río-Valle JS, González-Jiménez E, Campoy C, Verdejo-García A. BMI predicts emotion-driven impulsivity and cognitive inflexibility in adolescents with excess weight. Obesity 2012; 20(8):1604–1610. [DOI] [PubMed] [Google Scholar]
- 17.Goldschmidt AB, O’Brien S, Lavender JM, Pearson CM, Le Grange D, Hunter SJ. Executive functioning in a racially diverse sample of children who are overweight and at risk for eating disorders. Appetite 2018;124:43–49. [DOI] [PMC free article] [PubMed] [Google Scholar]
- 18.Maayan L, Hoogendoorn C, Sweat V, Convit A. Disinhibited eating in obese adolescents is associated with orbitofrontal volume reductions and executive dysfunction. Obesity 2011;19(7):1382–1387. [DOI] [PMC free article] [PubMed] [Google Scholar]
- 19.Egbert AH, Creber C, Loren DM, Bohnert AM. Executive function and dietary intake in youth: a systematic review of the literature. Appetite 2019;139:197–212. [DOI] [PubMed] [Google Scholar]
- 20.Wiebe SA, Sheffield T, Nelson JM, Clark CA, Chevalier N, Espy KA. The structure of executive function in 3-year-olds. J Exp Child Psychol 2011;108(3):436–452. [DOI] [PMC free article] [PubMed] [Google Scholar]
- 21.Lee K, Bull R, Ho RM. Developmental changes in executive functioning. Child Dev 2013;84(6):1933–1953. [DOI] [PubMed] [Google Scholar]
- 22.Luna B, Marek S, Larsen B, Tervo-Clemmens B, Chahal R. An integrative model of the maturation of cognitive control. Annu Rev Neurosci 2015;38:151–170. [DOI] [PMC free article] [PubMed] [Google Scholar]
- 23.Bardikoff N, Sabbagh M. The differentiation of executive functioning across development: insights from developmental cognitive neuroscience. In: Budwig N, Turiel E, Zelazo PD, eds. New Perspectives on Human Development Cambridge University; 2017:47–66. [Google Scholar]
- 24.Martin AA, Davidson TL. Human cognitive function and the obesogenic environment. Physiol Behav 2014;136:185–193. [DOI] [PMC free article] [PubMed] [Google Scholar]
- 25.Vantieghem S, Bautmans I, Guchtenaere A, Tanghe A, Provyn S. Improved cognitive functioning in obese adolescents after a 30-week inpatient weight loss program. Pediatr Res 2018;84(2):267–271. [DOI] [PubMed] [Google Scholar]
- 26.Shields GS, Moons WG, Slavich GM. Inflammation, self-regulation, and health: an immunologic model of self-regulatory failure. Perspect Psychol Sci 2017;12(4):588–612. [DOI] [PMC free article] [PubMed] [Google Scholar]
- 27.Ronan L, Alexander-Bloch A, Fletcher PC. Childhood obesity, cortical structure, and executive function in healthy children. Cereb Cortex 2020;30(4):2519–2528. [DOI] [PMC free article] [PubMed] [Google Scholar]
- 28.Nelson TD, James TD, Hankey M, Nelson JM, Lundahl A, Espy KA. Early executive control and risk for overweight and obesity in elementary school. Child Neuropsychol 2017;23(8):994–1002. [DOI] [PMC free article] [PubMed] [Google Scholar]
- 29.Datar A, Chung PJ. Childhood self-control and adolescent obesity: evidence from longitudinal data on a national cohort. Child Obes 2018;14(4):238–247. [DOI] [PMC free article] [PubMed] [Google Scholar]
- 30.Groppe K, Elsner B. Executive function and weight status in children: a one-year longitudinal perspective. Child Neuropsychol 2017;23(2): 129–147. [DOI] [PubMed] [Google Scholar]
- 31.Hartanto A, Yong JC, Toh WX. Bidirectional associations between obesity and cognitive function in midlife adults: a longitudinal study. Nutrients 2019;11(10):2343. [DOI] [PMC free article] [PubMed] [Google Scholar]
- 32.James TD, Choi HJ, Wiebe SA, Espy KA. The preschool problem solving study: sample, data, and statistical methods. Monogr Soc Res Child Dev 2016;81(4):30–46. [DOI] [PubMed] [Google Scholar]
- 33.Simpson A, Riggs KJ. Conditions under which children experience inhibitory difficulty with a “button-press” go/no-go task. J Exp Child Psychol 2006;94(1):18–26. [DOI] [PubMed] [Google Scholar]
- 34.Hughes C, Dunn J, White A. Trick or treat? Uneven understanding of mind and emotion and executive dysfunction in “hard-to-manage” preschoolers. J Child Psychol Psychiatry 1998;39(7):981–994. [PubMed] [Google Scholar]
- 35.Espy KA, Bull R, Martin J, Stroup W. Measuring the development of executive control with the shape school. Psychol Assess 2006;18(4): 373–381. [DOI] [PubMed] [Google Scholar]
- 36.Hughes MM, Linck JA, Bowles AR, Koeth JT, Bunting MF. Alternatives to switch-cost scoring in the task-switching paradigm: their reliability and increased validity. Behav Res Methods 2014;46(3):702–721. [DOI] [PubMed] [Google Scholar]
- 37.Kuczmarski RJ, Ogden CL, Grummer-Strawn LM, et al. CDC growth charts: United States. Adv Data 2000;314:1–27. [PubMed] [Google Scholar]
- 38.Muthén LK, Muthén BO. Mplus User’s Guide 8th ed. . Muthén & Muthén; 1998–2018. [Google Scholar]
- 39.Hu L, Bentler PM. Cutoff criteria for fit indexes in covariance structure analysis: conventional criteria versus new alternatives. Struct Equ Modeling 1999;6:1–55. [Google Scholar]
- 40.MacCallum RC, Browne MW, Sugawara HM. Power analysis and determination of sample size for covariance structure modeling. Psychol Methods 1996;1996(1):130–149. [Google Scholar]
- 41.Enders CK. Applied Missing Data Analysis Guilford Press; 2010. [Google Scholar]
- 42.Hamaker EL, Kuiper RM, Grasman RP. A critique of the cross-lagged panel model. Psychol Methods 2015;20(1):102–116. [DOI] [PubMed] [Google Scholar]
- 43.Gruber KJ, Haldeman LA. Using the family to combat childhood and adult obesity. Prev Chronic Dis 2009;6(3):A106. [PMC free article] [PubMed] [Google Scholar]
- 44.Nuttall FQ. Body mass index: obesity, BMI, and health: a critical review. Nutr Today 2015;50(3):117–128. [DOI] [PMC free article] [PubMed] [Google Scholar]
- 45.Rahman M, Berenson AB. Accuracy of current body mass index obesity classification for white, black, and Hispanic reproductive-age women. Obstet Gynecol 2010;115(5):982–988. [DOI] [PMC free article] [PubMed] [Google Scholar]
- 46.Freedman DS, Wang J, Thornton JC, et al. Racial/ethnic differences in body fatness among children and adolescents. Obesity 2008;16(5): 1105–1111. [DOI] [PubMed] [Google Scholar]
- 47.Frood S, Johnston LM, Matteson CL, Finegood DT. Obesity, complexity, and the role of the health system. Curr Obes Rep 2013;2(4):320–326. [DOI] [PMC free article] [PubMed] [Google Scholar]
- 48.Teslovich T, Freidl EK, Kostro K, et al. Probing behavioral responses to food: development of a food-specific go/no-go task. Psychiatry Res 2014;219(1):166–170. [DOI] [PMC free article] [PubMed] [Google Scholar]