Abstract
Objective
To investigate the effect of autophagy expression levels of different weight‐bearing states and different stages of osteoarthritis in animal models, as well as the corresponding mechanisms.
Methods
We used the male Sprague–Dawley (SD) rats (12‐week‐old, SPF) to establish the OA animal models by modified Hulth method, and grouped animal models according to the length of time after surgery and different weight‐bearing areas. RT‐qPCR was carried out for detection of autophagy‐related genes such as Atg7, Atg12, P62, etc. Western blot analysis was used to detect the expression levels of corresponding autophagy‐related proteins such as LC3B, P62, etc. T test was performed for statistical analysis to compare different groups, while the differences were deemed statistically significant with P < 0.05. Transmission electron microscopy was used to observe the autophagosome to demonstrate the level of autophagy expression and the status of the chondrocytes.
Results
The results of the RT‐qPCR testing showed that when the weight‐bearing cartilage of the 4‐week group (relatively mild) was compared with that of the 10‐week group (relatively severe), there were statistically significant differences in all the genes tested, in detail: Atg3 (P < 0.01), Atg7 (P < 0.01), Atg12 (P < 0.01), P62 (P < 0.0001). The expression of autophagy‐related mRNA in the 4‐week group is increased compared with that of the 10‐week group. As for the expression of proteins, Western blotting showed that in the comparison between the 4‐ and the 10‐week groups, statistically significant results include Atg12 (P < 0.01) in the non‐weight‐bearing area, with decreased autophagy in the 10‐week group compared with that of the 4‐week group, while expression of LC3B (P < 0.05) protein was significantly higher in the 4‐week group than in the control in the non‐weight‐bearing area. The expression of LC3B (P < 0.0001) and P62 (P < 0.05) in the 10‐week group were higher than that of the control. Transmission electron microscope showed that autophagy in the weight‐bearing area is stronger than that in the non‐weight‐bearing area, and autophagy in the 4‐week group is stronger than in the 10‐week group for the weight‐bearing area.
Conclusions
The expression of autophagy varies during different stages of osteoarthritis, in which the autophagy is stronger in the early stage of osteoarthritis, and gradually decreases with the progression of the disease. Autophagy in different weight‐bearing areas may also be different.
Keywords: Animal models, Autophagy, Autophagy‐related proteins, Chondrocytes, Osteoarthritis
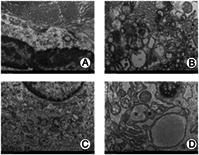
The state of the cells in the weight‐bearing area was not as good as in the non‐weight‐bearing area, with abnormal cell shape, nuclear shrinkage, more lipid vacuoles, and more autophagosomes. The autophagosomes in the non‐weight‐bearing area were only occasionally seen or not found in the field of vision. The number of autophagosomes in chondrocytes in the weight‐bearing zone at 4 weeks postoperative was more than at 10 weeks postoperative. Therefore, the autophagy in the weight‐bearing zone was stronger than that in the non‐weight‐bearing zone. The autophagy level in the 4‐week weight‐bearing area was stronger than that in the 10‐week weight‐bearing area, but the non‐weight‐bearing area was similar to that in the 10‐week group, and the difference could not be identified by the naked eye. Autophagy in the weight‐bearing area is stronger than that in the non‐weight‐bearing area, and autophagy in the 4‐week group is stronger than in the 10‐week group for the weight‐bearing area. Yet autophage of chondercyte from the non‐weight‐bearing area of 4‐week models is similar to 10‐week ones, which can be hardly distinguished.
Introduction
Osteoarthritis (OA), also known as degenerative arthritis, is a very common degenerative bone and joint disease in clinical practice. According to the definition of Osteoarthritis Research Society International (OARSI), OA is a disorder involving movable joints characterized by cell stress and extracellular matrix degradation initiated by micro‐ and macro‐injury that activates maladaptive repair responses including pro‐inflammatory pathways of innate immunity. The disease manifests first as a molecular derangement (abnormal joint tissue metabolism) followed by anatomic and/or physiologic derangements (characterized by cartilage degradation, bone remodeling, osteophyte formation, joint inflammation, and loss of normal joint function) that can culminate in illness 1 . At present, the pathogenesis of knee OA is not completely clear, but there are several risk factors known, such as age, gender, being overweight, biomechanical factors, endocrinic and metabolic abnormalities, knee soft tissue injury history 2 , osteoporosis, or even operations in other systems 3 . OA may be caused by an imbalance of complex biomechanical and biochemical interactions between multiple structures that may disrupt normal homeostasis of the joint 4 , 5 , 6 . There is still a lack of effective therapeutic measures for patients with early‐ and middle‐stage OA, except for several symptomatic treatments that can be used with drugs. However, these methods cannot prevent the progression of OA 7 .
Autophagy, a highly conserved mechanism, plays a crucial role in regulating energy and nutrition and maintaining energy metabolism in the body 8 , 9 . Autophagy protects cells under abnormal physiological conditions, including external stress, nutritional deficiency, hypoxia, endoplasmic reticulum stress (ERS), etc. Dysfunctional cytoplasmic macromolecules, membranes, and organelles are transported to lysosomes through autophagy for degradation and recycling 8 . In recent years, inhibition of chondrocyte apoptosis through autophagy activation has attracted increasing attention 10 .
However, current research has drawn different conclusions about the relationship between autophagy and osteoarthritis and the mechanism of its action. Most studies suggest that autophagy is downregulated in osteoarthritis affected cartilage. These studies claim that autophagy is a process in which cells recycle and reuse intracellular matters to improve energy efficiency, which is generally considered to have an important protective effect. It has been proved that when the PI3K/Akt signaling pathway is activated by the Akt agonist IGF‐1 or the autophagy inducer rapamycin, the autophagy would activate, showing protective effects in iodoacetic acid‐induced knee cartilage injury in rats 11 . Lotz et al., who were the first to explore autophagy in osteoarthritis cartilage, found that the expressions of ULK1, Beclin1, and LC3 (homologous with Atg1, Atg6 and Atg8, respectively) in the cartilage of patients with osteoarthritis were all decreased, and similar results have been demonstrated in chondrocytes cultured in vitro and animal models of osteoarthritis 12 . In the study of the animal model, some scholars found that the aging mouse knee joint was related to the weakening of autophagy and the increase of apoptosis. Meanwhile, compared with the younger mice, the number of autophagosomes in the chondrocytes of old mice was significantly reduced 13 . The down‐regulation is not only present in the post‐autophagy stage, but also in the triggering stage. Studies have found that mTOR is overexpressed in human OA cartilage and mouse OA cartilage model, which is related with increased chondrocyte apoptosis and reduced expression of key autophagy genes during OA 14 . However, some studies have reported upregulation of the autophagy process in osteoarthritic affected cartilage. These studies claimed that autophagy is not only protective, it is a necessary process of chondrocyte differentiation and maturation as well, which is ongoing in the pathological process of osteoarthritis 15 . Sasaki et al. found that mRNA and protein expressions of LC3 and Beclin1 were increased in OA chondrocytes compared with normal chondrocytes, which can also be illustrated by the up‐regulation of LC3 and Beclin1 mRNA in chondrocytes under stress stimulation in vitro 16 .
That is, the main controversy lies in whether autophagy is up‐ or down‐regulated in the process of OA. As the hypothesis of the present research, we suppose that this controversy may be caused by the progression of different stages of osteoarthritis.
As we assumed, in the early course of the disease, autophagy of the affected chondrocytes may be up‐regulated so as to improve the energy utilization of cells, so that they can survive in the harsh local microenvironment. While in the middle and late stages of the disease, the decreased autophagy of chondrocytes could be decompensated and cell apoptosis may increase, which has been shown in other studies 12 . In mechanically injured cartilage, LC3‐II expression was upregulated at 24 h and decreased at 48 and 96 h after injury 17 . Similar effects are observed in intervertebral disc cartilage: intermittent cyclic mechanical tension (ICMT) leads to endplate calcification, yet short‐term administration of ICMT increases autophagy while long‐term dose inhibits autophagy, leading to endplate chondrocyte calcification 18 . Similarly, it is reported that the expressions of LC3, LAMP2, and P62 were different in intervertebral discs with different degeneration grades 19 . Even in the same course of disease, articular cartilage in different parts may be different in the local microenvironment; the microenvironment of cells in the shallow layer, middle layer, and deep layer of cartilage may also be different to some extent. In addition, the expression levels of autophagy‐related mRNA and related proteins (such as ULK1, Beclin1, and LC3II) in medial chondrocytes affected by osteoarthritis were higher than those in shallow and deep chondrocytes 12 . These results indicate that there may be differences in autophagy among chondrocytes of different parts in cartilage and different degrees of injury. However, there is no enough concrete evidence to solve the present controversy.
The aim of the present research is to investigate the autophagy in chondrocytes of cartilage during different courses of OA, so as to further clarify the relations between the lesions of OA and changes of autophagy.
Materials and Methods
OA Animal Model
OA models were established with male Sprague–Dawley (SD) rats (12‐week‐old, SPF) by modified Hulth method. Relatively mild and relatively severe osteoarthritis were simulated by rats 4 and 10 weeks after the operation, respectively.
Surgical methods were as follows: the operation was performed in the animal operating room under aseptic conditions, with ordinary endotracheal anesthesia (2% halothane) and intramuscular injection of antibiotics (enrofloxacin 5 mg/kg) to prevent infection. A midline skin incision was made on the right knee of the hind limb, followed by a parapatellar incision. The medial collateral ligament was sharply dissected, the joint capsule was incised medially by parapatellar incision, and the patella was valgus dislocated. The knee was bent for cutting of the anterior and posterior cruciate ligaments, and the knee was dislocated for the removal of the medial meniscus. The operative field was rinsed with sterile salt solution. The joint capsule, synovial membrane, and skin were sutured. In the sham operation group, which was used as the control with three rats in each group, arthrotomy and patella dislocation were performed as described, and irrigation was done in the same way, but the ligament and meniscus remained intact. Postoperative use of analgesic pectin was provided as needed, allowing weight‐bearing. At the selected time point (4/10 weeks after surgery), cervical vertebra removal was performed after carbon dioxide anesthesia and the rats were sacrificed and samples were collected.
We divided the collected animal cartilage tissue into six groups: (i) the weight‐bearing zone of the control group; (ii) the non‐weight‐bearing zone of the control group; (iii) the weight‐bearing zone at 4 weeks after surgery; (iv) the non‐weight‐bearing zone at 4 weeks after surgery; (v) the weight‐bearing zone at 10 weeks after surgery; and (vi) the non‐weight‐bearing zone at 10 weeks after surgery.
Quantitative Real‐time Polymerase Chain Reaction Assays (RT‐qPCR)
The expression levels of autophagy‐related genes in the cartilage tissues of animal models were detected by RT‐qPCR.
We applied TRIzol™ for extracting total RNA, and then we used gDNA Digester Mix to remove residual genomic DNA. Thereafter, we used Hifair™ III SuperMix plus to configurate reverse transcription reaction system, and set up the reverse transcription process (25°C for 5 min, 55°C for 15 min, 85°C for 5 min) to reverse transcription and then get cDNA. qRT‐PCR was carried out by Superreal SYBR Green kit (Hieff™) following the manufacturer's instructions. 2−ΔΔCt method was carried on the quantitative analysis method (Livak). The primers for RT‐qPCR in this study are enlisted in Table 1.
TABLE 1.
The sequences of primers in the RT‐qPCR testing
| Gene | Sequence |
| p62‐F | CAGCTCGCCGCTCGCTAT |
| p62‐R | GAAAAGGCAACCAAGTCCCCG |
| Atg3‐F | ATCACCTAGTCCACCACTGTCCAA |
| Atg3‐R | CATCCGCCATCACCATCATCTTCTT |
| Atg7‐F | ATGATCCCTGTAACTTAGCCCA |
| Atg7‐R | CACGGAAGCAAACAACTTCAAC |
| Atg12‐F | CATTGACCTGCTGGCTGAATACCT |
| Atg12‐R | TCTGTCCTATGTGCTTGCTCTCCT |
| GAPDH‐F | TCAAGAAGGTGGTGAAGCAGG |
| GAPDH‐R | GCGTCAAAGGTGGAGGAGTG |
Note: F, Forward primer; R, Reverse primer.
Western Blot
The expression of autophagy‐related proteins in the cartilage tissues of animal models were detected by Western blotting.
Total proteins were isolated by RIPA buffer (Beyotime, Shanghai, China) and quantified by BCA Protein Assay Kit (Solarbio, China). The position of the target protein was determined according to the relative position of the pre‐dyeing marker and the molecular weight of the target protein, and the electrophoresis separation was stopped when the target protein was in the optimal identification position of the lower 1/3 of the separation glue surface, then transferred to the polyvinylidene fluoride (PVDF) membranes (Millipore). The membranes were then blocked by 5% TBST for skim milk. Afterwards, primary antibodies were added as well as incubated overnight at 4 °C. Next, secondary antibody horseradish peroxidase (HRP)‐conjugated goat‐anti‐rabbit Immunoglobulin G (IgG) (1:5000, Bioss) was added and incubated at room temperature for 1 h. Primary antibodies were as follows: P62: 1:1000 (Affinity), LC3B: 1:1000 (Affinity), Atg3: 1:1000 (Affinity), Atg7: 1:1000 (Affinity), Atg12: 1:2000 (Affinity), and rabbit‐anti GAPDH 1:5000 (proteintech). Images were obtained by a Tanon‐4200 Chemiluminescent Imaging System (Tanon, China).
The relative expressions of the proteins are calculated with integrated density measured by the Image J software (National Institutes of Health, USA). After the processing using Image J, the gray value of each band was calculated, and the gray value of the target protein was divided by that of the internal control. The results obtained represented the relative expressions of the target proteins.
Observation with Transmission Electron Microscopy (TEM)
The samples were fixed with 2.5% phosphate‐buffered glutaraldehyde immediately on collection, and then post‐fixed in 1% osmium tetroxide for 1 h. They were dehydrated with gradient acetone, embedded, and sectioned. The samples were double stained with uranyl acetate and lead citrate for 10 min. Then, the ultrastructures of cells were viewed under a 100kV Hitachi TEM system (Hitachi, Japan).
Indexes and Varibles: Genes and Proteins Tested
LC3B Protein
The protein LC3B is one of the isoforms of LC3, the core protein in the formation of autophagosomes and one of the most commonly used markers for autophagy. The evaluation criterion of the LC3B protein was integrated density value calculated by Image J software in the Western blot. A higher integrated density showed higher expression of the protein LC3B and indicated an up‐regulated autophagy.
P62 Gene and Protein
The P62 gene encodes a multifunctional protein that binds ubiquitin and regulates activation of the nuclear factor kappa‐B (NF‐κB) signaling pathway 20 , or serves as receptors for autophagy 21 . Though P62 affects the activity of autophagy, it doesn't always act alone. The evaluation criterion of the P62 gene was calculated with the 2−△△Ct method in RT‐qPCR and the evaluation criterion of P62 protein was integrated density value, calculated by Image J software in the Western blot.
Atg3 Gene and Protein
The gene Atg3 is an autophagy‐related gene encoding a ubiquitin‐like conjugating enzyme and is a component of ubiquitination‐like systems involved in autophagy 20 . The protein Atg3 plays a crucial role in the transformation of LC3B into functional LC3B‐II. A higher expression of the gene or protein of Atg3 indicates a higher potential of LC3B. The evaluation criterion of the Atg3 gene was calculated with the 2−△△Ct method in RT‐qPCR and the evaluation criterion of Atg3 protein was integrated density value, which was calculated by Image J software in the Western blot.
Atg12 Gene and Protein
The gene Atg12 is the human homolog of a yeast gene involved in autophagy. The protein encoded by the gene Atg12 is the key in the formation of the Atg12 conjugation system, recruiting LC3B to participate in the formation of autophagosomes. A higher expression of the gene or protein of Atg12 indicates a higher potential of LC3B. The evaluation criterion of the Atg12 gene was calculated with the 2‐△△Ct method in RT‐qPCR and the evaluation criterion of Atg12 protein was the integrated density value, which was calculated by Image J software in the Western blot.
Atg7 Gene and Protein
The Atg7 gene encodes an E1‐like activating enzyme that is essential for autophagy and cytoplasmic to vacuole transport. The Atg7 protein participates in the process of both the functioning of Atg3 and the formation of the Atg12 conjugation system. A higher expression of the gene or protein of Atg7 indicates a better functioning of Atg3, Atg5, and Atg12. The evaluation criterion of the Atg7 gene was calculated with the 2−△△Ct method in RT‐qPCR and the evaluation criterion of Atg7 protein was integrated density value, which was calculated by Image J software in the Western blot.
Statistical Analysis
Kolmogorov–Smirnov normality test was performed for each group of data, Mann–Whitney rank sum test was performed for those who did not conform to the normal distribution, independent sample T test was performed for those who conformed to the normal distribution, and Welch's correction was performed for those with uneven variance. ANOVA and the T test were adopted to test the statistical differences among multiple groups. Data were obtained from at least three independent tests. All statistical analyses was carried out using GraphPad Prism 6.0 software (La Jolla, CA, USA). The differences were deemed statistically significant with *P < 0.05.
Results
Effect of Weight‐Bearing and Stages in mRNA Expression of Atg3, Atg7, Atg12, LC3B, and P62
The mRNAs of autophagy‐related genes Atg3, Atg7, Atg12, and P62 in chondrocytes of different groups of OA animal model were detected by qRT‐PCR, and statistical analysis was conducted to compare whether the differences between them were statistically significant.
For the weight‐bearing area (Fig. 1), the mRNA expressions were higher in the 4‐week group than in the control group for Atg3 (60.297 ± 33.280 vs 1.109 ± 0.580, P < 0.0001), Atg7 (17.350 ± 11.750 vs 1.057 ± 0.335, P < 0.0001), Atg12 (5.998 ± 4.223 vs 1.010 ± 0.135, P < 0.01), and P62 (18.332 ± 6.930 vs 1.110 ± 0.571, P < 0.0001). It was also higher in the 10‐week group for Atg3 (60.297 ± 33.280 vs 25.167 ± 14.160, P < 0.01), Atg7 (17.350 ± 11.750 vs 5.559 ± 6.198, P < 0.01), Atg12 (5.998 ± 4.223 vs 1.600 ± 0.963, P < 0.01), and P62 (18.332 ± 6.930 vs 6.141 ± 4.026, P < 0.0001).
Fig. 1.
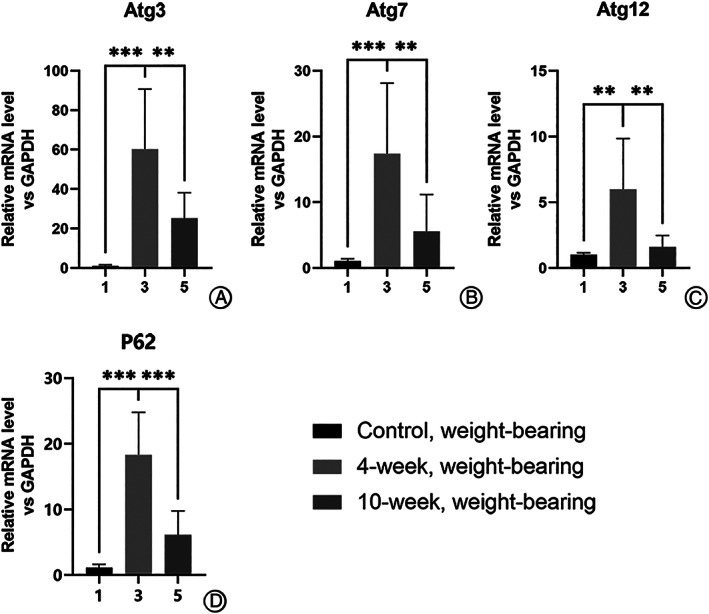
Difference in expression of autophagy genes in chondrocytes from weight‐bearing cartilage with different OA severity, illustrating expression of mRNA of autophagy‐related genes in the 4‐week group was the highest among the weight‐bearing samples. (A–D) All of the genes detected by RT‐qPCR showed difference with statistically significance between 4‐ and 10‐week groups or between 4‐week and control groups as for cartilage from the weight‐bearing area. *P < 0.05, **P < 0.01, ***P < 0.0001.
For the non‐weight‐bearing area (Fig. 2), the mRNA expressions were higher in the 4‐week group than in the control group for Atg3 (41.412 ± 18.250 vs 1.889 ± 1.830, P < 0.0001), Atg7 (20.941 ± 29.350 vs 1.057 ± 0.335, P < 0.0001), Atg12 (4.946 ± 6.340 vs 0.850 ± 0.067, P < 0.0001), and P62 (11.752 ± 18.220 vs 1.289 ± 1.099, p1.289 ± 1.099). It was also higher in the 10‐week group for Atg7 (20.941 ± 29.350 vs 2.923 ± 0.734, P < 0.0001) and P62 (11.752 ± 18.220 vs 6.721 ± 2.085, P < 0.05).
Fig. 2.
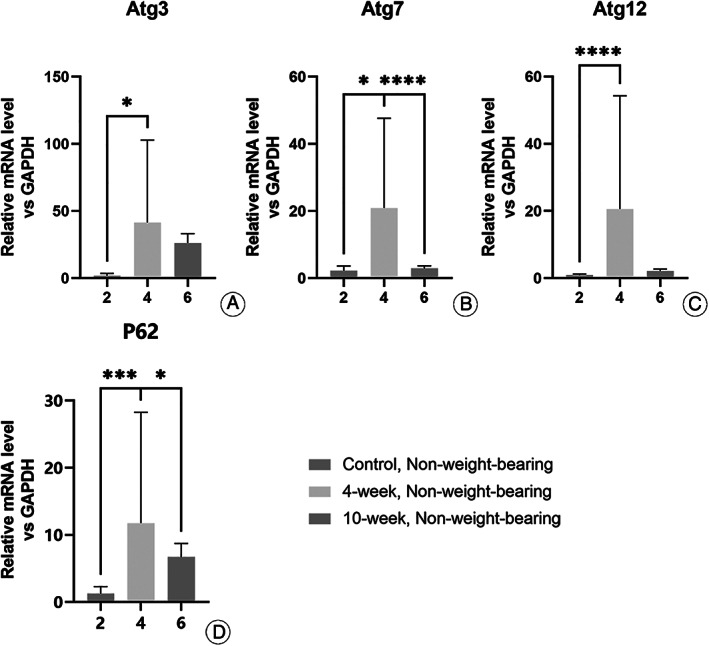
Difference in expression of autophagy genes in chondrocytes from non‐weight‐bearing cartilage with different OA severity. The expression of the genes detected were higher in the 4‐week group than in the control groups (A–D). Though the expression of the genes detected were higher in the 4‐week group than in the 10‐week group, statistical significance was only seen in Atg7 (B) and P62 (D). *P < 0.05, **P < 0.01, ***P < 0.0001.
In general, it was found that when the weight‐bearing cartilage of the 4‐week group (relatively mild) was compared with that of the 10‐week group (relatively severe), there were statistically significant differences in all the genes tested (Fig. 1). Even when comparing within the non‐weight‐bearing group, there were statistically significant differences in the expression of Atg7, Atg12, and P62.
Effect of Weight‐Bearing and Stages in the Protein Expression of Atg3, Atg7, Atg12, LC3B, and P62
Bands from Western blotting (Fig. 3) of autophagy related genes Atg3, Atg7, Atg12, LC3B, and P62 in chondrocytes of different groups of OA animal model were analyzed (Fig. 3), and statistical analyses was conducted to compare whether the differences between them were statistically significant.
Fig. 3.
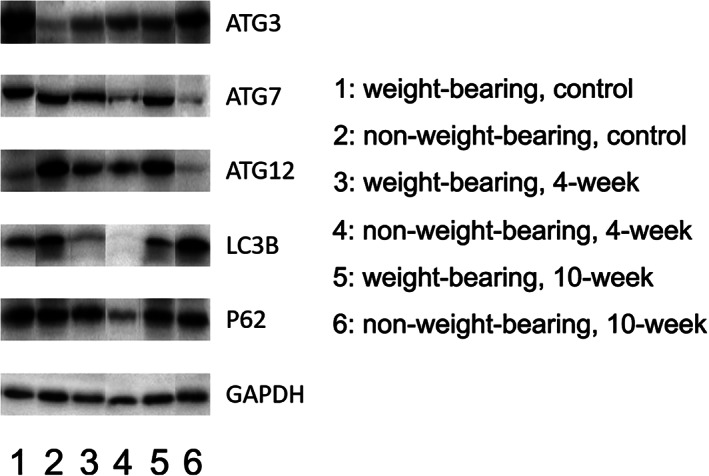
Bands of autophagy‐related genes in Western blotting. The integrated densities of the bands were calculated by Image J.
For the weight‐bearing area (Fig. 4), the protein expressions were higher in the 4‐week group than in the control group for Atg3 (1.165 ± 0.254 vs 0.444 ± 0.095), Atg12 (1.011 ± 0.407 vs 0.902 ± 0.036), LC3B (0.781 ± 0.070 vs 0.589 ± 0.062), and P62 (1.020 ± 0.086 vs 0.927 ± 0.086). It was also higher in the 10‐week group for Atg3 (1.165 ± 0.254 vs 0.432 ± 0.013), Atg7 (0.798 ± 0.288 vs 0.792 ± 0.091), Atg12 (1.011 ± 0.407 vs 0.674 ± 0.450), LC3B (0.781 ± 0.070 vs 0.520 ± 0.077), and P62 (1.020 ± 0.086 vs 0.807 ± 0.016). Yet none of these results showed statistical significance.
Fig. 4.
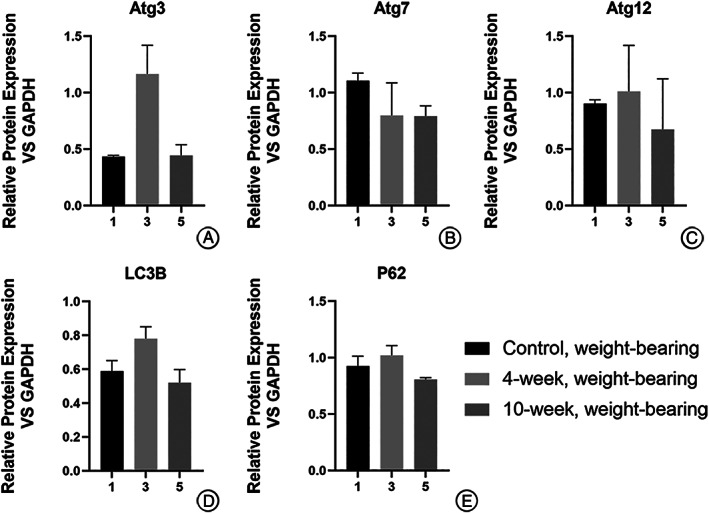
Difference in expression of autophagy‐related proteins in chondrocytes from weight‐bearing cartilage with different OA severity (calculated relative integrated density of the bands). None of these results showed statistical significance.
For the non‐weight‐bearing area (Fig. 5), the mRNA expressions were significantly higher in the 4‐week group than in the 10‐week group for Atg12 (1.295 ± 0.090 vs 0.196 ± 0.002, P < 0.01), or than in the control group for LC3B (1.358 ± 0.297 vs 0.009 ± 0.001, P < 0.05). The expression of proteins in the 10‐week group was also higher than that in the control group for LC3B (0.926 ± 0.003 vs 0.009 ± 0.001, P < 0.0001) and P62 (0.708 ± 0.06 vs 0.395 ± 0.041, P < 0.05).
Fig. 5.
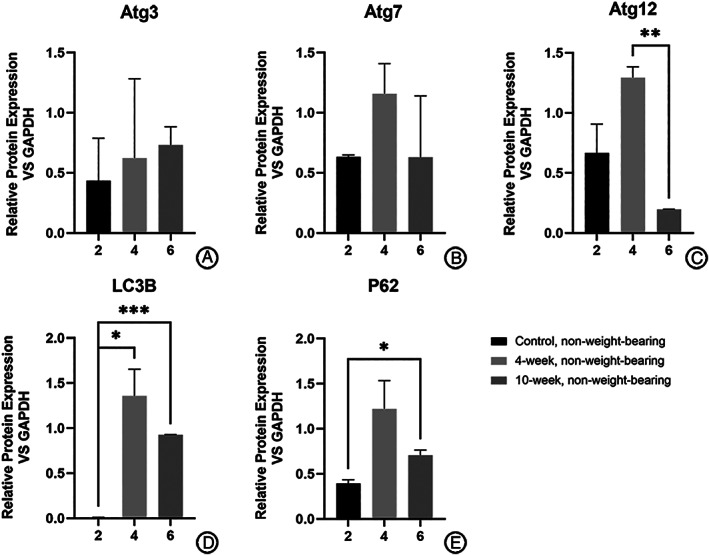
Difference in expression of autophagy‐related proteins in chondrocytes from non‐weight‐bearing cartilage with different OA severity (calculated relative integrated density of the bands). Expression of Atg12 in the 4‐ week group was higher than that of the 10‐week group (C) while expression of LC3B in the 4‐week group was higher than that of the control group (D). The expression of LC3B (D) and P62 (E) in the 10‐week group was higher than that of the control group.
For other genes detected, proteins expressed were higher in the 4‐week group than that in the control group for Atg3 (0.623 ± 0.661 vs 0.434 ± 0.354) and Atg7 (1.157 ± 0.251 vs 0.632 ± 0.018), none of which showed statistical significance.
In general, it can be found that if the 4‐week group (relatively mild) is compared with the 10‐week group (relatively severe), statistically significant results include Atg5, LC3B, and P62 in the non‐weight‐bearing zone; details are illustrated in Table 7. In addition, other proteins with different expressions include: LC3B in the non‐weight‐bearing zone between the control group and the 4‐week group; Atg12 in the non‐weight‐bearing zone between the control group and the 10‐week group; Atg7, LC3B, and P62 in the weight‐bearing zone and the non‐weight‐bearing zone in 4‐week group; LC3B in the weight‐bearing zone and the non‐weight‐bearing zone in the 10‐week group, etc.
Effect of Weight‐Bearing and Stages in the Formation of Autophagosomes
Autophagosomes of chondrocytes in animal models of different groups were observed with TEM (Fig. 6). The state of the cells in the weight‐bearing area was not as good as that in the non‐weight‐bearing area, with abnormal cell shape, nuclear shrinkage, more lipid vacuoles, and more autophagosomes. The autophagosomes in the non‐weight‐bearing area were only occasionally seen or not found in the field of vision. The number of autophagosomes in chondrocytes in the weight‐bearing zone at 4 weeks postoperative was more than that at 10 weeks postoperative. Therefore, the autophagy in the weight‐bearing zone was stronger than in the non‐weight‐bearing zone. The autophagy level in the 4‐week weight‐bearing area was stronger than that in the 10‐week weight‐bearing area, but the non‐weight‐bearing area was similar to that in the 10‐week group, and the difference could not be identified by the naked eye.
Fig. 6.
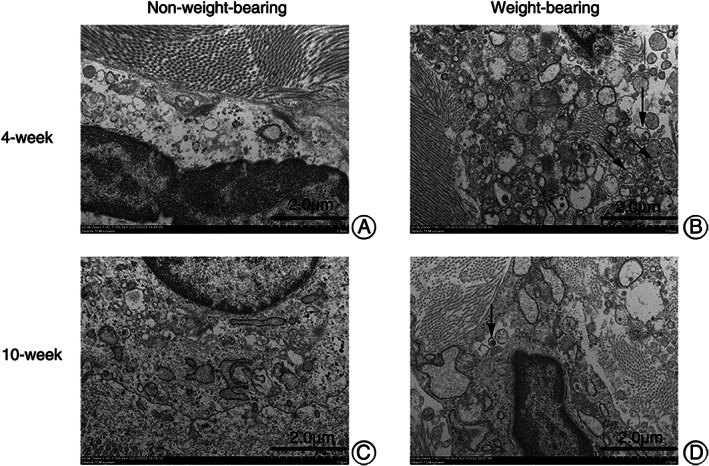
Autophagosomes in chondrocytes of OA animal models from different groups under TEM (x5.0k, 100.0kV, Hitachi TEM system). (A) almost normal chondrocytes. (C) chondrocytes with mild lesions. (B, D) chondrocytes from weight‐bearing area, shrunken in shape, with abnormal nuclei and more autophagosomes (black arrows) and lipid vacuoles.
As illustrated, autophagy in the weight‐bearing area is stronger than that in the non‐weight‐bearing area, and autophagy in the 4‐week group is stronger than that in the 10‐week group for the weight‐bearing area. Yet autophage of chondercyte from the non‐weight‐bearing area of 4‐week models is similar to 10‐week ones, which can be hardly distinguished.
Discussion
It has been demonstrated that there was an association between aging and OA in clinic and epidemiology. Risk factors associated with aging, such as limited tissue and cell regeneration, increased expression of inflammatory mediators, and oxidative stress, can damage cartilage matrix and cells, and promote the occurrence and development of OA 22 . In recent years, autophagy, as a protective mechanism in cells, has attracted much attention due to its role in regulating the aging process. When oxidative stress occurs, autophagy will be activated, but excessive oxidative stress will exceed the tolerance of autophagy, weaken its activity, and eventually lead to cell senescence and apoptosis 23 , 24 .
Autophagy is an important component of chondroptosis, and excessive autophagy may lead to autophagic cell death in chondrocytes. However, autophagy plays a dual role in chondrocyte fate because compelling studies have focused on the cell‐protective role of autophagy in OA development 12 , 25 , 26 , 27 . Almonte‐Becerril et al. found that the death of chondrocytes starts with apoptosis in the superficial and part of the middle zones of the cartilage at early stages of OA as a result of constant mechanical damage in the joint. As the degenerative process progresses, high incidence of active caspase 3 as well as LC3II expression are observed, showing that autophagy could be activated in the same cell, which indicates a combination of both processes. In contrast, apoptosis is the only mechanism observed in the deep zone due to the abnormal subchondral bone ossification during the OA pathogenesis 28 . Thus, autophagy‐related proteins such as ULK1, Beclin‐1, and LC3 are highly expressed in human chondrocyte clusters in the early stages of OA development, while the expression of these proteins decreases with age and is associated with increased apoptosis and decreased functions of chondrocytes 12 , 13 , 16 . Similar results were obtained in our present research.
In the PCR testing, the weight‐bearing cartilage of the 4‐week group (relatively mild disease) was compared with that of the 10‐week group (relatively severe disease), and the differences of detected gene expression levels were statistically significant. Analyzing the data above, we can see an increase of autophagy‐related gene expression in the 4‐week group. The trend was reversed in the 10‐week group; however, the difference of the expression of related genes compared with the control group was not statistically significant.
As we speculated, the phenomenon may be a result of the change in lesions during different courses of the disease. In the early stages of osteoarthritis when chondrocytes were slightly damaged, autophagy‐related genes are activated and began to play their roles in the protection of the cells. Defunct cytoplasmic macromolecules, membranes, and organelles are degraded and recycled to reduce damage to chondrocytes. However, when the damage of chondrocytes worsens during the disease progression, with decompensation of the recycling homeostasis, the expression of autophagy decreases. In the present research, we found that the difference in the autophagy at 4‐ and 10‐weeks was statistically significant, indicating that autophagy strength would vary with the progression of the severity of OA.
Yet the difference between the control group and the 10‐week group was not statistical significant. It may be indicating that the level of autophagy is decreasing after 4 weeks, but it was not significantly different from that of the healthy cases. We speculate that the degree of chondrocyte damage may not be so severe that there are still chondrocytes retaining the process of autophagy. As the disease progresses further, when the chondrocytes are critically destroyed and there are no chondrocytes available for recycling, the expression of autophagy may be deeply inhibited, presenting an opposite trend of autophagy at different stages of OA, as we hypothesized. Thus the reason for the fact that the difference between the 10‐week group and the control was not statistically significant is that there is limited observation duration, which means the autophagy may be weakened further if we extended the observation duration to 14 or 20 weeks after modeling, when the reverse trend appears. Of course, further experiments are needed to confirm this hypothesis.
We found increased protein expressions for Atg3, Atg12, P62, and LC3B in the weight‐bearing area of the 4‐week group compared with the other two groups, yet no statistical significance was reported in the expressions of proteins for Atg3, Atg7, Atg12, P62, or LC3B. For the non‐weight‐bearing area, the expression of Atg12 protein in the 4‐week group was higher than that of the 10‐week group, the expression of LC3B and P62 proteins in the 4‐week group were higher than that of the control group. Also the expression of Atg7 protein was higher in the 4‐week group than that of the other groups, yet without statistical significance.
Generally, the overall trend of the protein expression tested in the Western blot was consistent with the result of PCR with the expression in the 4‐week group higher than that of the other groups, though some of the differences were not so significant. The reason may be related with the fact that the content of proteins in cartilage is less than other types of tissue, which is more difficult to detect.
Electron microscopy also confirmed our hypothesis that autophagy is enhanced in the early stage of osteoarthritis, and gradually decreases with the progression of the disease, and the expression level of autophagy is different in different weight‐bearing states.
Inflammatory cytokines, mechanical stress, and aging can lead to increased levels of reactive oxygen species (ROS) in chondrocytes. Mitochondrial dysfunction is associated with elevated levels of ROS, which promote osteoarthritis by disrupting intracellular homeostasis signals 29 . One study showed that autophagy could eliminate intracellular production of ROS, including mitochondria and peroxisomes 30 , causing the accumulation of ROS with the decrement of autophagy 31 . Previous studies showed that mitochondrial function and autophagy regulation in chondrocytes are directly linked via the Akt–mTOR (mammalian target of rapamycin) pathway. Autophagy plays a critical role in protecting chondrocytes from oxidative stress 32 . In this present study, we believed that autophagy was activated to protect chondrocytes in the early stage of the disease with the growth of age and the aggravation of cartilage damage caused by mechanical stress in animal models. With the progression of the disease, cartilage damage is further aggravated, and chondrocytes are unable to reduce excessive ROS through autophagy, which leads to cell apoptosis and further inhibits the expression level of autophagy, leading to a downward trend in the expression level of autophagy.
Main Limitations
The sample size of animal models is small, there are only three models in each group, and the selected animals are rats;
The amount of cartilage specimens obtained by each model is small, which may affect the analysis effect.
In further studies, we will use rabbits to set up new models and expand the sample size, and continue to conduct more in‐depth research.
Conclusion
In the present research, we concluded that the expression level of autophagy is different in different stages of osteoarthritis. The level of autophagy increases in the early stage of osteoarthritis, and gradually decreases with the progression of the disease. Autophagy levels of chondrocytes in different weight‐bearing areas are also different. The present research is the first to focus on the corresponding changes of chondrocytes autophagy in cartilage with OA in different stages or severities, serving as a novel inspiration for the controversy on whether autophagy is up‐ or down‐regulated in OA.
Grant Sources: This work was funded by National Natural Science Foundation of China (Grant Number: 81772393) and Natural Science Foundation of Beijing (Grant Number: 7192214). No other conflicts of interest to be disclosed.
Contributor Information
Zheng Pei, Email: 18910891027@189.cn.
Zhen‐peng Guan, Email: guanzhenpeng@qq.com.
References
- 1. Culvenor AG, Engen CN, Oiestad BE, Engebretsen L, Risberg MA. Defining the presence of radiographic knee osteoarthritis: a comparison between the Kellgren and Lawrence system and OARSI atlas criteria. Knee Surg Sports Traumatol Arthrosc, 2015, 23: 3532–3539. [DOI] [PubMed] [Google Scholar]
- 2. Thysen S, Luyten FP, Lories RJ. Targets, models and challenges in osteoarthritis research. Dis Model Mech, 2015, 8: 17–30. [DOI] [PMC free article] [PubMed] [Google Scholar]
- 3. Zeng LY, Yang SY, Zhang ZQ, Wang T, Wang YZ, Wei XC. Effect of cholecystectomy on the occurrence of knee osteoarthritis. Orthop Surg, 2020, 12: 756–760. [DOI] [PMC free article] [PubMed] [Google Scholar]
- 4. Loeser RF, Goldring SR, Scanzello CR, Goldring MB. Osteoarthritis: a disease of the joint as an organ. Arthritis Rheum, 2012, 64: 1697–1707. [DOI] [PMC free article] [PubMed] [Google Scholar]
- 5. Lories R. The balance of tissue repair and remodeling in chronic arthritis. Nat Rev Rheumatol, 2011, 7: 700–707. [DOI] [PubMed] [Google Scholar]
- 6. Xie F, Liu YL, Chen XY, et al. Role of MicroRNA, LncRNA, and exosomes in the progression of osteoarthritis: a review of recent literature. Orthop Surg, 2020, 12: 708–716. [DOI] [PMC free article] [PubMed] [Google Scholar]
- 7. Eckstein F, Le Graverand MP. Plain radiography or magnetic resonance imaging (MRI): which is better in assessing outcome in clinical trials of disease‐modifying osteoarthritis drugs? Summary of a debate held at the world congress of osteoarthritis 2014. Semin Arthritis Rheum, 2015, 45: 251–256. [DOI] [PubMed] [Google Scholar]
- 8. Nakamura S, Yoshimori T. New insights into autophagosome‐lysosome fusion. J Cell Sci, 2017, 130: 1209–1216. [DOI] [PubMed] [Google Scholar]
- 9. Yu L, Chen Y, Tooze SA. Autophagy pathway: cellular and molecular mechanisms. Autophagy, 2018, 14: 207–215. [DOI] [PMC free article] [PubMed] [Google Scholar]
- 10. Shapiro IM, Layfield R, Lotz M, Settembre C, Whitehouse C. Boning up on autophagy: the role of autophagy in skeletal biology. Autophagy, 2014, 10: 7–19. [DOI] [PMC free article] [PubMed] [Google Scholar]
- 11. Zhang Q, Lai S, Hou X, Cao W, Zhang Y, Zhang Z. Protective effects of PI3K/Akt signal pathway induced cell autophagy in rat knee joint cartilage injury. Am J Transl Res, 2018, 10: 762–770. [PMC free article] [PubMed] [Google Scholar]
- 12. Carames B, Taniguchi N, Otsuki S, Blanco FJ, Lotz M. Autophagy is a protective mechanism in normal cartilage, and its aging‐related loss is linked with cell death and osteoarthritis. Arthritis Rheum, 2010, 62: 791–801. [DOI] [PMC free article] [PubMed] [Google Scholar]
- 13. Carames B, Olmer M, Kiosses WB, Lotz MK. The relationship of autophagy defects to cartilage damage during joint aging in a mouse model. Arthritis Rheumatol, 2015, 67: 1568–1576. [DOI] [PMC free article] [PubMed] [Google Scholar]
- 14. Zhang Y, Vasheghani F, Li YH, et al. Cartilage‐specific deletion of mTOR upregulates autophagy and protects mice from osteoarthritis. Ann Rheum Dis, 2015, 74: 1432–1440. [DOI] [PubMed] [Google Scholar]
- 15. Zhang X, Yang Y, Li X, Zhang H, Gang Y, Bai L. Alterations of autophagy in knee cartilage by treatment with treadmill exercise in a rat osteoarthritis model. Int J Mol Med, 2019, 43: 336–344. [DOI] [PMC free article] [PubMed] [Google Scholar]
- 16. Sasaki H, Takayama K, Matsushita T, et al. Autophagy modulates osteoarthritis‐related gene expression in human chondrocytes. Arthritis Rheum, 2012, 64: 1920–1928. [DOI] [PubMed] [Google Scholar]
- 17. Carames B, Taniguchi N, Seino D, Blanco FJ, D'Lima D, Lotz M. Mechanical injury suppresses autophagy regulators and pharmacologic activation of autophagy results in chondroprotection. Arthritis Rheum, 2012, 64: 1182–1192. [DOI] [PMC free article] [PubMed] [Google Scholar]
- 18. Xu HG. Autophagy protects endplate chondrocytes from intermittent cyclic mechanical tension induced calcification. Bone, 2015, 75: 242–243. [DOI] [PubMed] [Google Scholar]
- 19. Quan M, Hong MW, Ko MS, Kim YY. Relationships between disc degeneration and autophagy expression in human nucleus pulposus. Orthop Surg, 2020, 12: 312–320. [DOI] [PMC free article] [PubMed] [Google Scholar]
- 20. Fagerberg L, Hallstrom BM, Oksvold P, et al. Analysis of the human tissue‐specific expression by genome‐wide integration of transcriptomics and antibody‐based proteomics. Mol Cell Proteomics, 2014, 13: 397–406. [DOI] [PMC free article] [PubMed] [Google Scholar]
- 21. Mizushima N, Yoshimori T, Ohsumi Y. The role of Atg proteins in autophagosome formation. Annu Rev Cell Dev Biol, 2011, 27: 107–132. [DOI] [PubMed] [Google Scholar]
- 22. Rahmati M, Nalesso G, Mobasheri A, Mozafari M. Aging and osteoarthritis: central role of the extracellular matrix. Ageing Res Rev, 2017, 40: 20–30. [DOI] [PubMed] [Google Scholar]
- 23. Roca‐Agujetas V, de Dios C, Leston L, Mari M, Morales A, Colell A. Recent insights into the mitochondrial role in autophagy and its regulation by oxidative stress. Oxid Med Cell Longev, 2019, 2019: 3809308. [DOI] [PMC free article] [PubMed] [Google Scholar]
- 24. Zhang KS, Wang JF, Zhang SL, Li Z, Pei Z, Guan ZP. Effects of tumor necrosis factor alpha on the expression of programmed cell death factor 5 in arthritis. Orthop Surg, 2019, 11: 698–704. [DOI] [PMC free article] [PubMed] [Google Scholar]
- 25. Ribeiro M, Lopez de Figueroa P, Blanco FJ, Mendes AF, Carames B. Insulin decreases autophagy and leads to cartilage degradation. Osteoarthr Cartil, 2016, 24: 731–739. [DOI] [PubMed] [Google Scholar]
- 26. Ribeiro M, Lopez de Figueroa P, Nogueira‐Recalde U, et al. Diabetes‐accelerated experimental osteoarthritis is prevented by autophagy activation. Osteoarthr Cartil, 2016, 24: 2116–2125. [DOI] [PubMed] [Google Scholar]
- 27. Lopez de Figueroa P, Lotz MK, Blanco FJ, Carames B. Autophagy activation and protection from mitochondrial dysfunction in human chondrocytes. Arthritis Rheumatol, 2015, 67: 966–976. [DOI] [PMC free article] [PubMed] [Google Scholar]
- 28. Almonte‐Becerril M, Navarro‐Garcia F, Gonzalez‐Robles A, Vega‐Lopez MA, Lavalle C, Kouri JB. Cell death of chondrocytes is a combination between apoptosis and autophagy during the pathogenesis of osteoarthritis within an experimental model. Apoptosis, 2010, 15: 631–638. [DOI] [PubMed] [Google Scholar]
- 29. Collins JA, Diekman BO, Loeser RF. Targeting aging for disease modification in osteoarthritis. Curr Opin Rheumatol, 2018, 30: 101–107. [DOI] [PMC free article] [PubMed] [Google Scholar]
- 30. Kongara S, Karantza V. The interplay between autophagy and ROS in tumorigenesis. Front Oncol, 2012, 2: 171. [DOI] [PMC free article] [PubMed] [Google Scholar]
- 31. Scherz‐Shouval R, Elazar Z. ROS, mitochondria and the regulation of autophagy. Trends Cell Biol, 2007, 17: 422–427. [DOI] [PubMed] [Google Scholar]
- 32. Barranco C. Osteoarthritis: activate autophagy to prevent cartilage degeneration?. Nat Rev Rheumatol, 2015, 11: 127. [DOI] [PubMed] [Google Scholar]


