

Abstract
Background
Accumulating studies have suggested the airway microbiota in lung cancer patients is significantly different from that of healthy controls. However, little is known about the relationship between airway microbiota and important clinical parameters of lung cancer. In this study, we aimed to explore the association between sputum microbiota and lung cancer stage, lymph node metastasis, intrathoracic metastasis, and epidermal growth factor receptor (EGFR) gene mutation.
Methods
The microbiota of sputum samples from 85 newly‐diagnosed NSCLC patients were sequenced via 16S rRNA sequencing of the V3–V4 region. Sequencing reads were filtered using QIIME2 and clustered against UPARSE.
Results
Alpha‐ and β‐diversity was significantly different between patients in stages I to II (early stage, ES) and patients in stages III to IV (advanced stage, AS). Linear discriminant analysis Effect Size (LEfSe) identified that genera Granulicatella and Actinobacillus were significantly enriched in ES, and the genus Actinomyces was significantly enriched in AS. PICRUSt2 identified that the NAD salvage pathway was significantly enriched in AS, which was positively associated with Granulicatella. Patients with intrathoracic metastasis were associated with increased genus Peptostreptococcus and incomplete reductive TCA cycle, which was associated with increased Peptostreptococcus. Genera Parvimonas, Pseudomona and L‐valine biosynthesis were positively associated with lymph node metastasis. L‐valine biosynthesis was related with increased Pseudomona. Finally, the genus Parvimonas was significantly enriched in adenocarcinoma patients with EGFR mutation.
Conclusion
The taxonomy structure differed between different lung cancer stages. The tumor stage, intrathoracic metastasis, lymph node metastasis, and EGFR mutation were associated with alteration of specific airway genera and metabolic function of sputum microbiota.
Keywords: 16S rRNA sequencing, airway microbiota, EGFR gene, lung cancer, metastasis
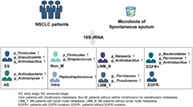
We conducted a cross‐sectional study to investigate the relationship between spontaneous sputum microbiota and non‐small cell lung cancer. The microbiota of sputum samples from 85 newly‐diagnosed NSCLC patients were sequenced via 16S rRNA sequencing of the V3–V4 region. The most important finding of our study is we found that tumor stage, intrathoracic metastasis, lymph node metastasis, and EGFR mutation were associated with alteration of specific airway genera and phyla. The specific taxonomies which were enriched in each subtype of lung cancer are listed in the graphical abstract image.
INTRODUCTION
Lung cancer is the second leading malignancy for morbidity and the first for cancer deaths worldwide. 1 Even with the development of target therapy and immunotherapy, the 5‐year survival rate of lung cancer remains low, especially in metastatic disease. 2 Historically speaking, the lung has been considered sterile in health. However, with the advent of novel culture‐independent techniques, subsequent studies have identified that healthy lung is inhabited by distinct commensal microbiota, which is altered in multiple lung diseases. 3 Therefore, exploring the relationship between the lung microbiome and lung cancer is of great interest.
Accumulating studies have suggested that the airway microbiota of lung cancer patients is significantly different from healthy or benign controls, 4 , 5 , 6 , 7 , 8 , 9 , 10 , 11 implying that airway microbiota may contribute to the development of lung cancer, or be affected during lung cancer progression. More specifically, the α‐diversity, 6 , 8 , 9 , 11 β‐diversity, 5 , 6 , 9 , 10 , 11 and some specific genera 4 , 5 , 6 , 7 , 8 , 9 , 10 , 11 are changed among non‐small cell lung cancer (NSCLC) patients. To date, the study of lung microbiota and lung cancer is still in its infancy and in depth knowledge of the interplay between lung cancer with different clinical parameters and lung microbiota needs to be explored further. TNM stage remains the most important prognostic factor in predicting recurrence rates and survival time. The 5‐year‐survival rate of lung cancer patients is significantly affected by tumor anatomic stages, from 87%–97% of stage I to 10%–23% of stage IV. 12 Through the analysis of 165 cases with normal tissue adjacent to lung cancer, an earlier study found that α‐diversity and the genus Thermus was more abundant in the late stage (stage IIIB and IV) than that in the early stage disease patients 13 suggesting that lung microbiota participate in the development of different stages of lung cancer. However, the study only included seven stage IIIB patients and seven stage IV patients. Therefore, more studies regarding the association between tumor anatomic stage and lung microbiota should be conducted to determine more potential bacterial markers linked with the stepwise change of lung cancer from early to late stage.
Lung cancer staging traditionally relies on the TNM staging system. Since the stage of lung cancer is associated with lung microbiota, detailed understanding regarding the association between N, M classifications and lung microbiota should be explored. Previous studies have suggested that specific genera might be engaged with the metastasis of lung cancer patients. 13 , 14 In vivo mechanistic investigations found that certain species might contribute to the development of extra or intrathoracic metastasis via enhancement of adhesion of lung cancer cells or regulation of lung immune system. 15 , 16 , 17 Therefore, it is plausible to hypothesize that the lung microbiota may be identified as relevant to N and M classification.
Epidermal growth factor receptor (EGFR) is a paramount therapeutic target for the treatment of lung cancer. Tyrosine kinase inhibitors (TKIs), which target the kinase domain of EGFR, are especially effective in NSCLC patients whose tumors harbor activating mutations in the tyrosine kinase domain of the EGFR gene. Bacteria that carry genotoxic markers have previously been reported to promote the accumulation of genetic lesions and initiate cancer development. 18 Current studies have suggested that some pathogens might play a role in driving EGFR gene mutation. A retrospective study found lung adenocarcinoma patients who had tuberculosis lesions had a higher probability of having EGFR gene mutations. 19 Another early study demonstrated an association between human papillomavirus and EGFR gene mutation in lung cancer patients. 20 Conversely, EGFR mutation might also regulate the lung microbiome since it has previously been reported to play a role in maintaining airway epithelial barrier via activation of Claudin 1, a member of the tight junction protein. 21 However, the association between EGFR gene mutation and lung microbiota is unknown. Thus, it is plausible that lung microbiota may have a connection with EGFR gene mutation among NSCLC patients.
In this study, we used next‐generation sequencing to identify airway microbiota in the spontaneous sputum of NSCLC patients, aiming to characterize airway microbiota in NSCLC patients at different tumor stages (including tumor stage and TNM classification), and EGFR gene mutation.
METHODS
Patients and samples
The study was approved by the Ethics Committee of Nanfang Hospital, Southern Medical University. Patients diagnosed with NSCLC were prospectively admitted into the study at NanFang Hospital, Southern Medical University between April 2017 and September 2019. The inclusion criteria were as follows: pathologically diagnosed with NSCLC; patients aged 30–80; did not receive any antitumor therapy such as surgery, radiotherapy, chemotherapy, targeted therapy or immunotherapy; no evidence of community‐acquired pneumonia, acute exacerbation of chronic obstructive pulmonary disease, bronchiectasis with infection, acute bronchitis or asthma; had no fever or purulent or gray sputum; and without a history of other malignant diseases or multiple primary lung cancer. We conducted a questionnaire and reviewed the electronic medical records to obtain demographic and clinical data including age, sex, smoking status, use of antibiotics within 1 month, TNM stage, systemic or pulmonary comorbidities and tumor EFGR mutation. Tumor anatomic stage and TNM classification was based on the NCNN clinical practice Guidelines of NSCLC (Version 2020. V1). EGFR mutation was detected based on the ARMS technology in the pathology department of Nanfang Hospital.
Participants were asked to rinse their mouths before sampling. The first mouthful of phlegm in the morning was collected within 24 h of hospitalization and transferred into −20°C refrigerators within 2 h and then stored at −80°C within 1 week. A spontaneous sputum sample was identified as qualified sputum based on the presence of bronchial cells.
DNA extraction, 16S rRNA amplification, 16S rRNA sequencing
Sputum samples kept on dry ice were transferred to Sagene Biotechnology Company, GuangZhou. DNA was extracted from samples using Hipure bacterial DNA kit using standard techniques. The V3–V4 region of the 16S rRNA gene was amplified using specific primers (16S_341F:5′‐CCTAYGGGRBGCASCAG‐3′;16S_806R:5‐GGACTACNNGGGTATCTAAT). PrimeSTAR HS DNA polymerase was used for PCR reaction. The concentration and length of the PCR products was detected by 1% agarose gel electrophoresis. Samples with a bright main strip were used for further experiments. Sequencing libraries were conducted using the NEBNext Ultra DNA Library Prep Kit for Illumina sequencing (New England Biolabs). The quality of the library was evaluated under a Qubit 2.0 fluorometer (Thermo Scientific) and Agilent bioanalyzer 2100 system. Sequencing was conducted to generate 250‐bp paired‐end reads using an Illumina HiSeq 2500 sequencer according to the manufacturer's instructions.
Microbiota analysis
Raw data was obtained and then further filtered to eliminate reads with adapter pollution and low quality to obtain clean reads by using QIIME2. 22 Clean sequences were clustered by 97% identity into operational taxonomic units (OTUs) using UPARSE. 23 A representative sequence of each OTU was annotated into taxonomy against Greengenes database. 24
We applied OTU data in an online microbiome data analyses platform (MicrobiomeAnalyst) (https://www.microbiomeanalyst.ca/) to compare microbiota community structure at both intercommunity and α‐ and β‐diversity levels. For α‐diversity, we chose Chao1 value, Simpson index and Shannon index for evaluation. For β‐diversity, we used the Bray‐Curtis distance for estimation and principal coordinate analysis (PCoA) for visualization of data. Differential taxonomy was identified by linear discriminant analysis (LDA) Effect Size (LEfSe) analysis in an online platform (GALAXY) (http://huttenhower.sph.harvard.edu/galaxy). PICRUSt2 was used to predict the functional profiling of microbial communities based on the 16S rRNA sequence. 25 Metabolic function predictions were based on the MetaCyc 26 database. Differentially present pathways between groups were analyzed with Welch's t‐test using STAMP. 27 The network analysis on the genus level was carried out with SparCC. 28 p‐value ≤ 0.05 and SparCC correlation scores ≥0.5 or ≤ −0.5 were included for network inference.
Statistical analysis
SPSS (V 23.0) software was used for statistical analysis. The continuous variables were compared between two groups by Mann–Whitney U test or independent t‐test. The categorical variables were compared by chi‐square test, continuity‐adjusted chi‐square test, and Fisher's exact test. p‐values < 0.05 were considered statistically significant.
RESULTS
Patient clinical characteristics and sputum microbiota in NSCLC
Spontaneous sputum samples were preliminarily collected from 116 NSCLC patients. After careful assessment, 85 patients who met the eligibility criteria were finally analysed. The procedure of patient recruitment and exclusion is shown in Figure 1. The average number of trimmed sequences reads number of the 85 subjects was 33 271 (7869, 44 193). An OTU rarefaction curve was constructed to evaluate sequencing depth (Figure S1). The results indicated that sequencing depth of sputum samples was sufficient to reach a reliable estimate of microbiome structure. The median age of all patients was 59.21 ± 8.75 years. The clinical characteristics of the 85 patients are listed in Table S1. Among the 85 patients, 66 (78%) had adenocarcinoma, 18 (21%) had squamous cell carcinoma, and one was an unidentified type of NSCLC. Thirteen (15%) patients were tumor stage I, nine (11%) were stage II, 11 (13%) were stage III and 40 (47%) were stage IV.
FIGURE 1.
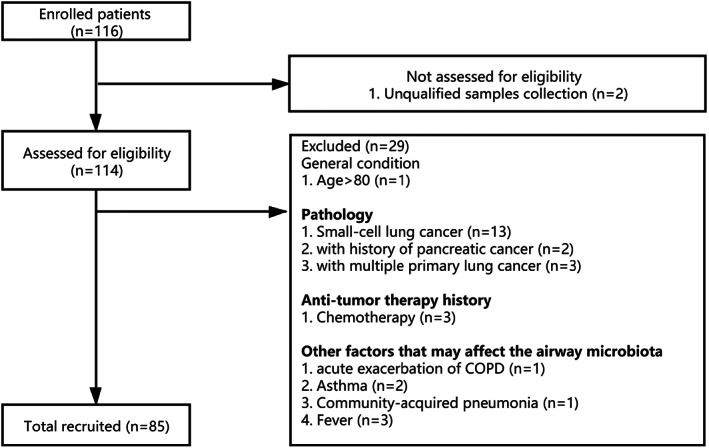
Study flow diagram of patient recruitment and exclusion
Phyla and genera that were ≥1% were considered as dominant. At the phylum level, the dominant phyla in the sputum samples of NSCLC patients were Firmicutes (40%), Bacteroidetes (20%), Actinobacteria (17%), Proteobacteria (13%), Fusobacteria (6%), and TM7 (3%) (Figure S2(a)). At the genus level, the dominant genera in the sputum samples of NSCLC were Streptococcus (21%), Prevotella (12%), Rothia (9%) and Neisseria (7%), Actinomyces (5%), Leptotrichia (4%), Porphyromona (4%), Veillonella (4%), Granulicatella (3%), Haemophilus (3%), Atopobium (2%), Peptostreptococcus (2%), Capnocytophaga (2%), and Fusobacterium (1%) (Figure S2(b)).
Association between sputum microbiota and NSCLC clinical stage
Stage III and stage IV lung cancer patients are on a continuum with respect to tumor burden. It is well accepted that a great number of lung cancer patients with anatomical stage III disease also harbor micrometastases. A previous study found that the α‐diversity of microbiota of nonmalignant tissues adjacent to stage IIIB lung tumor tissues was similar to that of stage IV, 13 suggesting that the airway microbiota may be similar between stage III and stage IV lung cancer patients. To evaluate the similarity of microbiota between stage III and stage IV patients, we compared the sputum microbiota between these two groups via diversity analysis and differential analysis. Among the 11 stage III NSCLC patients, four were stage IIIA, five were stage IIIB, and two were stage IIIC. Baseline information included age (independent samples t‐test, p = 0.21), BMI index (Mann–Whitney U test, p = 0.536), smoking status (continuity‐adjusted chi‐square test, p = 0.249), treatment with antibiotics before sampling (continuity‐adjusted chi‐square test, p = 0.121), and pathological type (continuity‐adjusted chi‐square test, p = 0.191) was comparable between the groups. Chao1, Simpson index, and Shannon index were selected to estimate the α‐diversity of the lung microbiome community. α‐diversity between stage III and stage IV patients was similar (Mann–Whitney U test, p = 0.519 for Shannon; p = 0.783 for chao1; p = 0.261 for Simpson index) (Figure S3(a–c)). β‐diversity based on Bray Curtis distance was used to estimate the β‐diversity of lung taxonomy community structure in different groups. The results showed that there was no significant difference in taxonomy structure between stage III and stage IV patients (PERMANOVA test, p = 0.905) (Figure S3(d)). LEfSe analysis was conducted to identify whether differential taxonomy existed between stage III and stage IV patients. Only the genus Paludibacter was found to be significantly different between the two groups (Figure S3(e)). The relative abundance of Paludibacter was only 0.01% in stage III and 0.05% in stage IV patients. Taken together, the results above suggested that sputum microbiome of stage III and stage IV patients was similar.
Since the sputum microbiome of stage III and stage IV was similar, we divided the lung cancer patients into two groups: stage I and stage II (early stage, ES) and stage III and stage IV (advanced stage, AS) and evaluated the microbiota difference between the two groups. Baseline information including demographic and clinical characteristics were comparable between the AS and ES groups (Table S2). The relative abundance of the phylum and genus levels of the ES and AS groups are shown in Figures 2(a) and (b). For the α‐diversity, there was a significant difference in the Chao1 index between the ES and AS groups. The Chao1 index was 221.529 (42.976) in the ES group and 198.752398 (42.20770) in the AS group (Mann–Whitney U test, p = 0.038) (Figure 3(a)). Simpson index was 0.907 (0.064) in ES patients and 0.919 (0.050) in AS patients (p = 0.705) (Figure 3(b)). The Shannon index was 3.398 (0.541) in the ES group and 3.419 (0.448) in the AS group (p = 0.815) (Figure 3(c). For β‐diversity, Bray Curtis distance based on genus level was performed. The results showed that there was significantly different taxonomy structure between patients in the ES and AS groups (genus level, PERMANOVA test, p = 0.045) (Figure 3(d)).
FIGURE 2.
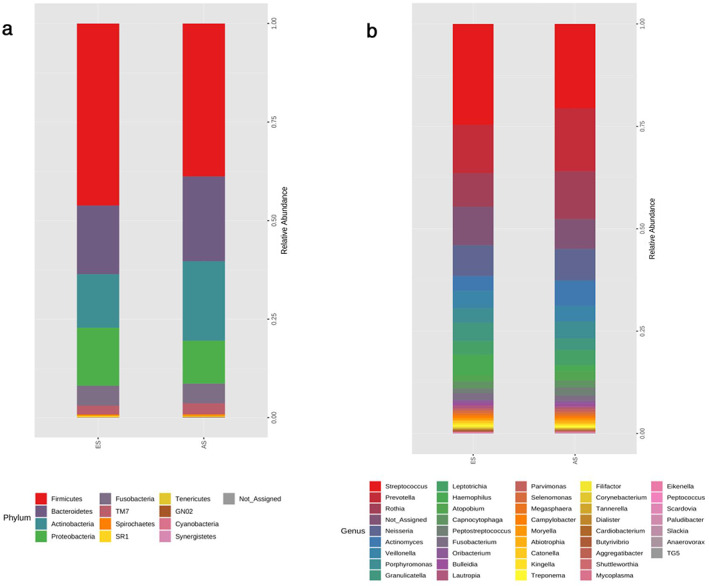
Taxonomic composition of sputum microbiota of the patients in the early stage (ES) and advanced stage (AS) groups. (a) Sputum phyla of the patients in the ES and AS groups; (b) sputum genera of the patients in the ES and AS groups
FIGURE 3.
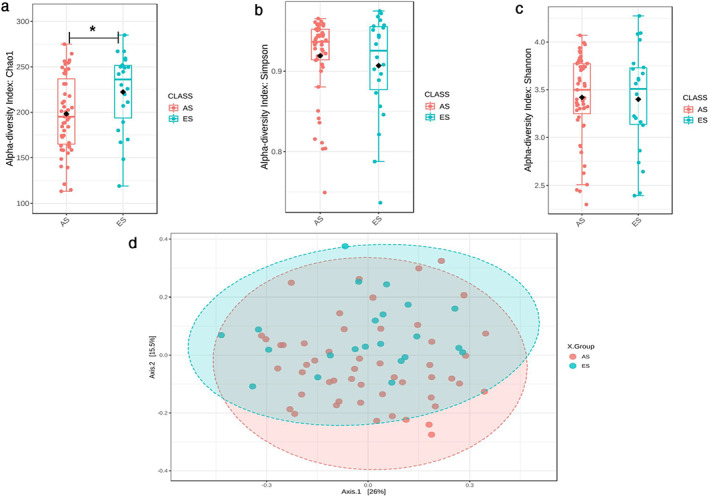
Difference of sputum microbiota between NSCLC patients in the early stage (ES) and advanced stage (AS) groups. (a) Chao 1 index; (b) Simpson index; (c) Shannon index among NSCLC patients in the ES and AS groups; (d) PCOA plot based on Bray‐Curtis distance of sputum genus among NSCLC patients in the ES and AS groups. *p < 0.05, p was calculated using the Mann–Whitney U test
Differential analysis using LEfSe identified that phylum Firmicutes, genera Peptoniphilus, Granulicatella, Hylemonella, Actinobacillus, SMB53 and Gemella were significantly enriched in ES group, and phylum Actinobacteria, genus Actinomyces were significantly enriched in AS group (Figure 4(a)). The relative abundance of phyla Firmicutes and Actinobacteria, genera Granulicatella, Actinomyces and Actinobacillus were ≥0.1% and are shown in Figure 4(b,c).
FIGURE 4.
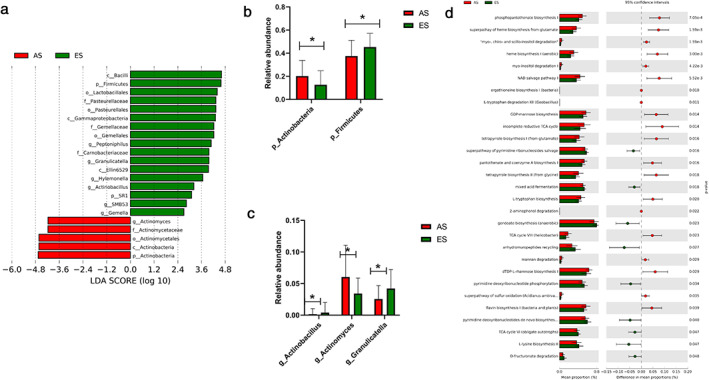
Differentially abundant taxonomy and predicted metabolic function of sputum microbiota between NSCLC patients in the early stage (ES) and advanced stage (AS) groups. (a) Differentially abundant taxonomy between patients in the ES and AS groups identified by LEfSe; (b) differentially abundant phyla Actinobacteria, Firmicutes between the ES and AS groups; (c) differentially abundant genera Actinobacillus, Actinomyces and Granulicatella between SCC_M1 and AD_M1; (d) differential predicted metabolic function based on the MetaCyc database between patients in the ES and AS groups. *p < 0.05, calculated using the Mann–Whitney U test
Functional analysis based on metaCyc database identified 29 differentially abundant pathways (Figure 4(d)). The largest three pathways which had higher proportion in ES patients were anhydromuropeptides recycling, gondoate biosynthesis (anaerobic) and L‐lysine biosynthesis II. For the differential abundant pathways had higher relative abundance in the AS group, incomplete reductive tricarboxylic acid (TCA) cycle, NAD salvage pathway I and phosphopantothenate biosynthesis I were the top three differentially abundant pathways. Genus Actinomyces was positively correlated with the NAD salvage pathway (Spearman's rank correlation, p value < 0.0001, r = 0.547).
Coabundance analysis based on SparCC was conducted. The sputum microbiota structure of ES lung cancer patients was more complex and better organized than the taxonomy structure inferred for patients in the AS group (Figure 5(a,b)). The taxonomy structure of ES group was composed of 33 genera while the structure inferred for AS group was composed of 19 genera. The number of intergenus correlations in ES group was 78, while only 44 in the AS group. The interactions between genus Streptococcus and other genera (Porphyromonas, Prevotella, Capnocytophaga, Veillonella, Atopobium, Actinomyces, Rothia, Granulicatella) were exclusively co‐occurrence in the AS group. Co‐occurrence between Actinomyces and genera Rothia and Atopobium was ubiquitous among two groups, while co‐occurrence between Actinomyces and genera Granulicatella, Veillonella, Prevotella and Streptococcus were exclusive in AS group.
FIGURE 5.
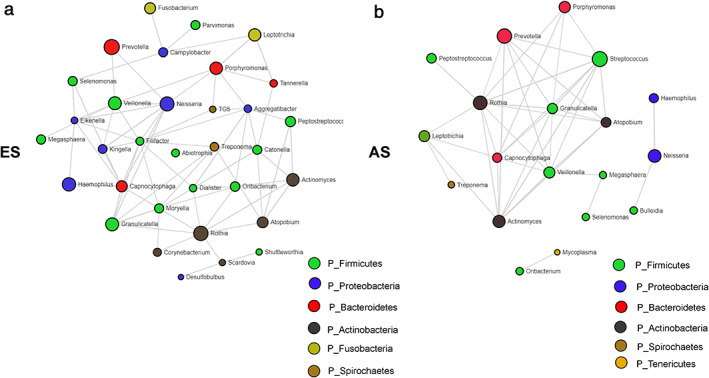
Genera co‐occurrence network based on SparCC of patients in (a) the early stage (ES) group; (b) advanced stage (AS) groups. Only p‐value ≤ 0.05 and SparCC correlation scores ≥0.5 or ≤−0.5 were included for networks inference. The genus nodes are colored based on phylum level. The size of each node was determined by the relative abundance of each genus
Role of sputum microbiota on NSCLC intrathoracic metastasis and lymph node metastasis
Since tumor stage is associated with the organism metastasis and lymph node metastasis, a further analysis was conducted to explore the linkage between sputum microbiota and these clinical parameters.
Previous studies in mice suggested that the homeostasis of commensal lung microbiota may affect intrathoracic metastasis 17 and extrathoracic metastasis 15 and these two phenomena may depend on different mechanisms. Thus, we hypothesized that airway microbiota associated with intrathoracic (ipsilateral or contralateral lung metastasis or pleural metastasis) and extrathoracic metastasis was different. Among the 85 NSCLC patients, 15 had intrathoracic metastasis and without extrathoracic metastasis (Intra group), only three patients had extrathoracic metastasis and without intrathoracic metastasis, and 28 were without neither intrathoracic nor extrathoracic metastasis (Non_M group). We further explored the characterization of sputum microbiota among the Intra‐ and Non_M group patients. Baseline information was comparable between the Intra‐ and Non_M groups (Table S3). α‐diversity index between the two groups was similar (p = 0.6192 for chao1; p = 0.1668 for Simpson index; p = 0.2193 for Shannon) (Figure S4(a–c)). ß‐diversity based on Bray Curtis distance was used and the result showed that taxonomy structure between the Intra‐ and Non_M groups was similar (PERMANOVA test, p = 0.197) (Figure S4(d)).
LEfSe analysis showed that compared with Non‐M patients, genera Peptostreptococcus, Peptococcus, Parabacteroides, and Escherichia were significantly enriched in the Intra group patients, while phylum Firmicutes and genus Streptococcus were significantly decreased (Figure S5(a)). The relative abundance of phylum Firmicutes and genera Peptostreptococcus and Streptococcus were ≥0.1% and are listed in Figure S5(b,c).
Functional analysis based on metaCyc database identified 31 differentially abundant pathways (Figure S5(d)). The largest three pathways which had a higher proportion in Intra patients were incomplete reductive TCA cycle, and tetrapyrrole biosynthesis II (from glycine), tetrapyrrole biosynthesis I (from glutamate). The differential abundant pathways had higher relative abundance in the Non_M group, purine ribonucleosides degradation, lactose and galactose degradation I, and L‐lysine biosynthesis II were the top three differentially abundant pathways. Genus Peptostreptococcus was positively correlated with the incomplete reductive TCA cycle (Spearman's rank correlation, p‐value = 0.017, r = 0.5779).
Next, we explored the association between sputum microbiota and lymph node metastasis. Among 28 patients at M0 stage, 12 were in N1‐3 stage (LNM_Y) and 16 were in N0 stage (LNM_N). Baseline information was comparable between the LNM_Y and LNM_N groups (Table S4). Alpha‐diversity analysis indicated that Chao 1 (p = 0.0593), Simpson (p = 1.000), and Shannon (p = 0.9818) index were similar between the two groups (Figure S6(a–c)). Beta‐diversity analysis based on Bray Curtis distance showed that there was no significant difference in the bacterial community between the two groups (PERMANOVA test, p = 0.091) (Figure S6(d)).
Compared with LNM_N, genera Parvimonas and Pseudomona were significantly increased in LNM_Y, while phylum Proteobacteria and genera Neisseria, Actinobacillus, Eikenella were significantly declined in LNM_Y (Figure S7(a)). All the above mentioned differential taxonomy except for genus Eikenella was ≥0.1%. The relative abundance of each differential genus and phylum are listed in Figure S7(b,c).
Functional profile prediction based on MetaCyc database identified 23 differential metabolic pathways (Figure S7(d)). L‐valine biosynthesis, L‐isoleucine biosynthesis I (from threonine), L‐isoleucine biosynthesis II were the top three differential pathways that were more abundant in the LNM_Y group. Anhydromuropeptides recycling, 8‐amino‐7‐oxononanoate biosynthesis I, biotin biosynthesis I and ppGpp biosynthesis were the top three differential pathways that were more enriched in the LNM_N group. The genus Pseudomonas was associated with L‐valine biosynthesis (Spearman's rank correlation, p‐value = 0.012, r = 0.468).
Association between sputum microbiota and NSCLC EGFR gene mutation
Among the 65 lung adenocarcinoma patients, the results of 44 patients who had undergone EGFR mutation testing were available in the subgroup analysis. The results confirmed that 21 were EGFR mutation‐positive (EGFR+), and 23 were EGFR mutation‐negative (EGFR−). Patients with EGFR mutation were more likely to be never smokers (Fisher's exact test, p = 0.036) and female (Fisher's exact test, p = 0.031). Other baseline information included age, BMI, tumor stage, and antibiotic usage was comparable between both groups (Table S5).
Alpha‐diversity between EGFR+ and EGFR− was similar (p = 0.1054 for chao1; p = 0.1532 for Simpson index; p = 0.0820 for Shannon) (Figure S8(a–c)). Beta‐diversity based on Bray Curtis distance was conducted to estimate the bacterial community composition in different groups. The results showed that there was no association between EGFR mutation and airway taxonomy structure (PERMANOVA test, p = 0.212) (Figure S8(d)).
LEfSe analysis identified that EGFR mutation was associated with a significantly enriched level of phyla Bacteroidetes and Tenericutes, genera Sharpea, Prevotella, Porphyromonas, Parvimonas, Desulfovibrio, Mycoplasma, Actinobacillus, Dialister, and Eikenella (Figure 6(a)). Subgroup analysis limited to nonsmoker subjects was conducted. The result showed similarly that phylum Bacteroidetes and genera Parvimonas and Actinobacillus were associated with EGFR mutation (Figure 6(b)). The relative abundance of both genera Parvimonas and Actinobacillus and phylum Bacteroidetes were ≥0.1% and are shown in Figures 6(c,d).
FIGURE 6.
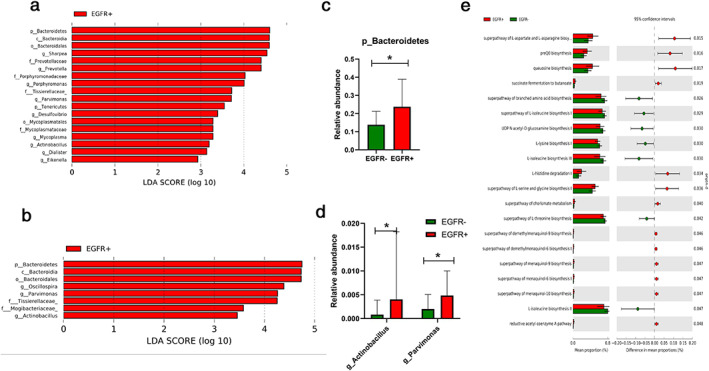
Differentially abundant taxonomy and predicted metabolic function of sputum microbiota between lung adenocarcinoma patients with and without EGFR mutation. (a) Differentially abundant taxonomy between EGFR‐ lung adenocarcinoma and EGFR+ lung adenocarcinoma identified by LEfSe; (b) differentially abundant taxonomy between EGFR‐ nonsmoker lung adenocarcinoma and EGFR+ nonsmoker lung adenocarcinoma identified by LEfSe; (c) differentially abundant phyla Bacteroidetes between EGFR‐ nonsmoker lung adenocarcinoma and EGFR+ nonsmoker lung adenocarcinoma; (d) differentially abundant genera Actinobacillus and Parvimonas between EGFR‐ nonsmoker lung adenocarcinoma and EGFR+ nonsmoker lung adenocarcinoma; (e) differential predicted metabolic function based on the MetaCyc database between EGFR‐ nonsmoker lung adenocarcinoma and EGFR+ nonsmoker lung adenocarcinoma. *p < 0.05, calculated using the Mann–Whitney test
PICRUSt2 based on Metacyc prediction identified that superpathway of L‐aspartate and L‐asparagine biosynthesis, preQ0 biosynthesis and queuosine biosynthesis were the three most significantly abundant pathways in the EGFR mutation nonsmoking group and L‐isoleucine biosynthesis II, L‐isoleucine biosynthesis II III and superpathway of branched amino acid biosynthesis were the top three pathways that were significantly enriched in the EGFR negative nonsmoking group (Figure 6(e)).
DISCUSSION
There is growing evidence which suggests that the development of cancer is affected by human commensal microbiota through inflammation, and the immune and metabolic pathways. 29 Recently, various studies have identified the alteration of airway microbiota among NSCLC patients. 4 , 5 , 7 , 8 , 9 , 11 , 30 , 31 , 32 The interplay between microbiota and lung cancer is complex. However, only a few studies have focused on the association between airway microbiota and tumor clinical parameters, including tumor anatomic stage, metastasis, and gene mutation. In this study, we report the characterization of sputum microbiota among NSCLC patients with early stage (stage I and stage II) and advanced stage (stage III and stage IV) disease. The association between sputum microbiota and tumor N stage and intrathoracic metastasis was explored in depth. In addition, we investigated the linkage between EGFR mutation of lung adenocarcinoma and sputum microbiota.
Using 16S rRNA sequencing to profile the sputum microbiota in NSCLC patients, we found that the most abundant phylum and genus in NSCLC sputum samples were Firmicutes (40%) and Streptococcus (21%), consistent with two previous studies which analyzed sputum microbiota in lung cancer patients. 8 , 11 TNM stage is the most predominant factor in predicting NSCLC survival time. 33 The stepwise development of NSCLC from early‐ to late‐stage has been reported to be the result of various genetic and epigenetic alterations, 34 , 35 which may be associated with alteration of airway microbiota. The lung cancer staging system is categorical; however, stages III and IV lie on a continuum with respect to tumor burden. 36 A great proportion of stage III patients have occult metastasis. The difference in stage III and IV lung cancer patients lie on the tumor burden of distant sites, instead of the tumor burden of local reginal sites. 36 Among the 11 stage III NSCLC patients enrolled in this study, seven (63%) patients were stage IIIB or IIIC. We found that the α‐ and β‐diversity between stage III and IV patients was not significantly different, suggesting that the sputum microbiota might not sensitively reflect the tumor burden of distant site. Similarly, Yu et al. collected adjacent tumor tissues from lung cancer patients and found that the α‐diversity among NSCLC patients in IIIB and IV stage was similar. 13 However, considering that III stage NSCLC is a heterogeneous disease, the difference of sputum or lung tissue microbiota between stages III and IV lung cancer should be interpreted in a larger scale study in the future.
Compared with ES stage patients, we found a significant reduction of α‐diversity in AS patients. More precisely, we found that only the Chao1 index, not the Simpson or Shannon index, was significantly different between ES and AS patients, which meant that the community richness of ES and AS patients was significantly different, while the evenness was similar. The significant decrease of α‐diversity in lung cancer patients compared with healthy or nonmalignant control is evident in several studies, among which two studies used sputum samples; 11 , 37 one study used protected brush samples 8 and one study used surgical lung tissues. 7 These results suggest that the reduction of α‐diversity might be a potential marker indicating the development and progression of lung cancer. β‐diversity between ES and AS lung cancer patients was significantly different in our study, indicating that the taxonomy community structure differed during the progression of lung cancer. The results of the genus network analysis also supported the difference of taxonomy community structure. The SparCC results indicated that the sputum microbiota structure of ES lung cancer patients was more complex and better organized than the taxonomy structure inferred for AS patients.
We report differential abundant taxonomy among NSCLC patients at the AS and ES stage. More precisely, phylum Firmicutes, genera Granulicatella, Actinobacillus were significantly enriched in the ES group, and phylum Actinobacteria, genus Actinomyces were significantly enriched in the AS group. Granulicatella has been previously identified as a member of the normal bacterial flora of the respiratory tract 38 and has previously been implicated in clinical infection such as sinusitis. 39 A study enrolled female lung cancer patients in China and found significantly enriched genus Granulicatella in the sputum samples of lung cancer patients compared with healthy controls. 11 Another pilot study using metagenomic sequencing technology identified Granulicatella adicens, a species belongs to genus Granulicatella, in the sputum of lung cancer patients compared with benign diseases. 4 Taken together, our results and the previous studies mentioned above suggest that the genus Granulicatella might play a role in the early development of NSCLC. Actinobacillus is a common member of human oral commensal microbiota. Previous studies have found that Actinobacillus might influence the production of inflammatory cytokines 16 and is associated with COPD. 40 COPD is a widely recognized risk factor of lung cancer. Chronic inflammation is a key feature of COPD and could be a potential driver for lung cancer development. 41 Thus, the genus Actinobacillus might serve as a link between COPD and lung cancer. It is plausible that the inhabitation of Actinobacillus led to a chronic lung inflammation thus enhancing the initiation and early development of lung cancer. The genus Actinomyces has been identified as a common anaerobe which colonizes in the airway of lung cancer patients. 42 It is interesting to note that in our study the co‐occurrence of Actinomyces and the genus Veillonella existed exclusively in the AS group. Thus, in AS lung cancer patients, the increase in the genus Actinomyces could increase the abundance of genus Veillonella. A previous study found that the lower airway of lung cancer patients was enriched for genus Veillonella, and was further found to be associated with upregulation of the ERK and PI3K signaling pathways. 5 It has previously been recognized that PI3K and ERK pathway activation is involved in lung cancer metastasis. 43 In addition, we found that the genus Actinomyces was positively related with the NAD salvage pathway, which was significantly enriched in AS patients. Cancer cells have enhanced glycolysis for sustaining rapid proliferation. Increased NAD levels enhance glycolysis and fuel cancer cells and are associated with cancer cell survival and enhanced invasion capacity. 44 , 45 In fact, rate‐limiting enzymes, such as nicotinamide phosphoribosyltransferase, are frequently amplified in several cancer cells. 44 Thus, in addition to its possible indirect influence on cancer related signaling pathway, the genus Actinomyces might enhance lung cancer progression partly via enhanced NAD production.
Lung microbiota has been reported to have an influence on proliferation or metastasis of intrathoracic cancer via regulation of the immune system. 17 , 46 In this study, we report that intrathoracic metastasis was associated with the enriched sputum genus peptostreptococcus and decreased Streptococcus. Peptostreptococcus has previously been reported to be associated with colon cancer progression. 47 , 48 However, its relationship with lung cancer remains largely unknown. The genus Peptostreptococcus are obligate anaerobes. It has been suggested that a tumor microenvironment condition such as hypoxia may enhance tumor invasion and metastasis. 49 Therefore, it is plausible to speculate that the anoxic lung tumor condition, which can facilitate intrathoracic metastasis, may favor the growth of some obligate anaerobes, such as the genus Peptostreptococcus. It is of interest to note that the incomplete reductive TCA cycle of sputum microbiota was significantly enriched in the Intra group and was positively related with the genus Peptostreptococcus. The reductive TCA cycle existence in anaerobes, including some deeply rooted bacteria, is one alternative strategy for fixing CO2. 50 During this reaction, oxaloacetate is finally produced 51 and may participate in yjrTCA cycle in cancer cells. Current studies have demonstrated that certain cancer cells, including lung cancer with a specific genome subtype, 52 , 53 rely heavily on the TCA cycle for energy production. 54 A recent study reported that enhanced TCA cycle might promote lung metastasis of certain cancers. 55
In the absence of distant metastasis, the existence of lung cancer spread to a regional lymph node affects clinical treatment options and prognosis. In this study, we found that the α‐ and β‐diversity were similar between LNM_Y and LNM_N, indicating that the sputum taxonomy structure did not vary during progression of lymph node metastasis. LEfSe analysis revealed the genera Parvimonas, Pseudomona was positively correlated with lymph node metastasis, while the genera Neisseria and Actinobacillus was associated with depression of lymph node metastasis. The genus Pseudomonas showed a correlation with adenocarcinoma. 56 A clinical study identified that genus Pseudomonas was positively associated with matrix metalloproteinase in transplant lung patients, 57 which was associated with metastasis and invasiveness of cancer cells. 58 The genus Neisseria was found to be negatively associated with lymph node metastasis. A previous study discovered that compared with healthy controls, the relative abundance of salivary Neisseria was significantly decreased among lung cancer patients, suggesting that it might serve a protective role in lung cancer progression. 59 Metabolic function prediction identified L‐valine biosynthesis and L‐isoleucine were increased in sputum microbiota of LNM_Y patients. Valine and isoleucine belong to branched chain amino acids, which play a critical role in the regulation of energy homeostasis, nutrition metabolism, immunity and disease in humans. 60 They can act as signaling molecules regulating glucose metabolism, lipid, and protein synthesis and serve as potential biomarkers in cancer.60 Since the genus Pseudomona is positively associated with L‐valine biosynthesis, it is plausible that Pseudomona might apply valine for lung cancer cells and enhance its proliferation and invasiveness.
EGFR mutation is a strong prognostic factor among lung adenocarcinoma patients. The data presented here showed that certain sputum bacterium had a close link with EGFR mutation among lung adenocarcinoma patients. Both in the overall and subgroup analyses limited to nonsmoker subjects, the results showed that the relative abundance of phylum Bacteroidetes and genera Parvimonas and Actinobacillus were positively associated with EGFR mutation. The increased EGFR signaling pathway has previously been identified as relevant to airway mucin production and epithelial cell repair, 61 thus it may have an influence on the abundance of phylum Bacteroidetes, genus Parvimonas and genus Actinobacillus. On the other hand, other studies have suggested that specific bacterium such as genus Parvimonas may cause EGFR mutation. Currently, several studies have suggested that Parvimonas micra, a member of the genus Parvimonas, is enriched in patients with colon cancer. 62 , 63 Interestingly, an in vitro study demonstrated that infection of Parvimonas micra could enhance the ability of human inflammatory cells to generate reactive oxygen species and caused DNA damage of human cells, 64 which could cause oncogene mutation and carcinogenesis.
Our study provides a novel insight into the association between sputum microbiota, its predicted metabolic function and lung cancer stage, intrathoracic metastasis, lymph node metastasis and EGFR mutation. However, we acknowledge that there are some limitations in our study. First, the number of patients enrolled in our study is not high enough, so there may be heterogeneity. Second, the use of sputum cannot surrogate lung cancer tissue and lower airway. Caution is therefore advised in the interpretation of intratumor microbiota using our results. However, as the upper and lower airways are continuous, a previous study has suggested that sputum is compositionally similar to bronchial microbiota and is superior to nasal brush or oral wash for assessing bronchial microbiota 65 . What is more, another study which compared the microbiome of spontaneous sputa and transplanted lung tissues in patients with cystic fibrosis showed that the relative abundance of the dominant genera in sputum were similar to that of lung tissue. 66 Therefore, in our study, we speculated that spontaneous sputum can partly reflect the taxonomy composition of lower airway or even lung cancer tissue, not only because that spontaneous sputum is a mixture of lower and upper airway secretion, but also that the migration of microbiota from the upper airway partly shaped the microbiota of the lower airway. Further studies are needed to investigate the similarity and difference of different sample types among lung cancer patients. Third, the discovery of specific bacterial genera to distinguish lung cancer with various important clinical parameters hypothesis lacked validation cohorts, which may result in false positive values and unreliability. Fourth, this was a cross‐sectional study and only illustrates the phenomenon from microbiology. The mechanism of the microbiota and the causal relationship therefore need further exploration.
In conclusion, collectively, the data in our study showed an association between important clinical parameters of lung cancer and airway microbiota. The taxonomy structure differed between patients in early and advanced stages. The tumor stage, intrathoracic metastasis, lymph node metastasis, and EGFR mutation were associated with alteration of specific airway genera and predicted metabolic function of sputum microbiota. Our study sheds light on the fact that airway microbiota might participate in various pathophysiological processes that are importantly related to lung cancer development. Further studies with large scale and multiomics are needed to achieve a better understanding of the role of microbiota in the development and progression of lung cancer which could pave the way for exploring new therapeutic options and biomarkers in the future.
CONFLICT OF INTEREST
The authors declare that there are no conflicts of interest.
Supporting information
Figure S1 OTU rarefaction curve of 85 NSCLC patients.
Figure S2 Taxonomic composition of sputum microbiota community of the 85 NSCLC subjects. (A) Dominant phyla of the 85 NSCLC subjects; (B) Dominant genera of the 85 NSCLC subjects.
Figure S3 Difference of sputum microbiota between NSCLC patients in stage III and stage IV. (A) Shannon index; (B) Chao1 index; (C) Simpson index among NSCLC patients in stage III and stage IV; (D) PCOA plot based on Bray‐Curtis distance of sputum genus among NSCLC patients in stage III and stage IV; (E) Differentially abundant taxonomy between NSCLC patients in stage III and stage IV identified by LEFse.
Figure S4 Difference of sputum microbiota between NSCLC patients in Intra group and Non_M group. (A) Chao 1 index, (B) Simpson index, (C) Shannon index among NSCLC patients in Intra group and Non_M group; (D) PCOA plot based on Bray‐Curtis distance of sputum genus among NSCLC patients in Intra group and Non_M group.
Figure S5 Differentially abundant taxonomy and predicted metabolic function of sputum microbiota between NSCLC patients in Intra and Non_M group. (A) Differentially abundant taxonomy between patients in Intra and Non_M group identified by LEFse; (B) Differentially abundant of phylum Firmicutes between Intra and Non_M group; (C) Differentially abundant of genera Peptostreptococcus and Streptococcus between Intra and Non_M; (D) Differential predicted metabolic function based on MetaCyc database between patients in Intra and Non_M group. *p < 0.05, p was calculated using Mann–Whitney U test.
Figure S6 Difference of sputum microbiota between NSCLC patients in LNM_N and LNM_Y group. (A) Chao 1 index, (B) Simpson index, (C) Shannon index among NSCLC patients in LNM_N and LNM_Y group; (D) PCOA plot based on Bray‐Curtis distance of sputum genus among NSCLC patients in LNM_N and LNM_Y group.
Figure S7 Differentially abundant taxonomy and predicted metabolic function of sputum microbiota between NSCLC patients in LNM_Y and LNM_M group. (A) Differentially abundant taxonomy between patients in LNM_Y and LNM_M group identified by LEFse; (B) Differentially abundant of phylum Proteobacteria between LNM_Y and LNM_M group; (C) Differentially abundant of genera Actinobacillus, Neisseria, Parvimonas and Pseudomonas between LNM_Y and LNM_M; (D) Differential predicted metabolic function based on MetaCyc database between patients in LNM_Y and LNM_M group. *p < 0.05, p was calculated using Mann–Whitney U test.
Figure S8 Comparison of α diversity and β diversity of sputum microbiota between lung adenocarcinoma patients in EGFR‐ and EGFR+ group. (A) Chao 1 index, (B) Simpson index, (C) Shannon index among lung adenocarcinoma patients in EGFR‐ and EGFR+ group; (D) PCOA plot based on Bray‐Curtis distance of sputum genus among lung adenocarcinoma patients in EGFR‐ and EGFR+ group.
Table S1 Demographics and clinical characteristics of the 85 NSCLC patients
Table S2 Demographics and clinical characteristics of patients at ES and AS stages
Table S3 Demographics and clinical characteristics of NSCLC patients in intra group and Non_M group
Table S4 Demographics and clinical characteristics of NSCLC patients in LNM_Y and LNM_N group
Table S5 Demographics and clinical characteristics of lung adenocarcinoma patients in EGFR‐ and EGFR+ group
ACKNOWLEDGMENTS
This work was supported by the National Natural Science Foundation of China (No. 81970032; 81670026; 8187011256).
Huang DH, He J, Su XF, Wen YN, Zhang SJ, Liu LY, et al. The airway microbiota of non‐small cell lung cancer patients and its relationship to tumor stage and EGFR gene mutation. Thorac Cancer. 2022;13:858–869. 10.1111/1759-7714.14340
Funding information National Natural Science Foundation of China, Grant/Award Numbers: 81670026, 8187011256, 81970032
Contributor Information
Shaoxi Cai, Email: caishaox@smu.edu.cn.
Hangming Dong, Email: dhm@smu.edu.cn.
REFERENCES
- 1. Siegel RL, Miller KD, Jemal A. Cancer statistics, 2020. CA Cancer J Clin. 2020;70(1):7–30. [DOI] [PubMed] [Google Scholar]
- 2. Herbst RS, Morgensztern D, Boshoff C. The biology and management of non‐small cell lung cancer. Nature. 2018;553(7689):446–54. [DOI] [PubMed] [Google Scholar]
- 3. Dickson RP, Erb‐Downward JR, Huffnagle GB. The role of the bacterial microbiome in lung disease. Expert Rev Respir Med. 2013;7(3):245–57. [DOI] [PMC free article] [PubMed] [Google Scholar]
- 4. Cameron S, Lewis KE, Huws SA, Hegarty MJ, Lewis PD, Pachebat JA, et al. A pilot study using metagenomic sequencing of the sputum microbiome suggests potential bacterial biomarkers for lung cancer. PLOS ONE. 2017;12(5):e177062. [DOI] [PMC free article] [PubMed] [Google Scholar]
- 5. Tsay JJ, Wu BG, Badri MH, Clemente JC, Shen N, Meyn P, et al. Airway microbiota is associated with upregulation of the PI3K pathway in lung cancer. Am J Respir Crit Care Med. 2018;198(9):1188–98. [DOI] [PMC free article] [PubMed] [Google Scholar]
- 6. Lee SH, Sung JY, Yong D, Chun J, Kim SY, Song JH, et al. Characterization of microbiome in bronchoalveolar lavage fluid of patients with lung cancer comparing with benign mass like lesions. Lung Cancer. 2016;102:89–95. [DOI] [PubMed] [Google Scholar]
- 7. Cheng C, Wang Z, Wang J, Ding C, Sun C, Liu P, et al. Characterization of the lung microbiome and exploration of potential bacterial biomarkers for lung cancer. Transl Lung Cancer Res. 2020;9(3):693–704. [DOI] [PMC free article] [PubMed] [Google Scholar]
- 8. Liu HX, Tao LL, Zhang J, Zhu YG, Zheng Y, Liu D, et al. Difference of lower airway microbiome in bilateral protected specimen brush between lung cancer patients with unilateral lobar masses and control subjects. Int J Cancer. 2018;142(4):769–78. [DOI] [PubMed] [Google Scholar]
- 9. Greathouse KL, White JR, Vargas AJ, Bliskovsky VV, Beck JA, von Muhlinen N, et al. Interaction between the microbiome and TP53 in human lung cancer. Genome Biol. 2018;19(1):123. [DOI] [PMC free article] [PubMed] [Google Scholar]
- 10. Apopa PL, Alley L, Penney RB, Arnaoutakis K, Steliga MA, Jeffus S, et al. PARP1 is up‐regulated in non‐small cell lung cancer tissues in the presence of the cyanobacterial toxin microcystin. Front Microbiol. 2018;9:1757. [DOI] [PMC free article] [PubMed] [Google Scholar]
- 11. Hosgood HR, Sapkota AR, Rothman N, Rohan T, Hu W, Xu J, et al. The potential role of lung microbiota in lung cancer attributed to household coal burning exposures. Environ Mol Mutagen. 2014;55(8):643–51. [DOI] [PMC free article] [PubMed] [Google Scholar]
- 12. Rusch VW, Chansky K, Kindler HL, Nowak AK, Pass HI, Rice DC, et al. The IASLC mesothelioma staging project: proposals for the M descriptors and for revision of the TNM stage groupings in the forthcoming (eighth) edition of the TNM classification for mesothelioma. J Thorac Oncol. 2016;11(12):2112–9. [DOI] [PubMed] [Google Scholar]
- 13. Yu G, Gail MH, Consonni D, Carugno M, Humphrys M, Pesatori AC, et al. Characterizing human lung tissue microbiota and its relationship to epidemiological and clinical features. Genome Biol. 2016;17(1):163. [DOI] [PMC free article] [PubMed] [Google Scholar]
- 14. Huang D, Su X, Yuan M, Zhang S, He J, Deng Q, et al. The characterization of lung microbiome in lung cancer patients with different clinicopathology. Am J Cancer Res. 2019;9(9):2047–63. [PMC free article] [PubMed] [Google Scholar]
- 15. Gowing SD, Chow SC, Cools‐Lartigue JJ, Chen CB, Najmeh S, Goodwin‐Wilson M, et al. Gram‐negative pneumonia augments non‐small cell lung cancer metastasis through host toll‐like receptor 4 activation. J Thorac Oncol. 2019;14(12):2097–108. [DOI] [PubMed] [Google Scholar]
- 16. Hessle CC, Andersson B, Wold AE. Gram‐positive and gram‐negative bacteria elicit different patterns of pro‐inflammatory cytokines in human monocytes. Cytokine. 2005;30(6):311–8. [DOI] [PubMed] [Google Scholar]
- 17. Le Noci V, Guglielmetti S, Arioli S, Camisaschi C, Bianchi F, Sommariva M, et al. Modulation of pulmonary microbiota by antibiotic or probiotic aerosol therapy: a strategy to promote Immunosurveillance against lung metastases. Cell Rep. 2018;24(13):3528–38. [DOI] [PubMed] [Google Scholar]
- 18. Chen J, Pitmon E, Wang K. Microbiome, inflammation and colorectal cancer. Semin Immunol. 2017;32:43–53. [DOI] [PubMed] [Google Scholar]
- 19. Luo YH, Wu CH, Wu WS, Huang CY, Su WJ, Tsai CM, et al. Association between tumor epidermal growth factor receptor mutation and pulmonary tuberculosis in patients with adenocarcinoma of the lungs. J Thorac Oncol. 2012;7(2):299–305. [DOI] [PubMed] [Google Scholar]
- 20. Li M, Deng F, Qian LT, Meng SP, Zhang Y, Shan WL, et al. Association between human papillomavirus and EGFR mutations in advanced lung adenocarcinoma. Oncol Lett. 2016;12(3):1953–8. [DOI] [PMC free article] [PubMed] [Google Scholar]
- 21. Jia Z, Bao K, Wei P, Yu X, Zhang Y, Wang X, et al. EGFR activation‐induced decreases in claudin1 promote MUC5AC expression and exacerbate asthma in mice. Mucosal Immunol. 2021;14(1):125–34. [DOI] [PubMed] [Google Scholar]
- 22. Hall M, Beiko RG. 16S rRNA gene analysis with QIIME2. Methods Mol Biol. 2018;1849:113–29. [DOI] [PubMed] [Google Scholar]
- 23. Edgar RC. UPARSE: highly accurate OTU sequences from microbial amplicon reads. Nat Methods. 2013;10(10):996–8. [DOI] [PubMed] [Google Scholar]
- 24. DeSantis TZ, Hugenholtz P, Larsen N, Rojas M, Brodie EL, Keller K, et al. Greengenes, a chimera‐checked 16S rRNA gene database and workbench compatible with ARB. Appl Environ Microbiol. 2006;72(7):5069–72. [DOI] [PMC free article] [PubMed] [Google Scholar]
- 25. Douglas GM, Maffei VJ, Zaneveld JR, Yurgel SN, Brown JR, Taylor CM, et al. PICRUSt2 for prediction of metagenome functions. Nat Biotechnol. 2020;38(6):685–8. [DOI] [PMC free article] [PubMed] [Google Scholar]
- 26. Caspi R, Altman T, Billington R, Dreher K, Foerster H, Fulcher CA, et al. The MetaCyc database of metabolic pathways and enzymes and the BioCyc collection of pathway/genome databases. Nucleic Acids Res. 2014;42(Database issue):D459–71. [DOI] [PMC free article] [PubMed] [Google Scholar]
- 27. Parks DH, Tyson GW, Hugenholtz P, Beiko RG. STAMP: statistical analysis of taxonomic and functional profiles. Bioinformatics. 2014;30(21):3123–4. [DOI] [PMC free article] [PubMed] [Google Scholar]
- 28. Friedman J, Alm EJ. Inferring correlation networks from genomic survey data. PLoS Comput Biol. 2012;8(9):e1002687. [DOI] [PMC free article] [PubMed] [Google Scholar]
- 29. Chen J, Domingue JC, Sears CL. Microbiota dysbiosis in select human cancers: evidence of association and causality. Semin Immunol. 2017;32:25–34. [DOI] [PMC free article] [PubMed] [Google Scholar]
- 30. Druzhinin VG, Matskova LV, Demenkov PS, Baranova ED, Volobaev VP, Minina VI, et al. Taxonomic diversity of sputum microbiome in lung cancer patients and its relationship with chromosomal aberrations in blood lymphocytes. Sci Rep. 2020;10(1):9681. [DOI] [PMC free article] [PubMed] [Google Scholar]
- 31. Reinhold L, Mollering A, Wallis S, Palade E, Schafer K, Dromann D, et al. Dissimilarity of airway and lung tissue microbiota in smokers undergoing surgery for lung cancer. Microorganisms. 2020;8(6):794–803. [DOI] [PMC free article] [PubMed] [Google Scholar]
- 32. Jin J, Gan Y, Liu H, Wang Z, Yuan J, Deng T, et al. Diminishing microbiome richness and distinction in the lower respiratory tract of lung cancer patients: a multiple comparative study design with independent validation. Lung Cancer. 2019;136:129–35. [DOI] [PubMed] [Google Scholar]
- 33. Woodard GA, Jones KD, Jablons DM. Lung cancer staging and prognosis. Cancer Treat Res. 2016;170:47–75. [DOI] [PubMed] [Google Scholar]
- 34. Tessema M, Yingling CM, Liu Y, Tellez CS, Van Neste L, Baylin SS, et al. Genome‐wide unmasking of epigenetically silenced genes in lung adenocarcinoma from smokers and never smokers. Carcinogenesis. 2014;35(6):1248–57. [DOI] [PMC free article] [PubMed] [Google Scholar]
- 35. Inamura K. Clinicopathological characteristics and mutations driving development of early lung adenocarcinoma: tumor initiation and progression. Int J Mol Sci. 2018;19(4):1259–75. [DOI] [PMC free article] [PubMed] [Google Scholar]
- 36. Marks LB, Saynak M, Christodouleas JP. Stage III vs. stage IV lung cancer: "crossing a great divide". Lung Cancer. 2010;67(1):1–3. [DOI] [PubMed] [Google Scholar]
- 37. Hosgood HR, Mongodin EF, Wan Y, Hua X, Rothman N, Hu W, et al. The respiratory tract microbiome and its relationship to lung cancer and environmental exposures found in rural China. Environ Mol Mutagen. 2019;60(7):617–23. [DOI] [PMC free article] [PubMed] [Google Scholar]
- 38. Harris JK, De Groote MA, Sagel SD, Zemanick ET, Kapsner R, Penvari C, et al. Molecular identification of bacteria in bronchoalveolar lavage fluid from children with cystic fibrosis. Proc Natl Acad Sci U S A. 2007;104(51):20529–33. [DOI] [PMC free article] [PubMed] [Google Scholar]
- 39. De Luca M, Amodio D, Chiurchiu S, Castelluzzo MA, Rinelli G, Bernaschi P, et al. Granulicatella bacteraemia in children: two cases and review of the literature. BMC Pediatr. 2013;13:61. [DOI] [PMC free article] [PubMed] [Google Scholar]
- 40. Haldar K, George L, Wang Z, Mistry V, Ramsheh MY, Free RC, et al. The sputum microbiome is distinct between COPD and health, independent of smoking history. Respir Res. 2020;21(1):183. [DOI] [PMC free article] [PubMed] [Google Scholar]
- 41. Parris BA, O'Farrell HE, Fong KM, Yang IA. Chronic obstructive pulmonary disease (COPD) and lung cancer: common pathways for pathogenesis. J Thorac Dis. 2019;11(Suppl 17):S2155–72. [DOI] [PMC free article] [PubMed] [Google Scholar]
- 42. Rybojad P, Los R, Sawicki M, Tabarkiewicz J, Malm A. Anaerobic bacteria colonizing the lower airways in lung cancer patients. Folia Histochem Cytobiol. 2011;49(2):263–6. [DOI] [PubMed] [Google Scholar]
- 43. Popper HH. Progression and metastasis of lung cancer. Cancer Metastasis Rev. 2016;35(1):75–91. [DOI] [PMC free article] [PubMed] [Google Scholar]
- 44. Yaku K, Okabe K, Hikosaka K, Nakagawa T. NAD metabolism in cancer therapeutics. Front Oncol. 2018;8:622. [DOI] [PMC free article] [PubMed] [Google Scholar]
- 45. Zhu Y, Liu J, Park J, Rai P, Zhai RG. Subcellular compartmentalization of NAD(+) and its role in cancer: a sereNADe of metabolic melodies. Pharmacol Ther. 2019;200:27–41. [DOI] [PMC free article] [PubMed] [Google Scholar]
- 46. Jin C, Lagoudas GK, Zhao C, Bullman S, Bhutkar A, Hu B, et al. Commensal microbiota promote lung cancer development via gammadelta T cells. Cell. 2019;176(5):998–1013. [DOI] [PMC free article] [PubMed] [Google Scholar]
- 47. Sheng Q, Du H, Cheng X, Cheng X, Tang Y, Pan L, et al. Characteristics of fecal gut microbiota in patients with colorectal cancer at different stages and different sites. Oncol Lett. 2019;18(5):4834–44. [DOI] [PMC free article] [PubMed] [Google Scholar]
- 48. Tsoi H, Chu E, Zhang X, Sheng J, Nakatsu G, Ng SC, et al. Peptostreptococcus anaerobius induces intracellular cholesterol biosynthesis in colon cells to induce proliferation and causes dysplasia in mice. Gastroenterology. 2017;152(6):1419–33. [DOI] [PubMed] [Google Scholar]
- 49. Quail DF, Joyce JA. Microenvironmental regulation of tumor progression and metastasis. Nat Med. 2013;19(11):1423–37. [DOI] [PMC free article] [PubMed] [Google Scholar]
- 50. Romano AH, Conway T. Evolution of carbohydrate metabolic pathways. Res Microbiol. 1996;147(6–7):448–55. [DOI] [PubMed] [Google Scholar]
- 51. Evans MC, Buchanan BB, Arnon DI. A new ferredoxin‐dependent carbon reduction cycle in a photosynthetic bacterium. Proc Natl Acad Sci U S A. 1966;55(4):928–34. [DOI] [PMC free article] [PubMed] [Google Scholar]
- 52. Strohecker AM, White E. Autophagy promotes BrafV600E‐driven lung tumorigenesis by preserving mitochondrial metabolism. Autophagy. 2014;10(2):384–5. [DOI] [PMC free article] [PubMed] [Google Scholar]
- 53. Hoque MO, Kim MS, Ostrow KL, Liu J, Wisman GB, Park HL, et al. Genome‐wide promoter analysis uncovers portions of the cancer methylome. Cancer Res. 2008;68(8):2661–70. [DOI] [PMC free article] [PubMed] [Google Scholar]
- 54. Anderson NM, Mucka P, Kern JG, Feng H. The emerging role and targetability of the TCA cycle in cancer metabolism. Protein Cell. 2018;9(2):216–37. [DOI] [PMC free article] [PubMed] [Google Scholar]
- 55. Cai Z, Li CF, Han F, Liu C, Zhang A, Hsu CC, et al. Phosphorylation of PDHA by AMPK drives TCA cycle to promote cancer metastasis. Mol Cell. 2020;80(2):263–78. [DOI] [PMC free article] [PubMed] [Google Scholar]
- 56. Kovaleva OV, Romashin D, Zborovskaya IB, Davydov MM, Shogenov MS, Gratchev A. Human lung microbiome on the way to cancer. J Immunol Res. 2019;2019:1394191. [DOI] [PMC free article] [PubMed] [Google Scholar]
- 57. Mouraux S, Bernasconi E, Pattaroni C, Koutsokera A, Aubert JD, Claustre J, et al. Airway microbiota signals anabolic and catabolic remodeling in the transplanted lung. J Allergy Clin Immunol. 2018;141(2):718–29. [DOI] [PMC free article] [PubMed] [Google Scholar]
- 58. Conlon GA, Murray GI. Recent advances in understanding the roles of matrix metalloproteinases in tumour invasion and metastasis. J Pathol. 2019;247(5):629–40. [DOI] [PubMed] [Google Scholar]
- 59. Yan X, Yang M, Liu J, Gao R, Hu J, Li J, et al. Discovery and validation of potential bacterial biomarkers for lung cancer. Am J Cancer Res. 2015;5(10):3111–22. [PMC free article] [PubMed] [Google Scholar]
- 60. Nie C, He T, Zhang W, Zhang G, Ma X. Branched chain amino acids: beyond nutrition metabolism. Int J Mol Sci. 2018;19(4):954–69. [DOI] [PMC free article] [PubMed] [Google Scholar]
- 61. Burgel PR, Nadel JA. Epidermal growth factor receptor‐mediated innate immune responses and their roles in airway diseases. Eur Respir J. 2008;32(4):1068–81. [DOI] [PubMed] [Google Scholar]
- 62. Lowenmark T, Lofgren‐Burstrom A, Zingmark C, Eklof V, Dahlberg M, Wai SN, et al. Parvimonas micra as a putative non‐invasive faecal biomarker for colorectal cancer. Sci Rep. 2020;10(1):15250. [DOI] [PMC free article] [PubMed] [Google Scholar]
- 63. Xu J, Yang M, Wang D, Zhang S, Yan S, Zhu Y, et al. Alteration of the abundance of Parvimonas micra in the gut along the adenoma‐carcinoma sequence. Oncol Lett. 2020;20(4):106. [DOI] [PMC free article] [PubMed] [Google Scholar]
- 64. Matsui A, Jin JO, Johnston CD, Yamazaki H, Houri‐Haddad Y, Rittling SR. Pathogenic bacterial species associated with endodontic infection evade innate immune control by disabling neutrophils. Infect Immun. 2014;82(10):4068–79. [DOI] [PMC free article] [PubMed] [Google Scholar]
- 65. Durack J, Huang YJ, Nariya S, Christian LS, Ansel KM, Beigelman A, et al. Bacterial biogeography of adult airways in atopic asthma. Microbiome. 2018;6(1):104. [DOI] [PMC free article] [PubMed] [Google Scholar]
- 66. Goddard AF, Staudinger BJ, Dowd SE, Joshi‐Datar A, Wolcott RD, Aitken ML, et al. Direct sampling of cystic fibrosis lungs indicates that DNA‐based analyses of upper‐airway specimens can misrepresent lung microbiota. Proc Natl Acad Sci U S A. 2012;109(34):13769–74. [DOI] [PMC free article] [PubMed] [Google Scholar]
Associated Data
This section collects any data citations, data availability statements, or supplementary materials included in this article.
Supplementary Materials
Figure S1 OTU rarefaction curve of 85 NSCLC patients.
Figure S2 Taxonomic composition of sputum microbiota community of the 85 NSCLC subjects. (A) Dominant phyla of the 85 NSCLC subjects; (B) Dominant genera of the 85 NSCLC subjects.
Figure S3 Difference of sputum microbiota between NSCLC patients in stage III and stage IV. (A) Shannon index; (B) Chao1 index; (C) Simpson index among NSCLC patients in stage III and stage IV; (D) PCOA plot based on Bray‐Curtis distance of sputum genus among NSCLC patients in stage III and stage IV; (E) Differentially abundant taxonomy between NSCLC patients in stage III and stage IV identified by LEFse.
Figure S4 Difference of sputum microbiota between NSCLC patients in Intra group and Non_M group. (A) Chao 1 index, (B) Simpson index, (C) Shannon index among NSCLC patients in Intra group and Non_M group; (D) PCOA plot based on Bray‐Curtis distance of sputum genus among NSCLC patients in Intra group and Non_M group.
Figure S5 Differentially abundant taxonomy and predicted metabolic function of sputum microbiota between NSCLC patients in Intra and Non_M group. (A) Differentially abundant taxonomy between patients in Intra and Non_M group identified by LEFse; (B) Differentially abundant of phylum Firmicutes between Intra and Non_M group; (C) Differentially abundant of genera Peptostreptococcus and Streptococcus between Intra and Non_M; (D) Differential predicted metabolic function based on MetaCyc database between patients in Intra and Non_M group. *p < 0.05, p was calculated using Mann–Whitney U test.
Figure S6 Difference of sputum microbiota between NSCLC patients in LNM_N and LNM_Y group. (A) Chao 1 index, (B) Simpson index, (C) Shannon index among NSCLC patients in LNM_N and LNM_Y group; (D) PCOA plot based on Bray‐Curtis distance of sputum genus among NSCLC patients in LNM_N and LNM_Y group.
Figure S7 Differentially abundant taxonomy and predicted metabolic function of sputum microbiota between NSCLC patients in LNM_Y and LNM_M group. (A) Differentially abundant taxonomy between patients in LNM_Y and LNM_M group identified by LEFse; (B) Differentially abundant of phylum Proteobacteria between LNM_Y and LNM_M group; (C) Differentially abundant of genera Actinobacillus, Neisseria, Parvimonas and Pseudomonas between LNM_Y and LNM_M; (D) Differential predicted metabolic function based on MetaCyc database between patients in LNM_Y and LNM_M group. *p < 0.05, p was calculated using Mann–Whitney U test.
Figure S8 Comparison of α diversity and β diversity of sputum microbiota between lung adenocarcinoma patients in EGFR‐ and EGFR+ group. (A) Chao 1 index, (B) Simpson index, (C) Shannon index among lung adenocarcinoma patients in EGFR‐ and EGFR+ group; (D) PCOA plot based on Bray‐Curtis distance of sputum genus among lung adenocarcinoma patients in EGFR‐ and EGFR+ group.
Table S1 Demographics and clinical characteristics of the 85 NSCLC patients
Table S2 Demographics and clinical characteristics of patients at ES and AS stages
Table S3 Demographics and clinical characteristics of NSCLC patients in intra group and Non_M group
Table S4 Demographics and clinical characteristics of NSCLC patients in LNM_Y and LNM_N group
Table S5 Demographics and clinical characteristics of lung adenocarcinoma patients in EGFR‐ and EGFR+ group