Abstract
Metabolic reprogramming is central to oncogene-induced tumorigenesis by providing the necessary building blocks and energy sources, but how oncogenic signaling controls metabolites that play regulatory roles in driving cell proliferation and tumor growth is less understood. Here we show that oncogene YAP/TAZ promotes polyamine biosynthesis by activating the transcription of the rate-limiting enzyme ornithine decarboxylase 1. The increased polyamine levels, in turn, promote the hypusination of eukaryotic translation factor 5A (eIF5A) to support efficient translation of histone demethylase LSD1, a transcriptional repressor that mediates a bulk of YAP/TAZ-downregulated genes including tumor suppressors in YAP/TAZ-activated cells. Accentuating the importance of the YAP/TAZ-polyamine-eIF5A hypusination-LSD1 axis, inhibiting polyamine biosynthesis or LSD1 suppressed YAP/TAZ-induced cell proliferation and tumor growth significantly. Given the frequent upregulation of YAP/TAZ activity and polyamine levels in diverse cancers, our identification of YAP/TAZ as an upstream regulator and LSD1 as a downstream effector of the oncometabolite polyamine offers a molecular framework in which oncogene-induced metabolic and epigenetic reprogramming coordinately drives tumorigenesis, and suggests potential therapeutic strategies in YAP/TAZ- or polyamine-dependent human malignancies.
Introduction
Oncogene-driven metabolic reprogramming is a hallmark of human cancers and actively explored as a key vulnerability in cancer therapies1. While gain-of-function mutations in certain metabolic enzymes such as isocitrate dehydrogenase 1 and 2 (IDH1/2) can produce oncometabolites that directly drive tumorigenesis1,2, more often oncogenes act through their respective signaling pathways to rewire cellular metabolism to support the specific demands of cancer cells such as energy, biomass and redox maintenance for rapid proliferation1,3,4. These unique metabolic features are increasingly exploited as targets for cancer therapy3,4. While most cancer metabolic studies have focused on metabolites that serve as building blocks or energy sources1, how oncogenic signaling controls metabolites that play regulatory roles in driving cell proliferation and tumor growth is less understood.
The oncogenic transcriptional coactivator Yes-associated protein (YAP) and transcriptional coactivator with PDZ-binding motif (TAZ or WWTR1) are nuclear effectors of the Hippo signaling pathway, which play critical roles in organ size control, tissue homeostasis and tumorigenesis5–7. Aberrant YAP/TAZ activation has been frequently observed in a variety of human cancers (e.g. breast cancer, ovarian cancer, glioma, and liver cancer) and is associated with an aggressive phenotype and poor prognosis6,8. Addiction to YAP/TAZ in tumors, therefore, has emerged as a central vulnerability of diverse cancers and may be therapeutically targeted. Given the critical role of metabolic reprogramming in tumorigenesis1,3,4, we investigated the metabolic vulnerability in YAP/TAZ-driven cell proliferation and tumor growth. While metabolic studies of YAP/TAZ have so far focused on metabolites that serve as building blocks or energy sources9–11, we were particularly interested in metabolites that play regulatory roles in cellular processes, reasoning that targeting such “regulatory metabolites” should in principle cause less pleotropic toxicity and thus offer better therapeutic windows. Moreover, we chose to interrogate YAP/TAZ-induced metabolic changes in intact mammalian tissues as a more physiological setting than cultured cells.
In this study, using metabolic analysis in transgenic mouse models and human cancer cells, we reveal an important role for oncogene YAP/TAZ in the biosynthesis of the regulatory metabolite polyamine. YAP/TAZ directly activates the transcription of ornithine decarboxylase 1 (Odc1), the rate-limiting enzyme in polyamine biosynthesis pathway, to enhance polyamine production. The increased polyamine levels, in turn, promote the hypusination of eukaryotic translation factor 5A (eIF5A) to support efficient translation of histone lysine-specific demethylase LSD1. We further found that LSD1, as a transcriptional repressor, mediates a bulk of YAP/TAZ-downregulated genes in YAP/TAZ-activated cells. Importantly, genetic and pharmacologic targeting of the YAP/TAZ-polyamine-eIF5A hypusination-LSD1 axis can dramatically suppress YAP/TAZ-induced cell proliferation and tumor growth both in vitro and in vivo. Considering the frequent upregulation of YAP/TAZ activity and polyamine levels in diverse cancers, our identification of the YAP/TAZ-polyamine-eIF5A hypusination-LSD1 axis offers a molecular framework in which oncogene-induced metabolic and epigenetic reprogramming coordinately drives tumorigenesis, and suggests potential therapeutic targets in YAP/TAZ- or polyamine-dependent human malignancies.
Results
YAP activation promotes polyamine biosynthesis in mouse livers
To identify vulnerable metabolic targets of YAP/TAZ in cell proliferation in vivo, we performed a metabolomic analysis of mouse livers expressing a hepatocyte-specific, tetracycline-inducible YAP transgene (Extended Data Fig. 1a,b). As shown previously12, doxycycline-induced YAP overexpression (YAP OE) led to massive hepatomegaly within 10 days of induction (Fig. 1a). Principal component analysis (PCA) of the metabolomic data showed that YAP OE and control samples separated from each other clearly, indicating that they have different metabolic profiles (Extended Data Fig. 1c). Further analysis showed that among all the detected metabolites, the levels of 46 metabolites were upregulated significantly in YAP OE livers, while 100 metabolites were downregulated (|fold change| > 1.2 and P < 0.05) (Fig. 1b and Extended Data Fig. 1d,e). Interestingly, two metabolites, N-acetylputrescine and arginine in the polyamine biosynthesis pathway, were among the top upregulated metabolites in YAP OE livers (Fig. 1b–d). We next measured the levels of all metabolites in the polyamine biosynthesis pathway, which use arginine and ornithine as precursors to produce polycationic alkylamines including putrescine, spermidine and spermine. Indeed, most of the metabolites in this pathway were significantly upregulated in YAP OE livers as well as total polyamine levels (Fig. 1e,f). These results suggest that YAP promotes polyamine biosynthesis.
Fig. 1|. YAP activation promotes polyamine biosynthesis in mouse liver.
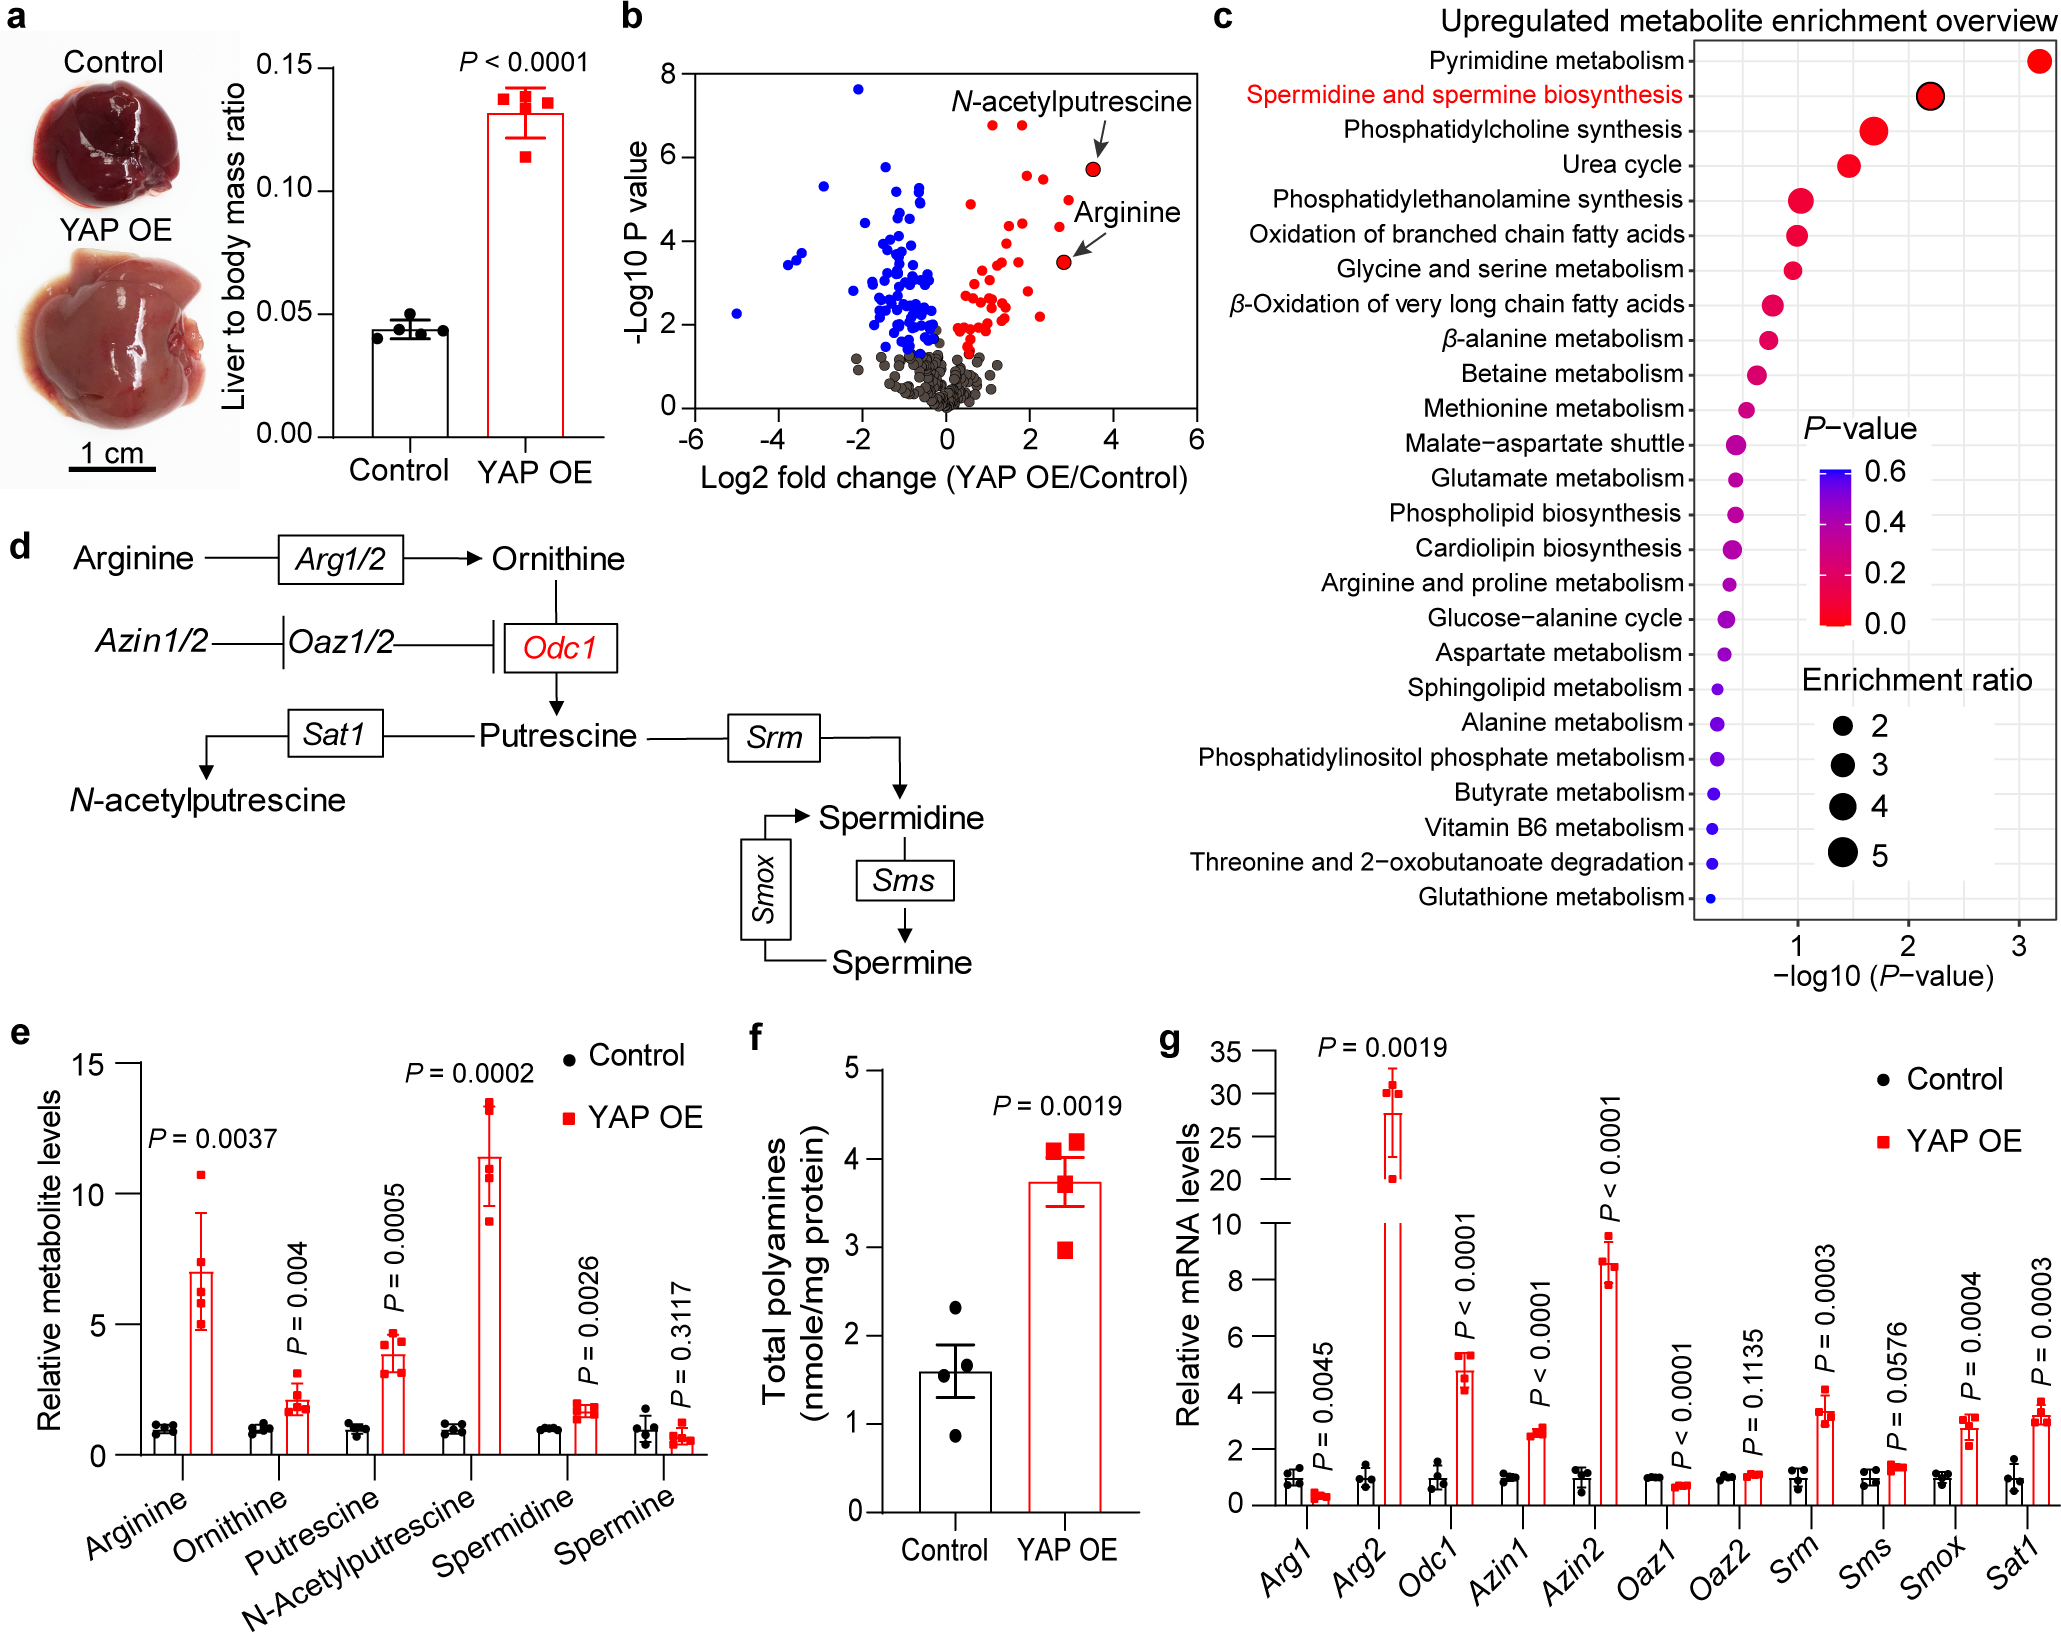
a, One-month old hepatocyte-specific, tetracycline-inducible YAP transgenic mice (YAP OE) and wild type littermates (Control) were treated with doxycycline in drink water for 10 days to induce YAP overexpression in the liver. Representative liver images are shown in the left panel, and liver to body mass ratios are shown in the right panel. Data are represented as mean ± SD, n = 5, unpaired two-tailed Student’s t-test.
b, A volcano plot of changed metabolites induced by YAP OE. Metabolites with |fold change|>1.2 and P < 0.05 are highlighted in red (increased) or blue (decreased), unpaired two-tailed Student’s t-test.
c, Metabolic pathway enrichment analysis of upregulated metabolites in YAP OE livers. P value was calculated using one-tailed Fisher’s exact test.
d, A schematic diagram of polyamine metabolic pathway. Arg1/2, arginase 1/2. Azin1/2, antizyme inhibitor 1/2. Oaz1/2, ornithine decarboxylase antizyme 1/2. Odc1, ornithine decarboxylase. Sat1, diamine acetyltransferase 1. Srm, spermidine synthase. Sms, spermine synthase. Smox, spermine oxidase.
e, Relative levels of metabolites involved in polyamine metabolism in control and YAP OE livers. Data are represented as mean ± SD, n = 5, unpaired two-tailed Student’s t-test.
f, Levels of total polyamines in control and YAP OE livers. Data are represented as mean ± SEM, n = 4, unpaired two-tailed Student’s t-test.
g, Relative mRNA levels of genes involved in polyamine metabolism in control and YAP OE livers. Data are represented as mean ± SD, n = 4, unpaired two-tailed Student’s t-test.
To understand how YAP promotes polyamine biosynthesis, we measured the mRNA levels of all enzymes and regulators of the polyamine biosynthesis pathway (Fig. 1d). Arginase 2 (Arg2), ornithine decarboxylase 1 (Odc1), antizyme inhibitor 1/2 (Azin1/2), spermidine synthase (Srm), spermine oxidase (Smox) and diamine acetyltransferase 1 (Sat1) were upregulated significantly in YAP OE livers, while arginase 1 (Arg1) and ornithine decarboxylase antizyme (Oaz1) were downregulated (Fig. 1g). Of note, ODC1 is the key rate-limiting enzyme in the polyamine biosynthesis pathway. ODC1 functions as a homodimer and its enzymatic activity is inhibited by OAZ1, which competitively binds to ODC1 to prevent ODC1 homodimer formation or to induce ODC1 degradation13,14. OAZ1, in turn, is antagonized by AZIN1/2, which competes with ODC1 for OAZ1 binding and therefore stabilizes ODC113,14. Thus, the increased expression of Odc1 and Azin1/2 as well as the decreased expression of Oaz1 are both consistent with the increased polyamine levels we observed in YAP OE livers, suggesting that YAP/TAZ regulates multiple components of the polyamine biosynthesis pathway to promote polyamine production in vivo. Further corroborating this view, similar changes in polyamine levels and enzyme expression were observed in moues livers lacking Sav115,16, an upstream negative regulator of YAP/TAZ (Extended Data Fig. 2a–e).
YAP/TAZ regulates polyamine biosynthesis in human cells
We next investigated the relationship between YAP/TAZ and polyamine biosynthesis in human cells. As in mouse livers, expression of constitutively active YAP (YAP5SA), or constitutively active TAZ (TAZ4SA), markedly increased the expression of the rate-limiting enzyme ODC1 in human hepatocellular carcinoma (HCC) cell lines HLE and SNU-886 (Fig. 2a–c). Conversely, double knockdown of YAP and TAZ in these HCC cell lines significantly downregulated ODC1 expression (Fig. 2d–g), as well as total polyamine levels (Fig. 2h). Analysis of human HCC data from the Cancer Genome Atlas (TCGA) revealed that ODC1 mRNA level is significantly upregulated in tumors and positively correlated with YAP/YAZ mRNA levels (r = 0.37, P < 2E-15), and that ODC1 is a prognosis unfavorable gene (Fig. 2i–l). In addition to HCC cells, regulation of ODC1 transcription by YAP/TAZ was confirmed in additional cell lines including HPNE (pancreatic duct cell), HEK293T, MCF10A, MDA-MB-231 (breast cancer), and ES-2 (ovarian cancer) (Extended Data Fig. 3a–e), implicating ODC1 as a general transcription target of YAP/TAZ in human cells. Further supporting this view, analysis of TCGA datasets revealed a significant and positive correlation between YAP/TAZ and ODC1 mRNA levels in nearly all cancer types (Supplementary Table 1).
Fig. 2|. YAP/TAZ regulates ODC1 expression and polyamine biosynthesis in human HCC.
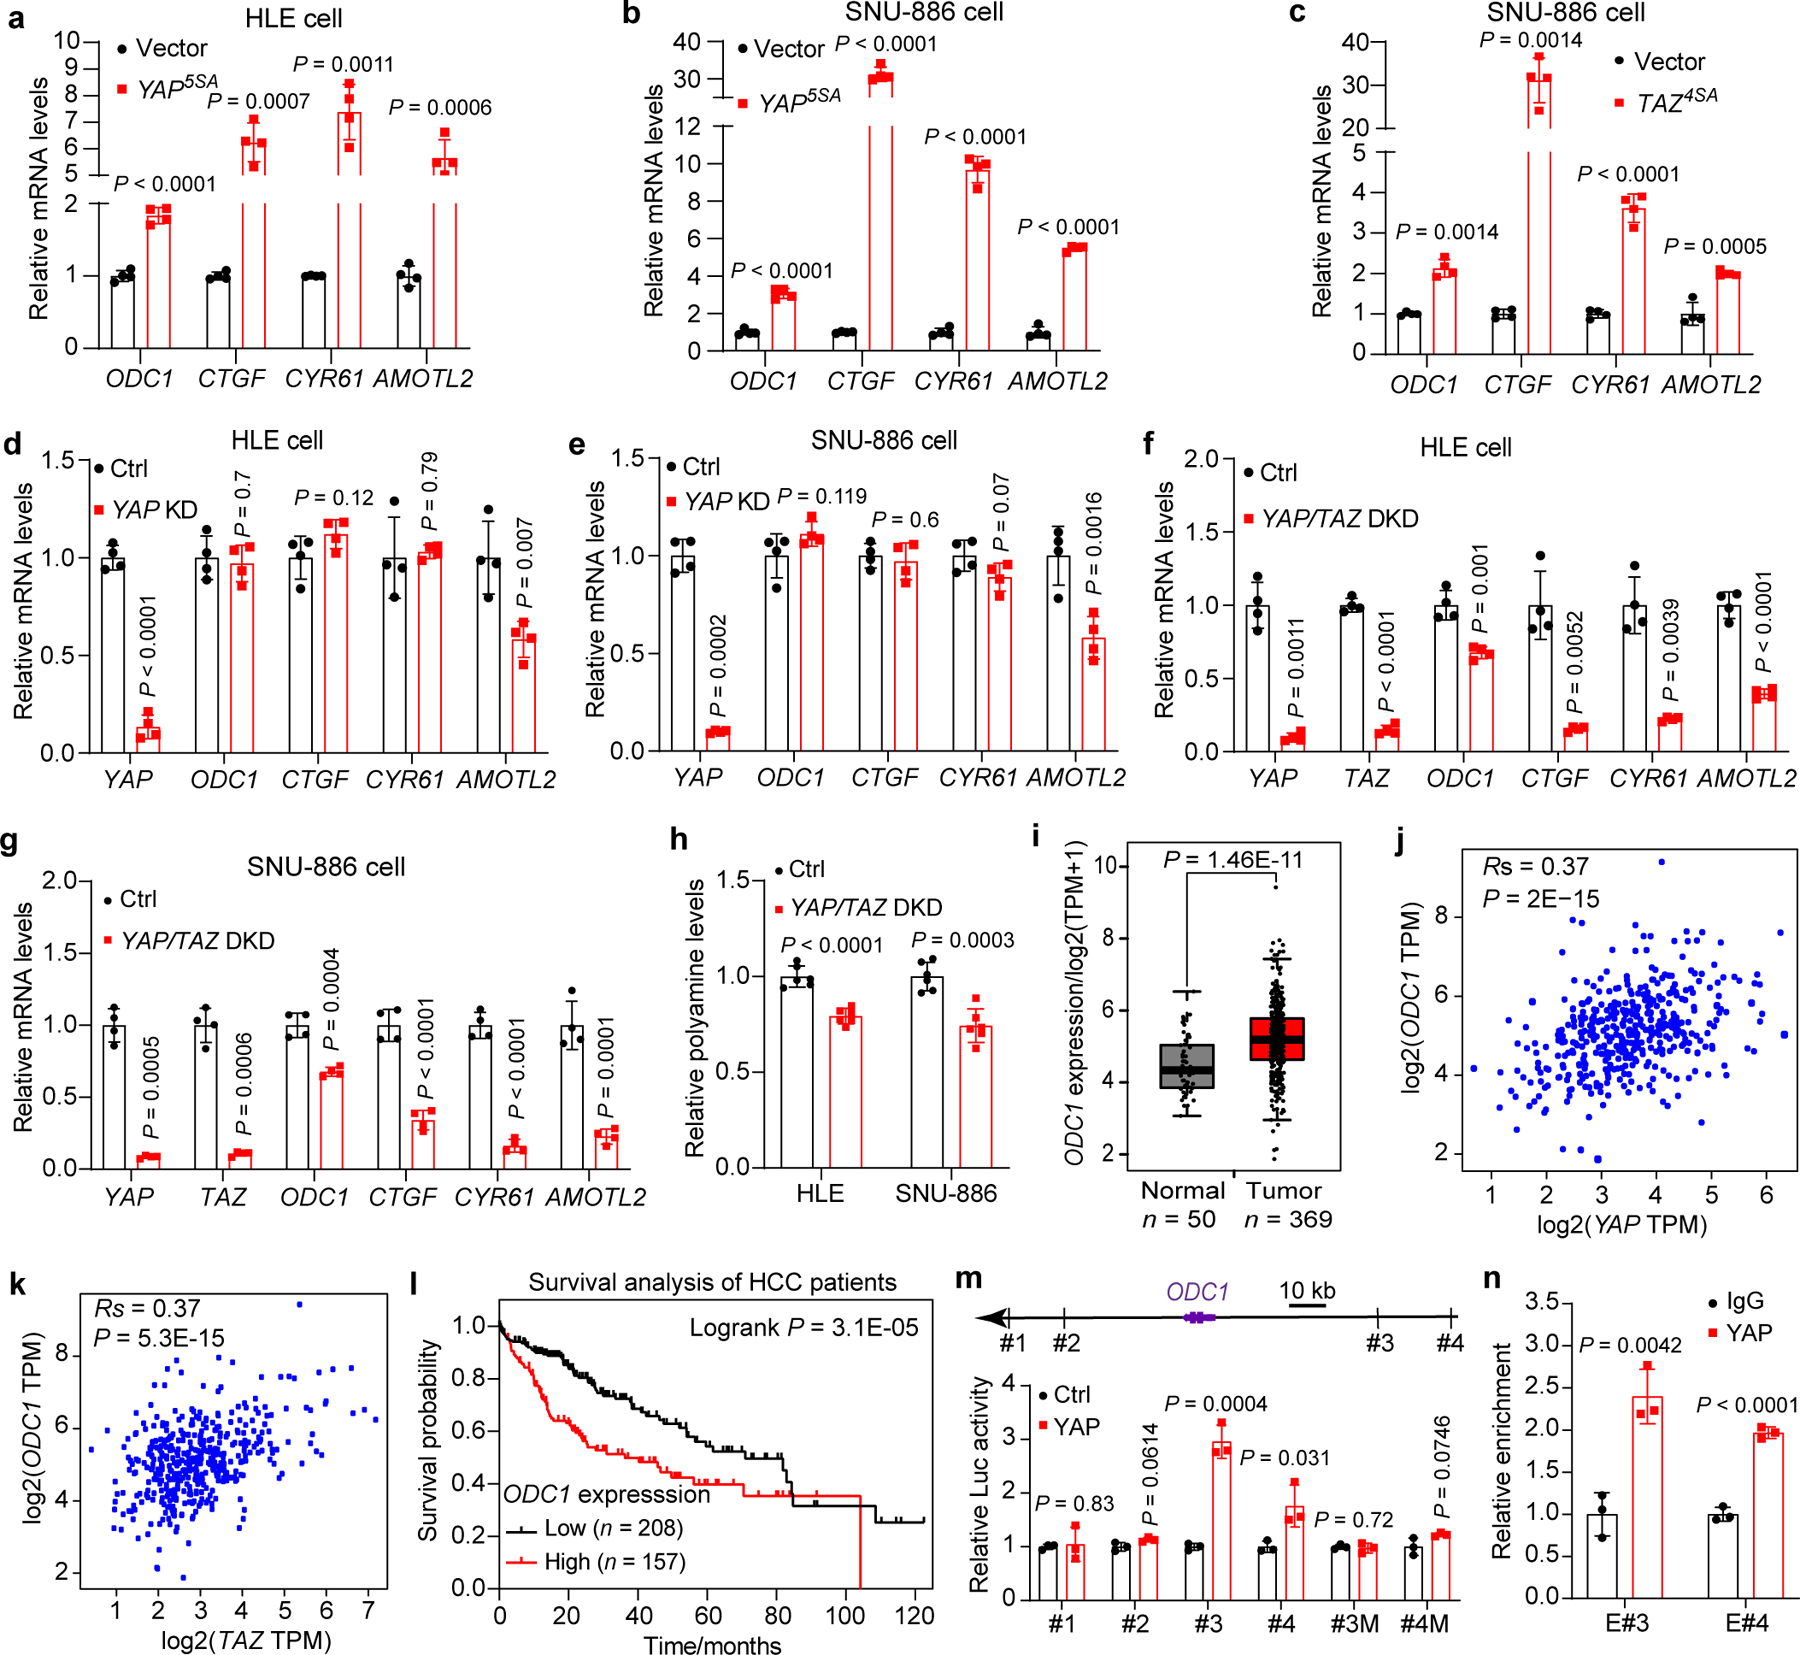
a,b, HLE and SNU-886 cells were transfected with Lenti-vector (Vector) or Lenti-YAP5SA (YAP5SA) to establish stable cell lines, and relative mRNA levels of indicated genes were measured by RT-qPCR. Data are represented as mean ± SD, n = 4, unpaired two-tailed Student’s t-test.
c, SNU-886 cells were transiently transfected with empty vector or TAZ4SA plasmids, and relative mRNA levels of ODC1 were measured by RT-qPCR. Data are represented as mean ± SD, n = 4, unpaired two-tailed Student’s t-test.
d,e, HLE and SNU-886 cells were transfected with siRNA targeting YAP (YAP KD) or non-targeting control (Ctrl). Relative mRNA levels of indicated genes were measured by RT-qPCR. Data are represented as mean ± SD, n = 4, unpaired two-tailed Student’s t-test.
f,g, HLE and SNU-886 cells were transfected with siRNAs targeting YAP and TAZ (YAP/TAZ DKD) or non-targeting control (Ctrl). Relative mRNA levels of indicated genes were measured by RT-qPCR. Data are represented as mean ± SD, n = 4, unpaired two-tailed Student’s t-test.
h, Relative total polyamine levels were measured in the indicated cells. Data are represented as mean ± SD, n = 6, unpaired two-tailed Student’s t-test.
i, Comparison of ODC1 mRNA levels (TPM, transcripts per million) in tumors and matched normal tissues from human hepatocellular carcinoma (HCC) patients in the TCGA dataset. For the boxplots, the center lines mark the median, the box limits indicate the 25th and 75th percentiles, and the whiskers extend 1.5× the interquartile range from the 25th and 75th percentiles (biologically independent samples n = 50 for normal, n = 369 for tumor, unpaired two-tailed Student’s t-test).
j,k, Spearman correlation between YAP/TAZ and ODC1 in tumors and matched normal tissues from HCC patients in the TCGA dataset (two-tailed Spearman’s correlation test).
l, Kaplan-Meier overall survival analysis of ODC1 for HCC patients from the TCGA dataset. P value was calculated using the two-side log-rank test.
m, Luciferase reporter assay in 293T cells of putative ODC1 enhancers containing either wildtype or mutated TEAD binding sites. Data are represented as mean ± SD, n = 3, unpaired two-tailed Student’s t-test.
n, ChIP-qPCR assay in SNU-886 cells showing YAP bound to ODC1 enhancer #3 and #4. Data are represented as mean ± SD, n = 3, unpaired two-tailed Student’s t-test.
YAP/TAZ functions as a transcriptional coactivator by engaging the TEAD family DNA-binding transcription factors to bind distal enhancers of target gene17,18. We analyzed the publicly available chromatin immunoprecipitation-sequencing (ChIP-seq) and Hi-C seq data from multiple human cell lines and liver, and identified 4 potential TEAD-binding sequences (TBSs) in distal regulatory regions of ODC1 (Extended Data Fig. 3f,g). Luciferase reporter assay showed that two of them (#3 and #4) induced luciferase expression in response to YAP expression and mutation of the TBSs abolished the induction (Fig. 2m). In addition, ChIP-qPCR assay also confirmed that YAP bound to the #3 and #4 TBSs in SNU-886 cells (Fig. 2n). Consistent with these results, YAP5SA/S94A, a mutant defective in TEAD binding, could not induce ODC1 expression (Extended Data Fig. 3h,i). To further assess the role of the two TBSs in ODC1 induction by YAP, we deleted #3 or #3 and #4 jointly in the endogenous locus in haploid cell line HAP1 by CRISPR-Cas9. Deletion of #3 TBS significantly reduced, and deletion of both #3 and #4 TBSs nearly abolished, YAP-induced endogenous ODC1 transcription with no obvious effect on CTGF induction in HAP1 cells (Extended Data Fig. 3j,k). Altogether, these data suggest that YAP/TAZ directly binds to the distal TBSs to promote ODC1 transcription.
Targeting polyamine biosynthesis inhibits YAP/TAZ-induced cell proliferation
To explore the functional importance of polyamine biosynthesis in YAP-induced mouse liver overgrowth, we treated mice with hepatotropic adeno-associated virus (AAV) carrying short hairpin RNA (shRNA) targeting Odc1 (shOdc). We found that Odc1 knockdown (KD) significantly inhibited YAP-induced liver overgrowth in YAP OE animals (Fig. 3a–e). Interestingly, liver size and total polyamine level showed a strong positive correlation (Fig. 3f). Hematoxylin and eosin (H&E) and Ki67 (cell proliferation marker) staining revealed that Odc1 KD dramatically inhibited YAP-induced histological changes and cell proliferation (Fig. 3g,h). Odc1 KD also reversed YAP-induced expression of the fetal liver-specific alpha-fetoprotein (Afp) in adult livers (Fig. 3i), suggesting that Odc1 KD suppressed YAP-driven de-differentiation of hepatocytes. To further corroborate these results, we used AAV-delivered Oaz1 (AAV8-Alb>Oaz1) to ectopically express OAZ1, an endogenous inhibitor of ODC1, specifically in YAP OE livers. As expected, Oaz1 ectopic expression reduced polyamine levels, and more importantly, dramatically suppressed liver overgrowth, histological changes and cell proliferation induced by YAP OE (Extended Data Fig. 4a–i). Collectively, these findings support the physiological importance of polyamine biosynthesis in YAP-induced cell proliferation in vivo.
Fig. 3|. Odc1 knockdown inhibits YAP-induced liver overgrowth and polyamine biosynthesis.
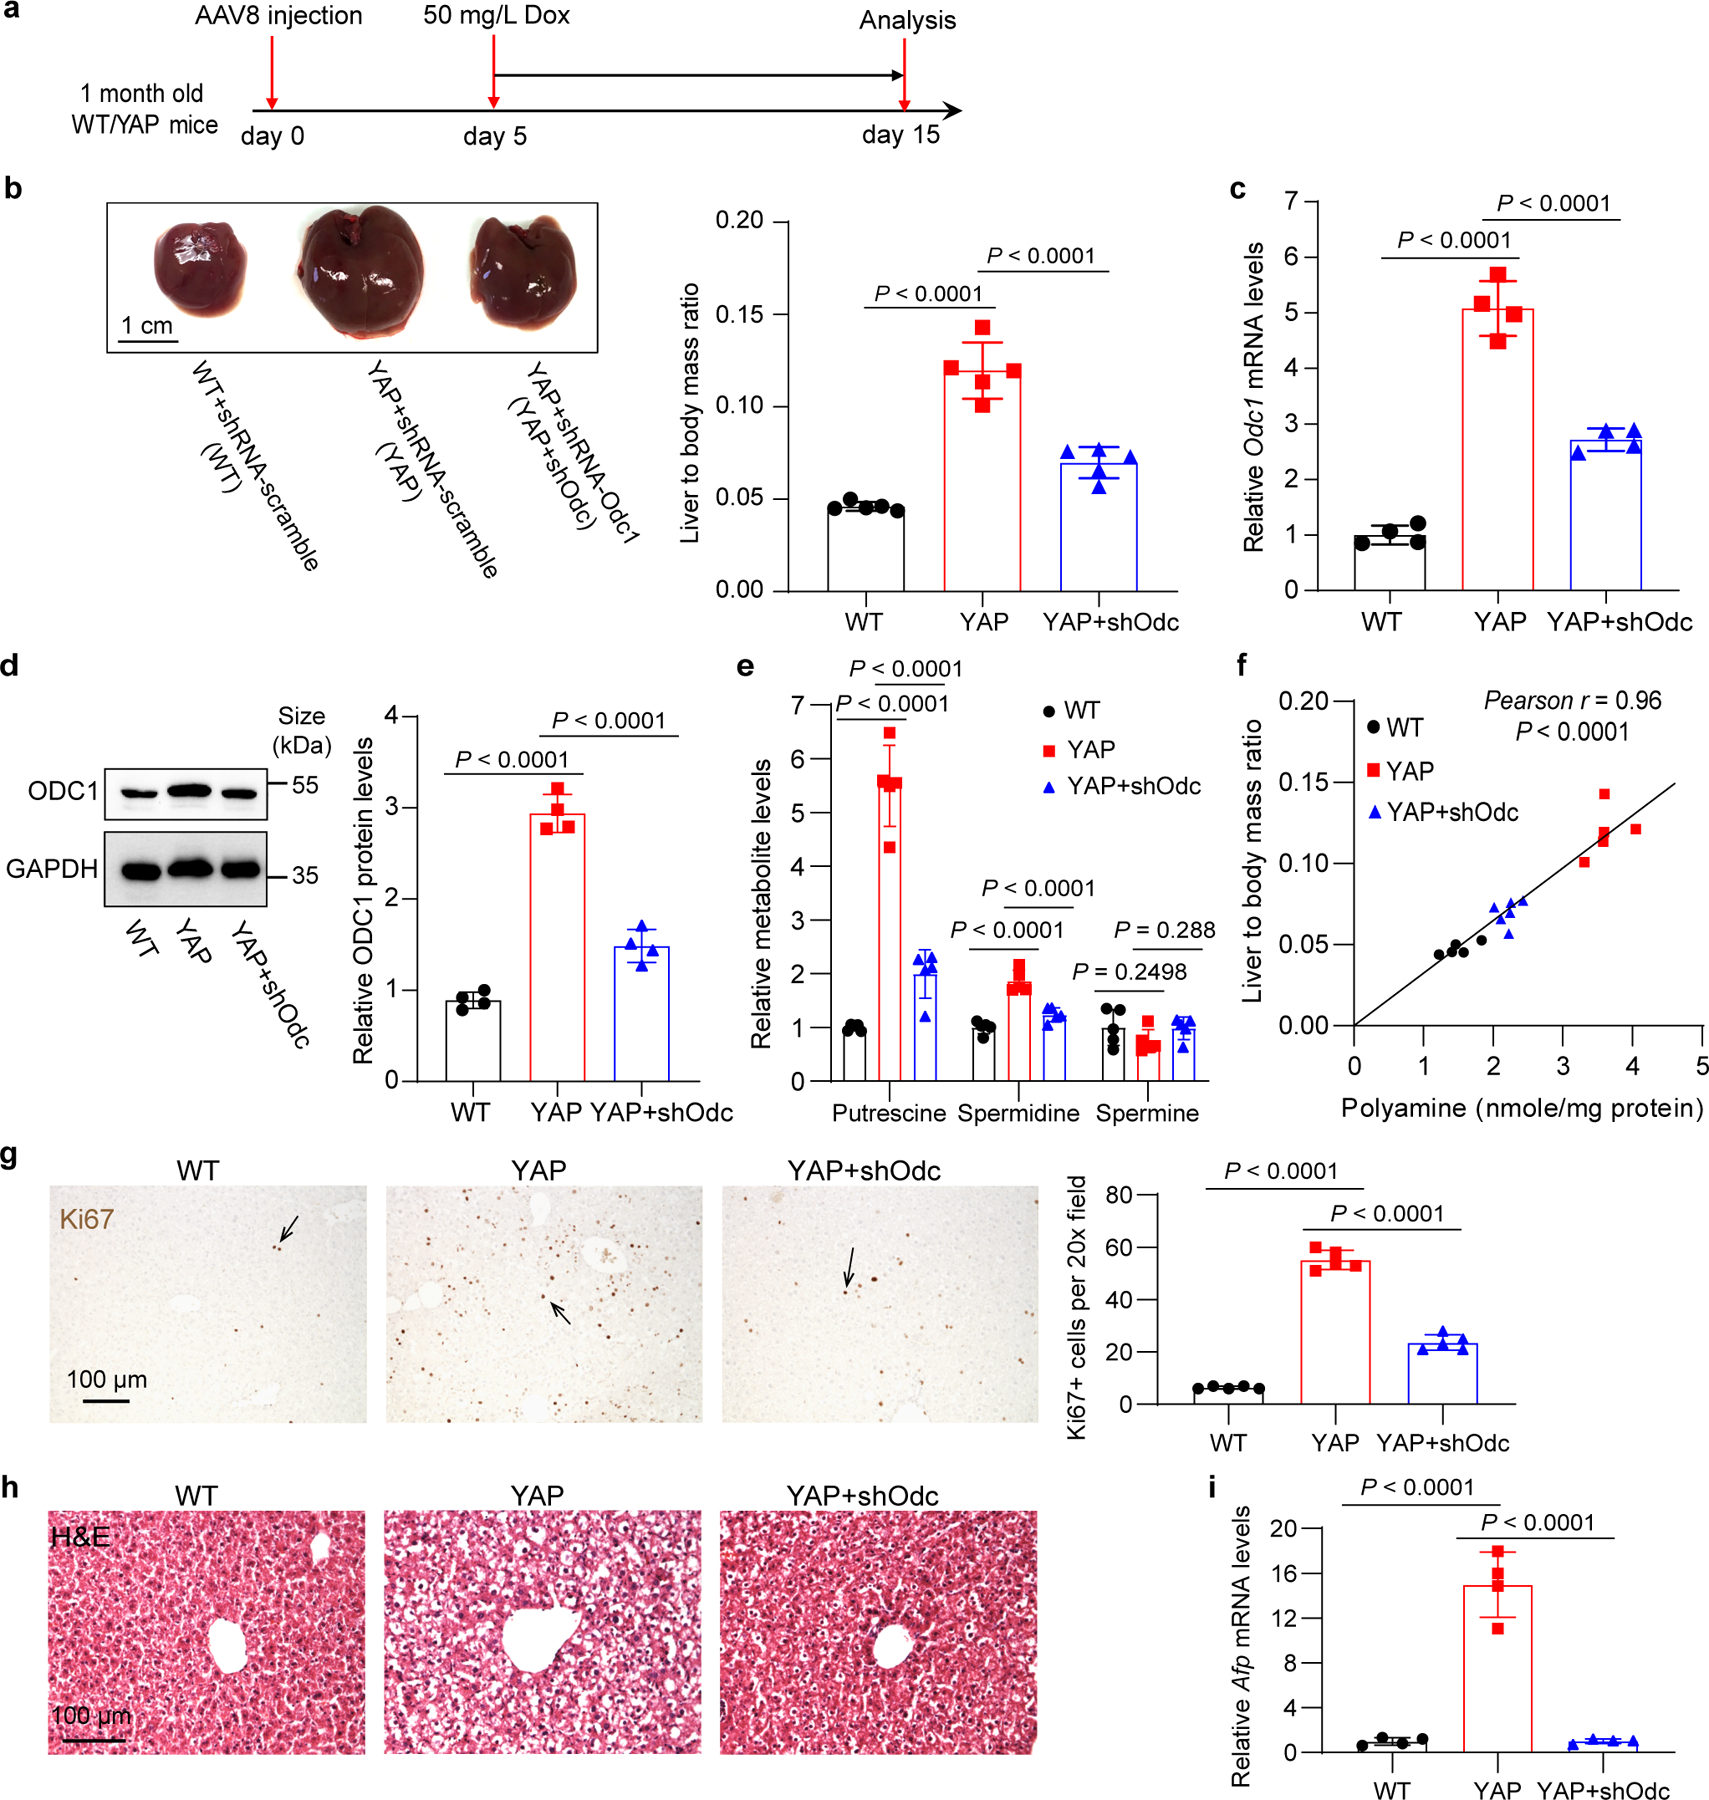
a, Experimental design. One-month old wild type (WT) and Dox inducible YAP transgenic (YAP) mice were treated with AAV8-shRNA-Odc1(shOdc) or non-targeting scramble. Five days later, 50 mg/L Dox was added in drink water to induce YAP overexpression for 10 days.
b, Representative liver images are shown in the left panel, and liver to body mass ratios are shown in the right panel. Data are represented as mean ± SD, n = 5 mice per group, one-way ANOVA, Tukey’s multiple comparisons test.
c, Relative Odc1 mRNA levels were examined by RT-qPCR. Data are represented as mean ± SD, n = 4, one-way ANOVA, Tukey’s multiple comparisons test.
d, Representative western blot images of liver extractions of indicated genotypes (left) and the quantification results of ODC1 protein levels (right). Data are represented as mean ± SD, n = 4 mice per group, one-way ANOVA, Tukey’s multiple comparisons test.
e, Relative levels of individual polyamine. Data are represented as mean ± SD, n = 5, one-way ANOVA, Dunnett’s multiple comparisons test.
f, Pearson correlation between liver size and total polyamine concentrations in the mice from all the three groups (n = 5 mice for WT and YAP, n = 6 mice for YAP+shOdc, two-tailed Pearson correlation test).
g, Quantitation of Ki67+ cells. Data are represented as mean ± SD, n = 5, one-way ANOVA, Tukey’s multiple comparisons test.
h, Representative images of H&E staining of liver samples of WT, YAP, and YAP+shOdc mice.
i, Relative mRNA levels of Afp. Data are represented as mean ± SD, n = 4, one-way ANOVA, Tukey’s multiple comparisons test.
We next extended our studies to human cancer cells. MDA-MB-231 and ES-2 cells show YAP/TAZ activation due to NF2 null mutation and YAP gene amplification, respectively19,20, and as we showed earlier in this study, these cells display increased ODC1 expression in a YAP/TAZ-dependent manner (Extended Data Fig. 3d,e). Treating MDA-MB-231 or ES-2 cells with difluoromethylornithine (DFMO), an ODC1 inhibitor21 significantly inhibited the proliferation of both cell lines. As expected, the proliferation inhibition by DFMO was rescued by putrescine, the direct product of ODC1 in the polyamine biosynthesis pathway (Extended Data Fig. 5a,b). A similar inhibition by DFMO and rescue by putrescine were observed in HCC cell lines HLE and SNU-886 (Extended Data Fig. 5c,d). In agreement with results from chemical inhibition, ODC1 knockdown by shRNA also inhibited the proliferation of these human cancer cell lines (Extended Data Fig. 5e–k).
Polyamine-mediated eIF5A hypusination controls LSD1 translation
Having established an essential role for polyamine in YAP/TAZ-induced cell proliferation, we next investigated the underlying molecular mechanism. A major cellular function of the polyamine spermidine is to serve as a substrate for hypusination of eukaryotic translation initiation factor 5A (eIF5AHyp). This post-translational modification of eIF5A is catalyzed by the sequential action of two enzymes, deoxyhypusine synthase (DHPS) and deoxyhypusine hydroxylase (DOHH)22–24, and is required for efficient translation of open reading frames encoding short polyproline tracks25,26. Consistent with YAP-induced elevation in spermidine levels (Fig. 1e, 3f), YAP OE livers showed increased eIF5AHyp levels (Fig. 4a). As a starting point to uncover critical mRNA targets of eIF5AHyp that may mediate the pro-proliferative effect of YAP/TAZ, we identified a total of 466 conserved proteins between mouse and human with polyproline motifs (≥ 5 consecutive proline residues) (Extended Data Fig. 6a). Given recent studies implicating the importance of chromatin remodeling in YAP/TAZ-induced transcriptional programs27–29, we focused on proteins among this list that encode enzymes directly regulating histone methylation or acetylation and identified three histone modifying enzymes, lysine-specific histone demethylase 1 (LSD1; also known as KDM1A), lysine-specific demethylase 6B (KDM6B) and histone-lysine N-methyltransferase SET domain containing 2 (SETD2) (Extended Data Fig. 6a). Interestingly, the protein level of LSD1, but not KDM6B or SETD2, was increased in YAP OE livers (Extended Data Fig. 6b,c), implicating LSD1 as a putative target of eIF5AHyp that is stimulated by YAP activity. LSD1 is known to function as a transcriptional repressor by demethylating mono- and dimethylated histone H3 at lysine 4 (H3K4me1 and H3K4me2)30,31. Consistently, YAP OE livers also showed decreased H3K4me1/2 level which can be partially rescued by Odc1 knockdown (Extended Data Fig. 6d).
Fig. 4|. Polyamine-mediated eIF5A hypusination (eIF5AHyp) is required for efficient translation of LSD1.
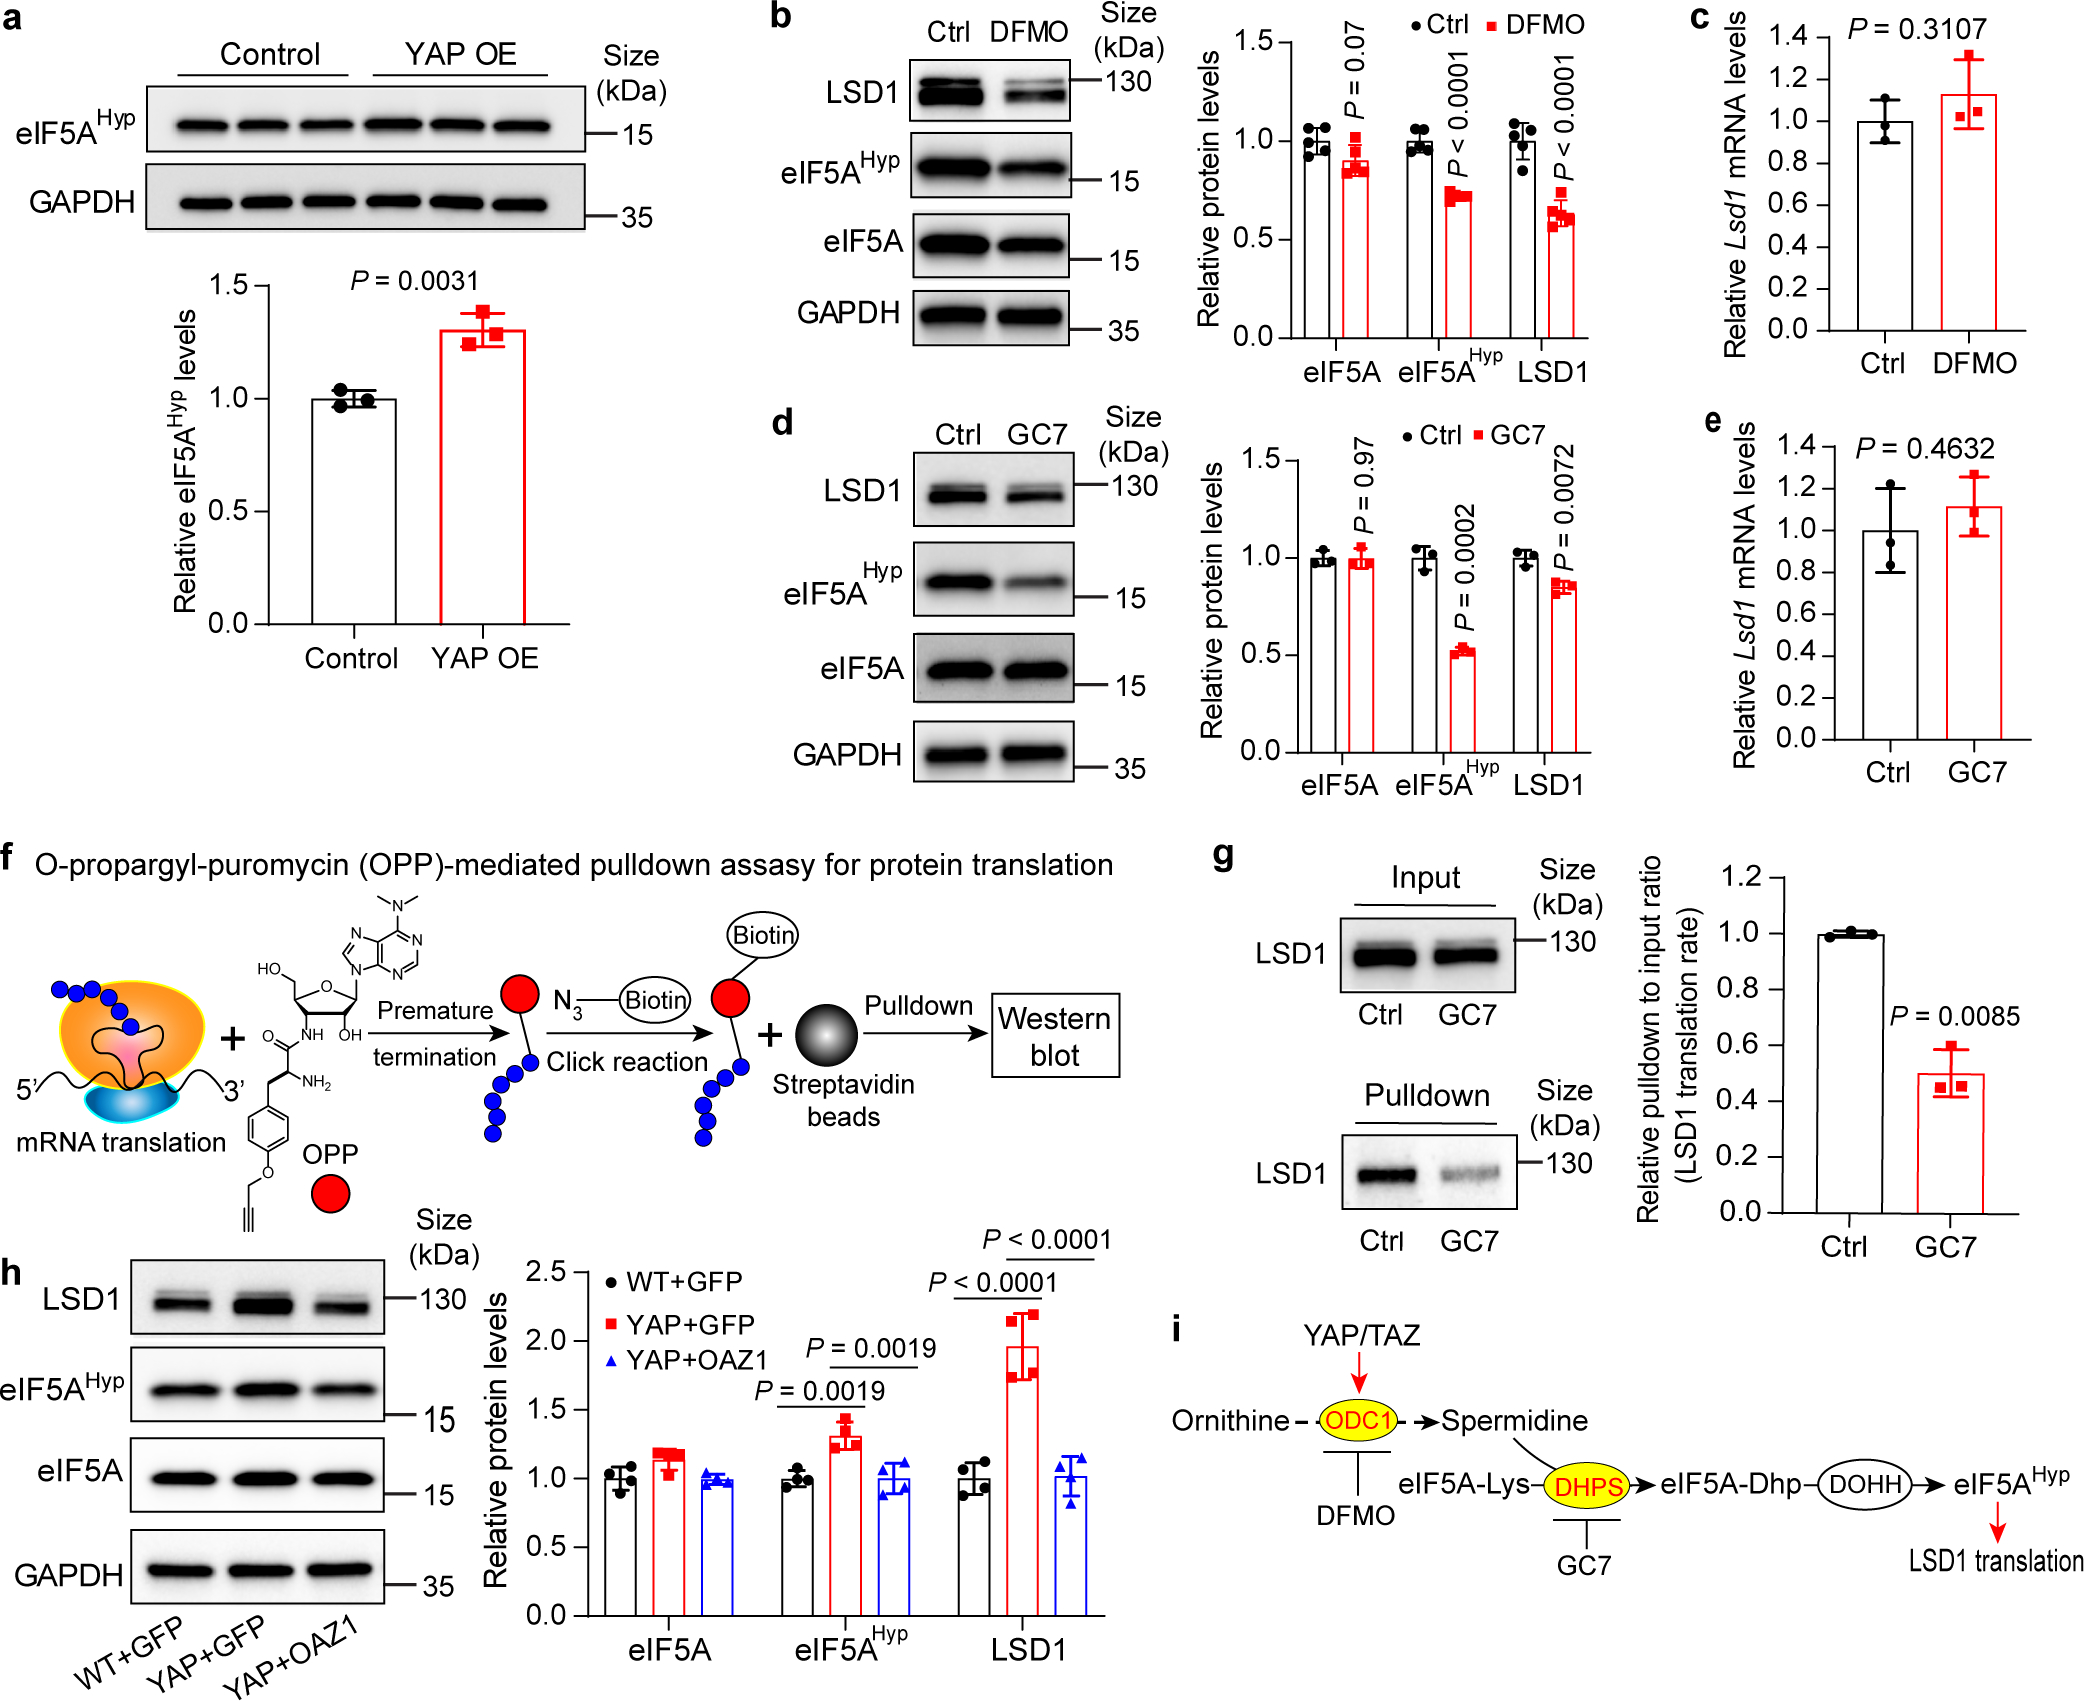
a, Relative levels of eIF5AHyp in control and YAP OE mouse livers. Data are represented as mean ± SD, n = 3, unpaired two-tailed Student’s t-test.
b,c, AML12 cells were treated with 2.5 mM DFMO or PBS (Ctrl) for 72 hours. eIF5AHyp and LSD1 protein and Lsd1 mRNA levels were examined. Data are represented as mean ± SD, n = 5 for b, n = 3 for c, unpaired two-tailed Student’s t-test.
d,e, AML12 cells were treated with 10 μM GC7 or PBS (Ctrl) for 24 hours. eIF5AHyp and LSD1 protein and Lsd1 mRNA levels were examined. Data are represented as mean ± SD, n = 3, unpaired two-tailed Student’s t-test.
f, OPP-pulldown assay for nascent protein synthesis. OPP is incorporated into newly translated proteins, then the azide group on biotin is conjugated to an alkyne group on OPP by click reaction. Biotin-labeled proteins are pulldown by magnetic streptavidin beads and detected by western blot.
g, Relative levels of newly synthesized LSD1 of AML12 cells treated with 10 μM GC7 or PBS (Ctrl) for 24 hours using the method shown in panel (f). Data are represented as mean ± SD, n = 3, unpaired two-tailed Student’s t-test.
h, Relative protein levels of LSD1, eIF5A and eIF5AHyp in livers of wild type mice treated with AAV8-GFP (WT+GFP), YAP OE treated with AAV8-GFP (YAP+GFP) or AAV8-Oaz1 (YAP+OAZ1) (see Extended Data Fig. 4a,b for experimental design). Quantification data are represented as mean ± SD, n = 4, one-way ANOVA, Dunnett’s multiple comparisons test.
i, A schematic showing the proposed polyamine-eIF5AHyp-LSD1 axis.
To examine whether spermidine promotes LSD1 translation through eIF5AHyp, we treated various cell lines (mouse hepatocyte cell line AML12, and human cancer cell lines HLE, MDA-MB-231 and ES-2) with the ODC1 inhibitor DFMO to lower spermidine levels (Extended Data Fig. 7a–d), or the DHPS inhibitor N1-Guanyl-1,7-diaminohepatane (GC7) to inhibit eIF5A hypusination32. Supporting our hypothesis, both treatments reduced eIF5AHyp and LSD1 protein levels with little effect on LSD1 mRNA levels in all cell lines (Fig. 4b–e and Extended Data Fig. 6e–l). To directly visualize the translation of LSD1 mRNA, we performed an O-propargyl-puromycin (OPP)-mediated pulldown assay to detect nascent synthesized LSD1 protein (Fig. 4f). Indeed, newly synthesized LSD1 was dramatically reduced after GC7 treatment in all cell lines (Fig. 4g and Extended Data Fig. 6m–o), consistent with eIF5AHyp promoting LSD1 translation. Lastly, we examined YAP OE livers that ectopically expressed the ODC1 antizyme OAZ1, a well-known inhibitor of ODC1 enzyme. OAZ1 overexpression not only suppressed YAP-induced polyamine production and liver overgrowth as shown earlier in this study (Extended Data Fig. 4a–e), but also rescued YAP-induced changes in eIF5AHyp and LSD1 protein levels (Fig. 4h). Taken together, these results suggest that polyamine-mediated eIF5AHyp may represent a general mechanism controlling LSD1 protein level (Fig. 4i).
To further strengthen our model linking YAP, polyamine synthesis and LSD1 translation, we examined androstane receptor agonist TCPOBOP-induced hepatomegaly. Unlike YAP-induced hepatomegaly, TCPOBOP-induced hepatomegaly did not increase the expression of ODC1 or LSD1 (Extended Data Fig. 6p–r). These results demonstrate that YAP-induced changes in these genes are not merely the consequence of liver overgrowth.
LSD1 is required for YAP/TAZ-induced cell proliferation and tumor growth
To further interrogate the functional importance of the YAP/TAZ-polyamine-eIF5AHyp-LSD1 axis in vivo, we asked whether LSD1 is required for YAP OE-induced mouse liver overgrowth. We therefore generated the YAP OE;Lsd1flox/flox mice (or Lsd1flox/flox as control), and treated the animals with hepatotropic AAV carrying hepatocyte-specific Cre (AAV8-ApoE/AAT1-Cre) to knock out Lsd1 in the liver (Fig. 5a). While AAV8-ApoE/AAT1-Cre treatment had little effect on liver size, histology or cell proliferation in Lsd1flox/flox animals (Extended Data Fig. 8a–d), the same treatment regime in YAP OE;Lsd1flox/flox animals remarkably suppressed the changes of liver size, histology and cell proliferation induced by YAP OE (Fig. 5b–f). As in mouse livers, LSD1 knockdown by shRNA also significantly inhibited the proliferation of multiple human cancer cell lines with active YAP/TAZ (Fig. 6a–c and Extended Data Fig. 9a–d). Consistent with these genetic findings, pharmacologic suppression of LSD1 using a reversible LSD1 inhibitor SP-2577, which is currently in phase I clinical trials for relapsed or refractory Ewing sarcoma and advanced solid tumors (ClinicalTrials.gov Identifier: NCT03600649 and NCT03895684), not only suppressed YAP OE-induced liver overgrowth (Fig. 5g,h), but also inhibited the proliferation of multiple human cancer cell lines with active YAP/TAZ both in cell culture and in mouse xenograft (Fig. 6d–i and Extended Data Fig. 9e). These genetic and pharmacologic data further support our hypothesis implicating LSD1 as downstream mediator of the YAP/TAZ-polyamine-eIF5AHyp-LSD1 axis.
Fig. 5|. LSD1 suppression inhibits YAP-induced overgrowth in mouse liver.
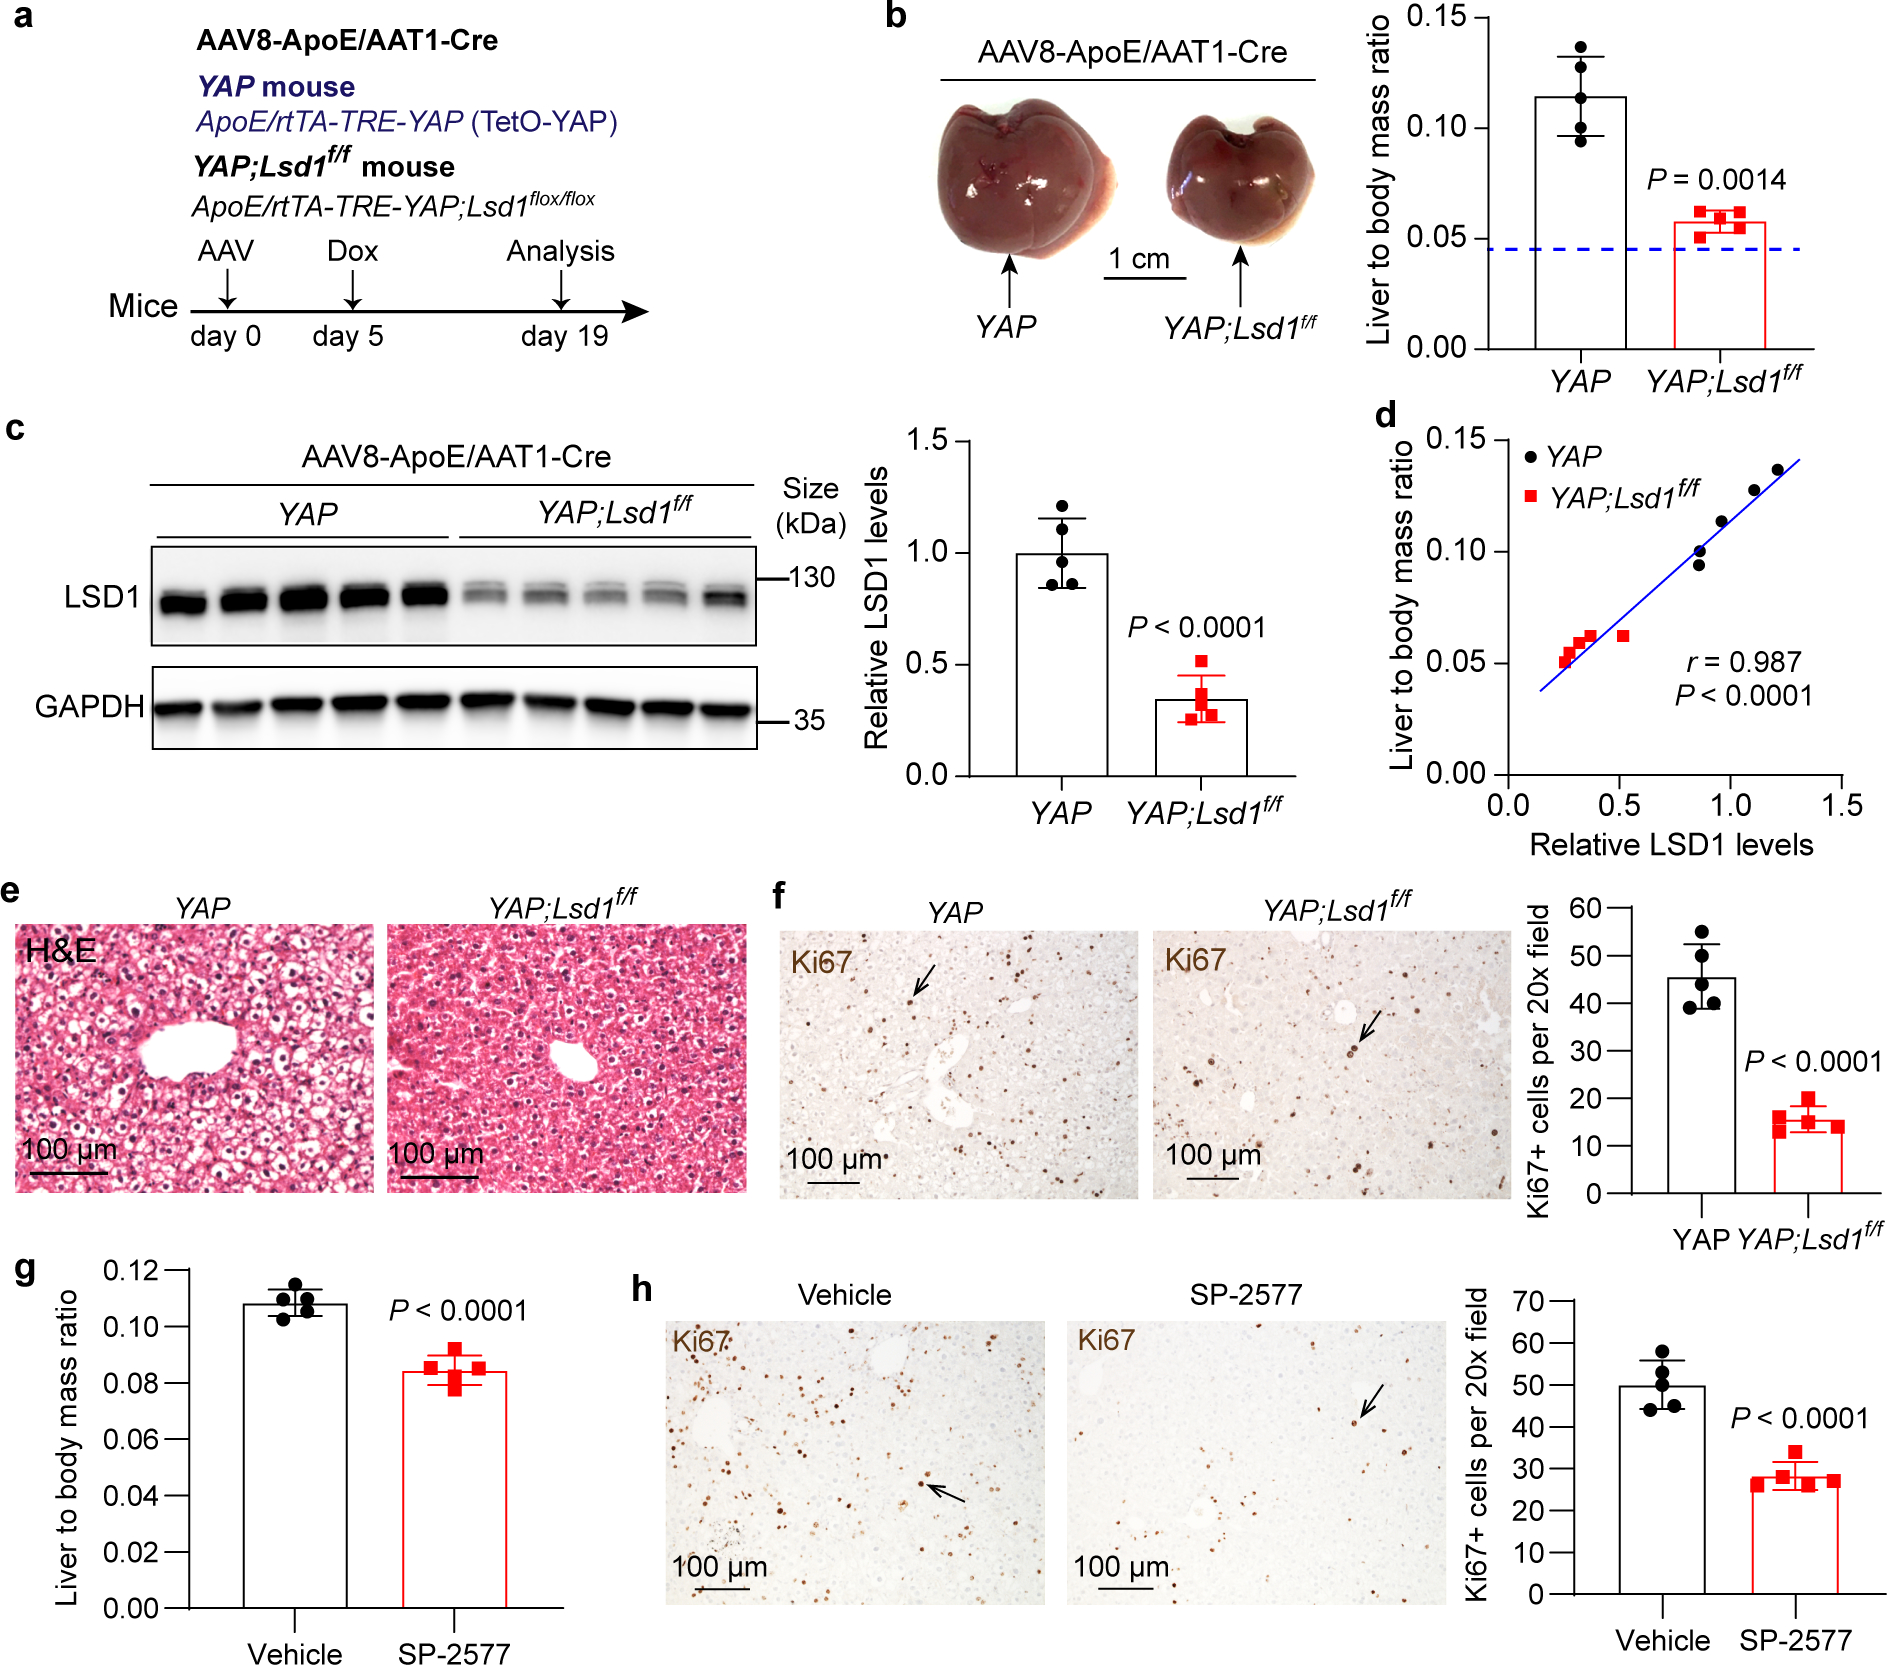
a, Experimental procedure to knock out Lsd1 in YAP OE mouse liver. The YAP transgenic mice and YAP;Lsd1f/f mice were transduced with AAV8-ApoE/AAT1-Cre virus first, then 5 days post AAV treatment, 30 mg/L dox was added in drink water to induce YAP overexpression for 14 days.
b, YAP and YAP;Lsd1f/f mice livers at day 19 and quantification of liver to body mass ratio of the mice described in (a). Blue line indicates the average value of wildtype mice. Data are represented as mean ± SD, n = 5, unpaired two-tailed Student’s t-test.
c, LSD1 protein levels were examined by western blot. Quantification data are represented as mean ± SD, n = 5, unpaired two-tailed Student’s t-test.
d, Pearson correlation between liver size and relative LSD1 protein levels (two-tailed Pearson correlation test).
e, Representative images of H&E staining of livers. Livers from 5 mice each experiment were examined with similar results.
f, Liver Ki67 staining and quantitation. Data are represented as mean ± SD, n = 5, unpaired two-tailed Student’s t-test.
g, YAP transgenic mice were treated with vehicle or 40 mg/kg SP-2577 i.p. daily for 10 days. Relative liver size was quantified as liver to body mass ratio. Data are represented as mean ± SD, n = 5, unpaired two-tailed Student’s t-test.
h, Liver Ki67 staining and quantitation. Data are represented as mean ± SD, n = 5, unpaired two-tailed Student’s t-test.
Fig. 6|. LSD1 suppression inhibits the proliferation of human cancer cells with active YAP/TAZ.
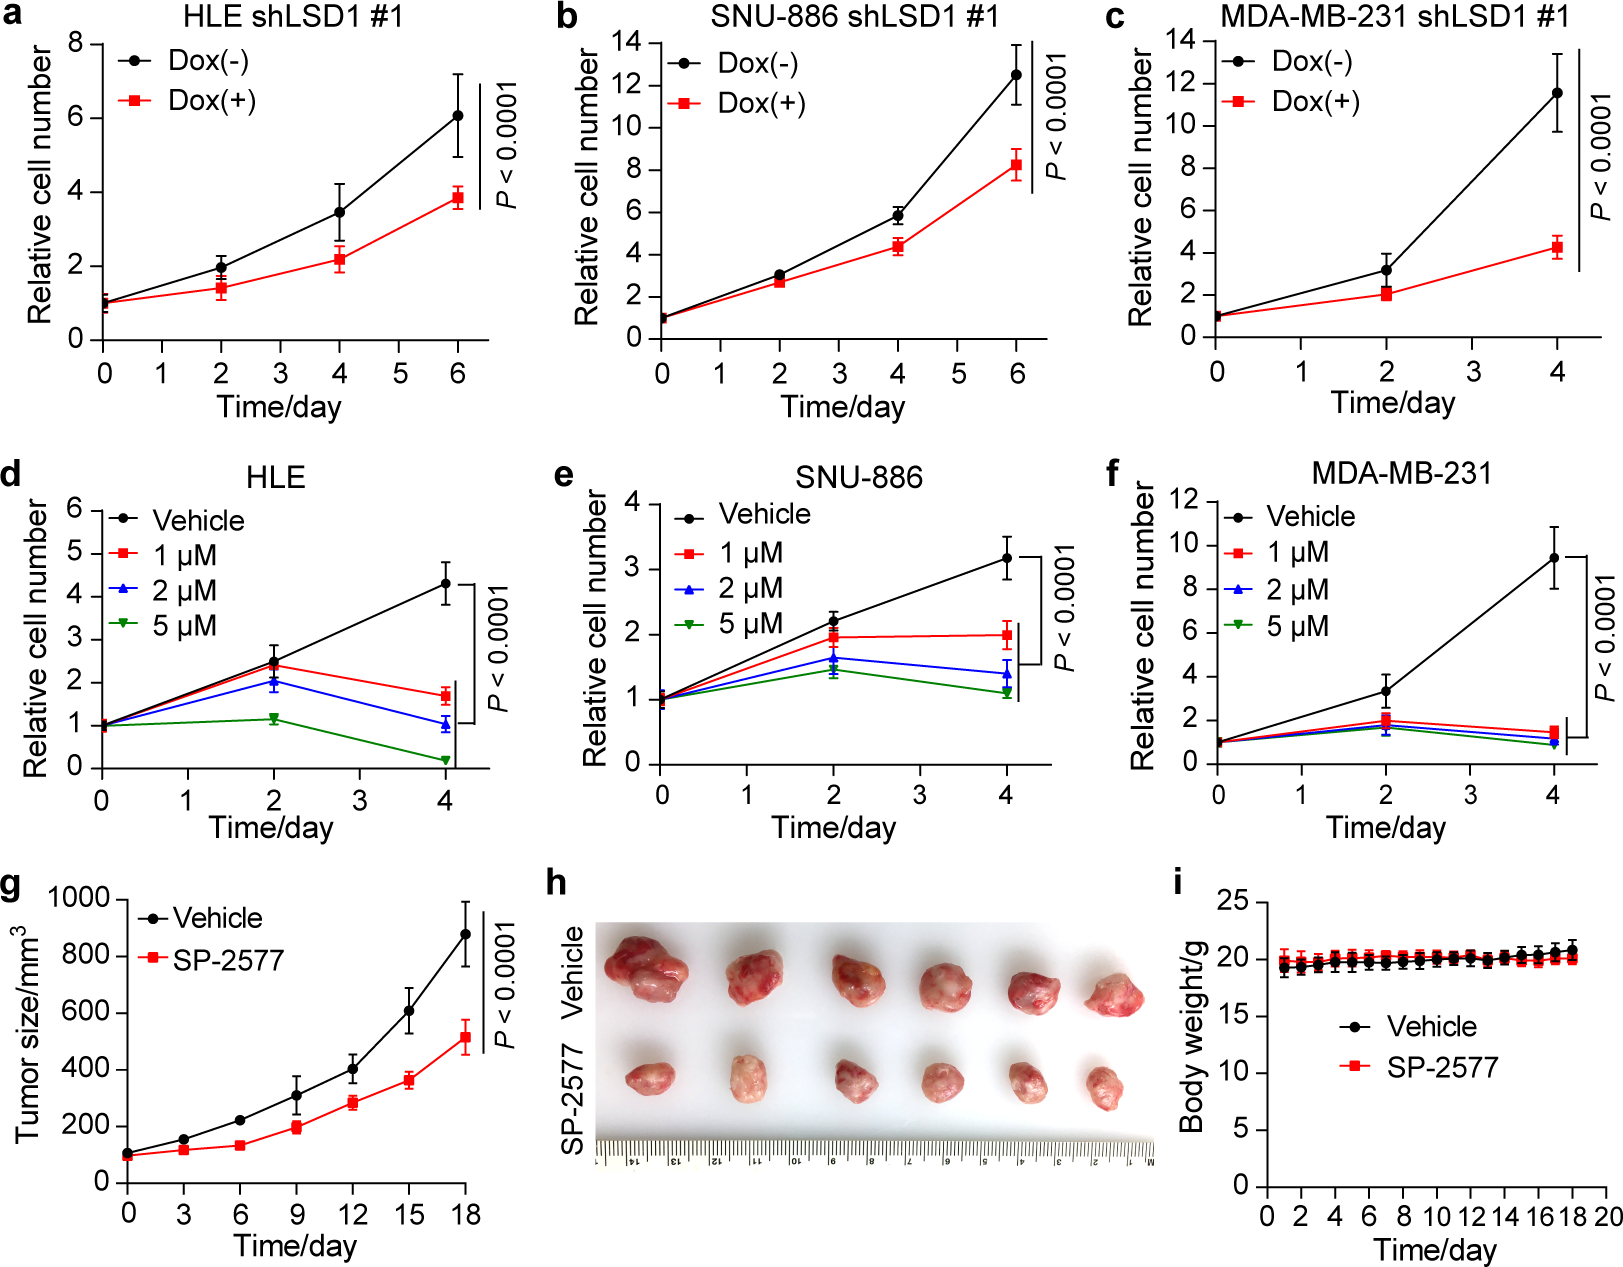
a-c, HLE, SNU-886 and MDA-MB-231 cells carrying doxycycline (Dox) inducible shLSD1 #1 were treated with 1 μg/mL of Dox, and relative cell number was measured. Data are represented as mean ± SD, n = 5 for HLE, n = 6 for SNU-886 and MDA-MB-231, two-way ANOVA.
d-f, HLE, SNU-886 and MDA-MB-231 cells were treated with different concentrations of LSD1 inhibitor SP-2577 and vehicle (DMSO), and relative cell number was measured. Data are represented as mean ± SD, n = 6, two-way ANOVA.
g, Tumor size of MDA-MB-231 xenograft in NSG mice treated with vehicle or SP-2577. Data are represented as mean ± SD, n = 6, two-way ANOVA.
h, Images of tumors derived from the MDA-MB-231 xenografts at the end of the experimental treatment.
i, Body weight of mice during the experimental procedure. No significant difference was found between vehicle and SP-2577 groups (data are presented as mean ± SD, n = 6, P = 0.72, two-way ANOVA).
LSD1 mediates a bulk of YAP-downregulated genes
Research on YAP/TAZ-induced transcriptional changes has largely focused on genes that are upregulated by these transcriptional coactivators. Less appreciated is the fact that in any cellular contexts, YAP/TAZ-upregulated genes are always accompanied by a comparable number of distinct, downregulated genes17,33 (Fig. 7a,b). How YAP/TAZ confers downregulated gene signatures is not well understood, although in principle, this can be mediated by YAP/TAZ inducing the expression a transcriptional repressor such as LSD1. To test this hypothesis, we carried out RNA-seq analysis in mouse livers of wildtype, YAP OE, and YAP OE with Lsd1 knockout. This analysis revealed that ~50% of all YAP-downregulated genes were dependent on LSD1, while ~30% of YAP-upregulated genes were dependent on LSD1 (Fig. 7a,b and Supplementary Table 2). That YAP-downregulated genes are preferentially dependent on LSD1 than YAP-upregulated genes supports our hypothesis implicating LSD1 as a key mediator of YAP-induced transcriptional changes, especially for the YAP-downregulated genes.
Fig. 7|. Identification and functional analysis of the putative LSD1 target genes in YAP OE mouse liver.
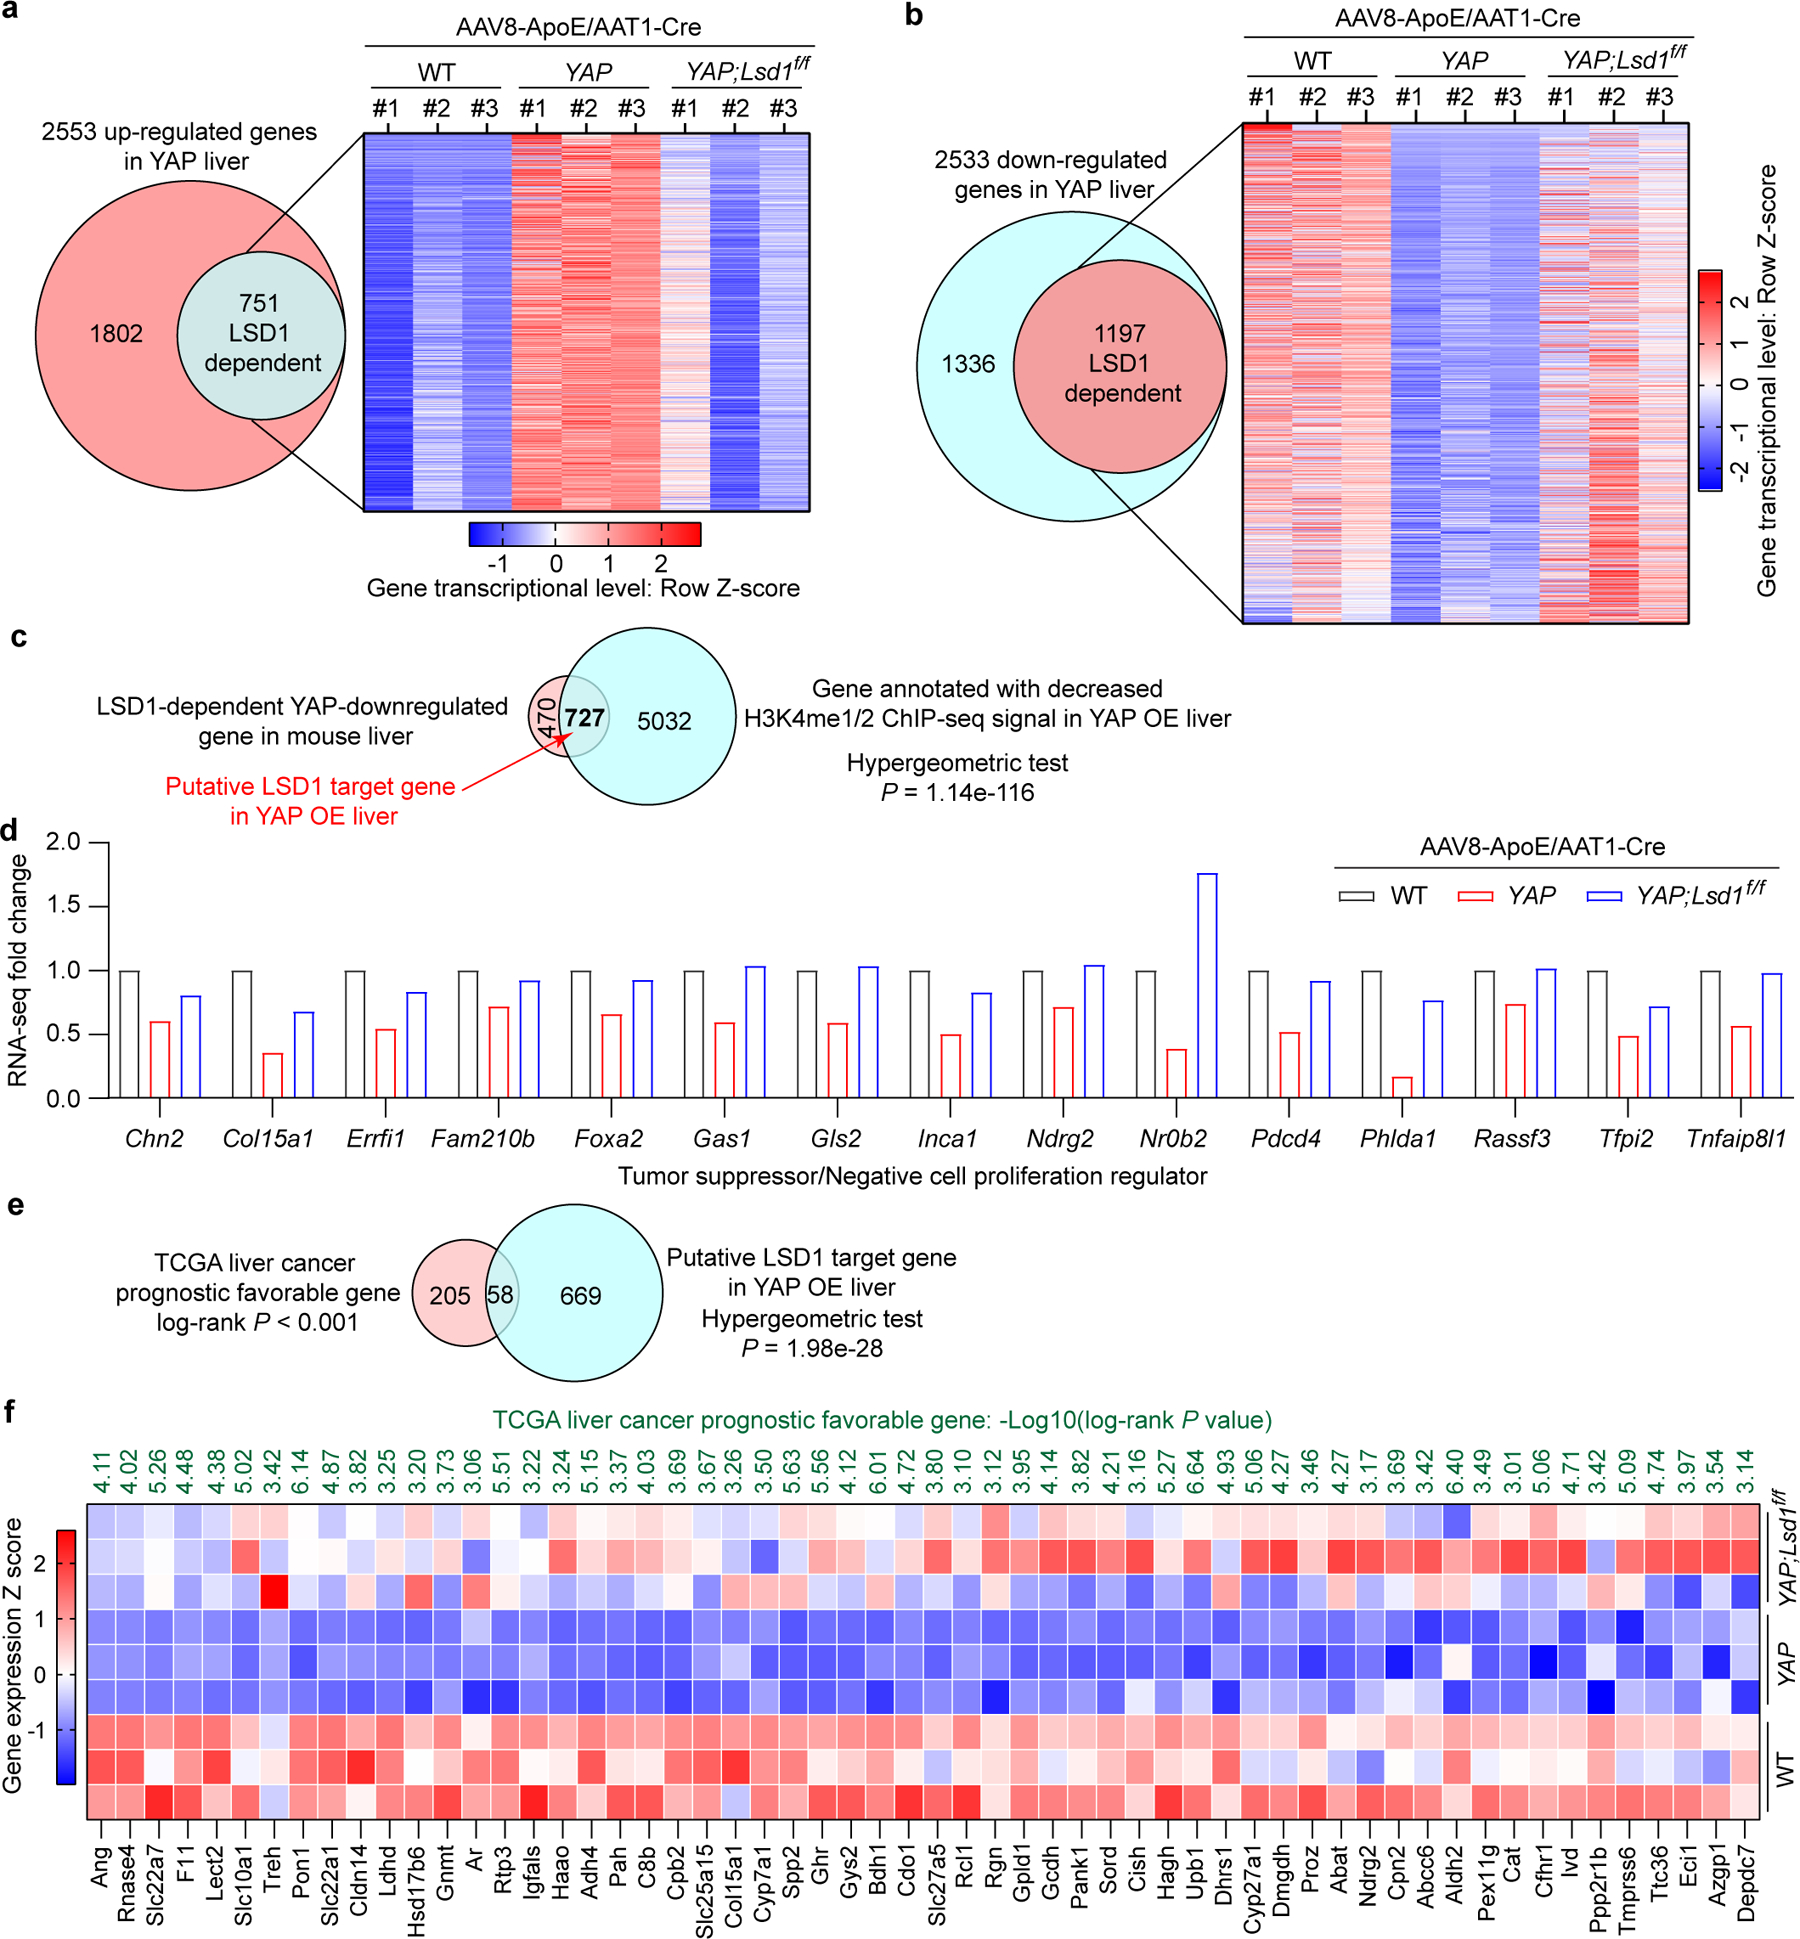
a, RNA-seq analysis of up-regulated genes that are dependent on LSD1 in YAP OE livers (adjusted P value < 0.05 for both comparisons: YAP vs WT and YAP;Lsd1f/f vs YAP, Bonferroni correction for multiple comparisons test).
b, RNA-seq analysis of down-regulated genes that are dependent on LSD1 in YAP OE livers (adjusted P value < 0.05 for both comparisons: YAP vs WT and YAP;Lsd1f/f vs YAP, Bonferroni correction for multiple comparisons test).
c, A Venn diagram showing the putative LSD1 target genes in YAP OE livers.
d, Potential tumor suppressors and negative cell proliferation regulators among the putative LSD1 target genes (adjusted P < 0.05 for comparisons: YAP vs WT and YAP;Lsd1f/f vs YAP from RNA-seq analysis, Bonferroni correction for multiple comparisons test).
e,f, The putative LSD1 target genes were overlapped with liver cancer prognosis favorable genes. The significance of overlapping in (e) was validated by one-tailed hypergeometric test with P = 1.98e-28. The survival analysis in (f) was performed with two-sided Log-rank test.
To shed light on direct targets that are transcriptional repressed by the H3K4me1/2 demethylase LSD1, we conducted ChIP-seq to identify H3K4me1/2 peaks that showed decreased signal in YAP OE as compared to wildtype control livers (Extended Data Fig. 10a–f and Supplementary Table 3,4). By overlapping this dataset with YAP-downregulated, LSD1-dependent genes in mouse livers, we identified 727 putative LSD1 target genes (Fig. 7c). Interestingly, these target genes include many tumor suppressors, negative regulator of cell proliferation, or genes whose downregulation is associated with unfavorable liver cancer prognosis (Fig. 7d–f). Such target genes therefore provide a potential explanation for how their downregulation by LSD1 may contribute to YAP-induced cell proliferation and tumorigenesis.
Discussion
The cross-talk between oncogenic signaling, metabolic reprogramming and epigenetic remodeling plays critical roles in tumor initiation and progression, thus studying the underlying mechanisms can provide valuable insights into cancer biology as well as viable therapeutic targets34–36. Our current study reveals a YAP/TAZ-polyamine-eIF5AHyp-LSD1 axis that links oncogenic signaling to epigenetic remodeling through polyamine-mediated eIF5A hypusination. Importantly, functional characterization in both animal and cell-based models demonstrates that this axis is essential for YAP-induced cell proliferation and tumor growth. Taken together, our findings implicate polyamine as a metabolic messenger that translates oncogenic signaling to chromatin remodeling and gene expression in tumorigenesis. Polyamine levels are increased in many human cancers13,37. Unlike metabolites that serve as building blocks or energy sources (the fuels), polyamine has recently been suggested as “oil for cancer engine” given that this metabolite regulates the activity of many cellular processes38. Despite recent progress38,39, how polyamine biosynthesis is regulated by oncogenic signaling and how polyamine promotes tumor growth remain incompletely understood. Our identification of YAP/TAZ as a direct upstream regulator of ODC1, the rate-limiting enzyme in the polyamine biosynthesis pathway, provides important insights into the regulation of polyamine metabolism and may explain the pervasive polyamine level increase in diverse human cancers13. Our identification of the lysine-specific histone demethylase LSD1 as a downstream effector of polyamine through eIF5AHyp-mediated protein translation control not only sheds light into the mechanism by which this oncometabolite promotes tumor growth but also uncovers a link between polyamine and epigenetic modification and highlights the importance of protein translation control in cancer biology40.
Studies of YAP/TAZ have so far mainly focused on target genes that are upregulated by these transcriptional coactivators. However, it is evident from the published gene expression profiling studies17,33, as well as our own RNA-seq analysis in this study, that YAP/TAZ not only promotes the expression of their direct target genes, but also downregulates the expression of a distinct set of genes. The mechanism by which YAP/TAZ confers gene downregulation remains poorly understood. Previous studies showed that YAP/TAZ repressed expression of several antiproliferative and lineage-specific genes through the interaction between YAP/TAZ-TEAD complex and the NuRD complex41–43. Our identification of LSD1 as a transcriptional repressor induced post-transcriptionally via YAP/TAZ-regulated polyamine biosynthesis significantly expands our understanding of YAP/TAZ-mediated downregulation of gene expression. Unlike the NuRD complex, LSD1-mediated repression of gene expression by YAP/TAZ does not require the existence of TEAD binding sites in the promoter region of target genes. Interestingly, about half of all YAP-downregulated genes are dependent on LSD1, and these LSD1-dependent genes include many tumor suppressors and negative proliferation regulators. Importantly, YAP/TAZ-induced cell proliferation and tumor growth are significantly suppressed by genetic or pharmacologic inhibition of LSD1, highlighting the importance of LSD1-mediated gene repression in YAP/TAZ-dependent transcriptional landscape and tumorigenesis.
In summary, we demonstrate the critical role of a YAP/TAZ-polyamine-eIF5AHyp-LSD1 axis in cell proliferation and tumor growth, offering a molecular framework in which oncogene-induced metabolic and epigenetic reprogramming coordinately drive tumorigenesis. Since polyamine and LSD1 were recently implicated in immune modulation44–46, targeting the YAP/TAZ-polyamine-eIF5AHyp-LSD1 axis may serve the dual purposes of both inhibiting tumor growth and enhancing anti-tumor immunity. Given the multifaceted roles of YAP/TAZ5,7, polyamine45,47, and LSD148 in cell biology, the importance of the YAP/TAZ-polyamine-eIF5AHyp-LSD1 axis will likely extend to many physiological and pathological processes beyond cell proliferation and tumorigenesis.
Methods
This research complies with all relevant ethical regulations; Animal protocols (#APN 2016-101758) were approved by the Institutional Animal Care and Use Committee of the University of Texas Southwestern Medical Center.
Cell culture
MDA-MB-231 (Cat# HTB-26, ATCC), ES-2 (Cat# CRL-1978, ATCC) and SNU-886 (Cat# 00886, KCLB) cells were cultured in RPMI 1640 medium (Cat# R8757, Sigma) supplemented with 10% Gibco Fetal Bovine Serum (FBS) (Cat# 16140089, Thermo Fisher) and 1% penicillin/streptomycin. 293T (Cat# CRL-3216, ATCC) and HLE (Cat# JCRB0404, JCRB cell bank) cells were cultured in DMEM medium (high glucose, Gibco) supplemented with 10% FBS and 1% penicillin/streptomycin. AML12 (Cat# CRL-2254, ATCC) cells were cultured as ATCC recommended, namely DMEM/F12 medium with 10% FBS, 10 μg/mL insulin, 5.5 μg/mL transferrin, 5 ng/mL selenium and 40 ng/mL dexamethasone, and 1% penicillin/streptomycin. HPNE related cells12 were cultured in 75% DMEM and 25% M3 base medium supplemented with 10 ng/mL of EGF and 5% FBS. MCF10A (Cat# CRL-10317, ATCC) cells were cultured in DMEM/F12 medium (Cat# 11330-032, Invitrogen) with 5% horse serum (Cat# 16050-122, Invitrogen), 20 ng/mL EGF, 0.5 mg/mL hydrocortisone, 100 ng/mL cholera toxin, 10 μg/mL insulin and 1% penicillin/streptomycin. Human HAP1 parental (Cat# C631, Horizon) cells were cultured in IMDM medium (Cat# 12440-053, Gibco) with 10% FBS and 1% penicillin/streptomycin. All cell lines were cultured in a 5% CO2 incubator at 37 °C.
Mouse studies
YAP transgenic mouse (ApoE/rtTA-TRE-YAP), which harbors a hepatocyte-specific tetracycline-inducible human YAP, was established previously12. Sav1flox mouse was described as before49. Lsd1flox (Cat# 023969), Alb-Cre (Cat# 018961), NSG (Cat# 005557), and wildtype C57BL/6J (Cat# 000664) mice were all purchased from the Jackson Laboratory. Both female and male mice were used for the genetic experiments, and the results did not show significant differences. All experimental mice were bred and maintained under specific pathogen free conditions with 12h dark/12h light cycles and a climate control system monitoring the ambient temperature and humidity. Mice were provided standard laboratory chow and allowed free access to water. Animal protocols were approved by the Institutional Animal Care and Use Committee of the University of Texas Southwestern Medical Center. Conditionally inducible YAP transgenic mice and wildtype littermates were administrated 50 mg/L doxycycline (Dox) (Cat# D5897, LKT Labs) in drink water for 10 days when they were ~1 month old except specific indication, then mice were sacrificed, and livers were collected for experimental analysis. Alb-Cre;Sav1flox/flox mice were obtained by crossing Alb-Cre mouse with Sav1flox mouse. Liver specific Lsd1 knockout was achieved by injecting AAV8-ApoE/AAT1-Cre (Cat# SL101429, SignaGen Laboratories) into Lsd1flox/flox mice intraperitoneally.
Compound treatment
Difluoromethylornithine (DFMO) (Cat# B0084-080177, BOC sciences) was added to cell culture medium for 72 hours at a concentration of 2.5 mM, then cells were collected for western blot analysis. Medium and compound were replaced every day. N1-Guanyl-1,7-diaminoheptane (GC7) (Cat# sc-396111, Santa Cruz Biotechnology) was added to cells for 24 hours at a concentration of 10 μM, then cells were collected for western blot and RT-qPCR. Details for other treatments are indicated in the figure legends.
siRNA transfection
Smart pools of siRNA for YAP (Cat# L-012200-00-0005), TAZ (Cat# L-016083-00-0005) and non-targeting control (Cat# D-001810-10-05) were purchased from Dharmacon. siRNA transfection was performed with Lipofectamine™ RNAiMAX Transfection reagent (Cat# 13778075, Invitrogen) according to the provided protocol. Samples were collected for RT-qPCR analysis 48 hours post-transfection.
Cell proliferation assay
Cells were plated into 96-well plates at a density of 2000 cells per well. Cell viability was measured by Prestoblue cell viability assay reagent (Cat# A13261, Thermo Fisher) using fluorometric method according to the instructions. Briefly, cells were incubated with 1× Prestoblue cell viability assay reagent for 30 minutes at 37 °C, then fluorescence intensity was measured according to the manufacturer’s protocol.
RNA extraction and RT-qPCR
All reagents and materials used for RNA analysis were RNAase-free. Total RNA from cells was isolated using RNeasy Plus Mini kit (Cat# 74134, Qiagen) according to the instructions. Total RNA from mouse livers was isolated using TRIzol™ Plus RNA Purification Kit (Cat# 12183555, Thermo Fisher) and DNA was removed by treatment with TURBO DNA-free™ Kit (Cat# AM1907, Thermo Fisher). cDNA was synthesized using the iScrip cDNA synthesis kit (Cat# 1708890, Bio-Rad). RT-qPCR was performed using the iQ SYBR Green Supermix (Cat# 1708880, Bio-Rad) on a CFX96 real-time system (Bio-Rad). Primers used in this paper are listed in Supplementary Table 5.
Plasmid
YAP5SA gBlock was synthesized by IDT and cloned to the pCDH lentiviral vector (Cat# CD510B-1, System Biosciences). TAZ4SA DNA fragment was cloned into the pcDNA 3.1 vector. CMV-Flag-YAP5SA (Addgene #27371)50 and CMV-Flag-YAP5SA/S94A (Addgene #33103)17 are gifts from Kunliang Guan, and they were only used for comparisons of ODC1 induction in 293T and SNU-886 cells to verify the requirement of TEAD binding in this process.
Lentivirus package and stably transfected cell line establishment
TRIPZ inducible lentiviral shRNAs including ODC1 shRNA#1 (Cat# RHS4696-200767529), ODC1 shRNA#2 (Cat# RHS4696-200706622), LSD1 shRNA#1 (Cat# RHS4696-200695244), and LSD1 shRNA#2 (Cat# RHS4696-200763212) were purchased from Horizon Discovery Ltd.. All lentiviral particles were packaged using 293T cells, and the packaging plasmid: psPAX2 (Cat# 12260, Addgene) and pMD2.G (Cat# 12259, Addgene). Thirty-six hours after transfection, lentiviral supernatant was filtered through a 0.45 μm filter, then used to infect cells with 10 μg/mL polybrene in the medium. Positive cells were selected with puromycin.
Luciferase reporter assay
ODC1 enhancer regions and mutated versions, ~1000 bp, were synthesized by IDT and cloned into pBV-Luc vector (Cat# 16539, Addgene) through Gibson assembly. Plasmids, including enhancer reporter, Renilla (Cat# 87121, Addgene), YAP (Cat# 66853, Addgene) and pcDNA3.1(+) (control vector), were transfected into 293T cells using FuGENE HD transfection reagent (Cat# E2311, Promega). Cells were collected for luciferase reporter assay using Dual-Luciferase Reporter Assay System (Cat# E1960, Promega) 2 days post-transfection. Luminescence intensity of firefly luciferase was normalized to Renilla.
Deletion of TEAD binding site in ODC1 enhancer region
Deletion of TEAD binding site in ODC1 enhancer region in HAP1 cells was conducted by CRISPER-Cas9 gene editing. Briefly, HAP1 cells were transfected with a pSPCas9(BB)-2A-Puro (PX459) V2.0 (Cat# 62988, Addgene) construct expressing two gRNAs targeting two genomic sequences flanking a TEAD binding site. The gRNAs targeting sites are as follows: 5’-TGATCATGAATGATCCTCCT-3’ and 5’-AGGATCATTCATGATCAGCT-3’ for #3, and 5’-AAATCTCACCTTGGAGGAAT-3’ and 5’-CTCCACCATCATTCTGTTTA-3’ for #4. Successfully transfected cells were selected by 1 μg/mL puromycin for 3 days, then single clones were picked and sequenced to confirm the deletion of TEAD binding sites. #3 TEAD binding site was deleted first, and clones were confirmed by DNA sequencing. A confirmed clone was selected for further deletion of #4 TEAD binding site. The sequence information was provided in Supplementary Table 6.
Metabolomics analysis
Metabolomics analysis was performed in CRI’s Metabolomics Facility at UT Southwestern. Metabolites were extracted with 80% methanol (HPLC grade). Data acquisition was performed by reverse-phase chromatography on a 1290 UHPLC liquid chromatography (LC) system interfaced to a 6550 iFunnel Q-TOF mass spectrometer (MS) (Agilent Technologies, CA). The MS was operated in both positive and negative (ESI+ and ESI-) modes. Analytes were separated on an Acquity UPLC® HSS T3 column (1.8 μm, 2.1 × 150 mm, Waters, MA). The column was kept at room temperature. Mobile phase A composition was 0.1% formic acid in water and mobile phase B composition was 0.1% formic acid in 100% acetonitrile. The LC gradient was 0 min: 1% B; 5 min: 5% B; 15 min: 99% B; 23 min: 99% B; 24 min: 1% B; 25 min: 1% B. The flow rate was 250 μL/min. The sample injection volume was 5 μL. ESI source conditions were set as follows: dry gas temperature 225 °C and flow 18 L/min, fragmentor voltage 175 V, sheath gas temperature 350 °C and flow 12 L/min, nozzle voltage 500 V, and capillary voltage +3500 V in positive mode and −3500 V in negative. The instrument was set to acquire over the full m/z range of 40–1700 in both modes, with the MS acquisition rate of 1 spectrum per second in profile format.
Raw data files were processed using Profinder B.08.00 SP3 software (Agilent Technologies, CA) with an in-house database containing retention time and accurate mass information on 600 standards from Mass Spectrometry Metabolite Library (IROA Technologies, MA) which was created under the same analysis conditions. The in-house database matching parameters were mass tolerance 10 ppm and retention time tolerance 0.5 min. Peak integration results were manually curated in Profinder for improved consistency. Principal component analysis (PCA) and metabolite set enrichment analysis were performed with MetaboAnalyst51.
Polyamine detection
Total polyamine detection was conducted with a total polyamine assay kit (Fluorometric) (Cat# K475, BioVision) according to the manufacturer’s instructions. Individual polyamines were measured using LC-MS after dansylation in the CRI’s Metabolomics Facility at UT Southwestern. Briefly, tissues and cultured cells were extracted with 80% acetonitrile (20–30 mg tissue per 300 μL, 1 million cells per 100 μL), and 100 μL of the supernatant was dried in SpeedVac. The samples were reconstituted in 45 μL of water, then 10 μL of 10 × PBS (pH 11, adjusted by ammonium hydroxide), 5 μL of 10 μM polyamine internal standards including d8-spermine (Cat# 705330, Sigma), d4-putrescine (Cat# 491136, Sigma) and d6-spermidine (Cat# 709891, Sigma) prepared in water, and 45 μL of 1 mg/mL dansyl chloride (Cat# 03641, Sigma) prepared in acetonitrile were added into the same tube. The mixture was incubated at 55 °C for 10 min and then 400 μL of water was added. The samples were then extracted with Oasis HLB 96-well plate (Cat# 186000679, Waters). Samples were eluted with 98% acetonitrile and dried under SpeedVac. Finally, samples were reconstituted with 50 μL of 0.1% formic acid in water, and 20 μL was subjected to LC-MS analysis. Final concentration of polyamines was normalized to internal standards and total soluble protein content.
Protein extraction and western blotting
Cells and tissues were washed twice with ice-cold PBS prior to the extraction. Total proteins were extracted with RIPA lysis buffer (Cat# ab156034, Abcam) containing 1× protease inhibitor cocktail (cOmplete tablet, EDTA free, Roche). Protein concentrations were measured using BCA protein assay (Cat# 23225, Thermo Fisher). Equal volume and quantity of protein samples within the linear detection range of the used antibodies were separated on SDS-PAGE and transferred to a nitrocellulose membrane (Bio-Rad). The membrane was blocked in 5% non-fat milk for 1 hour at room temperature, then incubated with primary antibodies at 4 °C overnight. In the next day, the membrane was washed with TBST three times and incubated with appropriate secondary horseradish peroxidase (HRP) conjugated antibodies (anti-rabbit Cat#NA934 or anti-mouse Cat# NA931 from GE Healthcare, 1:5000 dilution) in 5% milk for 1 hour at room temperature. The membranes were washed with TBST three times, then SuperSignal West Dura Extended Duration substrate (Cat# 34075, Thermo Fisher) was applied for development. ChemiDoc MP imaging system (Bio-Rad) was used to capture immunoblot images. The blots without oversaturation were quantified by Software Image Lab 5.2.1 from Bio-Rad and targeted protein levels were normalized to GAPDH. Dilutions for primary antibodies were as follows: YAP (Cat# 14074, Cell Signaling Technology, 1:1000 dilution); LSD1 (Cat# 2139, Cell Signaling Technology, 1:1000 dilution); eIF5A (Cat# ab32407, Abcam, 1:1000 dilution); Hypusine (Cat# ABS1064, Millipore, 1:1000 dilution); ODC1 (Cat# ab126590, Abcam, 1:1000 dilution); OAZ1 (Cat# PA5-77217, Thermo Fisher, 1:1000 dilution); GAPDH (clone 6C5) (Cat# MAB374, Sigma, 1:500 dilution), KDM6B(Cat# 07-1533, Sigma, 1:1000 dilution), SETD2 (Cat# 80290, Cell Signaling Technology, 1:1000 dilution).
Immunoblot analysis of OPP-labeled nascent LSD1 protein
Immunoblot analysis of OPP-labeled nascent LSD1 protein was performed as described previously52 with a little modification. Namely, cells were first treated with 10 μM GC7 or PBS as control for 24 hours. Next day, the medium was replaced with labelling medium containing 30 μM O-propargyl-puromycin (OPP) (Cat# 1407-5, Click Chemistry Tools) in 0.1% DMSO and cells were further cultured for 3 hours. Cells were washed with cold PBS twice and lysed in RIPA buffer with 1× protease inhibitor cocktail (cOmplete tablet, EDTA free, Roche). OPP-tagged proteins were conjugated with biotin by click chemistry using biotin picolyl azide (Cat# 1167-5) and Click-&-Go protein reaction buffer Kit (Cat# 1262) from Click Chemistry Tools according to the provided instructions. After conjugation with biotin-azide, samples were precipitated with 5 volumes cold acetone overnight at −20 °C. Precipitated proteins were pelleted by centrifugation at 4000 × g at 4 °C for 10 minutes and washed twice with 1 mL cold methanol. Pellets were resuspended in PBS with 1% SDS and protein concentration was measured by BCA assay. 10 μg of protein was saved as input control, and 500 μg of protein was incubated with high capability streptavidin magnetic beads (Cat# 1497-1, Click Chemistry Tools) at 4 °C overnight with slow rotation. Beads were washed three times with 1 mL cold PBS with 1% NP-40 and 0.1% SDS. The beads were boiled in 2 × Laemmli sample buffer for 10 minutes to elute biotin-labelled nascent proteins for western blot analysis. LSD1 protein translation rate was estimated by comparing pulldown levels with input.
The enzyme-linked immunosorbent assay (ELISA)
The ELISA assays of histone methylation including H3K4me1 (Cat# P-3025) and H3K4me2 (Cat# P-3023) were performed with commercially available kits from EpiGentek according to the manufacturer’s protocol. Total histone was extracted using a kit from Abcam (Cat# ab113476). Signal intensity was normalized to total histone concentration.
RNA-sequence
The quality of samples was determined on the Agilent TapeStation 4200, and only high quality RNA is used (RIN Score 8 or higher). The Qubit® 4.0 Fluorimeter from ThermoFisher was used to determine the concentration prior to starting library preparation. One microgram of DNase-treated total RNA was then prepared with the TruSeq Stranded Total RNA LT Sample Prep Kit from Illumina. Total RNA was depleted of its rRNA and fragmented before strand specific cDNA synthesis. cDNAs were then a-tailed and indexed adapters were ligated. After adapter ligation, samples were PCR amplified and purified with AMPure XP beads, then validated again on the Agilent TapeStation 4200. Before being normalized and pooled, samples were quantified by Qubit then run on the Illumina NextSeq 500 using V2.5 reagents. Sequencing data were further processed at UT Southwestern Medical Center Bioinformatics Core Facility. Raw reads were aligned to mm10 (http://hgdownload.cse.ucsc.edu/goldenpath/mm10/bigZips/) and differential gene analysis was performed with the edgeR package (v3.36.0).
Chromatin preparation and ChIP-sequencing
Chromatin immunoprecipitations were performed with the SimpleChIP® Plus Enzymatic Chromatin IP Kit (Cat# 9005, Cell Signaling Technology) according to the provided protocol. Micrococcal nuclease was used to digest DNA to 150–900 bp fragments. The following antibodies were used to ChIP: anti-YAP (Cat# 14074, Cell Signaling Technology, 1:50 dilution), anti-H3K4me1 (Cat# ab8895, Abcam, 1:100 dilution), anti-H3K4me2 (Cat# 7766, Abcam, 1:100 dilution), and rabbit IgG (supplied with the kit, cat# 2729, Cell Signaling Technology). ChIP-seq libraries were prepared using KAPA HTP Library Preparation Kit from Roche. The ChIP DNA was quantified on the Qubit® 4.0 Fluorimeter from ThermoFisher. Samples were then end repaired, 3’ ends adenylated and barcoded with multiplex adapters. Samples were amplified with 15 cycles of PCR and then size selected with AMPure XP beads. Before being normalized and pooled, samples were quantified by Qubit then run on the Illumina NextSeq 500 using 75 cycle SBS v2.5 reagents.
Data was analyzed using the ENCODE ChIP-seq pipeline (https://github.com/ENCODE-DCC/chip-seq-pipeline2). Reads were trimmed using Trimmomatic (v0.39). Fastq files were aligned to reference genome mm10 using bwa (samse) (v0.0.17-r1188). Post-alignment filtering was done using SAMtools (v1.7), MarkDuplicates (Picard-v1.126) and bedtools (v2.26.0). Bam were converted to tagAlign using bedtools, gawk and shuf. Cross-correction QC scores were calculated using phantompeakqualtools (v1.2.1). Jensen-Shannon distance were calculated using deeptools (v3.3.0) plotFingerprint. GC bias was calculated using CollectGcBiasMetrics (Picard, v1.126) and python packages: pandas, matplotlib. Peaks were called on replicates, self-pseudoreplicates, pooled data and pooled-pseudoreplicates using SPP (v1.14) in phantompeakqualtools (https://github.com/kundajelab/phantompeakqualtools). Irreproducible discovery rate (IDR) analysis was run on all pairs of replicates, self-pseudoreplicates and pooled-pseudoreplicates using IDR (http://github.com/kundajelab/idr v2.0.4). Fraction of reads in peaks was calculated using bedtools (v2.26.0). Signal Tracks were created using MACS2. Differential binding analysis was performed with the edgeR package at union of all regions.
Publicly available ChIP-seq and Hi-C data analysis
Previously published ChIP-seq data for YAP/TAZ/TEAD4 (GSE66081)53, H3K4me3 (GSE71077)54, H3K4me1 and H3K27ac (GSE72141)55 in MDA-MB-231 cells were reanalyzed using WashU Epigenome Browser56 and mapped into human genome hg38 using default parameter. The Hi-C data from A549 cell (ENCODE3, generated by Dekker Laboratory), H1-hESC57, IMR-9058 and human liver59 were visualized by the 3D Genome Browser60 based on human genome hg38 using default parameter.
The Cancer Genome Atlas (TCGA) data analysis
Spearman correlation, gene expression and overall survival analysis were performed using the web server GEPIA61. Unfavourable prognostic genes in liver cancer with two-sided log-rank test P < 0.001 from the TCGA dataset were downloaded from THE HUMAN PROTEIN ATLAS (https://www.proteinatlas.org/humanproteome/pathology/liver+cancer).
Mouse histology and immunohistochemistry (IHC)
Mouse liver samples were fixed in 4% paraformaldehyde in PBS at 4 °C overnight, embedded in paraffin, and sectioned at 5 μm thickness. Sections were stained with hematoxylin-eosin (H&E) for histological analysis. IHC was performed to detect Ki67 positive cells according to the protocol from Abcam. Primary antibody was rabbit anti-Ki67 (1:200, Cat# ab16667, Abcam). Signals were developed using the ABC kit (Cat# PK-6101, Vector Laboratories).
AAV transduction in vivo
AAV-mediated gene/shRNA delivery to the mouse liver was achieved by a single injection with ~2×10¹¹ GC/mouse via intraperitoneal (i.p.). The following AAVs were used: AAV8-GFP-U6-m-ODC1-shRNA (Cat# shAAV-266321, Vector Biolabs), AAV8-GFP-U6-scrambl-shRNA (Vector Biolabs), AAV8-ApoE/AAT1-Cre (Cat# SL101429, SignaGen Laboratories), AAV8-Alb-mOaz1 containing the necessary frame shift mutation that is necessary for the functional OAZ1 protein to be expressed (Vector ID: VB200119-1164qau, VectorBuilder) and AAV8-EGFP control (VectorBuilder).
Tumor xenograft model
MDA-MB-231 cells were injected to the fourth mammary fat pad of 6 weeks old NSG female mice (Cat# 005557, The Jackson lab) with 2×10⁶ cells per mouse in 100 μL of PBS with 30% of Matrigel (Cat# 354262, Corning). Once the tumor volume reached about 100 mm3, the mice were randomly divided into two groups, then treated with either vehicle (10% DMSO + 45% saline + 40% PEG300 + 5% Tween-80) or 50 mg/kg body weight SP-2577 (Cat# HY-103713, MedChemExpress) through i.p. administration once daily. Tumor size was measured every 3 days. Tumor volume was calculated using the formula:1/2*L*w2, where L is the longer diameter, and w is the shorter diameter. Maximal tumour size permitted by our ethics committee is 1000 mm3, and the maximal tumour size was not exceeded.
Statistical analysis
All statistical analyses were performed in GraphPad Prism 9 software and statistical significance was considered at test level P < 0.05. All data points refer to the biological repeats. Unpaired two-tailed Student’s t test was used for comparisons between two groups. Tukey’s or Dunnett’s multiple comparisons test was used for multiple comparisons. Log-transformation was performed before statistical analysis when the distribution of the continuous data is non-normal. The other statistical analysis methods are indicated in figure legends.
Data availability
RNA–seq and ChIP-seq data that support the findings of this study have been deposited in the Gene Expression Omnibus (GEO) under accession codes GSE176329 and GSE174041. Previously published ChIP-seq and Hi-C data that were re-analysed here are available under accession code GSE6608153, GSE7107754 and GSE7214155.
The human liver cancer data were derived from the TCGA Research Network: https://portal.gdc.cancer.gov/. The data-set derived from this resource that supports the findings of this study is available in [https://www.proteinatlas.org/humanproteome/pathology/liver+cancer].
All other data supporting the findings of this study are available from the corresponding author on reasonable request.
Extended Data
Extended Data Fig. 1: Metabolomics analysis of YAP OE mouse livers.
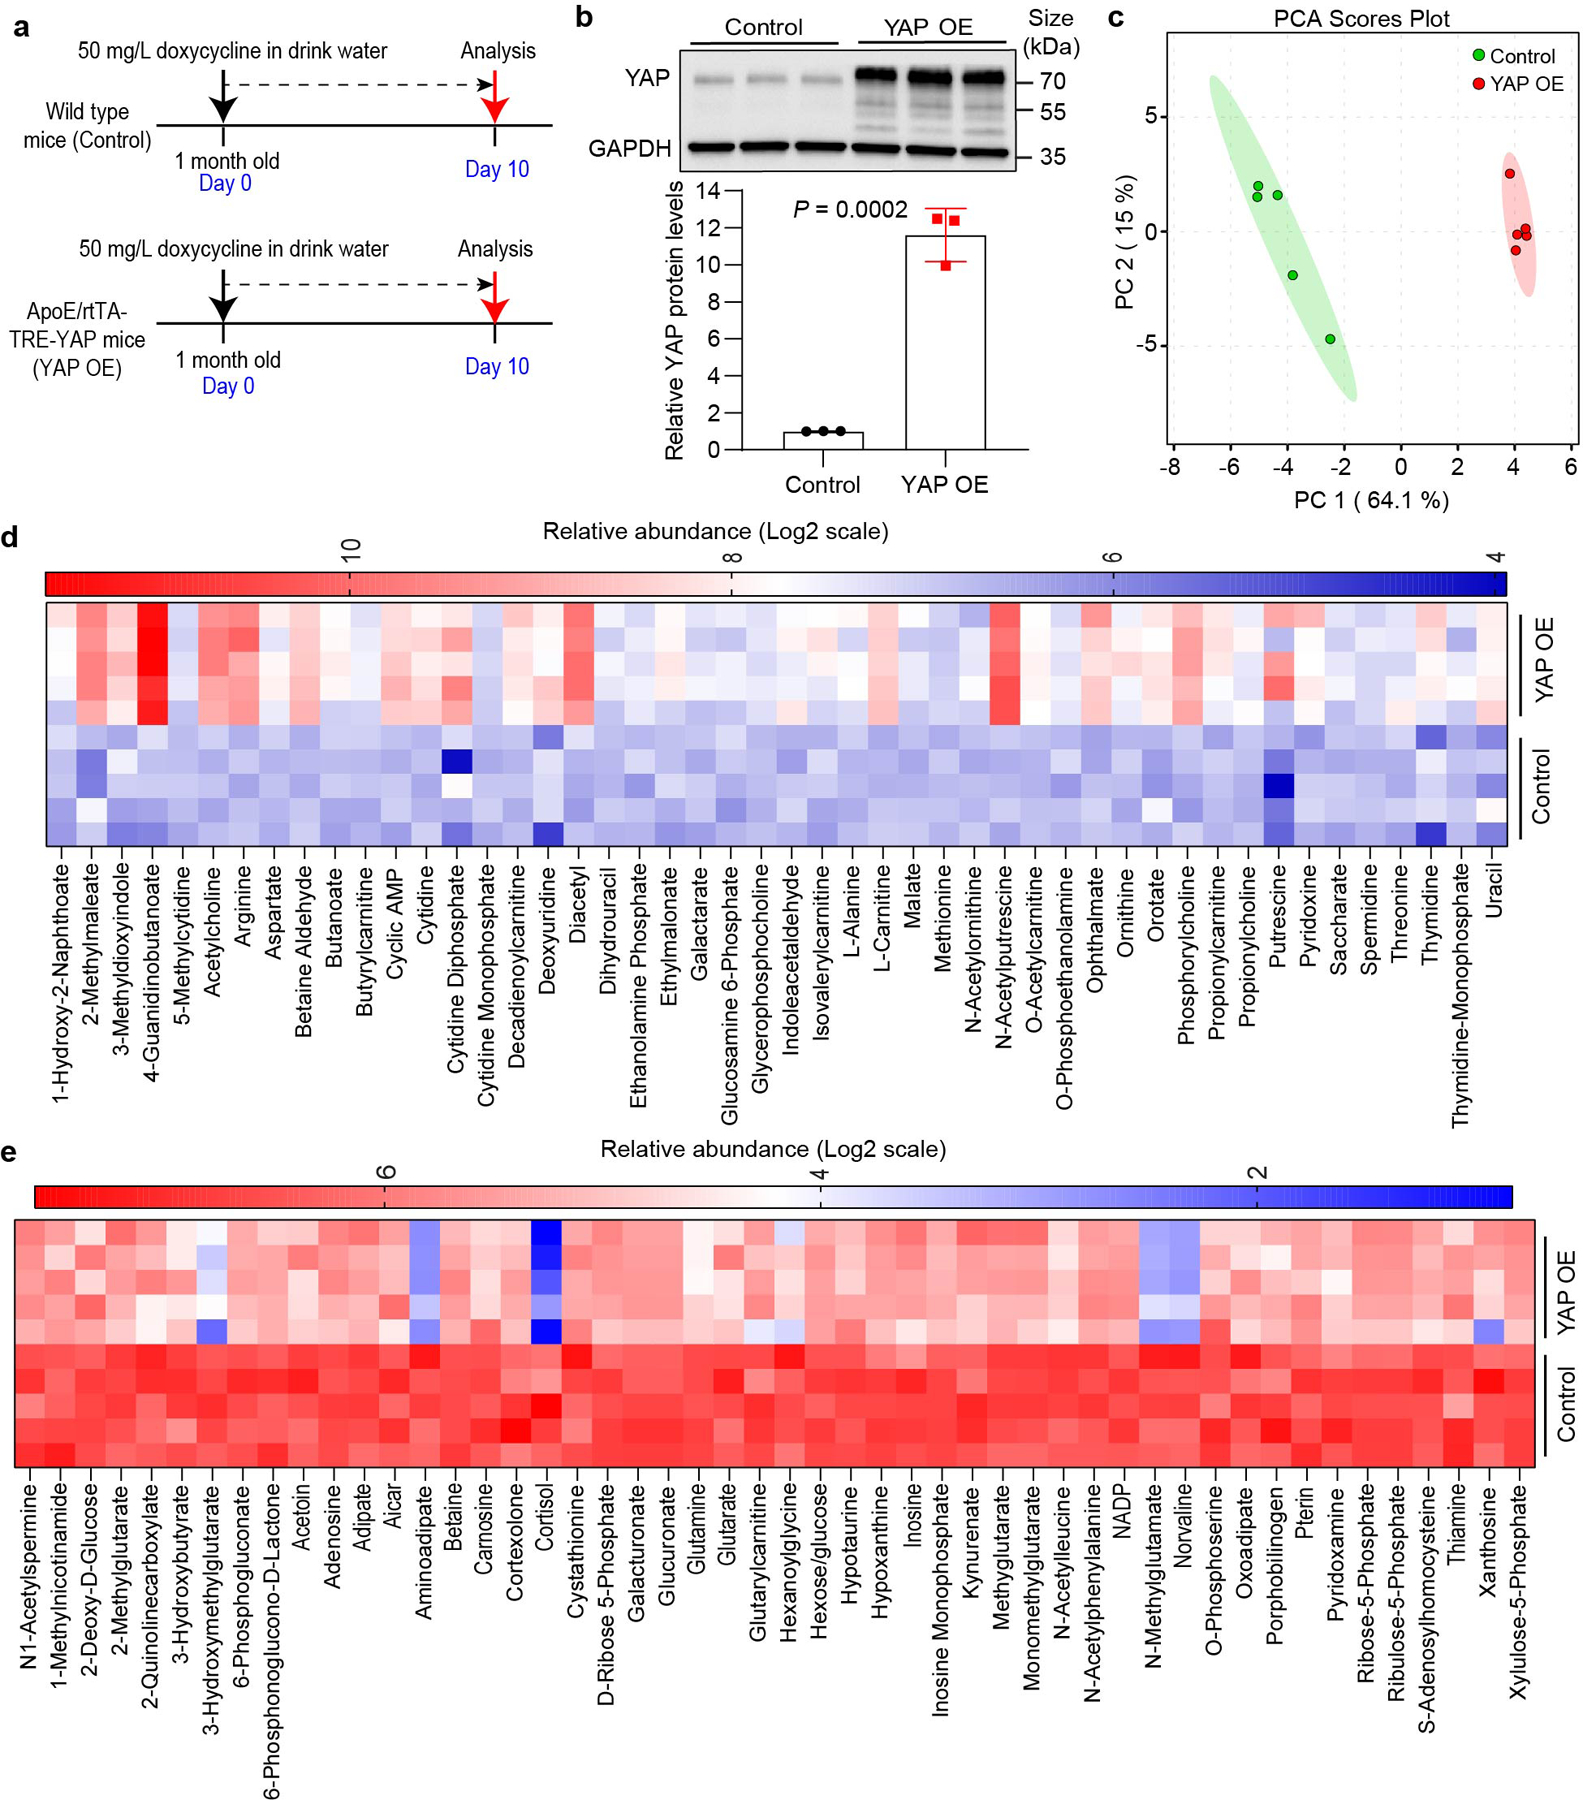
a, Schematic diagram of the experimental design. YAP is conditionally expressed in the liver by doxycycline addition. b, YAP expression levels were examined by western blot. Data are represented as mean ± SD, n = 3 mice per group, unpaired two-tailed Student’s t-test. c, Principal component analysis (PCA) shows that YAP OE and control have different metabolic profiles. Value in the parenthesis is the proportion of variance explained by the corresponding principal component. d, Significantly up-regulated metabolites (Fold change > 1.2 and P < 0.05, unpaired two-tailed Student’s t-test) in YAP OE livers are shown as a heat map. e, Top 50 significantly down-regulated metabolites in YAP OE livers are shown as a heat map.
Extended Data Fig. 2: Sav1 knockout leads to liver overgrowth, increased levels of polyamine and ODC1 expression in mouse liver.
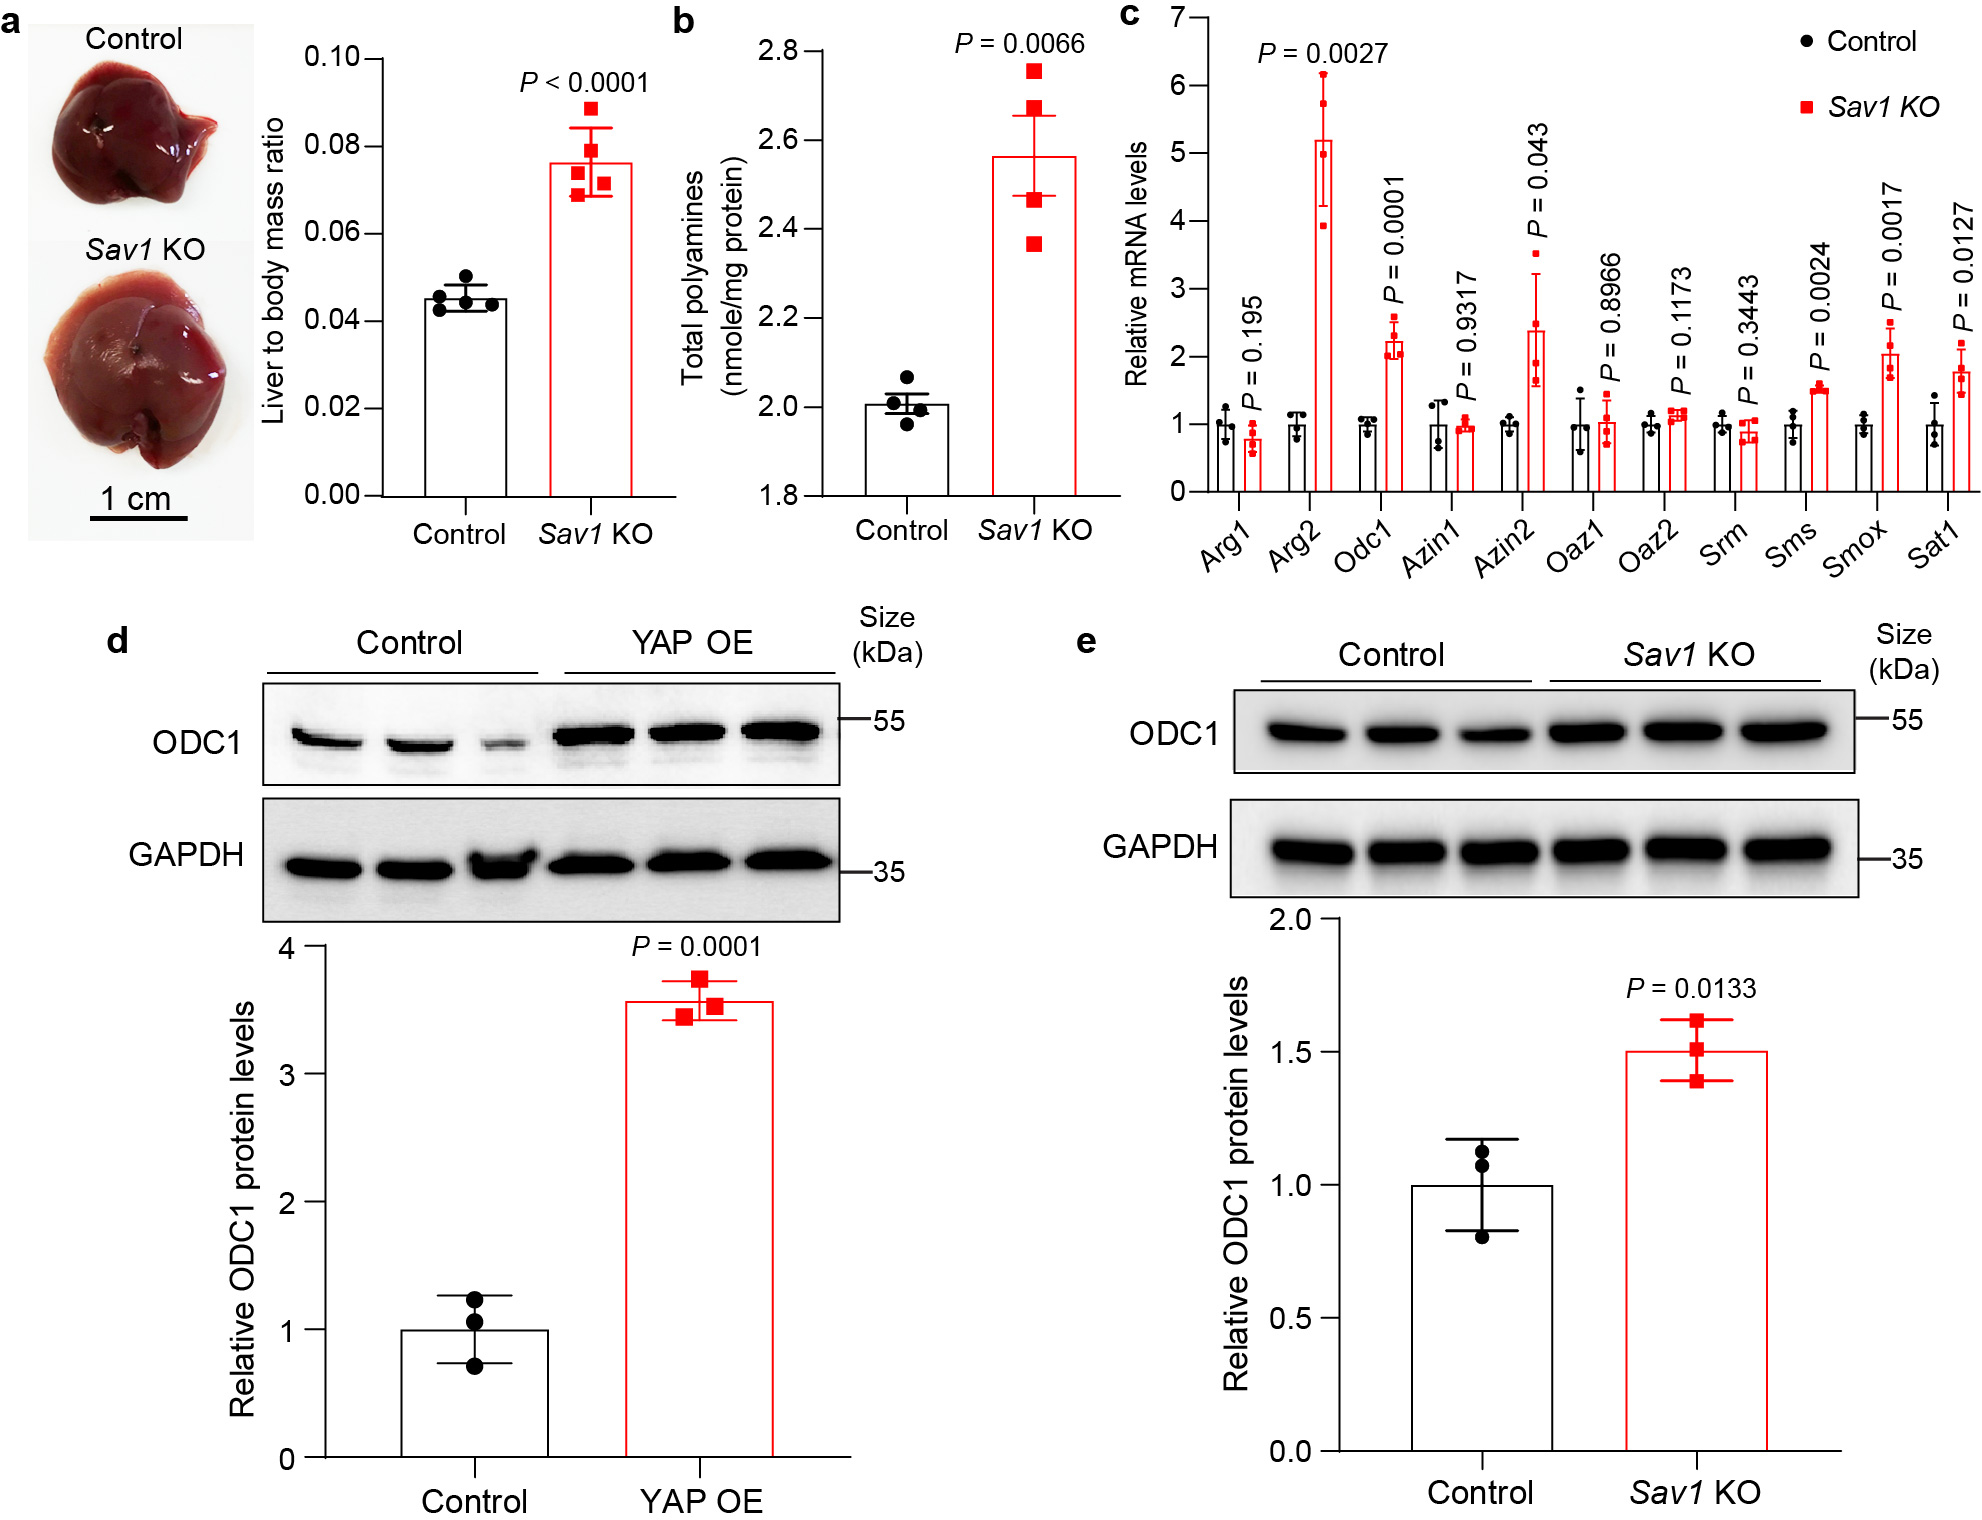
a, Alb-Cre mice were crossed with Sav1flox mice to knock out Sav1 (Alb-Cre;Sav1flox/flox, Sav1 KO) in the liver. Sav1flox/flox mice were used as controls. Representative liver images of one-month old mice are shown in the left panel, and liver to body mass ratios are shown in the right panel. Data are represented as mean ± SD, n = 5, unpaired two-tailed Student’s t-test. b, Levels of total polyamines in control and Sav1 KO mouse livers. Data are shown as mean ± SEM, n = 4, unpaired two-tailed Student’s t-test. c, Relative mRNA levels of genes involved in polyamine metabolism in control and Sav1 KO mouse livers. Data are shown as mean ± SD, n = 4, unpaired two-tailed Student’s t-test. d,e, Relative ODC1 protein levels were examined in YAP OE and Sav1 KO mouse livers by western blot. Data are shown as mean ± SD, n = 3, unpaired two-tailed Student’s t-test.
Extended Data Fig. 3: YAP/TAZ regulates ODC1 transcription in human cells.
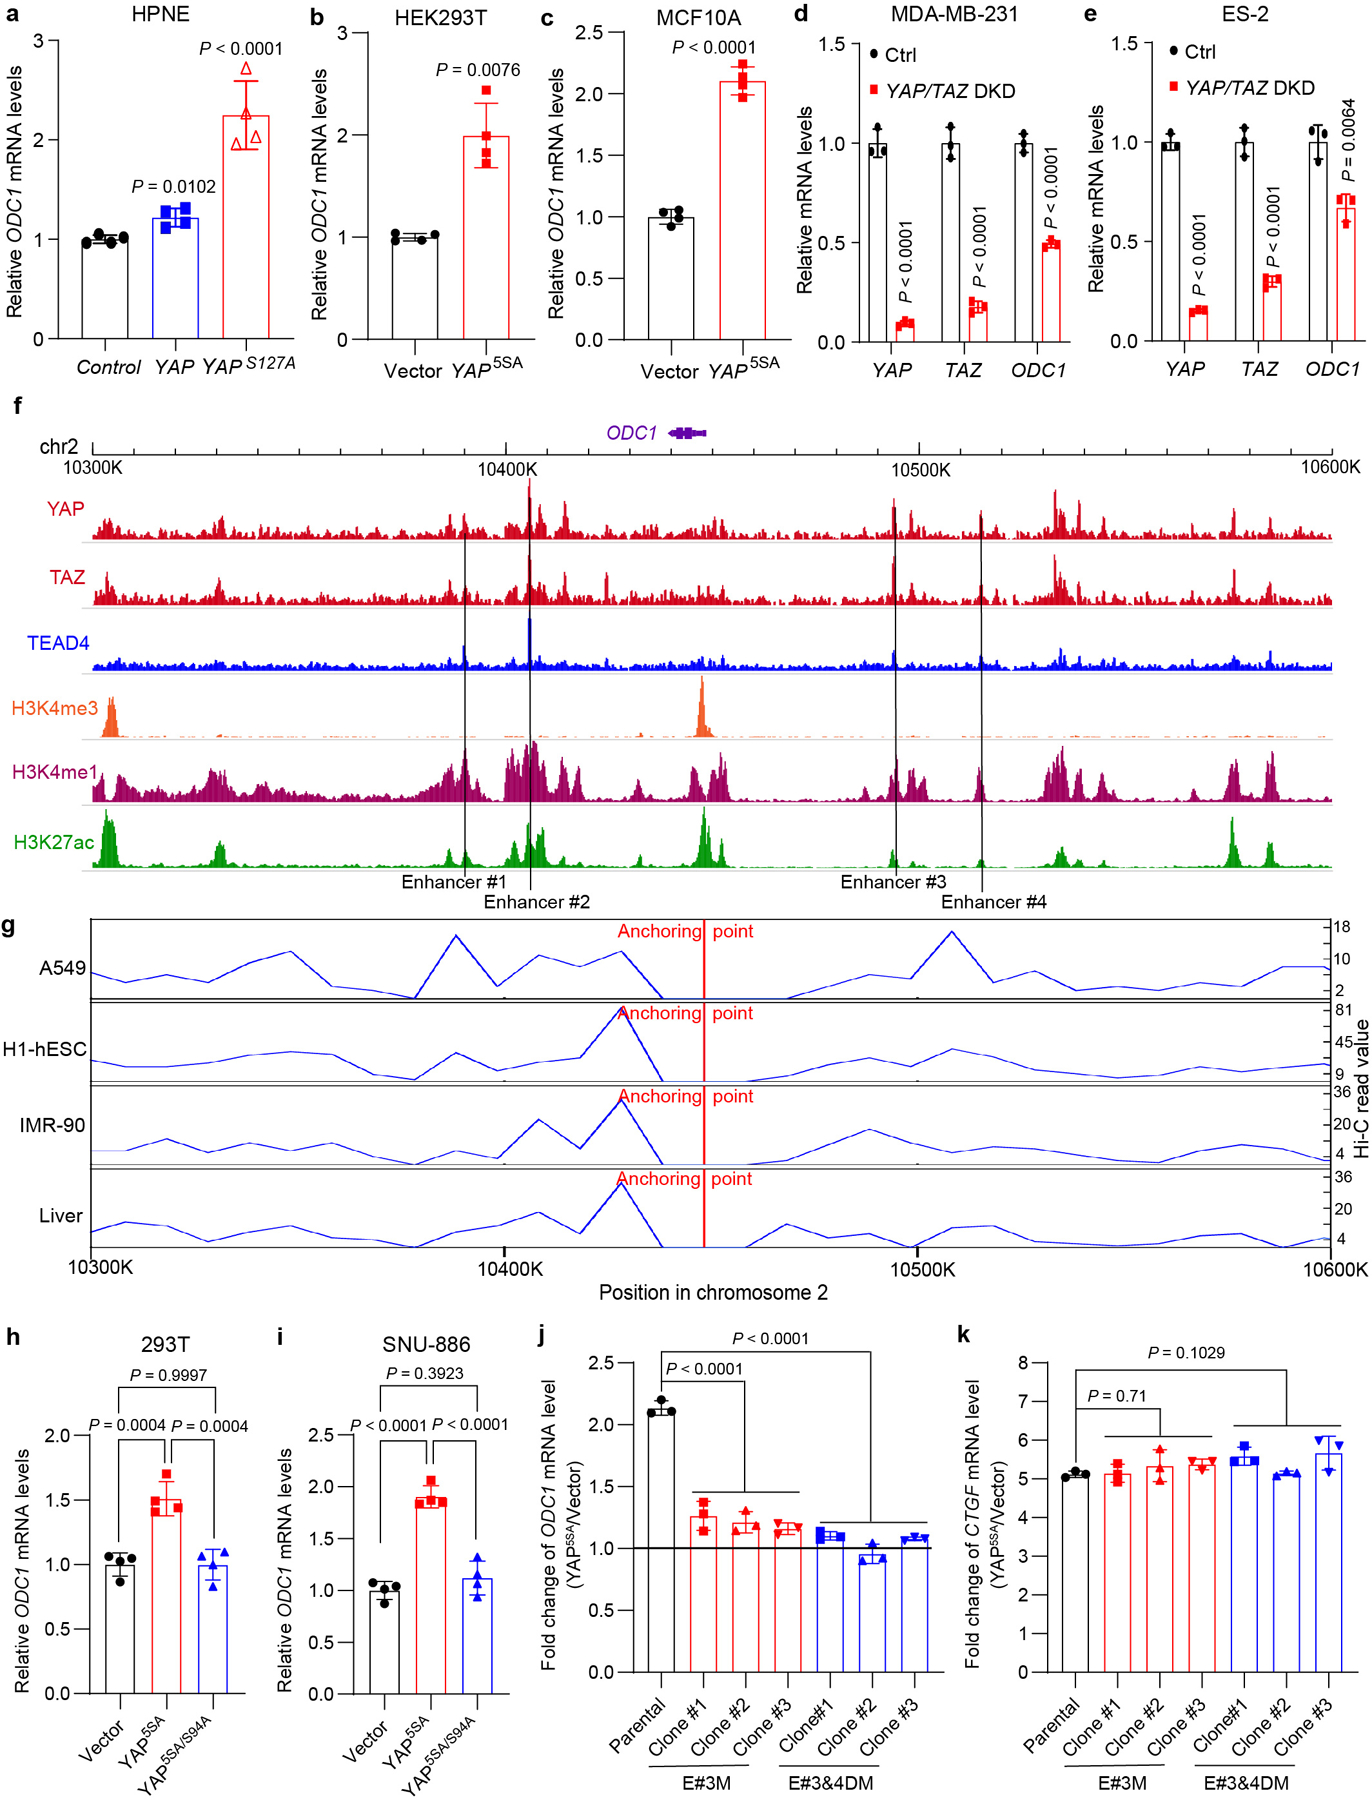
a, Relative mRNA levels of ODC1 in HPNE cells stably expressing an empty vector (control), YAP or YAPS127A were examined by RT-qPCR. Data are represented as mean ± SD, n = 4, multiple t-test with Bonferroni correction. b, HEK293T cells were transiently transfected with empty vector or YAP5SA plasmids, and relative mRNA levels of ODC1 were measured by RT-qPCR. Data are represented as mean ± SD, n = 4, unpaired two-tailed Student’s t-test. c, Relative mRNA levels of ODC1 in MCF10A cells transfected by lentivirus expressing an empty vector or YAP5SA were examined by RT-qPCR. Data are represented as mean ± SD, n = 4, unpaired two-tailed Student’s t-test. d,e, MDA-MB-231 and ES-2 cells, which were reported with high YAP/TAZ activity previously, were transfected with siRNAs targeting YAP and TAZ (YAP/TAZ DKD) or non-targeting control (Ctrl). Relative mRNA levels of indicated genes were measured by RT-qPCR. Data are represented as mean ± SD, n = 3, unpaired two-tailed Student’s t-test. f, ChIP-seq analysis shows potentially active enhancer regions binding with YAP/TAZ/TEAD4 in MDA-MB-231 cells. g, Hi-C data analysis shows interactive regions with ODC1 promoter in multiple human cells and liver. h, 293T cells were transiently transfected with empty vector, YAP5SA or YAP5SA/S94A plasmids, and relative mRNA levels of ODC1 were measured by RT-qPCR. Data are represented as mean ± SD, n = 4, one-way ANOVA, Tukey’s multiple comparisons test. i, SNU-886 cells were transiently transfected with empty vector, YAP5SA or YAP5SA/S94A plasmids, and relative mRNA levels of ODC1 were measured by RT-qPCR. Data are represented as mean ± SD, n = 4, one-way ANOVA, Tukey’s multiple comparisons test. j,k, Human HAP1 parental cells, or mutant cells deleted of #3 (E#3M) or both #3 and #4 (E#3&4DM) TEAD-binding sites of ODC1 enhancer were transfected by empty lentivirus vector or vector expressing YAP5SA. Relative mRNA levels of ODC1 (j) and CTGF (k) were examined by RT-qPCR. Data are represented as mean ± SD, n = 3, one-way ANOVA, Dunnett’s multiple comparisons test.
Extended Data Fig. 4: AAV-mediated ectopic expression of OAZ1 inhibits YAP-induced liver overgrowth.
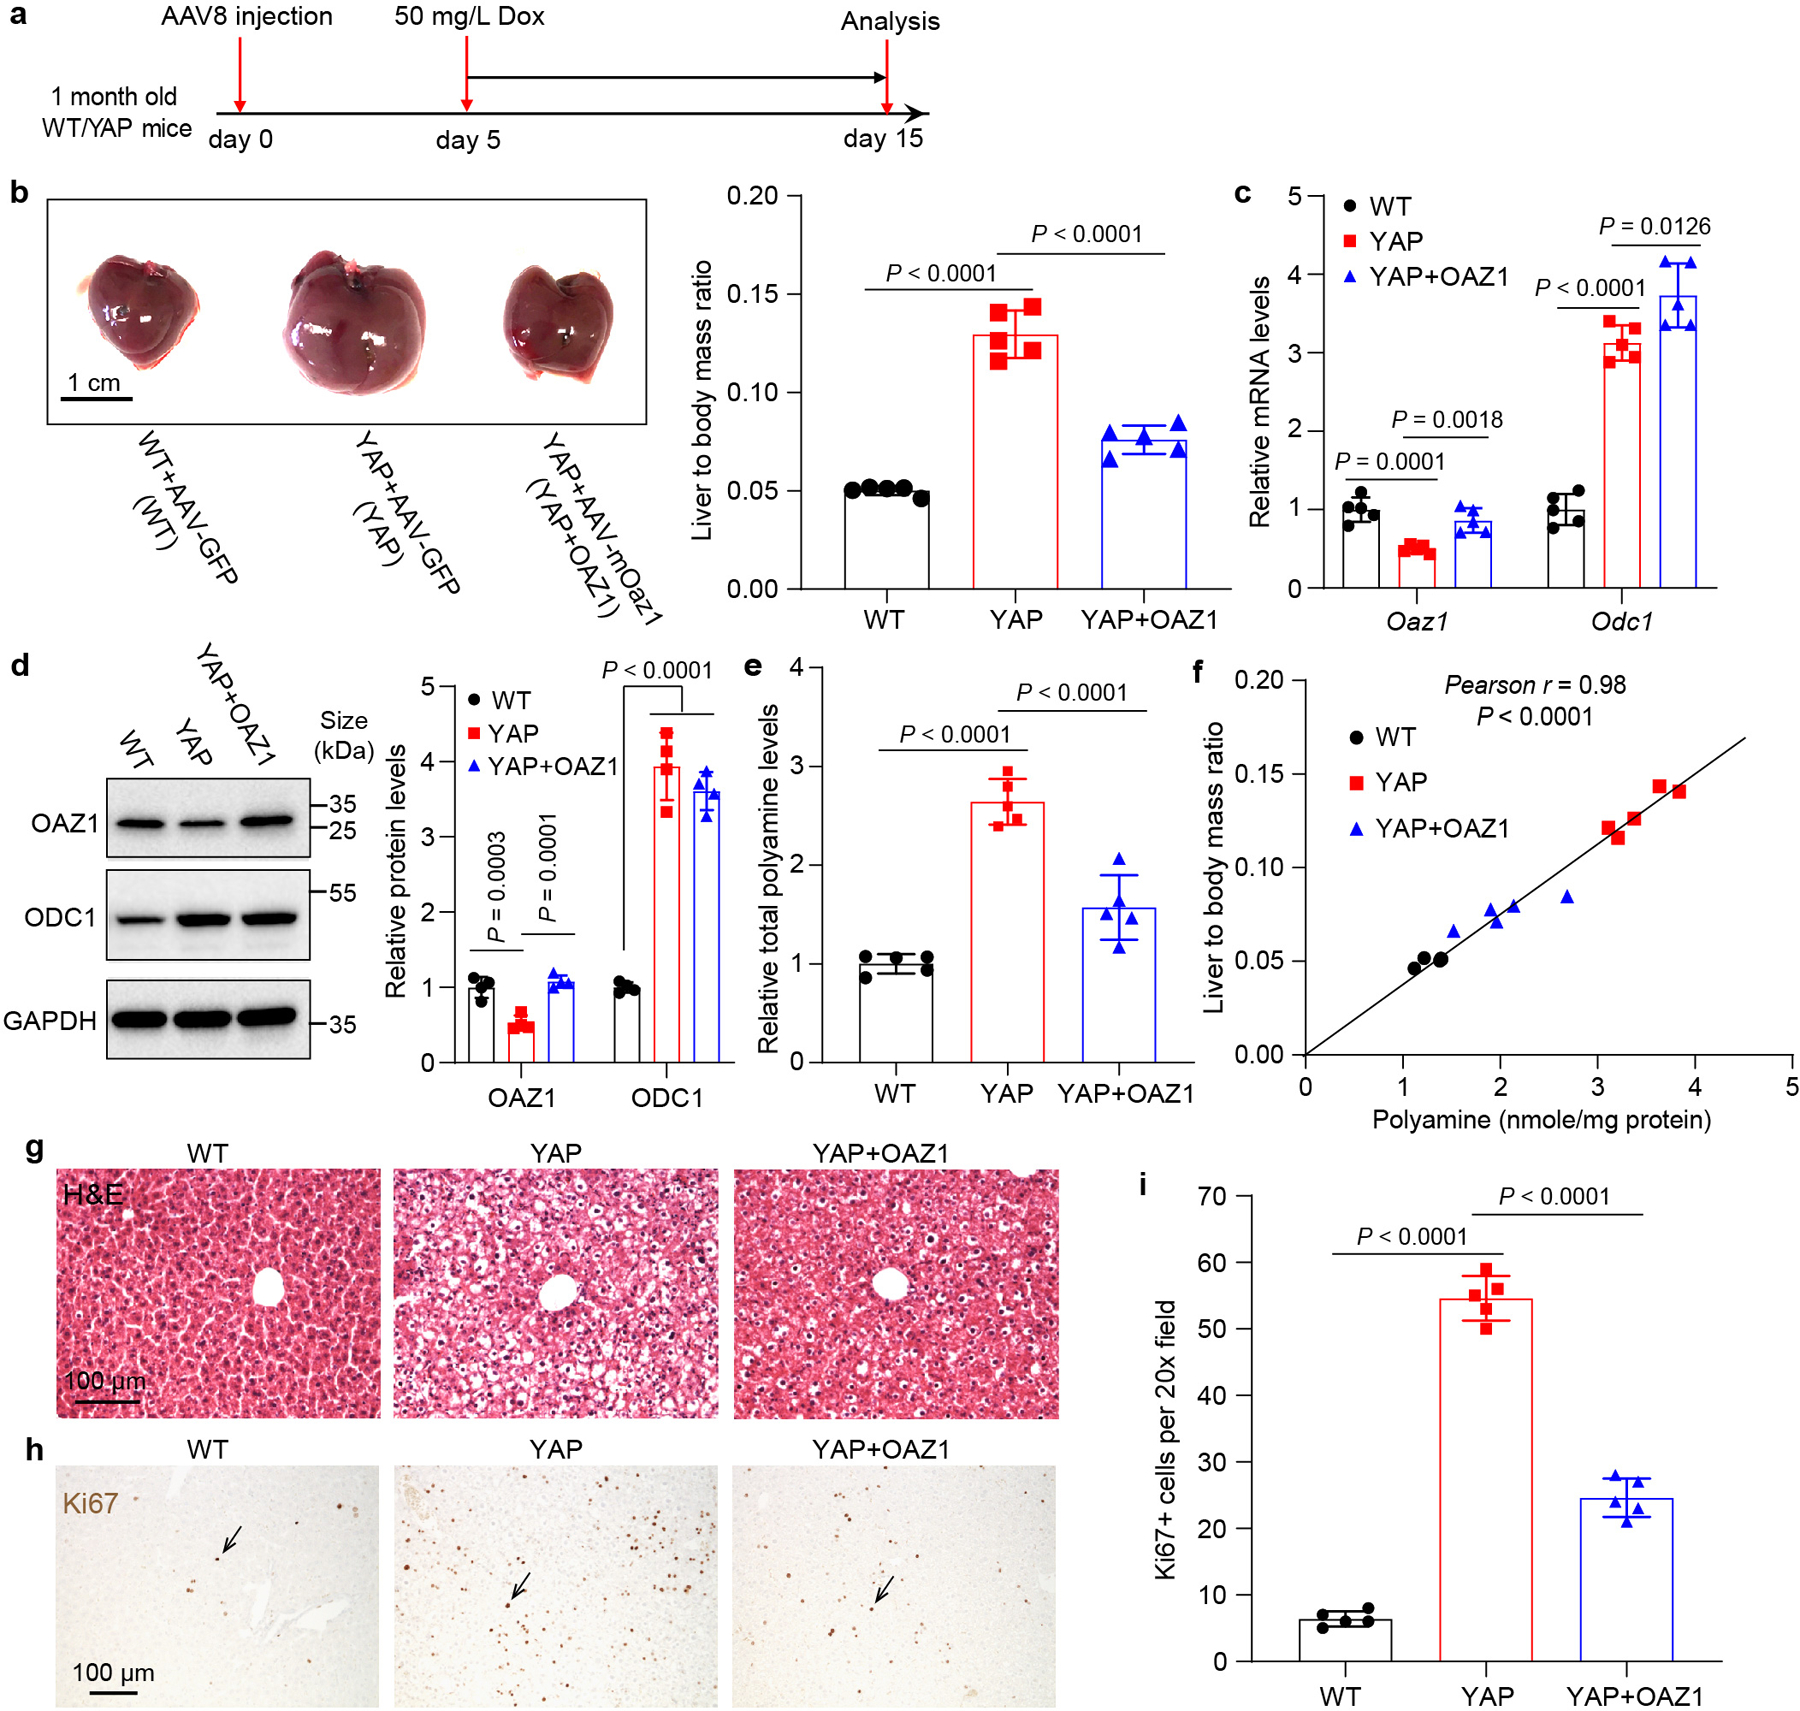
a, Experimental design. One-month old wild type (WT) and Dox inducible YAP transgenic (YAP) mice were treated with AAV8-GFP or AAV8-Alb>Oaz1. Five days later, 50 mg/L Dox was added in drink water to induce YAP overexpression for 10 days. b, Representative liver images of mice described in (a) and quantification of liver to body mass ratio. Data are represented as mean ± SD, n = 5, one-way ANOVA, Dunnett’s multiple comparisons test. c, Relative Odc1 and Oaz1 mRNA levels were examined by RT-qPCR. Data are represented as mean ± SD, n = 5, one-way ANOVA, Dunnett’s multiple comparisons test. d, Relative levels of OAZ1 and ODC1 protein were examined by western blot. Quantitation data are shown as mean ± SD, n = 4, one-way ANOVA, Dunnett’s multiple comparisons test. e, Relative total polyamine levels were measured by a commercial kit. Data are represented as mean ± SD, n = 5, one-way ANOVA, Dunnett’s multiple comparisons test. f, Pearson correlation between liver size and polyamine concentrations in the mice from all the three groups. n = 5 per group, r = 0.98, P < 0.0001, two-sided Pearson correlation test. g,h, Representative images of H&E and Ki67 staining of liver samples from WT, YAP and YAP+OAZ1 mice. Livers from 5 mice each experiment were examined with similar results. i, Quantitation of Ki67+ cells. Data are represented as mean ± SD, n = 5, one-way ANOVA, Dunnett’s multiple comparisons test.
Extended Data Fig. 5: Inhibiting ODC1 impedes the proliferation of human cancer cells with active YAP/TAZ.
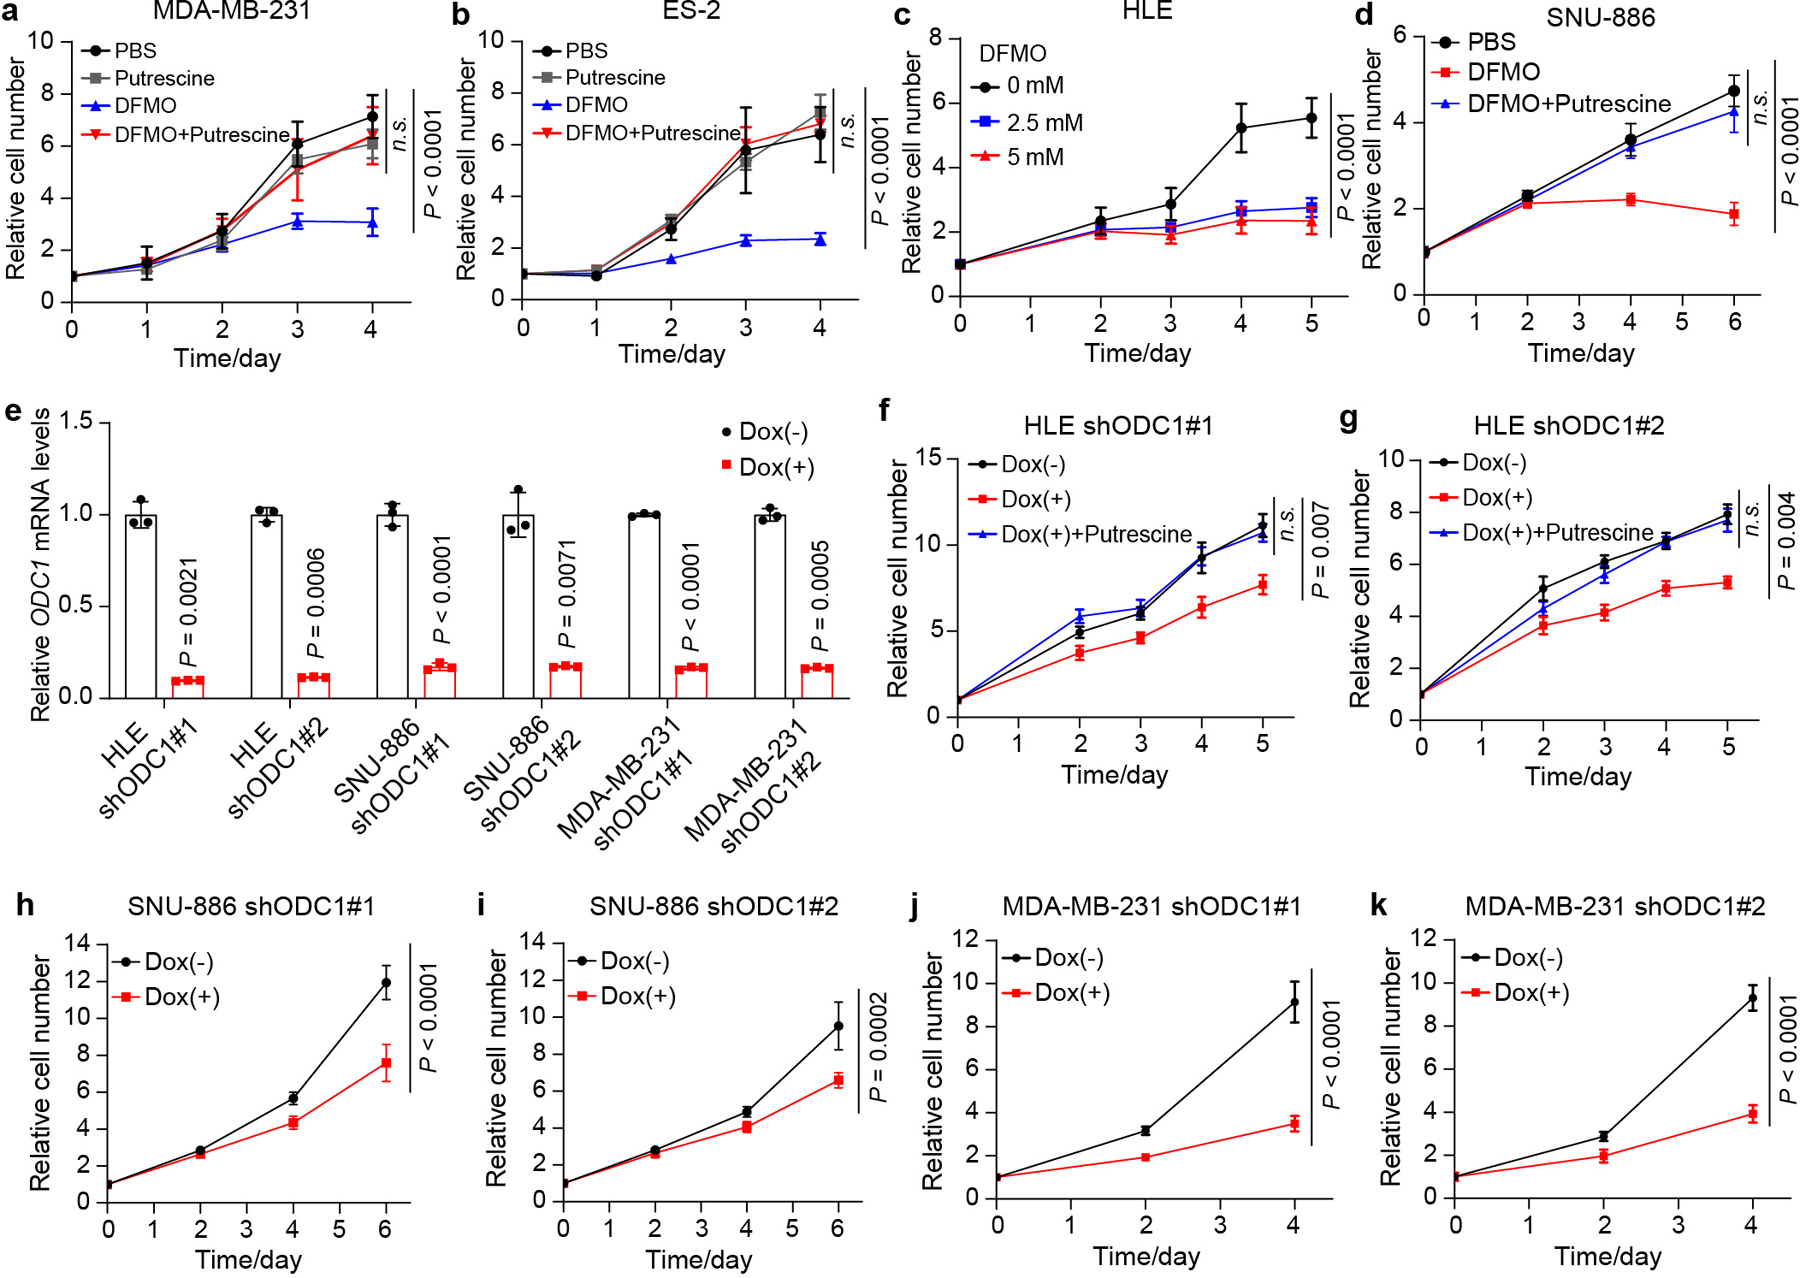
a,b, MDA-MB-231 and ES-2 cells were treated with PBS, 2.5 mM DFMO (ODC1 inhibitor), 1 mM putrescine or 2.5 mM DFMO plus 1 mM putrescine. Relative cell number was measured. Data are represented as mean ± SD, n = 5, two-way ANOVA, n.s., not significant P = 0.57. c, HLE cells were treated with different concentrations of DFMO. Relative cell number was measured. Data are represented as mean ± SD, n = 5, two-way ANOVA. d, SNU-886 cells were treated with PBS, 2.5 mM DFMO, 2.5 mM DFMO plus 1 mM putrescine. Relative cell number was measured. Data are represented as mean ± SD, n = 6, two-way ANOVA, n.s., not significant P = 0.65. e, ODC1 knockdown efficiency was evaluated by RT-qPCR in HLE, SNU-886 and MDA-MB-231 cells two days post dox treatment. Each cell line was tested with two different doxycycline (Dox) inducible shRNAs (shODC1 #1 and shODC1 #2). Data are shown as mean ± SD, n = 3, unpaired two-tailed Student’s t-test. f,g, HLE cells carrying shODC1 #1 or shODC1 #2 were treated with 1 μg/mL of Dox or 1 μg/mL of Dox plus 1 mM of putrescine. Relative cell number was measured. Data are represented as mean ± SEM, n = 6, two-way ANOVA, n.s., not significant P = 0.75. h,i, SNU-886 cells carrying shODC1 #1 or shODC1 #2 were treated with 1 μg/mL of Dox. Relative cell number was measured. Data are represented as mean ± SD, n = 6, two-way ANOVA. j,k, MDA-MB-231 cells carrying shODC1 #1 or shODC1 #2 were treated with 1 μg/mL of Dox. Relative cell number was measured. Data are represented as mean ± SD, n = 6, two-way ANOVA.
Extended Data Fig. 6: Identification of LSD1 as a target of eIF5AHyp.
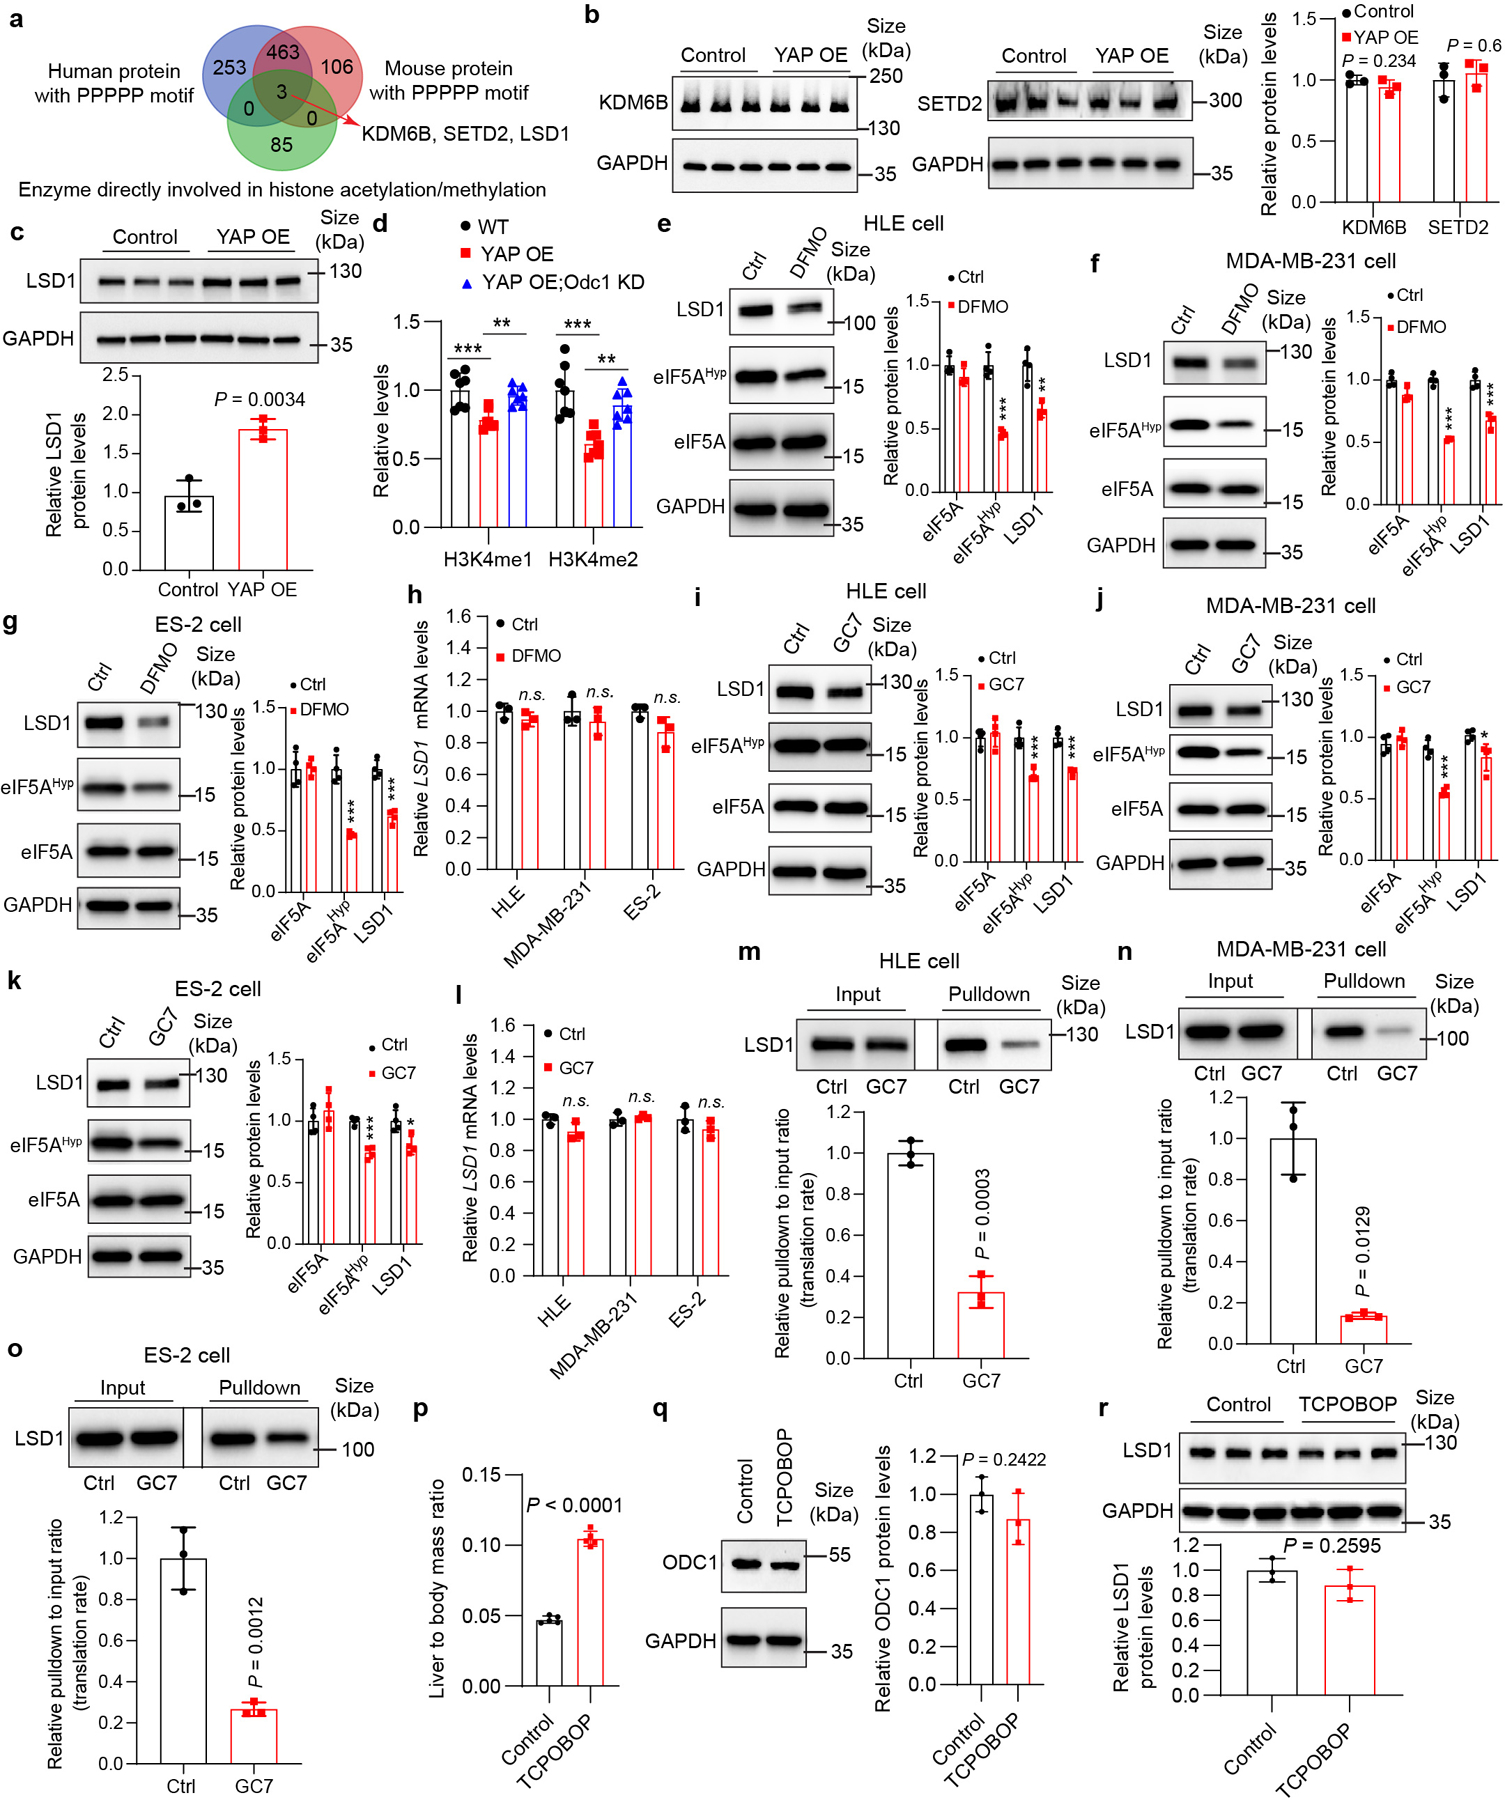
a, Whole proteome peptide sequence analysis identified 3 enzymes directly involved in histone acetylation and methylation with polyproline motif (≥ 5 consecutive proline residues) conserved in human and mouse. b, Relative KDM6B and SETD2 protein levels in control and YAP OE livers. Data are represented as mean ± SD, n = 3, unpaired two-tailed Student’s t-test. c, Relative LSD1 protein levels in control and YAP OE livers. Data are represented as mean ± SD, n = 3, unpaired two-tailed Student’s t-test. d, Relative levels of H3K4me1/2 in control, YAP OE and YAP OE;Odc1 KD livers. Data are represented as mean ± SD, n = 7, **P = 0.0046, ***P = 0.0009, one-way ANOVA with Dunnett’s multiple comparisons test. e-g, HLE, MDA-MB-231 and ES-2 cells were treated with 2.5 mM DFMO or PBS (Ctrl) for 72 hours. Relative eIF5AHyp and LSD1 levels were examined by western blot. Data are represented as mean ± SD, n = 4, **P = 0.0019, ***P = 0.00031, unpaired two-tailed Student’s t-test. h, HLE, MDA-MB-231 and ES-2 cells were treated with 2.5 mM DFMO or PBS (Ctrl) for 72 hours. Relative LSD1 mRNA levels were examined by RT-qPCR. Data are represented as mean ± SD, n = 3, n.s., not significant P = 0.0955, unpaired two-tailed Student’s t-test. i-k, HLE, MDA-MB-231 and ES-2 cells were treated with 10 μM GC7 or PBS (Ctrl) for 24 hours. Relative eIF5AHyp and LSD1 levels were examined by western blot. Data are represented as mean ± SD, n = 4, *P = 0.0223, ***P = 0.0008, **unpaired two-tailed Student’s t-test. l, HLE, MDA-MB-231 and ES-2 cells were treated with 10 μM GC7 or PBS (Ctrl) for 24 hours. Relative LSD1 mRNA levels were measured by RT-qPCR. Data are represented as mean ± SD, n = 3, n.s., not significant P = 0.112, unpaired two-tailed Student’s t-test. m-o, Western blots reveal newly synthesized LSD1 of HLE, MDA-MB-231 and ES-2 cells treated with GC7 or PBS (Ctrl) for 24 hours using the method shown in Fig. 4f. Data are represented as mean ± SD, n = 3, unpaired two-tailed Student’s t-test. p-r, Mice were treated with vehicle (Control) and a single dose of 3 mg/kg TCPOBOP prepared in 10% DMSO/90% corn oil (TCPOBOP). Liver size (p), ODC1 protein levels (q) and LSD1 protein levels (r) were examined 7 days post TCPOBOP treatment. Data are represented as mean ± SD, n = 5 for p, n = 3 for q and r, unpaired two-tailed Student’s t-test.
Extended Data Fig. 7: Relative levels of individual polyamine in DFMO-treated cell lines.
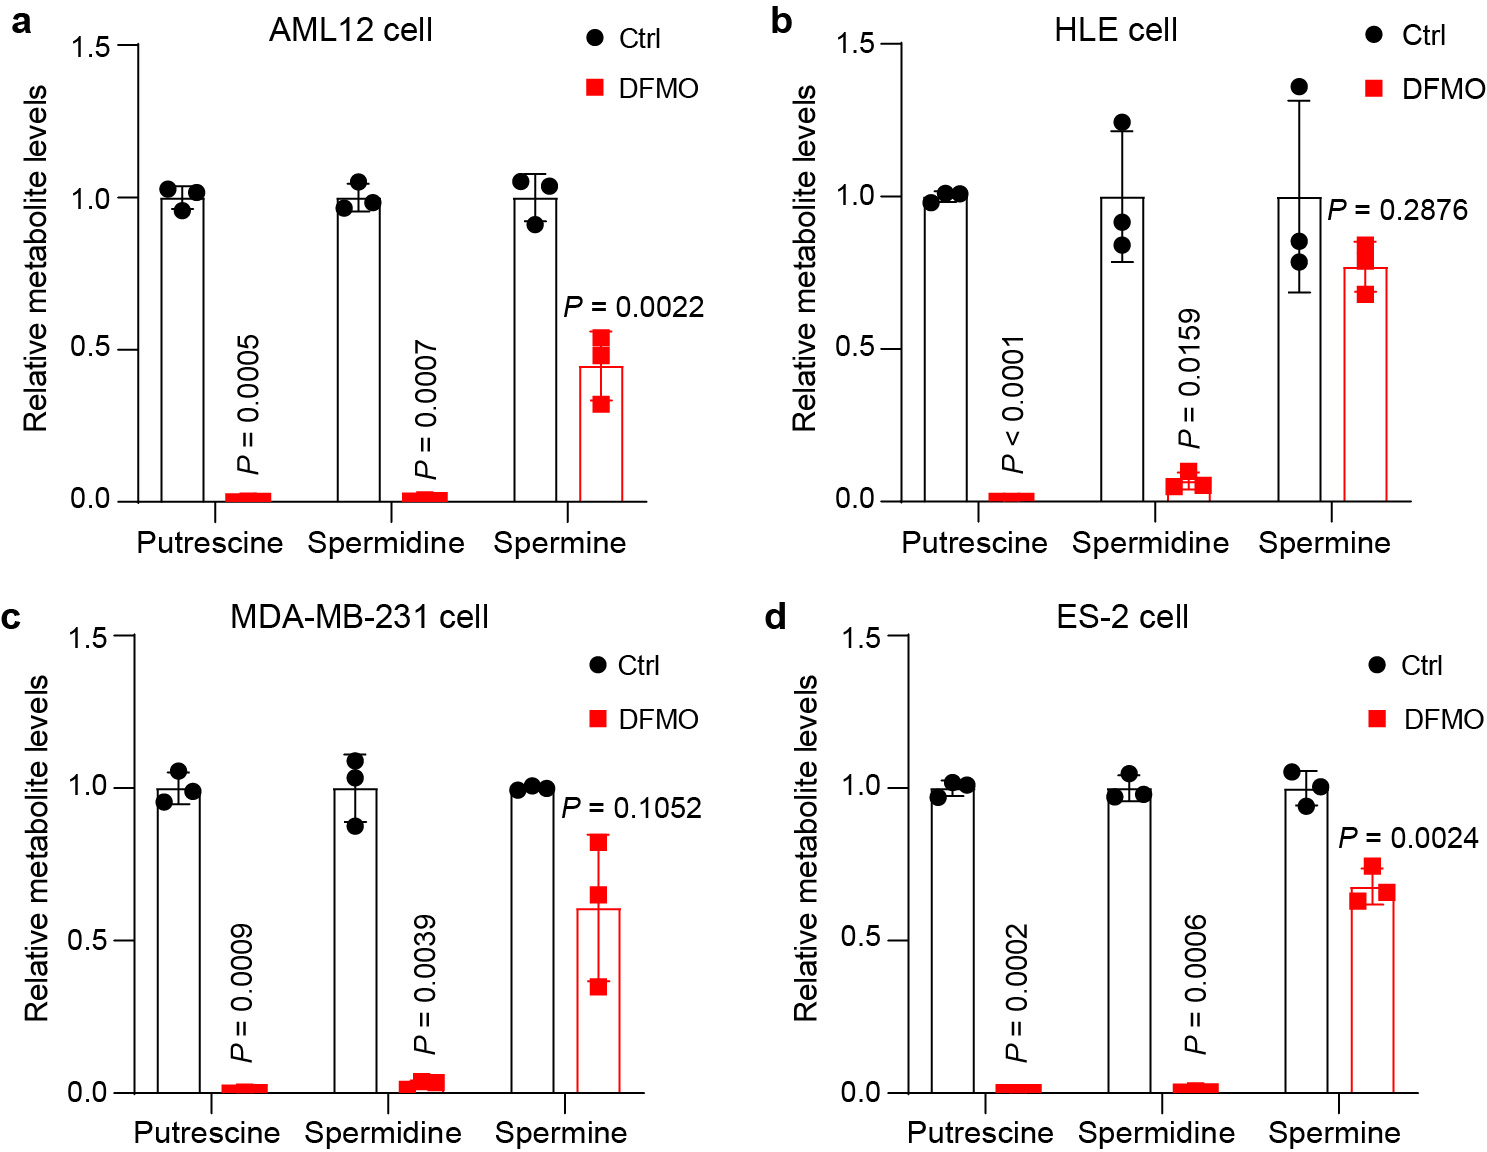
a, Relative polyamine levels of AML12 cells treated with 2.5 mM DFMO or PBS (Ctrl) for 72 hours. Data are represented as mean ± SD, n = 3, unpaired two-tailed Student’s t-test. b, Relative polyamine levels of HLE cells treated with 2.5 mM DFMO or PBS (Ctrl) for 72 hours. Data are represented as mean ± SD, n = 3, unpaired two-tailed Student’s t-test. c, Relative polyamine levels of MDA-MB-231 cells treated with 2.5 mM DFMO or PBS (Ctrl) for 72 hours. Data are represented as mean ± SD, n = 3, unpaired two-tailed Student’s t-test. d, Relative polyamine levels of ES-2 cells treated with 2.5 mM DFMO or PBS (Ctrl) for 72 hours. Data are represented as mean ± SD, n = 3, unpaired two-tailed Student’s t-test.
Extended Data Fig. 8: AAV-mediated Lsd1 knockout in the liver has little effect on liver size and histology in Lsd1f/f mice.
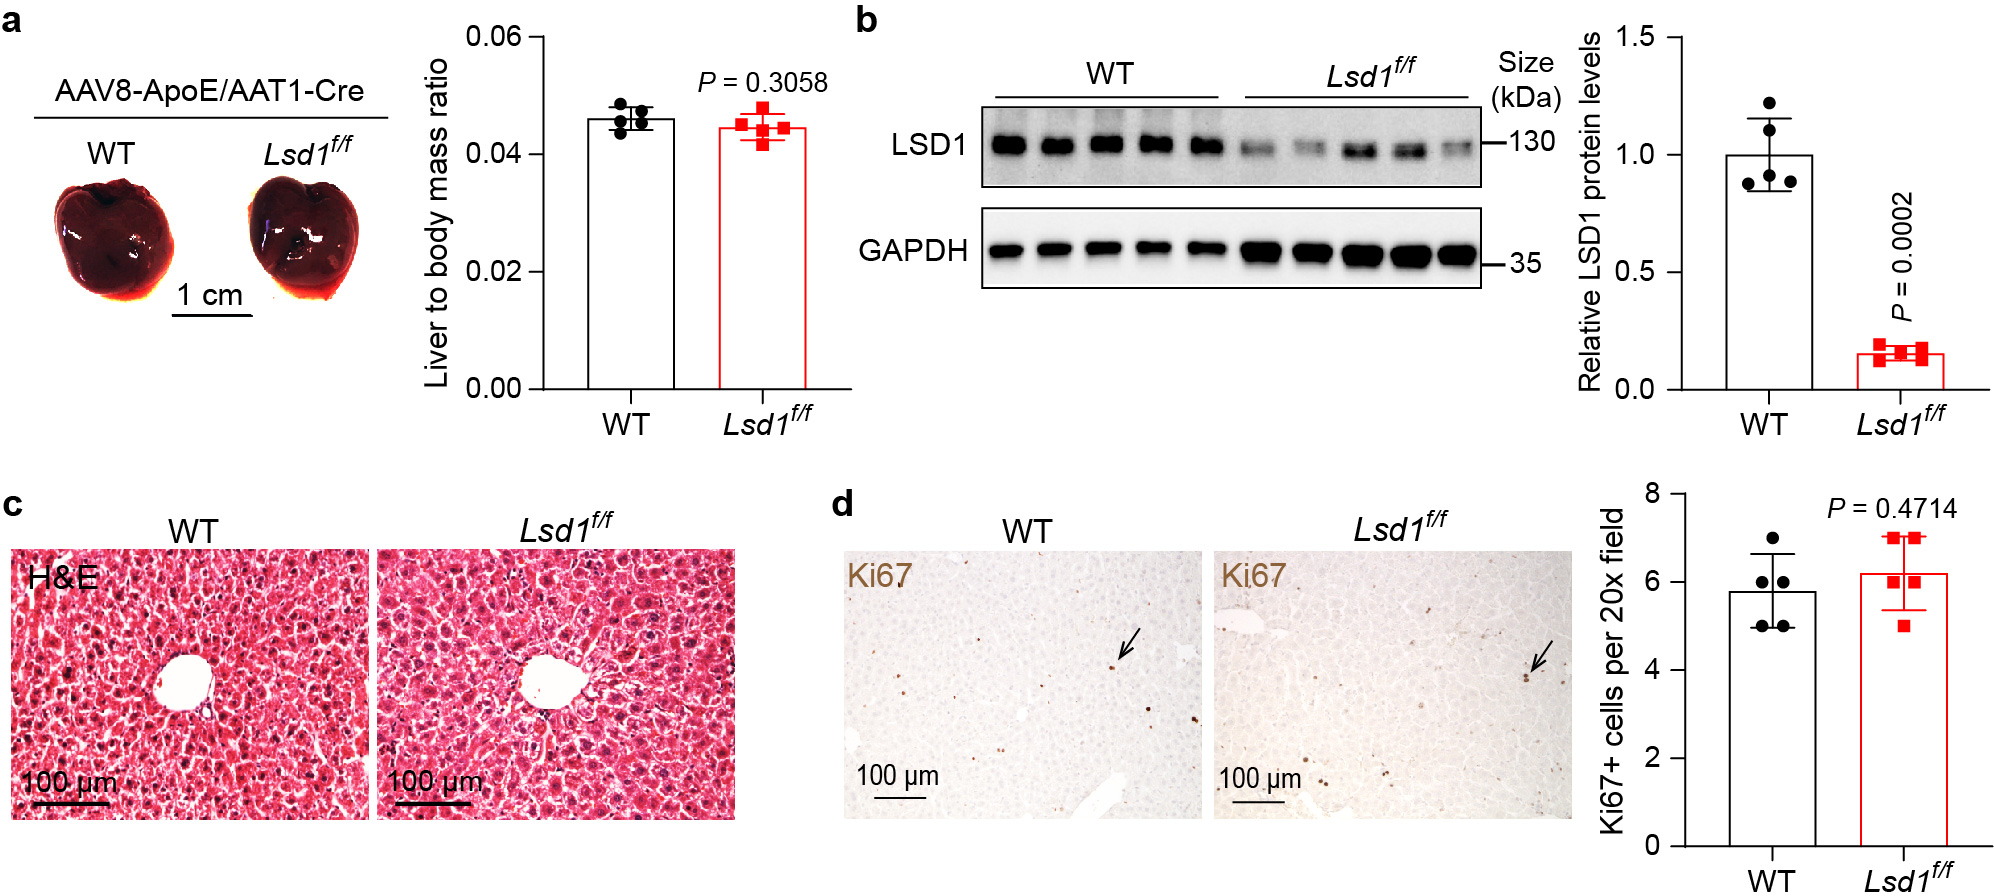
a, Wildtype (WT) and Lsd1flox/flox (Lsd1f/f) mouse livers 19 days post AAV8-ApoE/AAT1-Cre treatment, and quantification of liver to body mass ratio. Data are represented as mean ± SD, n = 5, unpaired two-tailed Student’s t-test. b, Western blot analysis of LSD1 expression in WT and Lsd1f/f mouse livers post AAV treatment, and quantitation of relative LSD1 protein levels. Data are shown as mean ± SD, n = 5, unpaired two-tailed Student’s t-test. c, Representative images of liver H&E staining. Livers from 5 mice each experiment were examined with similar results. d, Liver Ki67 IHC staining and quantification. Data are represented as mean ± SD, n = 5, unpaired two-tailed Student’s t-test.
Extended Data Fig. 9: Inhibiting LSD1 impedes the proliferation of human cancer cells with active YAP/TAZ.
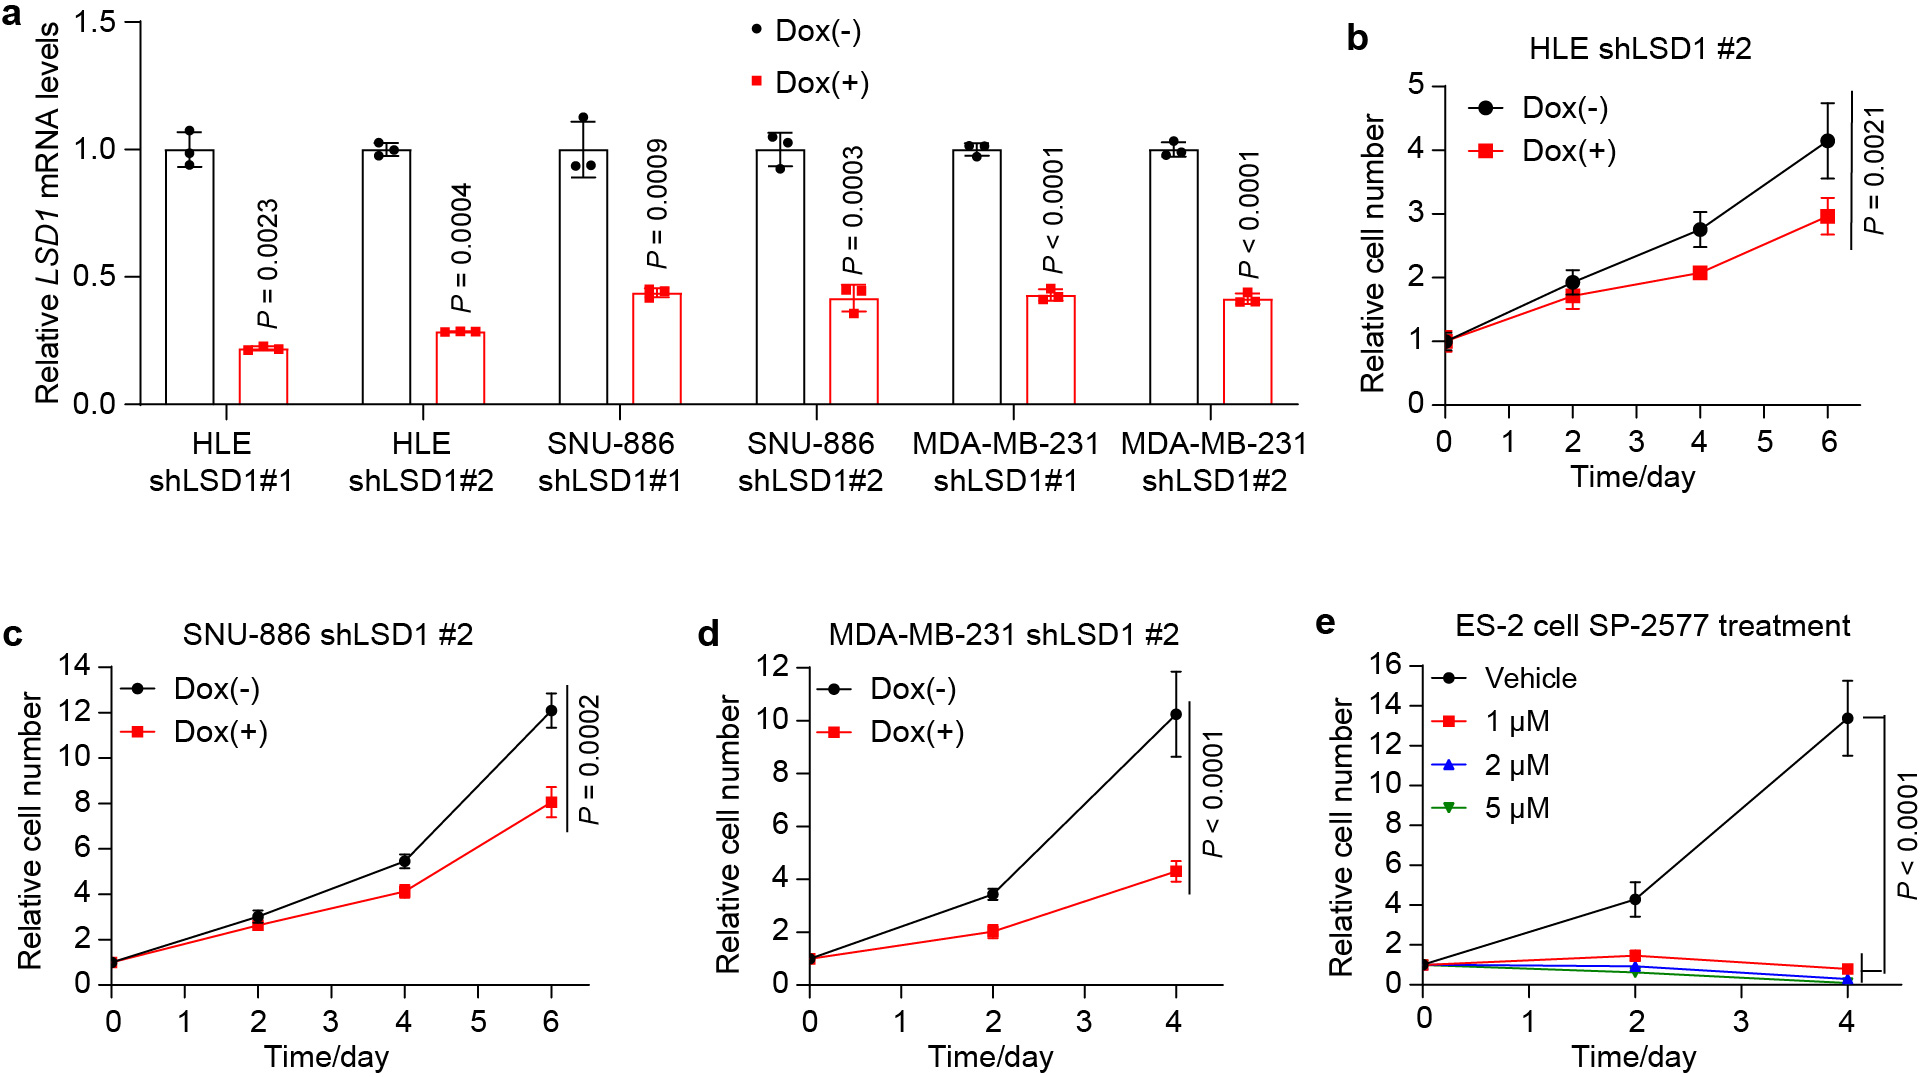
a, LSD1 knockdown efficiency was evaluated by RT-qPCR in HLE, SNU-886 and MDA-MB-231 cells 2 days post doxycycline (Dox) treatment. Each cell line was tested with two different Dox inducible shRNAs (shLSD1 #1 and shLSD1 #2). Data are represented as mean ± SD, n = 3, unpaired two-tailed Student’s t-test. b, HLE cells carrying shLSD1 #2 were treated with 1 μg/mL of Dox. Relative cell number was measured. Data are represented as mean ± SD, n = 5, two-way ANOVA. c, SNU-886 cells carrying shLSD1 #2 were treated with 1 μg/mL of Dox. Relative cell number was measured. Data are represented as mean ± SD, n = 6, two-way ANOVA. d, MDA-MB-231 cells carrying shLSD1 #2 were treated with 1 μg/mL of Dox. Relative cell number was measured. Data are represented as mean ± SD, n = 6, two-way ANOVA. e, ES-2 cells were treated with different concentrations of LSD1 inhibitor SP-2577. Relative cell number was measured. Data are represented as mean ± SD, n = 6, two-way ANOVA.
Extended Data Fig. 10: Characterization of H3K4me1/2 ChIP-seq data in WT and YAP OE livers.
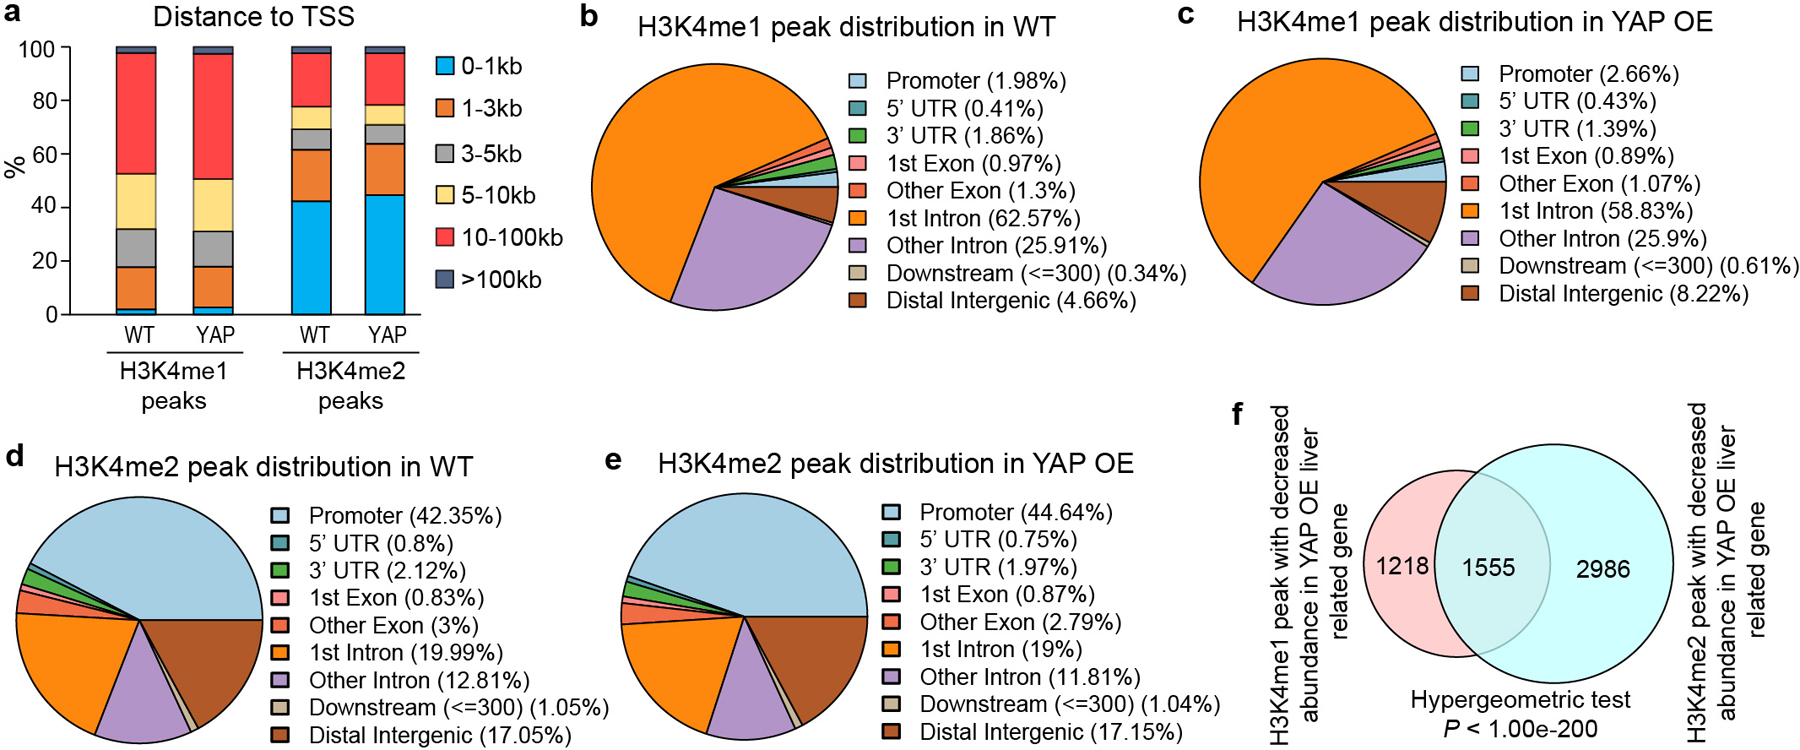
a-e, Distribution and annotation of H3K4me1/2 ChIP peaks in WT and YAP OE liver samples. f, Overlap of genes annotated with decreased H3K4me1 and H3K4me2 ChIP peak signal in YAP OE livers (Hypergeometric test, P < 1.00e-200).
Supplementary Material
Acknowledgments
The authors want to thank CRI Metabolomics Facility at UT Southwestern Medical Center for the metabolomics analysis and polyamine detection and Dr. Xiaofeng Wu for the assistance of CRISPR-Cas9 based gene editing. This study was supported in part by grants from the NIH (R01EY015708 to D.P.). D.P. is an investigator of the Howard Hughes Medical Institute.
Footnotes
Competing interests
The authors have no financial and non-financial competing interests.
References
- 1.Pavlova NN & Thompson CB The Emerging Hallmarks of Cancer Metabolism. Cell Metab. 23, 27–47 (2016). [DOI] [PMC free article] [PubMed] [Google Scholar]
- 2.Dang L et al. Cancer-associated IDH1 mutations produce 2-hydroxyglutarate. Nature 462, 739–744 (2009). [DOI] [PMC free article] [PubMed] [Google Scholar]
- 3.Faubert B, Solmonson A & DeBerardinis RJ Metabolic reprogramming and cancer progression. Science 368, eaaw5473 (2020). [DOI] [PMC free article] [PubMed] [Google Scholar]
- 4.Vander Heiden MG & DeBerardinis RJ Understanding the Intersections between Metabolism and Cancer Biology. Cell 168, 657–669 (2017). [DOI] [PMC free article] [PubMed] [Google Scholar]
- 5.Yu F-X, Zhao B & Guan K-L Hippo pathway in organ size control, tissue homeostasis, and cancer. Cell 163, 811–828 (2015). [DOI] [PMC free article] [PubMed] [Google Scholar]
- 6.Zanconato F, Cordenonsi M & Piccolo S YAP/TAZ at the Roots of Cancer. Cancer Cell 29, 783–803 (2016). [DOI] [PMC free article] [PubMed] [Google Scholar]
- 7.Zheng Y & Pan D The Hippo Signaling Pathway in Development and Disease. Dev. Cell 50, 264–282 (2019). [DOI] [PMC free article] [PubMed] [Google Scholar]
- 8.Sanchez-Vega F et al. Oncogenic Signaling Pathways in The Cancer Genome Atlas. Cell 173, 321–337 (2018). [DOI] [PMC free article] [PubMed] [Google Scholar]
- 9.Ibar C & Irvine KD Integration of Hippo-YAP Signaling with Metabolism. Dev. Cell 54, 256–267 (2020). [DOI] [PMC free article] [PubMed] [Google Scholar]
- 10.Koo JH & Guan KL Interplay between YAP/TAZ and Metabolism. Cell Metab. 28, 196–206 (2018). [DOI] [PubMed] [Google Scholar]
- 11.Ardestani A, Lupse B & Maedler K Hippo Signaling: Key Emerging Pathway in Cellular and Whole-Body Metabolism. Trends Endocrinol. Metab. 29, 492–509 (2018). [DOI] [PubMed] [Google Scholar]
- 12.Dong J et al. Elucidation of a Universal Size-Control Mechanism in Drosophila and Mammals. Cell 130, 1120–1133 (2007). [DOI] [PMC free article] [PubMed] [Google Scholar]
- 13.Casero RA Jr., Murray Stewart T & Pegg AE Polyamine metabolism and cancer: treatments, challenges and opportunities. Nat. Rev. Cancer 18, 681–695 (2018). [DOI] [PMC free article] [PubMed] [Google Scholar]
- 14.Pegg AE Regulation of ornithine decarboxylase. J. Biol. Chem. 281, 14529–14532 (2006). [DOI] [PubMed] [Google Scholar]
- 15.Lee KP et al. The Hippo-Salvador pathway restrains hepatic oval cell proliferation, liver size, and liver tumorigenesis. Proc. Natl. Acad. Sci. USA 107, 8248–8253 (2010). [DOI] [PMC free article] [PubMed] [Google Scholar]
- 16.Lu L et al. Hippo signaling is a potent in vivo growth and tumor suppressor pathway in the mammalian liver. Proc. Natl. Acad. Sci. USA 107, 1437–1442 (2010). [DOI] [PMC free article] [PubMed] [Google Scholar]
- 17.Zhao B et al. TEAD mediates YAP-dependent gene induction and growth control. Genes Dev. 22, 1962–1971 (2008). [DOI] [PMC free article] [PubMed] [Google Scholar]
- 18.Galli GG et al. YAP Drives Growth by Controlling Transcriptional Pause Release from Dynamic Enhancers. Mol. Cell 60, 328–337 (2015). [DOI] [PMC free article] [PubMed] [Google Scholar]
- 19.Dupont S et al. Role of YAP/TAZ in mechanotransduction. Nature 474, 179–183 (2011). [DOI] [PubMed] [Google Scholar]
- 20.Zhang X et al. The Hippo pathway transcriptional co-activator, YAP, is an ovarian cancer oncogene. Oncogene 30, 2810–2822 (2011). [DOI] [PubMed] [Google Scholar]
- 21.Poulin R, Lu L, Ackermann B, Bey P & Pegg AE Mechanism of the irreversible inactivation of mouse ornithine decarboxylase by alpha-difluoromethylornithine. Characterization of sequences at the inhibitor and coenzyme binding sites. J. Biol. Chem. 267, 150–158 (1992). [PubMed] [Google Scholar]
- 22.Park MH, Cooper HL & Folk JE Identification of hypusine, an unusual amino acid, in a protein from human lymphocytes and of spermidine as its biosynthetic precursor. Proc. Natl. Acad. Sci. USA 78, 2869–2873 (1981). [DOI] [PMC free article] [PubMed] [Google Scholar]
- 23.Abbruzzese A, Park MH & Folk JE Deoxyhypusine hydroxylase from rat testis. Partial purification and characterization. J. Biol. Chem. 261, 3085–3089 (1986). [PubMed] [Google Scholar]
- 24.Wolff EC, Lee YB, Chung SI, Folk JE & Park MH Deoxyhypusine synthase from rat testis: purification and characterization. J. Biol. Chem. 270, 8660–8666 (1995). [DOI] [PubMed] [Google Scholar]
- 25.Gutierrez E et al. eIF5A promotes translation of polyproline motifs. Mol. Cell 51, 35–45 (2013). [DOI] [PMC free article] [PubMed] [Google Scholar]
- 26.Zhang H et al. Polyamines Control eIF5A Hypusination, TFEB Translation, and Autophagy to Reverse B Cell Senescence. Mol. Cell 76, 110–125 (2019). [DOI] [PMC free article] [PubMed] [Google Scholar]
- 27.Zanconato F et al. Transcriptional addiction in cancer cells is mediated by YAP/TAZ through BRD4. Nat. Med. 24, 1599–1610 (2018). [DOI] [PMC free article] [PubMed] [Google Scholar]
- 28.Chang L et al. The SWI/SNF complex is a mechanoregulated inhibitor of YAP and TAZ. Nature 563, 265–269 (2018). [DOI] [PMC free article] [PubMed] [Google Scholar]
- 29.Qing Y et al. The Hippo effector Yorkie activates transcription by interacting with a histone methyltransferase complex through Ncoa6. Elife 3, e02564 (2014). [DOI] [PMC free article] [PubMed] [Google Scholar]
- 30.Shi Y et al. Histone demethylation mediated by the nuclear amine oxidase homolog LSD1. Cell 119, 941–953 (2004). [DOI] [PubMed] [Google Scholar]
- 31.Maiques-Diaz A & Somervaille TC LSD1: biologic roles and therapeutic targeting. Epigenomics 8, 1103–1116 (2016). [DOI] [PMC free article] [PubMed] [Google Scholar]
- 32.Jakus J, Wolff EC, Park MH & Folk JE Features of the spermidine-binding site of deoxyhypusine synthase as derived from inhibition studies. Effective inhibition by bis- and mono-guanylated diamines and polyamines. J. Biol. Chem. 268, 13151–13159 (1993). [PubMed] [Google Scholar]
- 33.Zhang H et al. TEAD transcription factors mediate the function of TAZ in cell growth and epithelial-mesenchymal transition. J. Biol. Chem. 284, 13355–13362 (2009). [DOI] [PMC free article] [PubMed] [Google Scholar]
- 34.Kinnaird A, Zhao S, Wellen KE & Michelakis ED Metabolic control of epigenetics in cancer. Nat. Rev. Cancer 16, 694–707 (2016). [DOI] [PubMed] [Google Scholar]
- 35.Kaelin WG & McKnight SL Influence of Metabolism on Epigenetics and Disease. Cell 153, 56–69 (2013). [DOI] [PMC free article] [PubMed] [Google Scholar]
- 36.Izzo LT, Affronti HC & Wellen KE The Bidirectional Relationship Between Cancer Epigenetics and Metabolism. Annu. Rev. Cancer Biol. 5, 235–257 (2021). [DOI] [PMC free article] [PubMed] [Google Scholar]
- 37.Gerner EW & Meyskens FL Jr. Polyamines and cancer: old molecules, new understanding. Nat. Rev. Cancer 4, 781–792 (2004). [DOI] [PubMed] [Google Scholar]
- 38.Arruabarrena-Aristorena A, Zabala-Letona A & Carracedo A Oil for the cancer engine: The cross-talk between oncogenic signaling and polyamine metabolism. Sci. Adv. 4, eaar2606 (2018). [DOI] [PMC free article] [PubMed] [Google Scholar]
- 39.Zabala-Letona A et al. mTORC1-dependent AMD1 regulation sustains polyamine metabolism in prostate cancer. Nature 547, 109–113 (2017). [DOI] [PMC free article] [PubMed] [Google Scholar]
- 40.Silvera D, Formenti SC & Schneider RJ Translational control in cancer. Nat. Rev. Cancer 10, 254–266 (2010). [DOI] [PubMed] [Google Scholar]
- 41.Kim M, Kim T, Johnson RL & Lim DS Transcriptional co-repressor function of the hippo pathway transducers YAP and TAZ. Cell Rep. 11, 270–282 (2015). [DOI] [PubMed] [Google Scholar]
- 42.Hicks-Berthet J et al. Yap/Taz inhibit goblet cell fate to maintain lung epithelial homeostasis. Cell Rep. 36, 109347 (2021). [DOI] [PMC free article] [PubMed] [Google Scholar]
- 43.Lee DH et al. LATS-YAP/TAZ controls lineage specification by regulating TGFβ signaling and Hnf4α expression during liver development. Nat. Commun. 7, 11961 (2016). [DOI] [PMC free article] [PubMed] [Google Scholar]
- 44.Proietti E, Rossini S, Grohmann U & Mondanelli G Polyamines and Kynurenines at the Intersection of Immune Modulation. Trends Immunol. 41, 1037–1050 (2020). [DOI] [PubMed] [Google Scholar]
- 45.Latour YL, Gobert AP & Wilson KT The role of polyamines in the regulation of macrophage polarization and function. Amino Acids 52, 151–160 (2020). [DOI] [PMC free article] [PubMed] [Google Scholar]
- 46.Sheng W et al. LSD1 Ablation Stimulates Anti-tumor Immunity and Enables Checkpoint Blockade. Cell 174, 549–563 (2018). [DOI] [PMC free article] [PubMed] [Google Scholar]
- 47.Madeo F, Eisenberg T, Pietrocola F & Kroemer G Spermidine in health and disease. Science 359, eaan2788 (2018). [DOI] [PubMed] [Google Scholar]
- 48.Ambrosio S, Ballabio A & Majello B Histone methyl-transferases and demethylases in the autophagy regulatory network: the emerging role of KDM1A/LSD1 demethylase. Autophagy 15, 187–196 (2019). [DOI] [PMC free article] [PubMed] [Google Scholar]
- 49.Cai J et al. The Hippo signaling pathway restricts the oncogenic potential of an intestinal regeneration program. Genes Dev. 24, 2383–2388 (2010). [DOI] [PMC free article] [PubMed] [Google Scholar]
- 50.Zhao B et al. Inactivation of YAP oncoprotein by the Hippo pathway is involved in cell contact inhibition and tissue growth control. Genes Dev. 21, 2747–2761 (2007). [DOI] [PMC free article] [PubMed] [Google Scholar]
- 51.Chong J, Wishart DS & Xia J Using MetaboAnalyst 4.0 for Comprehensive and Integrative Metabolomics Data Analysis. Curr. Protoc. Bioinformatics 68, e86 (2019). [DOI] [PubMed] [Google Scholar]
- 52.Forester CM et al. Revealing nascent proteomics in signaling pathways and cell differentiation. Proc. Natl. Acad. Sci. USA 115, 2353–2358 (2018). [DOI] [PMC free article] [PubMed] [Google Scholar]
- 53.Zanconato F et al. Genome-wide association between YAP/TAZ/TEAD and AP-1 at enhancers drives oncogenic growth. Nat. Cell Biol. 17, 1218–1227 (2015). [DOI] [PMC free article] [PubMed] [Google Scholar]
- 54.Chung CY et al. Cbx8 Acts Non-canonically with Wdr5 to Promote Mammary Tumorigenesis. Cell Rep. 16, 472–486 (2016). [DOI] [PMC free article] [PubMed] [Google Scholar]
- 55.Takaku M et al. GATA3-dependent cellular reprogramming requires activation-domain dependent recruitment of a chromatin remodeler. Genome Biol. 17, 36 (2016). [DOI] [PMC free article] [PubMed] [Google Scholar]
- 56.Li D, Hsu S, Purushotham D, Sears RL & Wang T WashU Epigenome Browser update 2019. Nucleic Acids Res. 47, W158–W165 (2019). [DOI] [PMC free article] [PubMed] [Google Scholar]
- 57.Dixon JR et al. Chromatin architecture reorganization during stem cell differentiation. Nature 518, 331–336 (2015). [DOI] [PMC free article] [PubMed] [Google Scholar]
- 58.Rao SS et al. A 3D map of the human genome at kilobase resolution reveals principles of chromatin looping. Cell 159, 1665–1680 (2014). [DOI] [PMC free article] [PubMed] [Google Scholar]
- 59.Leung D et al. Integrative analysis of haplotype-resolved epigenomes across human tissues. Nature 518, 350–354 (2015). [DOI] [PMC free article] [PubMed] [Google Scholar]
- 60.Wang Y et al. The 3D Genome Browser: a web-based browser for visualizing 3D genome organization and long-range chromatin interactions. Genome Biol. 19, 151 (2018). [DOI] [PMC free article] [PubMed] [Google Scholar]
- 61.Tang Z et al. GEPIA: a web server for cancer and normal gene expression profiling and interactive analyses. Nucleic Acids Res. 45, W98–W102 (2017). [DOI] [PMC free article] [PubMed] [Google Scholar]
Associated Data
This section collects any data citations, data availability statements, or supplementary materials included in this article.
Supplementary Materials
Data Availability Statement
RNA–seq and ChIP-seq data that support the findings of this study have been deposited in the Gene Expression Omnibus (GEO) under accession codes GSE176329 and GSE174041. Previously published ChIP-seq and Hi-C data that were re-analysed here are available under accession code GSE6608153, GSE7107754 and GSE7214155.
The human liver cancer data were derived from the TCGA Research Network: https://portal.gdc.cancer.gov/. The data-set derived from this resource that supports the findings of this study is available in [https://www.proteinatlas.org/humanproteome/pathology/liver+cancer].
All other data supporting the findings of this study are available from the corresponding author on reasonable request.


