Abstract
The SARS-CoV-2 nonstructural proteins coordinate genome replication and gene expression. Structural analyses revealed the basis for coupling of the essential nsp13 helicase with the RNA dependent RNA polymerase (RdRp) where the holo-RdRp and RNA substrate (the replication-transcription complex, or RTC) associated with two copies of nsp13 (nsp132-RTC). One copy of nsp13 interacts with the template RNA in an opposing polarity to the RdRp and is envisaged to drive the RdRp backwards on the RNA template (backtracking), prompting questions as to how the RdRp can efficiently synthesize RNA in the presence of nsp13. Here, we use cryo-electron microscopy and molecular dynamics simulations to analyze the nsp132-RTC, revealing four distinct conformational states of the helicases. The results suggest a mechanism for the nsp132-RTC to turn backtracking on and off, using an allosteric mechanism to switch between RNA synthesis or backtracking in response to stimuli at the RdRp active site.
COVID-19, caused by the coronavirus SARS-CoV-2 1,2, continues to devastate the world. The viral RNA-dependent RNA polymerase (RdRp, encoded by non-structural protein 12, or nsp12) functions as a holo-RdRp (comprising nsp7/nsp82/nsp12) in a replication-transcription complex (holo-RdRp + RNA, or RTC) to direct RNA synthesis from the viral RNA genome 3–5. The RdRp is also a target for the clinically approved antiviral remdesivir 6–8. In addition to the holo-RdRp, the virus encodes several nucleic acid processing enzymes, including a helicase (nsp13), an exonuclease (nsp14), an endonuclease (nsp15), and methyltransferases (nsp14 and nsp16) 9. Little is known about how these enzymes coordinate to replicate and transcribe the viral genome.
Nsp13, essential for viral replication 10–13, is a superfamily 1B (SF1B) helicase that can unwind DNA or RNA substrates with a 5’->3’ directionality 14–16. Along with the two canonical RecA ATPase domains of SF1 helicases 14,17, nsp13 contains three additional domains; an N-terminal zinc-binding domain (ZBD, unique to nidoviral helicases), a stalk, and a 1B domain 13,18,19. Prior studies established that the nsp13 helicase forms a stable complex with the RTC, and single-particle cryo-electron microscopy (cryo-EM) structures of an nsp132-RTC (the RTC with two nsp13 protomers bound) have been determined 20–22.
In the nsp132-RTC structure, two protomers of nsp13 sit on top of the RTC with each nsp13-ZBD interacting with one of the two N-terminal helical extensions of nsp8 20–22. The two nsp13 protomers were originally named nsp13.1 and nsp13.2 20, but we will use the nomenclature proposed by Hillen 23, nsp13T (binds on the ‘Thumb’ side of the RdRp) and nsp13F (binds on the ‘Fingers’ side of the RdRp); Extended Data Fig. 1). This overall architecture places the nsp13T active site directly in the path of the downstream template-RNA (t-RNA). The cryo-EM maps showed that the 5’-single-stranded overhang of the t-RNA (Extended Data Fig. 2) passed through the nucleic acid binding channel of nsp13T 24, but the low resolution of the map due to structural heterogeneity precluded detailed modeling 20.
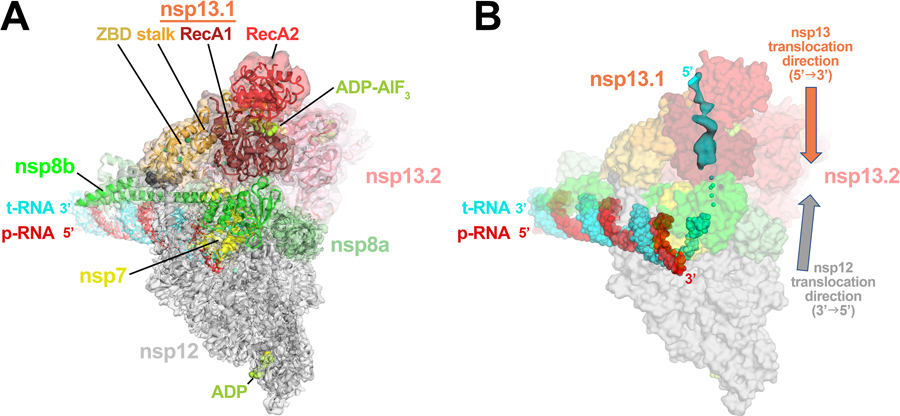
The structural analysis of the nsp132-RTC provided new perspectives into the role of the nsp13 helicase in the complex viral replication-transcription program, suggesting that nsp13 may facilitate processive elongation by the RdRp on the highly structured RNA genome 25,26, but may also generate backtracked RTCs for proofreading, template-switching during sub-genomic RNA transcription, or both 20,27. How nsp13 directs these diverse processes that regulate RdRp function remains less understood. For instance, the structures indicate that nsp13 translocates on the t-RNA strand in the 5’->3’ direction 16, while the RdRp would translocate on the same strand in the opposite direction (Extended Data Fig. 1). How can the RdRp rapidly replicate the ~30 kb viral genome 28 if it is opposed by the helicase? Also, what is the role of the second nsp13 protomer (nsp13F), which appears capable of ATPase and translocation/helicase activity but does not appear to be engaged with nucleic acid in the structures 20,27?
Here we describe an extensive structural analysis of a cryo-EM dataset of the nsp13-RTC, combined with molecular dynamics (MD) simulation analysis of the resulting structures. The results yield a cryo-EM map of the nsp132-RTC at a nominal resolution of 2.8 Å (2.1–2.5 Å in the active site core of the RdRp; Extended Data Fig. 1). Structural heterogeneity apparent in the nsp13 portions of the map was resolved by classification approaches, revealing four distinct conformational states of the nsp13 subunits. Analysis of these conformational states suggest solutions to the apparent contradictions regarding the role of nsp13 and provides further insight into models for nsp13 function during viral replication/transcription.
RESULTS
An augmented cryo-EM dataset allows nsp13-RTC structural analysis.
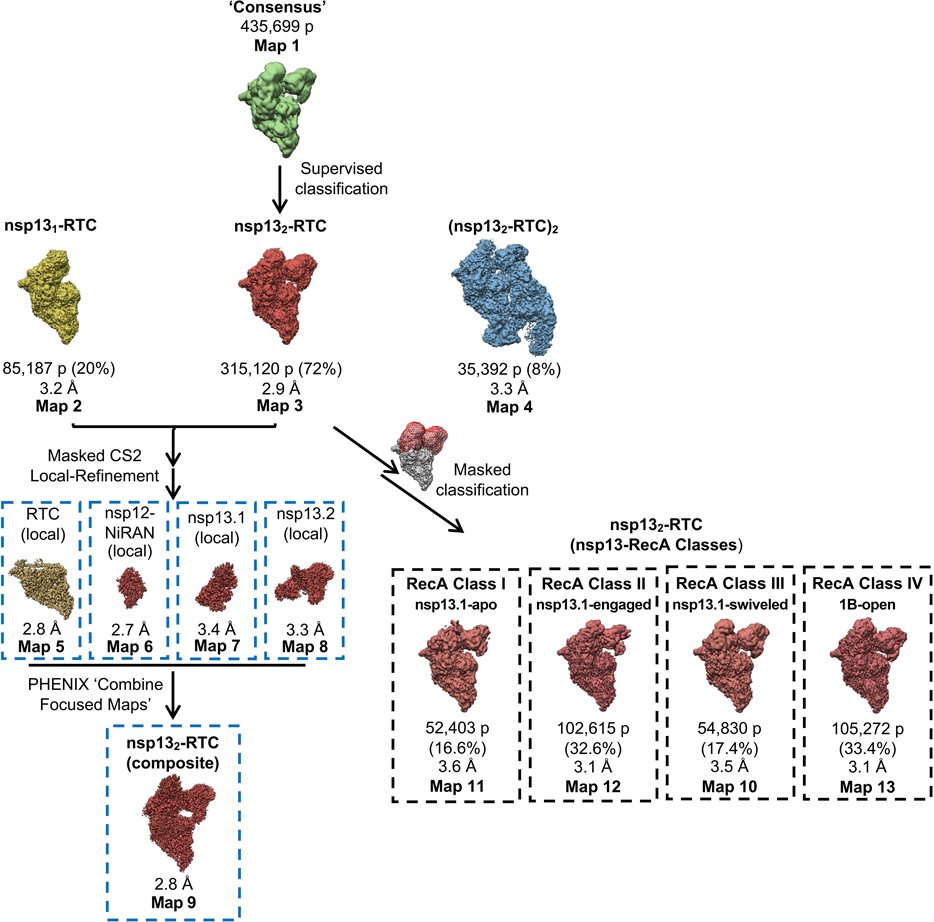
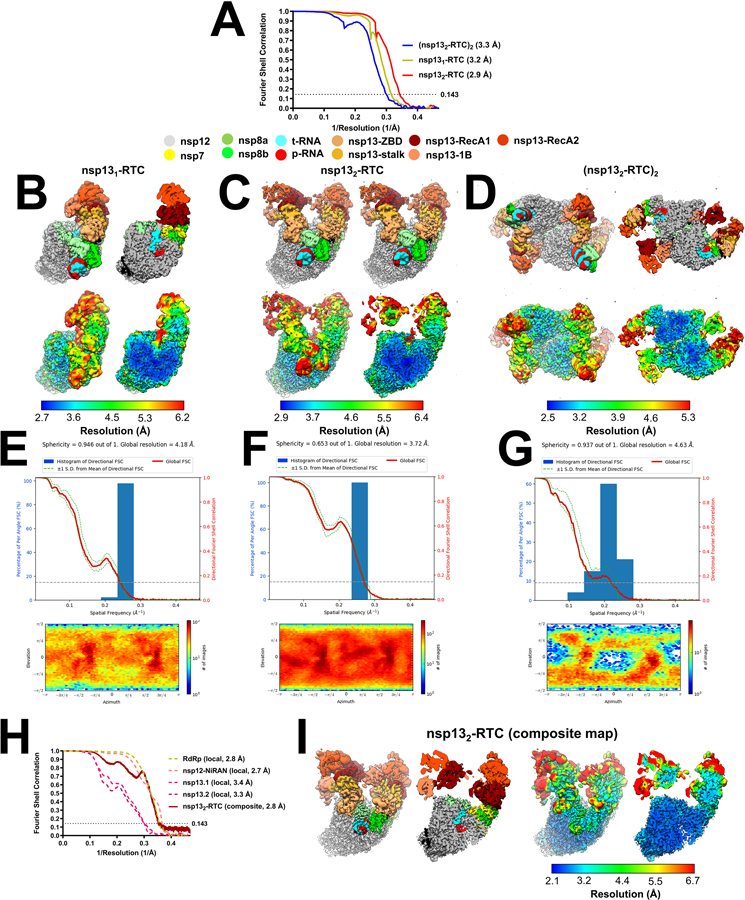
Previously we described a single-particle cryo-EM analysis of a stable SARS-CoV-2 nsp13-RTC from a curated set of 88,058 particle images 20. These particles were classified into three distinct assemblies, nsp131-RTC (4.0 Å nominal resolution), nsp132-RTC (3.5 Å), and a dimer of nsp132-RTC [(nsp132-RTC)2; 7.9 Å]. Here we analyzed a much larger dataset (nearly five times as many particles; Exteded Data Fig. 2, Supplementary Table 1) collected from the same sample preparation. From a consensus refinement (Extended Data Figs. 2 and 3, map1; Note: Extended Data Fig. 2 shows the details of the cryo-EM processing pipeline; Extended DAta Fig. 3 is a streamlined cryo-EM processing pipeline that highlights the essential steps), the particles were classified 29 into the same three assemblies observed previously [nsp131-RTC (map2), nsp132-RTC (map3), (nsp132-RTC)2 (map4)] 20 with a very similar distribution of particles between the three assemblies (Table 1; Extended Data Figs. 2 and 3; Supplementary Table 1), confirming the robustness of the classification procedure. We focus primarily on the nsp132-RTC because the bulk of the particles (72%) belong to this class and generated the highest resolution map (Extended Data Figs. 2–4; map3; 2.9 Å nominal resolution).
Table 1.
Cryo-EM data collection, refinement and validation statistics for nsp131-RTC, nsp132-RTC, and (nsp132-RTC)2.
| nsp131-RTC (EMDB-24431) (PDB 7RE2) | nsp132-RTC (composite) (EMDB-24430) (PDB 7RE1) | (nsp132-RTC)2 (EMDB-24432) (PDB 7RE3) | |
|---|---|---|---|
|
| |||
| Data collection and processing | |||
| Magnification | 81,000 | ||
| Voltage (kV) | 300 | ||
| Electron exposure (e–/Å2) | 66 | ||
| Defocus range (μm) | −0.8 to −2.5 | ||
| Pixel size (Å) | 1.07 | ||
| Symmetry imposed | C1 | ||
| Initial particle images (no.) | 3,750,107 | ||
| Final particle images (no.) | 85,187 | 315,120 | 35,392 |
| Map resolution (Å) | 3.2 | 2.8 | 3.3 |
| FSC threshold 0.143 | |||
| Map resolution range (Å) | 2.7–6.2 | 2.1–6.7 | 2.9–6.4 |
| Refinement | |||
| Initial models used (PDB code) | 6XEZ, 6YYT, 6ZSL | 6XEZ, 6YYT, 6ZSL | 6XEZ, 6YYT, 6ZSL |
| Model resolution (Å) | 3.2 | 2.8 | 3.3 |
| FSC threshold 0.5 | |||
| Map sharpening B factor (Å2) | −81.9 | −61.1 | −97.4 |
| Model composition | |||
| Non-hydrogen atoms | 17,096 | 21,825 | 43,154 |
| Protein residues | 1,963 | 2,553 | 5,106 |
| Nucleic acid residues (RNA) | 71 | 71 | 142 |
| Ligands | 13 | 19 | 34 |
| B factors (Å2) | |||
| Protein | 67.76 | 88.73 | 151.00 |
| Nucleic acids | 151.77 | 175.13 | 158.63 |
| Ligand | 76.87 | 77.6 | 200.51 |
| R.m.s. deviations | |||
| Bond lengths (Å) | 0.005 | 0.004 | 0.004 |
| Bond angles (°) | 0.591 | 0.655 | 0.997 |
| Validation | |||
| MolProbity score | 2.11 | 2.54 | 2.60 |
| Clashscore | 8.79 | 7.84 | 10.86 |
| Poor rotamers (%) | 2.42 | 8.64 | 6.67 |
| Ramachandran plot | |||
| Favored (%) | 94.98 | 94.02 | 93.68 |
| Allowed (%) | 5.02 | 5.98 | 6.32 |
| Disallowed (%) | 0 | 0 | 0 |
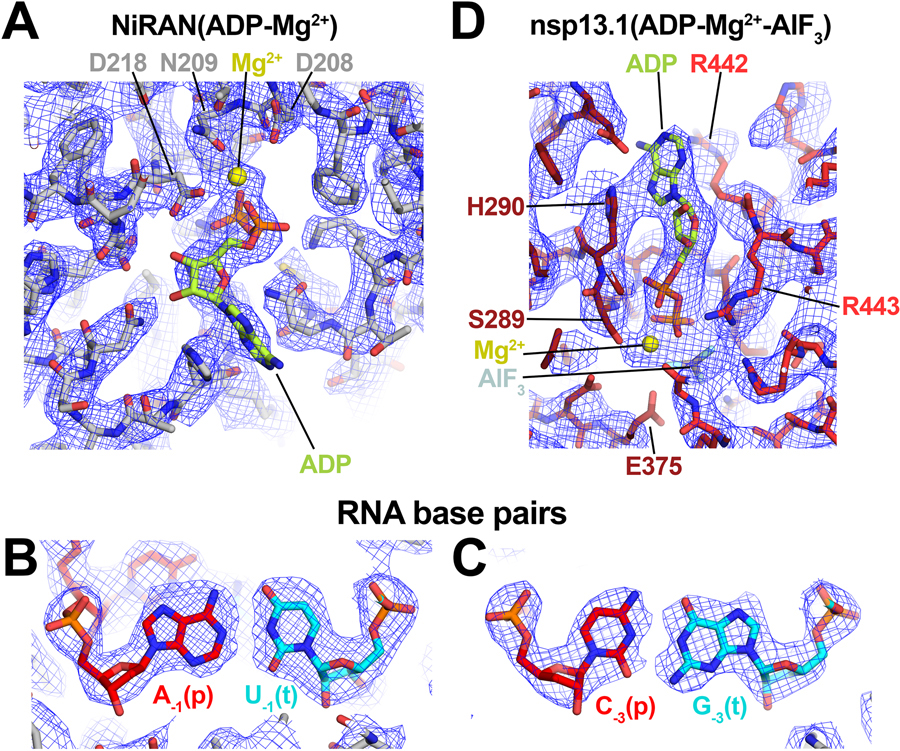
To obtain the best possible consensus cryo-EM map of the entire complex, we generated a series of cryo-EM maps by focused refinement around sub-domains of the nsp131-RTC (map2) and nsp132-RTC (map3) maps and combined these, generating a composite map with a nominal resolution of 2.8 Å (Extended Data Figs. 2–4, map9). Local resolution analysis 30 suggested that the active site and NiRAN ligand-binding pocket of the RdRp were resolved to between 2.1–2.6 Å resolution (Extended Data Fig. 4). This was supported by the excellent quality of the cryo-EM map, where the ADP-Mg2+ bound in the NiRAN domain enzymatic site could be visualized (Extended Data Fig. 5), and RNA base pairs near the RdRp active site could be identified directly from the cryo-EM density (Extended Data Fig. 5). Although not as well resolved, the ADP-AlF3-Mg2+ and surrounding residues in the nsp13 active sites could also be modeled (Extended Data Fig. 5).
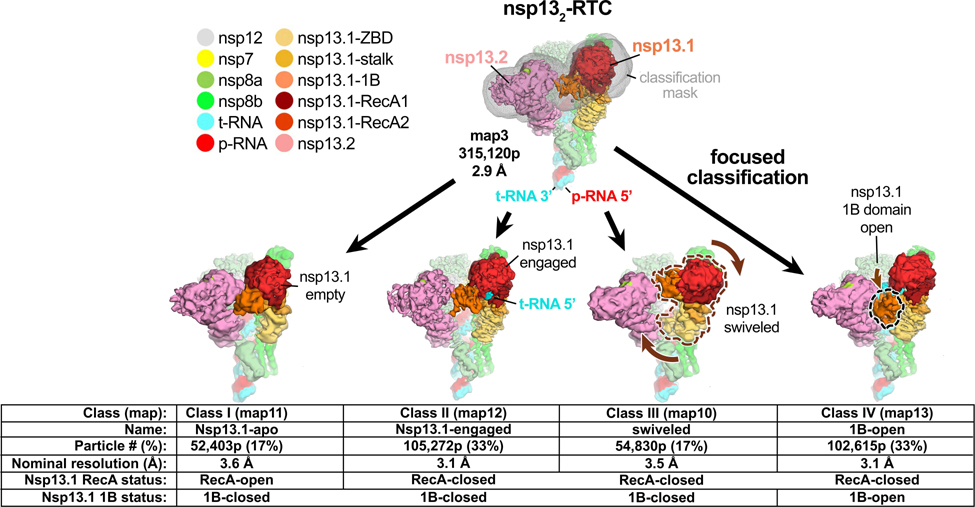
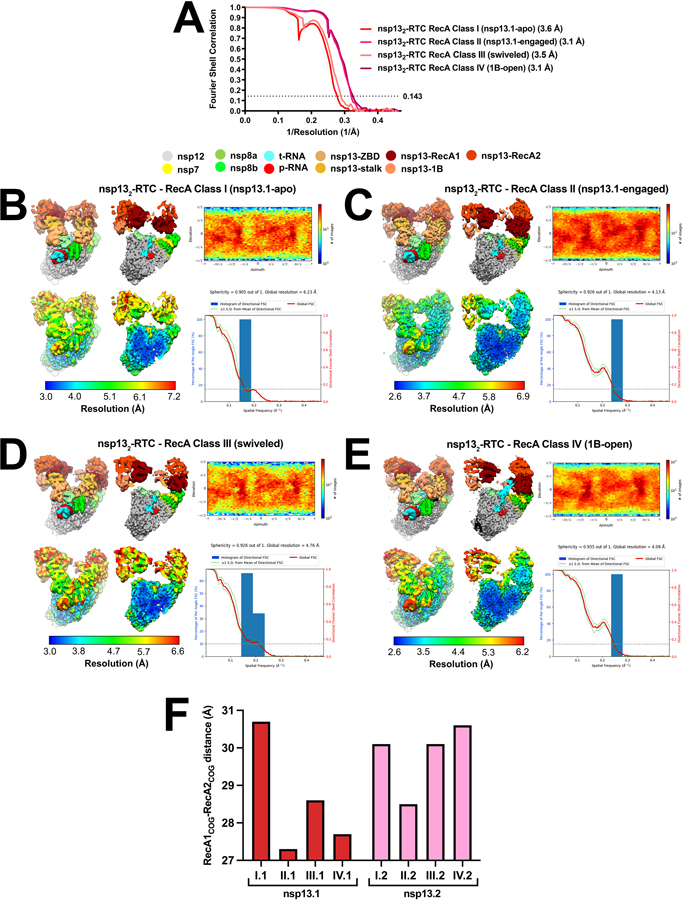
Despite the excellent map quality for most of the RTC (Extended Data Figs. 1 and 4), features of the composite consensus map (map9) suggested substantial heterogeneity in the nsp13 subunits, particularly in the RecA2 and 1B domains (Extended Data Fig. 4). Therefore, we generated a mask surrounding the nsp13T and nsp13F RecA1, RecA2, and 1B domains (of map3; Fig. 1 and Extended Data Fig. 3) and used masked classification with signal subtraction 31 to identify four distinct conformational states (Table 2; Fig. 1, Extended Data Figs. 2, 3, and 6) with significant differences in the dispositions of the nsp13 subunits, particularly nsp13T.
Fig. 1 |. Four conformational states of the nsp132-RTC.
(top) Cryo-EM density (map3, local-resolution filtered) colored according to the code on the left. A mask was constructed surrounding the nsp13T and nsp13F 1B, RecA1, and RecA2 domains (grey mesh). The 315,120 particles were divided into four distinct structures (class I, II, III, and IV) by focused classification inside the mask, followed by further refinement (Extended Data Figs. 2, 6). Class II contained the most particles, and the nsp13T RecA domains were completely closed (Extended Data Fig. 6), entrapping the 5’-t-RNA segment in a groove between the two RecA domains and the 1B domain (Fig. 2). Therefore, class II (nsp13T-engaged) was used as a reference for comparison of the other structures. Each class was characterized by one dominant conformational change: class I) nsp13T-apo, the RecA domains were completely open (Extended Data Fig. 6) and devoid of RNA (Fig. 3), class III) swiveled, the nsp13T protomer as a whole was rotated 38° as shown (Fig. 5), class IV) 1B-open, the nsp13T 1B domain was rotated open by 85° (Fig. 4).
Also see Extended Data Fig. 6 and Supplementary Videos 1 and 2.
Table 2.
Cryo-EM data collection, refinement and validation statistics for the nsp132−RTC conformational states.
| nsp13.1-apo (EMDB-24428) (PDB 7RDZ) | nsp13.1-engaged (EMDB-24427) (PDB 7RDY) | nsp13.1-swiveled (EMDB-24429) (PDB 7RE0) | 1B-open (EMDB-24426) (PDB 7RDX) | |
|---|---|---|---|---|
|
| ||||
| Data collection and processing | ||||
| Magnification | 81,000 | |||
| Voltage (kV) | 300 | |||
| Electron exposure (e–/Å2) | 66 | |||
| Defocus range (μm) | −0.8 to −2.5 | |||
| Pixel size (Å) | 1.07 | |||
| Symmetry imposed | C1 | |||
| Initial particle images (no.) | 315,120 | |||
| Final particle images (no.) | 52,403 | 102,615 | 54,830 | 105,272 |
| Map resolution (Å) | 3.6 | 3.1 | 3.5 | 3.1 |
| FSC threshold 0.143 | ||||
| Map resolution range (Å) | 3.0–7.2 | 2.6–6.9 | 3.0–6.6 | 2.8–6.2 |
| Refinement | ||||
| Initial models used (PDB code) | 6XEZ, 6ZSL | 6XEZ, 6ZSL | 6XEZ, 6ZSL | 6XEZ, 6ZSL |
| Model resolution (Å) | 3.6 | 3.1 | 3.5 | 3.1 |
| FSC threshold 0.5 | ||||
| Map sharpening B factor (Å2) | −78.3 | −84.3 | −75.8 | −82.3 |
| Model composition | ||||
| Non-hydrogen atoms | 21,545 | 21,846 | 21,563 | 21,828 |
| Protein residues | 2,553 | 2,553 | 2,553 | 2,553 |
| Nucleic acid residues (RNA) | 71 | 78 | 71 | 80 |
| Ligands | 13 | 19 | 16 | 19 |
| B factors (Å2) | ||||
| Protein | 173.27 | 99.83 | 151.00 | 89.82 |
| Nucleic acids | 205.08 | 144.22 | 158.63 | 157.87 |
| Ligand | 133.84 | 97.16 | 200.51 | 86.54 |
| R.m.s. deviations | ||||
| Bond lengths (Å) | 0.004 | 0.015 | 0.014 | 0.004 |
| Bond angles (°) | 0.621 | 0.967 | 1.127 | 0.613 |
| Validation | ||||
| MolProbity score | 1.70 | 2.68 | 2.60 | 1.82 |
| Clashscore | 6.09 | 8.05 | 12.57 | 6.30 |
| Poor rotamers (%) | 0.00 | 10.18 | 9.10 | 0.00 |
| Ramachandran plot | ||||
| Favored (%) | 94.76 | 92.40 | 93.01 | 93.66 |
| Allowed (%) | 5.24 | 7.60 | 6.80 | 6.30 |
| Disallowed (%) | 0 | 0 | 0.20 | 0.04 |
The class II structure (Fig. 1 and Extended Data Fig. 6) contains the most particles and the nsp13 subunits are best resolved in this map (map12; Fig. 1, Extended Data Figs. 3 and 6). Compared to the other structures, the nsp13T RecA domains of class II (map12) are closed onto each other more than the other structures (Extended Data Fig. 6) and are thereby engaged most tightly with the RNA (see below). We call this the ‘nsp13T-engaged’ structure and use it as a reference to give a general overview of the conformational changes in the other classes.
While each of the classes shows significant changes in both the disposition of each nsp13 subunit as a whole as well as intramolecular domain motions within each nsp13 subunit, each structural class can be characterized by one dominant conformational change in nsp13T (compared to the nsp13T-engaged structure used as a reference):
In class I, the nsp13T RecA2 domain is rotated open by 21° with respect to RecA1. Concomitantly, the RNA binding site is empty while occupancy of the nsp13T nucleotide-binding site is ambiguous. We therefore call this the ‘nsp13T-apo’ structure (Fig. 1).
In class III, the nsp13T subunit swivels as a whole by 38° away from nsp13F. We call this the ‘nsp13T-swiveled’ structure (Fig. 1).
In class IV, the nsp13T domain 1B is rotated 85° away from the nsp13T RNA binding channel, creating the ‘1B-open’ structure (Fig. 1).
The nsp13T-engaged conformation grasps the downstream RNA t-strand.
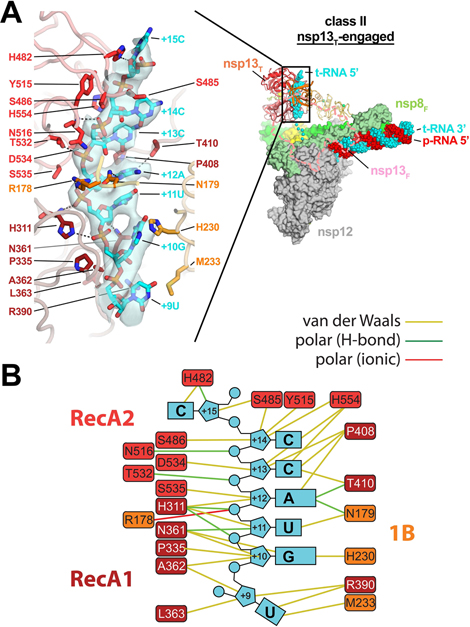
In the nsp13T-engaged structure, the distance between the center-of-gravity of the two nsp13T RecA domains, 27.3 Å, is the shortest of the eight nsp13 conformations (Extended Data Fig. 6). The RecA domains are thus ‘closed’ and grasp the downstream t-RNA single-stranded 5’-segment emerging from the RdRp active site, giving rise to well-resolved cryo-EM density for the RNA passing through the helicase (Fig. 2A). The RNA is corralled in a tunnel between the two RecA domains and the 1B domain, which is also in a closed conformation (Figs. 1 and 2A). The pattern of purine and pyrimidines in the cryo-EM density is clearly discernable, allowing the unique sequence register of the RNA engaged with the nsp13T helicase to be determined (Fig. 2A).
Fig. 2 |. In class II (nsp13T-engaged), the nsp13T RecA domains and 1B domain clamp onto the 5’-single-stranded t-RNA.
A. (right) Overall view of the nsp13T-engaged structure. Proteins are shown as molecular surfaces except nsp13T is shown as a backbone ribbon, and nsp13F is removed and shown only as a dashed outlline. The RNA is shown as atomic spheres. The boxed region is magnified on the left.
(left) Nsp13T is shown as a backbone worm but with side chains that interact with the t-RNA shown. Cryo-EM density for the downstream 5’-t-RNA segment is shown (transparent blue surface) with the t-RNA model superimposed. The pattern of purines/pyrimidines in the RNA density was clear and unique, allowing the identification of the sequence register for the nsp13T-bound RNA.
B. Schematic illustrating nsp13T-RNA interactions.
Also see Supplementary Video 2.
The ordered RNA segment is 7 nucleotides in length (+9 to +15; Fig. 2), with the five central nucleotides (+10 to +14) completely enclosed within the helicase. The RNA phosphate backbone generally faces the nsp13T RecA domains, and the mostly stacked bases face the 1B domain (Fig. 2). As might be expected, the helicase establishes extensive interactions with the RNA phosphate backbone, including several polar interactions. Interactions with the RNA bases are mostly van der Waals interactions and not expected to be base-specific (Fig. 2).
The nsp13T-apo state.
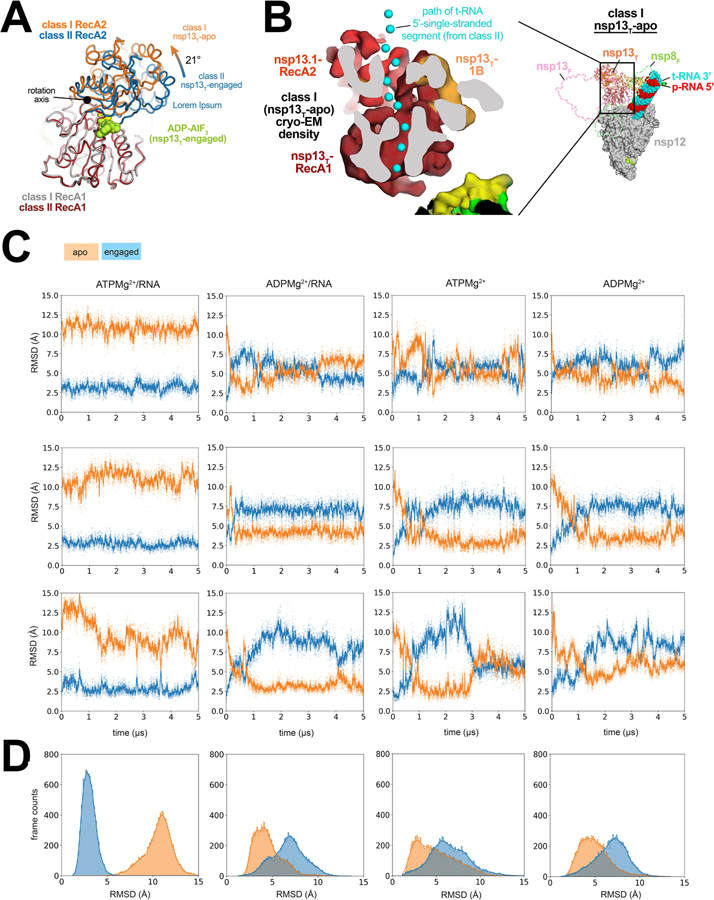
Comparison of the nsp13T-apo and nsp13T-engaged structures revealed a striking change in the conformation of the RecA-like ATPase domains of nsp13T. Superimposition of the α-carbons of nsp13T RecA1 (residues 235–439) or RecA2 (residues 440–596) alone yielded root-mean-square-deviations (rmsds) of 0.387 and 0.673 Å, respectively, indicating the structures of the individual domains are very similar between the two states. However, superimposition via the α-carbons of only RecA1 gave an rmsd of 7.05 Å for the RecA2 α-carbons, indicating a substantial change in the relative disposition of the two domains. The movement of RecA2 with respect to RecA1 corresponds to an ~21° rotation about the axis shown in Fig. 3A (also see Supplementary Video 1), corresponding to an opening of the RecA domains; the nsp13T RecA domains of the nsp13T-apo state are the furthest open of any of the eight nsp13 protomer structures (Extended Data Fig. 6).
Fig. 3 |. In nsp13T-apo, the RecA domains are open and devoid of RNA density.
A. The RecA1 domains of class I (nsp13T-apo) and class II (nsp13T-engaged) were superimposed (rmsd of 0.387 Å over 205 α-carbons), revealing that the RecA2 domain of nsp13T-apo was rotated open by 21° about the rotation axis shown. The ADP-AlF3-Mg2+ from the nsp13T-engaged structure is shown as limon atomic spheres.
B. (right) Overall view of the nsp13T-apo structure. Proteins are shown as molecular surfaces except nsp13T, which is shown as a backbone ribbon, and nsp13F, which is removed and shown only as a dashed outline. The RNA is shown as atomic spheres. The boxed region is magnified on the left.
(left) Cryo-EM density of nsp13T-apo reveals that the RNA path is empty (the RNA path from the nsp13T-engaged structure is denoted by cyan spheres).
C. Three independent simulations of nsp13T bound to ATPMg2+/RNA, ADPMg2+/RNA, ATP Mg2+, and ADPMg2+. Values of rmsd plotted represent the heavy-atom rmsd of the RecA2 lobe (after alignment on the RecA1 lobe) with respect to nsp13T-engaged (blue) and nsp13T-apo (orange) cryo-EM structures.
D. The rmsd histograms represent aggregate values across all three replicates shown in (C).
Also see Supplementary Video 1.
The consensus nsp132-RTC cryo-EM map (map3; Extended Data Figs. 2 and 3) contains low-resolution density indicating that the downstream single-stranded 5’-segment of the t-RNA occupies the nsp13T RNA binding channel (Extended Data Fig. 1). Moreover, the t-RNA 5’-segment occupying the nsp13T RNA binding channel of the nsp13T-engaged state is well resolved (Fig. 2). By contrast, the nsp13T-apo cryo-EM density shows that the nsp13T RNA-binding path is empty (Fig. 3B). The nsp13T-apo cryo-EM density also does not support occupancy of ADP-AlF3-Mg2+ in the nucleotide-binding site of nsp13T, although the low resolution of the map in this region makes this conclusion tentative.
Spontaneous transition of nsp13T between the engaged and apo conformations.
To characterize the RecA1-RecA2 interdomain movement and how a bound substrate may influence that movement, we performed MD simulations of free nsp13T (i.e., without nsp13F or the RTC) under four different substrate-bound conditions (ATPMg2+/RNA, ADPMg2+/RNA, ATPMg2+ only, and ADPMg2+ only). For each condition, we ran three independent 5-μs simulations, all initiated from the nsp13T-engaged conformation (Figs. 1 and 2).
In simulations of ATPMg2+/RNA-bound nsp13T, the RecA2 domain maintained its general orientation with respect to RecA1 throughout the simulations (Fig. 3C). The average rmsd of RecA2 between the initial nsp13T-engaged cryo-EM structure and the structures from the MD trajectories, aligned on the RecA1, was low (∼2.9 Å; some adjustment of RecA2 from the initial nsp13T-engaged cryo-EM structure position in these simulations was expected, as the cryo-EM structure was determined using ADP-AlF3/RNA in place of ATPMg2+/RNA). Conformations resembling the nsp13T-apo structure (rmsd <3.5 Å) were not observed (Fig. 3C, D).
In simulations of ADPMg2+/RNA-bound nsp13T, RecA2 rotated away from its initial position in the nsp13T-engaged conformation, and nsp13T-apo–like conformations were repeatedly visited throughout the simulations (Figs. 3C, D). The ADPMg2+/RNA-bound nsp13T-apo-like conformations were metastable, and interconverted with the nsp13T-engaged conformations. Spontaneous and reversible conversion between the nsp13T-engaged and nsp13T-apo conformations was also observed in the simulations of ATPMg2+-bound and ADPMg2+-bound nsp13T (Figs. 3C, D). These results suggest that the presence of both the ATPMg2+ and RNA may stabilize the nsp13T-engaged conformation and that the absence of either substrate may destabilize the nsp13T-engaged conformation and facilitate the transition to the nsp13T-apo conformation, consistent with the observations from the cryo-EM analysis.
The nsp13T ‘1B-open’ conformation explains RNA synthesis in the presence of nsp13.
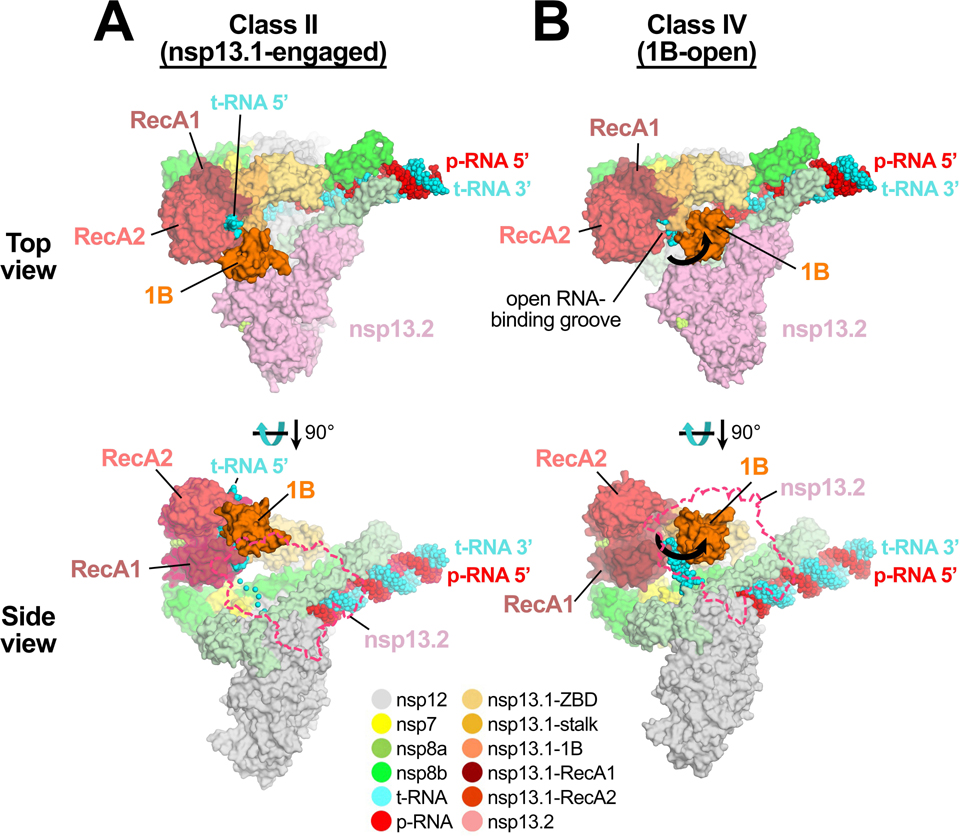
In the nsp13T-engaged state, the downstream single-stranded t-RNA is guided through a deep groove between the RecA1 and RecA2 domains that is completely closed off by the 1B domain (Fig. 4A). Remarkably, in the 1B-open structure, the nsp13T 1B domain rotates 85° about the stalk away from the nsp13T RNA binding channel, creating an open groove rather than a closed tunnel (Fig. 4B). The cryo-EM density allows modeling of the downstream single-stranded t-RNA emerging from the RdRp active site up to the edge of the open groove proximal to the RdRp, but the RNA density disappears there, indicating that the RNA is not engaged within the active site of the helicase (Fig. 4B).
Fig. 4 |. 1B-open structure.
Comparison of nsp13T-engaged (A) and 1B-open (B) structures. Two views are shown, a top view (top) and a side view (bottom). In the top view, the proteins are shown as molecular surfaces and color-coded according to the key at the bottom. In the side view, nsp13F is shown only as a dashed outline. The RNA is shown as atomic spheres. In the 1B-open structure (B), the nsp13T 1B domain is rotated open by 85° (represented by thick black arrows). The 5’-t-RNA emerging from the RdRp active site approaches the nsp13T RNA binding groove but does not enter it.
Also see Supplementary Video 2.
In the 1B-open conformation, the nsp13T 1B domain appears to be trapped open by the presence of nsp13F (Fig. 4B), with the transition from the 1B-open to the 1B-closed conformation blocked by nsp13F. Consistent with this, we analyzed the nsp13 conformational states in the nsp131-RTC (nsp13F absent) by masked classification with signal subtraction around the RecA1, RecA2 and 1B domains of the single nsp13 (Extended Data Fig. 2) but the 1B-open nsp13 conformation was not observed. We propose that the 1B-open conformation of the nsp13T 1B domain is trapped by the presence of nsp13F.
We note that in the (nsp132-RTC)2 dimer (Extended Data Figs. 2–4), the nsp13 protomers corresponding to nsp13T are also in the ‘1B-open’ state, as was observed by Yan et al. 32. Since the dimer only comprises 8% of our particle dataset (Supplementary Table 1) while the nsp132-RTC complex comprises 72% of the particles, we have focused our attention on the latter complex. We observe that the (nsp132-RTC)2 dimer forms in the absence of additional factors such as nsp10–14 20, in contrast to what’s reported in Yan et al. 32.
Yan et al. 32 observed the 1B-open state of nsp13T (labeled nsp13–2 in their nomenclature) in their (dimer) dCap(0)-RTC structure, curiously assigned as a backtracking-competent state. This is at odds with: i) observations that nsp13T in the 1B-open conformation does not engage RNA in its RNA-binding groove [Fig. 4B; also observed by Yan et el. 32] and so would be incompetent for RNA translocation, and ii) the finding that nsp13 stimulated SARS-CoV-2 RTC backtracking 27.
Spontaneous nsp13T 1B-open to 1B-closed transition.
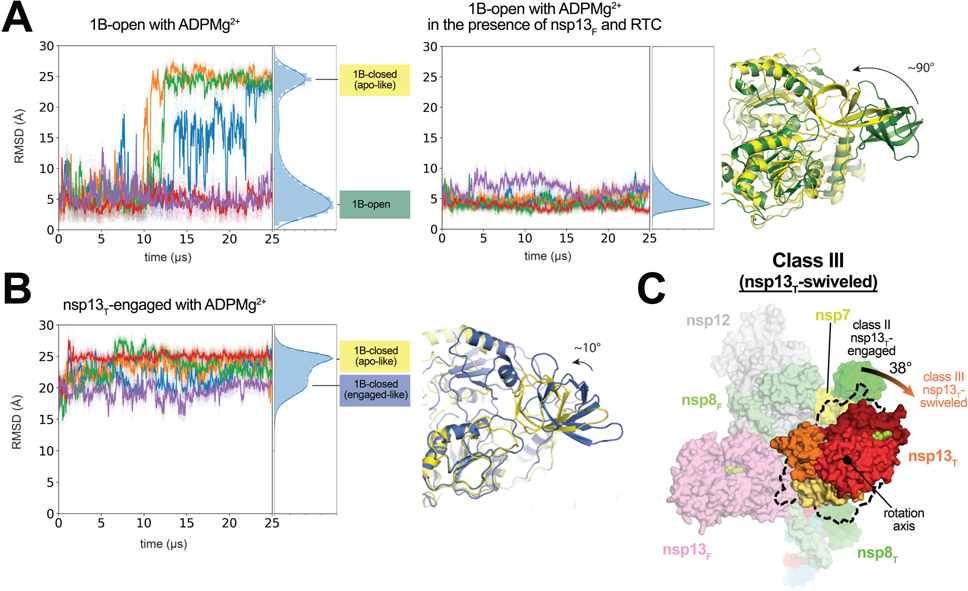
The conformations of the nsp13T 1B domain in the nsp13T-engaged and nsp13T-apo structures are related by a ~10° rotation around the nsp13-stalk, but the 1B domains are closed on the nsp13-RecA domains in both structures. We refer to these collectively as ‘1B-closed’ states (Fig. 1). These conformations have also been observed in crystal structures of isolated nsp13 as well as some other SF1-like helicases 33. The conformation of the 1B domain in the 1B-open cryo-EM structure, in which the domain is rotated ~85° compared to the 1B-closed conformations, was only seen in nsp13T when it was paired with nsp13F in the RTC, suggesting that this conformation may not be stable in isolated nsp13. To test this hypothesis, we performed five independent 25-μs simulations on isolated (free) nsp13 (with ADPMg2+), initiated from the 1B-open conformation (Fig. 1).
In three out of the five simulations, the 1B domain underwent a ~90° rotation from the starting 1B-open conformation around the stalk toward the RNA-binding groove to a 1B-closed conformation (Fig. 5A). These ~90° rotated 1B domain conformations closely resemble the disposition of the 1B domain in the nsp13T-apo structure. The 1B domain rmsd between the simulation-generated structures from the last 2 μs of the three trajectories and the 1B domain in the nsp13T-apo cryo-EM structure (aligned on the RecA1 domain) was, on average, ∼3.6 Å. We also observed that a small portion (<5%) of these 1B-closed structures were more similar to the 1B domain of the nsp13T-engaged conformation (rmsd <3.5 Å). These nsp13T-engaged-like 1B conformations were short-lived, and once visited they quickly transitioned to the nsp13T-apo conformation, presumably because the nsp13T-engaged conformation was captured in the presence of RNA, which was not included in our simulations.
Fig. 5 |. In the nsp13T-swiveled structure, the entire nsp13T promoter is rotated.
A. 10 independent simulations of ADPMg2+-bound nsp13T, starting from the 1B-open cryo-EM structure, in isolation (five simulations, left-hand plot) and as part of the nsp132-RTC complex (five simulations, right-hand plot). Values plotted represent the heavy-atom rmsd of the 1B domain (nsp13 residues 150–228) compared to the 1B domain in the 1B-open cryo-EM structure (aligned on the RecA1 domain). The rmsd histograms on the right of each plot represent aggregate values across all five simulations. Representative structures of the two major conformations from simulations are shown (right, colored according to the histogram labels).
B. Five independent simulations of ADPMg2+-bound nsp13T, starting from the nsp13T-engaged state. Values plotted represent the heavy-atom rmsd of the 1B domain compared to the 1B domain in the 1B-open cryo-EM state (aligned on the RecA1 domain). The rmsd histograms on the far right represent aggregate values across all five simulations. Representative structures of the two major conformations from the rmsd histogram from simulations are shown (right).
C. Front view of the nsp13T-swiveled structure, highlighting nsp13T. The position of the nsp13T promoter in the nsp13T-engaged structure is illustrated by the dashed black outline. The nsp13T protomer of the nsp13T-swiveled structure is rotated by 38° as shown.
See also Extended Data Fig. 7.
We next asked whether or not the 1B domain in a 1B-closed state may spontaneously transition to the 1B-open state. In each of the three simulations in which we observed a transition of the 1B domain from the 1B-open to a 1B-closed conformation, the 1B domain remained in the 1B-closed conformation through the end of the 25-μs simulation; a 1B-closed-to-open transition was not observed. We performed an additional five independent 25-μs simulations of the isolated (free) nsp13T, initiated from the 1B-closed conformation (of the nsp13T-engaged structure). We did not observe any transition events to the 1B-open conformation over the aggregated 125 μs simulation time. Instead, the 1B domain maintained its 1B-closed orientation in the initial structure, with some minor wobbling back and forth between the 1B-closed conformations of the nsp13T-engaged and nsp13T-apo structures (Fig. 5B).
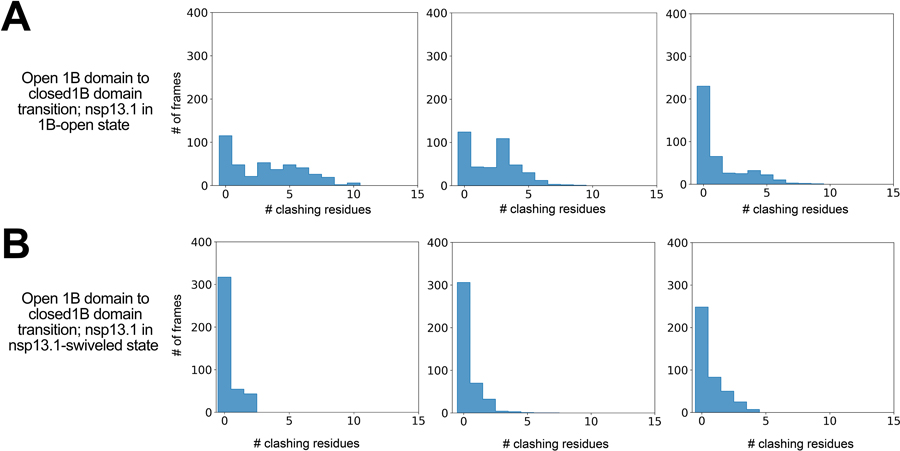
Aligning the nsp13T simulation structures in the 1B-open-to-closed transition pathways with the nsp13T of the 1B-open cryo-EM structure showed that, on average, ~40% (53%, 22%, and 45% in the three simulations) of these 1B domain intermediate conformations clashed with nsp13F, suggesting that the 1B-open-to-closed transition might be blocked by nsp13F (Extended Data Fig. 7). Consistent with this notion, in five independent 25-μs simulations of nsp13T in complex with nsp13F and the RTC (i.e., the nsp132-RTC complex), with nsp13T initiated from the 1B-open conformation, we did not observe any transition events to the 1B-closed conformation over the aggregate 125 μs of simulation time (Fig. 5A). Here we envisage that 1B domain transitions are facilitated by entry into the ‘swiveled’ state. The swiveled structure is characterized by one dominant conformational change; compared to the nsp13T-engaged structure, the nsp13T protomer as a whole swivels with respect to the rest of the RTC by 38°, repositioning nsp13T with respect to nsp13F (Fig. 5C).
There are some clashes between nsp13T and nsp13F when the simulation-generated structures are aligned to the swiveled cryo-EM structure, but to a much lesser extent (9%, 0%, and 2% in the three simulations; Extended Data Fig. 7). This observation is consistent with the notion that the swiveled structure may be an intermediate state that facilitates the transition between the 1B-open and 1B-closed conformations.
In summary, our simulations suggest that the conformation of the 1B domain in the 1B-open structure may only be transiently stable on its own, transitioning spontaneously into the 1B-closed conformations of the nsp13T-apo and nsp13T-engaged structures. Such transitions may be blocked by the presence of nsp13F in the 1B-open nsp132-RTC. We did not observe transitions from the 1B-closed conformations to the 1B-open conformation, and we speculate that in the presence of RNA in the nsp13T RNA-binding groove (Fig. 2), nsp13T may be further stabilized in the closed 1B domain conformation.
Nsp13 conformations in nsp132-backtracked complexes.
In the nsp13T-engaged state (Fig. 1), the RdRp translocates in the 3’->5’ direction on the t-RNA while nsp13T grasps the single-stranded t-RNA ahead of the RdRp (Fig. 2) and translocates in the 5’->3’ direction (Extended Data Fig. 1). We proposed that events at the RdRp active site that would delay or stall p-RNA chain elongation (such as misincorporation or incorporation of nucleotide analogs) could allow the nsp13T translocation activity to push the RdRp backward on the t-RNA 20. In this process, termed backtracking, the complex moves in the 5’->3’ direction on the t-RNA accompanied by reverse-threading of the p-RNA through the complex, generating a single-stranded p-RNA 3’-fragment. In support of this hypothesis, structural and functional studies showed that the SARS-CoV-2 RdRp can backtrack, that the resulting single-stranded p-RNA 3’-fragment extrudes out the RdRp NTP-entry tunnel, and that backtracking is stimulated by nsp13 27.
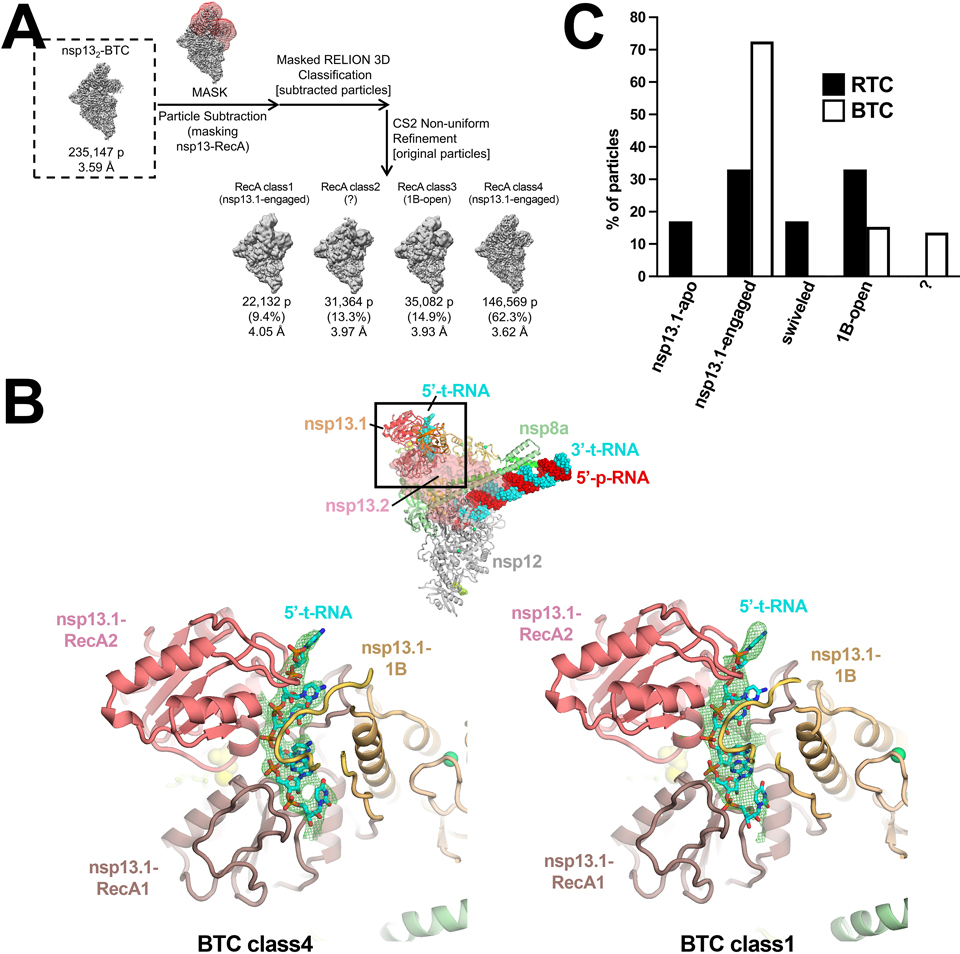
To compare the conformational states of the nsp13 protomers in the nsp132-BTCs (backtracked complexes) with the nsp132-RTCs, we used the same masked classification with signal subtraction protocol (Extended Data Fig. 3) to classify the nsp132-BTC particles into four conformational states (Extended Data Fig. 8). Structural models were built and rigid-body refined into the cryo-EM densities for each class except for nsp132-BTC-class2 (13% of the particles), which had very poor cryo-EM density for nsp13T. To compare these structural models with the nsp132-RTC structures, we aligned the models for each nsp132-BTC model with the nsp13T-engaged state by superimposing α-carbons of nsp12, yielding rmsds < 0.213 Å. We then calculated rmsds for α-carbons of nsp13T and nsp13F. Both nsp132-BTC-class1 and nsp132-BTC-class4 aligned well with the nsp13T-engaged nsp132-RTC state (Supplementary Table 2) and both also had strong density for the downstream t-RNA engaged with nsp13T (Extended Data Fig. 8). Therefore, we classify both of these structures as nsp13T-engaged-BTCs. The nsp132-BTC-class3 structure had an open 1B domain of nsp13T and clearly aligned with the 1B-open-RTC structure (Extended Data Table 2). Thus, in contrast to the nsp132-RTC structures, which were equally divided between the nsp13T-engaged and 1B-open states (33% each), the nsp132-BTC structures were heavily skewed towards the nsp13T-engaged state (72%) vs. the 1B-open state (15%; Extended Data Fig. 8).
Discussion
In this work, we observed distinct conformational states of the nsp13 protomers within the SARS-CoV-2 nsp132-RTC, providing functional insights into nsp13 and its complex with the RTC (see Supplementary Video 2). Like other helicases, nsp13 is a molecular motor that translocates along single-stranded nucleic acid, unwinding structural elements in its path 16. This process is driven by conformational changes within nsp13 resulting from NTP hydrolysis.
The conformational transition from the nsp13T-engaged to the nsp13T-apo structures, observed both by our cryo-EM (Fig. 3A) and MD (Figs. 3C, D) analyses, corresponds to an ~21° rotation of the RecA2 domain with respect to RecA1, opening the gap between the two domains (Fig. 3A; Supplementary Video 1). The nsp13T-engaged structure is engaged with the substrate RNA and is trapped in an ‘on-pathway’ conformation of the nucleotide hydrolysis cycle by the non-hydrolyzable ATP analog ADP-AlF3. While the nsp13T-apo structure, being devoid of RNA, is not ‘on-pathway’ per se, the 21° opening of the RecA2 domain from the nsp13T-engaged to nsp13T-apo conformations matches the disposition of the RecA2 domains in other SF1 helicases, such as human Upf1, a structural homolog of nsp13 13,24. The disposition of the RecA domains of Upf1 with ADP-AlF3 and RNA substrate [PDB 2XZO] 34 matches the nsp13T-engaged structure. On the other hand, the RecA domains in a structure of Upf1 with ADP (so likely on-pathway) are opened by a 24° rotation about the same axis as the 21° opening of the nsp13T-apo RecA domains [PDB 2GK6] 35. We thus infer that the nsp13T-apo conformation reports on an on-pathway conformation of the RecA domains, such as in the ADP-Mg2+/RNA-bound state of the translocation cycle (Figs. 3C, D). Due to the opening of the nsp13T RecA domains, the center-of-gravity of RecA2 shifts roughly parallel with the RNA backbone by 3.4 Å, corresponding to the rise between stacked RNA bases. This observation is suggestive of an ‘inchworm’ model for translocation (Supplementary Video 1), as proposed for related SF1 helicase translocation on single-stranded nucleic acids 14,17,36–40.
Prior structural analysis of the nsp132-RTC identified that the nsp13T helicase and the RdRp translocate on the t-RNA with opposing polarities 20. In circumstances where RdRp elongation of the p-RNA is hindered (such as in the event of a misincorporation at the p-RNA 3’-end), nsp13T translocation activity could backtrack the RdRp 20, as shown by follow-up structural and biochemical analyses 27. The opposing polarities of the RdRp and nsp13 translocation activities (Extended Data Fig. 1) presented a conundrum that was not addressed by these previous studies; how is it possible for the RdRp to rapidly and efficiently synthesize RNA if it is constantly being opposed by nsp13? Moreover, the predominant complex present in the nsp13-RTC samples is the nsp132-RTC complex (Supplementary Table 1), but only nsp13T was seen to engage with the t-RNA; what is the role of nsp13F, the second copy of nsp13 in the nsp132-RTC? The work herein suggests answers to both questions.
Maximum likelihood classification approaches revealed four distinct conformations of the nsp13 protomers in the nsp132-RTC (Figs. 1, 6; Supplementary Videos 1 and 2). The nsp13T-engaged state resolves nsp13T clamped onto the single-stranded downstream t-RNA, providing an atomic view of nsp13 engaged with the single-stranded RNA (Fig. 2). The single-stranded t-RNA threads through a tunnel formed by a deep groove between the RecA1 and RecA2 domains and further enclosed by the 1B domain (Fig. 4A).
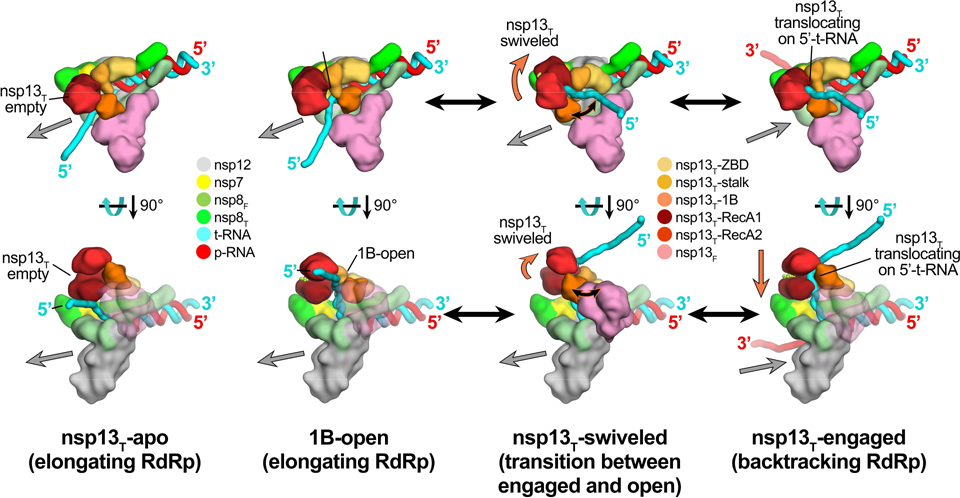
Fig. 6. Schematic model for RTC elongation (1B-open) vs. backtracking (nsp13T-engaged) states.
Top views (top row) and side views (bottom row) of each structural class.
Nsp13T-apo (17%): The nsp13T RecA domains are open, consistent with the absence of nucleotide. Nsp13T is therefore not engaged with the downstream 5’-t-RNA and the RdRp can freely translocate on the t-RNA with concurrent elongation of the p-RNA (gray arrow pointing downstream).
1B-open (33%): The nsp13T 1B domain is rotated open and sterically trapped by the presence of nsp13F. The nsp13T is therefore unable to engage with the downstream 5’-t-RNA and is inactive. The RdRp is able to elongate freely in the downstream direction.
Nsp13T-swiveled (17%): The rotation of the nsp13T protomer away from nsp13F provides space for the nsp13T 1B domain to open and/or close. We therefore propose that nsp13T-swiveled represents a transition state between the 1B-open (elongating) and nsp13T-engaged (backtracking) states.
Nsp13T-engaged (33%): The nsp13T 1B and RecA domains are clamped onto the downstream 5’-t-RNA. In this state, nsp13T can translocate on the t-RNA in the 5’−3’ direction (shown by the orange arrow). This counteracts RdRp elongation and causes backtracking (backward motion of the RdRp on the RNA, shown by the gray arrow pointing upstream).
Also see Extended Data Fig. 8 and Supplementary Videos 1 and 2.
By contrast, the 1B-open state shows nsp13T adopting a conformation in which the 1B domain is rotated open ~85° about the stalk domain, leaving an open RNA binding groove (Fig. 4B). In this state, the single-stranded downstream t-RNA does not engage with the helicase. Thus, this represents an inactive state of the helicase that would be unable to translocate on the RNA.
Our structural analysis combined with MD simulations confirmed that the conformation of the nsp13T 1B domain in the 1B-open structure is not stable on its own but is sterically trapped by the presence of nsp13F, which blocks the conformational change required for 1B domain closure (Fig. 5A). These results suggest that the 1B-open state represents a rapidly elongating state of the nsp132-RTC, where the downstream single-stranded template RNA feeds into the RdRp active site without engaging with nsp13T. Nsp13F may trap the 1B-open (inactive) state of nsp13T, allowing RdRp elongation to proceed without opposition from the nsp13T helicase (Fig. 6). Finally, swiveling of nsp13T in the swiveled state allows space for the 1B-open to 1B-closed transition (Fig. 5C), suggesting that the swiveled state represents a transition state between the open and closed states of the 1B domain (Fig. 6). We note that the presence of nsp13F in the nsp13T-engaged state would also block the 1B-closed to 1B-open transition, suggesting how nsp13F can enhance the helicase activity of nsp13T 21
Thus, our results suggest a mechanism for the nsp132-RTC to turn backtracking on and off; switching between rapid RNA synthesis (1B-open state; elongating RdRp; Fig. 6) and backtracking (nsp13T-engaged, backtracking RdRp; Fig. 6). In our analysis of the conformational states of the nsp132-RTC, the particles were equally divided between the nsp13T-engaged (backtracking on) and 1B-open (backtracking off) states (Extended Data Figs. 3, 8). Remarkably, an identical analysis of the backtracked nsp132-BTC 27 revealed a strikingly different distribution of particles in which the nsp13T-engaged (backtracking on) state was heavily favored (Extended Data Fig. 8). This raises the possibility that the conformational switch that turns backtracking on and off is allosterically controlled.
In MD simulations exploring the dynamics of the p-RNA 3’-nucleotide of a pre-translocated RTC, a mismatched p-RNA 3’-nucleotide frayed from the t-RNA towards and into the NTP-entry tunnel (which also serves as the backtracking tunnel; Supplementary Video 1), while a p-RNA 3’-nucleotide engaged in a Watson-Crick base pair with the t-RNA did not 27. We thus suggest that misincorporation by the RdRp leads to fraying of the p-RNA 3’-nucleotide into the NTP-entry tunnel, which may allosterically signal the rapidly elongating 1B-open state to switch to the backtracking nsp13T-engaged state (via the nsp13T-swiveled state; Fig. 6). This facilitates a possible proofreading mechanism since backtracking would extrude the mismatched p-RNA 3’-nucleotide out of the NTP-entry tunnel (Fig. 6) 27, allowing the nsp10/nsp14 3’-exonuclease proofreading activity to access and degrade the mismatched p-RNA 3’-nucleotide 41–43. The nsp14-mediated proofreading activity is crucial for the virus to avoid mutation catastrophe while replicating its ~30 kb genome 42, and is also an important determinant of SARS-CoV-2 susceptibility to many anti-viral nucleotide analogs 44.
METHODS
No statistical methods were used to predetermine sample size. The experiments were not randomized, and the investigators were not blinded to allocation during experiments and outcome assessment.
Protein expression and purification.
SARS-CoV-2 nsp12 was expressed and purified as described 20. Briefly, a pRSFDuet-1 plasmid containing His6-SUMO SARS-CoV-2 nsp12 (Addgene #159107) was transformed into E. coli BL21-CodonPlus cells (Agilent). Cells were grown and protein expression was induced by the addition of isopropyl β-d-1-thiogalactopyranoside (IPTG). Cells were collected and lysed in a French press (Avestin). The lysate was cleared by centrifugation and purified on a HiTrap Heparin HP column (Cytiva). The fractions containing nsp12 were loaded onto a HisTrap HP column (Cytiva) for further purification. Eluted nsp12 was dialyzed, cleaved with His6-Ulp1 SUMO protease, and passed through a HisTrap HP column to remove the SUMO protease. Flow-through was collected, concentrated by centrifugal filtration (Amicon), and loaded on a Superdex 200 Hiload 16/600 (Cytiva). Glycerol was added to the purified nsp12, aliquoted, flash-frozen with liquid N2, and stored at −80°C.
SARS-CoV-2 nsp7/8 was expressed and purified as described 20. Briefly, the pCDFDuet-1 plasmid containing His6 SARS-CoV-2 nsp7/8 (Addgene #159092) was transformed into E. coli BL21 (DE3). Cells were grown and protein expression was induced by the addition of IPTG. Cells were collected and lysed in a French press (Avestin). The lysate was cleared by centrifugation and purified on a HisTrap HP column (Cytiva). Eluted nsp7/8 was dialyzed, cleaved with His6-Prescission Protease to cleave His6 tag, and then passed through a HisTrap HP column to remove the protease (Cytiva). Flow-through was collected, concentrated by centrifugal filtration (Amicon), and loaded onto a Superdex 75 Hiload 16/600 (Cytiva). Glycerol was added to the purified nsp7/8, aliquoted, flash-frozen with liquid N2, and stored at −80°C.
SARS-CoV-2 nsp13 was expressed and purified as described 20. Briefly, the pet28 plasmid containing His6 SARS-CoV-2 nsp13 (Addgene #159390) was transformed into E. coli Rosetta (DE3) (Novagen). Cells were grown and protein expression was induced by the addition of IPTG. Cells were collected and lysed in a French press (Avestin). The lysate was cleared by centrifugation and purified on a HisTrap HP column (Cytiva). Eluted nsp13 was dialyzed, cleaved with His6-Prescission Protease, and then passed through a HisTrap HP column to remove protease (Cytiva). Flow-through was collected, concentrated by centrifugal filtration (Amicon), and loaded onto a Superdex 200 Hiload 16/600 (Cytiva). Glycerol was added to the purified nsp13, aliquoted, flash-frozen with liquid N2, and stored at −80°C.
Preparation of SARS-CoV-2 nsp13-replication/transcription complex (RTC) for Cryo-EM.
Cryo-EM samples of SARS-CoV-2 nsp13-RTC were prepared as described 20. Briefly, purified nsp12 and nsp7/8 were concentrated, mixed in a 1:3 molar ratio, and incubated for 20 min at 22°C. Annealed RNA scaffold (Horizon Discovery, Ltd.) was added to the nsp7/8/12 mixture and incubated for 15 min at 22°C. Sample was buffer exchanged into cryo-EM buffer [20 mM HEPES pH 8.0, 150 mM K-Acetate,10 mM MgCl2, 2 mM DTT] and further incubated for 20 min at 30°C. The sample was purified over a Superose 6 Increase 10/300 GL column (Cyriva) in cryo-EM buffer. The peak corresponding to nsp7/8/12/RNA complex was pooled and concentrated by centrifugal filtration (Amicon). Purified nsp13 was concentrated by centrifugal filtration (Amicon) and buffer exchanged into cryo-EM buffer. Buffer exchanged nsp13 was mixed with ADP (1 mM final) and AlF3 (1 mM final) and then added to nsp7/8/12/RNA at a molar ratio of 1:1. Complex was then incubated for 5 min at 30°C.
Cryo-EM grid preparation.
Prior to grid freezing, 3-([3-cholamidopropyl]dimethylammonio)-2-hydroxy-1-propanesulfonate (CHAPSO, Anatrace) was added to the sample (8 mM final), resulting in a final complex concentration of 8 μM. The final buffer condition for the cryo-EM sample was 20 mM HEPES pH 8.0, 150 mM K-Acetate,10 mM MgCl2, 2 mM DTT, 1 mM ADP, 1 mM AlF3, 8 mM CHAPSO. C-flat holey carbon grids (CF-1.2/1.3–4Au, EMS) were glow-discharged for 20 s prior to the application of 3.5 μL of sample. Using a Vitrobot Mark IV (Thermo Fisher Scientific), grids were blotted and plunge-froze into liquid ethane with 90% chamber humidity at 4°C.
Cryo-EM data acquisition and processing.
Structural biology software was accessed through the SBGrid consortium 45. Grids were imaged using a 300 kV Titan Krios (Thermo Fisher Scientific) equipped with a GIF BioQuantum and K3 camera (Gatan). Images were recorded with Leginon 46 with a pixel size of 1.07 Å/px (micrograph dimension of 5760 × 4092 px) over a defocus range of −0.8 μm to −2.5 μm with a 20 eV slit. Movies were recorded in “counting mode” (native K3 camera binning 2) with ∼30 e-/px/s in dose-fractionation mode with subframes of 50 ms over a 2.5 s exposure (50 frames) to give a total dose of ∼66 e-/Å2. Dose-fractionated movies were gain-normalized, drift-corrected, summed, and dose-weighted using MotionCor2 47. The contrast transfer function (CTF) was estimated for each summed image using the Patch CTF module in cryoSPARC v2.15.0 48. Particles were picked and extracted from the dose-weighted images with box size of 256 px using cryoSPARC Blob Picker and Particle Extraction. The entire dataset consisted of 17,806 motion-corrected images with 3,750,107 particles. Particles were sorted using two rounds of cryoSPARC 2D classification (N=100, where N equals the number of classes), resulting in 661,105 curated particles that were re-extracted with a boxsize of 320 px. An initial model was generated using cryoSPARC Ab initio Reconstruction (N=3) on a subset of the particles. Particles were further curated using this initial model as a 3D template for cryoSPARC Heterogeneous Refinement (N=3), resulting in 451,760 particles (green map, Fig. S2). Curated particles were further classified using cryoSPARC Heterogeneous Refinement (N=3). Each of the resulting 3D classes were further processed with cryoSPARC Ab initio Reconstruction (N=3), generating three distinct models that could be used to sort particles [Ref 1: nsp131-RTC, Ref 2: nsp132-RTC, Ref 3: (nsp132-RTC)2]. Using Ref 1–3 as 3D templates for Heterogeneous Refinement (N=6), multi-reference classification was performed on the 451,760 curated particles. Classification revealed three unique classes: nsp131-RTC (class1; 85,206 particles; yellow), nsp132-RTC (class2–4; 315,216 particles; red), and (nsp132-RTC)2 (class5; 35,403 particles; blue). Particles within each class were further processed using RELION 3.1-beta Bayesian Polishing 49. Polished particles were refined using cryoSAPRC Local and Global CTF Refinement in combination with cryoSPARC Non-uniform Refinement 50, resulting in structures with the following particle counts and nominal resolutions: nsp131-RTC (85,187 particles; 3.2 Å), nsp132-RTC (315,120 particles; 2.9 Å), (nsp132-RTC)2 (35,392 particles; 3.3 Å). To facilitate model building of nsp132-RTC, particles from nsp131-RTC and nsp132-RTC were combined in a cryoSPARC Non-uniform Refinement, subtracted (masking the RTC), and further refined with cryoSPARC Local Refinement using a mask encompassing the RTC. The resulting map, deemed RTC (local), had nominal resolution of 2.8 Å. Additionally, particles from the nsp132-RTC were subtracted in different regions (using separate masks for nsp12-NiRAN, nsp13T, and nsp13F) and the particles from each subtraction were further refined with masked cryoSPARC Local Refinement. The resulting maps had the following nominal resolutions: nsp13T(local): 3.4 Å, nsp13F(local): 3.3 Å, nsp12-NiRAN(local): 2.7 Å. Locally refined maps were combined into an nsp132-RTC composite map using PHENIX ‘Combine Focused Maps’ 51,52, with resulting nominal resolution of 2.8 Å. The nsp13-RecA domains in particles from the nsp131-RTC and nsp132-RTC classes were sorted using particle subtraction (masking around the RecA domains, shown as red mesh in Fig. S2), followed by masked RELION 3D classification. Classification of RecA domains in the nsp131-RTC particles (pale yellow) did not reveal discrete conformational heterogeneity in the RecA domains. However, classification of RecA domains in the nsp132-RTC particles (light red) revealed unique conformations of the RecA domains with the following particle counts and nominal resolutions: RecA classI (52,403 particles; 3.5 Å), RecA class II (102,615 particles; 3.1 Å), RecA class III (54,830 particles; 3.5 Å), RecA class IV (105,272 particles; 3.1 Å). Local resolution calculations were generated using blocres and blocfilt from the Bsoft package 30.
Model building and refinement.
For an initial model of the nsp132-RTC, the initial RTC model was derived from PDB 6XEZ 20 and the initial nsp13 model from PDB 6ZSL 33. The models were manually fit into the cryo-EM density maps using Chimera 53 and rigid-body and real-space refined using Phenix real-space-refine 51,52. For real-space refinement, rigid body refinement was followed by all-atom and B-factor refinement with Ramachandran and secondary structure restraints. Models were inspected and modified in Coot 54.
Molecular dynamics simulations.
General simulation setup and parameterization.
Proteins, RNAs, and ions were parameterized with the DES-Amber SF1.0 force field 55,56. ATP and ADP were parameterized using the DES-Amber nucleobase, sugar, and phosphate parameters (force field files are available upon request). The systems were solvated with water parameterized with the TIP4P-D water model 57 and neutralized with a 150 mM NaCl buffer. The systems of isolated nsp13 each contained ~160,000 atoms in a 110 × 110 × 110 Å cubic box, and the systems of the nsp132-RTC complex each contained ~887,000 atoms in a 190 × 190 × 190 Å cubic box.
Systems were first equilibrated on GPU Desmond using a mixed NVT/NPT schedule 58, followed by a 1 μs relaxation simulation on Anton, a special-purpose machine for molecular dynamics simulations 59. All production simulations were performed on Anton and initiated from the last frame of the relaxation simulation. Production simulations were performed in the NPT ensemble 60 at 310 K using the Martyna-Tobias-Klein barostat 61. The simulation time step was 2.5 fs, and a modified r-RESPA integrator 62 was used in which long-range electrostatic interactions were evaluated every three time steps. Electrostatic forces were calculated using the u-series method 63. A 9-Å cutoff was applied for the van der Waals calculations.
System preparation.
The initial conformations of Class II nsp13T bound to the various substrates (ATPMg2+/RNA, ADPMg2+/RNA, ATPMg2+, and ADPMg2+) were prepared based on the cryo-EM structure of the Class II nsp132-BTC5. The initial conformation of the Class IV, 1B-open nsp13T structure was prepared from the cryo-EM Class IV nsp132-BTC5 structure. AlF3 was removed from the active site. Missing loops and termini in proteins were capped with ACE/NME capping groups. In simulations with ATP at the active site, ATP was manually placed using ADP in the cryo-EM structure as the reference. The systems were prepared for simulation using the Protein Preparation Wizard in Schrödinger Maestro (Schrödinger Release 2020–4: Maestro, Schrödinger, LLC, New York, NY, 2020).
Simulation analysis.
The average rmsd was calculated for the RecA2 domain (residues 450–690) and 1B domain (residues 145–200) of nsp13T between the cryo-EM structures and instantaneous structures from the trajectories, aligned on the RecA1 lobe (residues 240–440). Simulation structures shown in figures were rendered using PyMol (The PyMOL Molecular Graphics System, Version 2.0 Schrödinger, LLC).
Quantification and statistical analysis.
The local resolution of the cryo-EM maps (Figs. S4 and S6) was estimated using blocres 30 with the following parameters: box size 15, sampling 1.1, and cutoff 0.5. Directional 3DFSCs (Figs. S4 and S6) were calculated using 3DFSC 64. The quantification and statistical analyses for model refinement and validation were generated using MolProbity 65 and PHENIX 52.
Extended Data
Extended Data Fig. 1 |. Consensus cryo-EM structure of an nsp132-RTC.
A. Overall architecture of the consensus nsp132-RTC. Shown is the transparent cryo-EM density (map3, local-resolution filtered) with the nsp132-RTC model superimposed.
B. The consensus nsp132-RTC structure is shown; RNA is shown as atomic spheres, proteins are shown as transparent molecular surfaces. A low-pass filtered (6 Å) cryo-EM difference density reveals the path of the downstream t-RNA 5’-segment through the RNA binding groove of nsp13T (cyan surface).
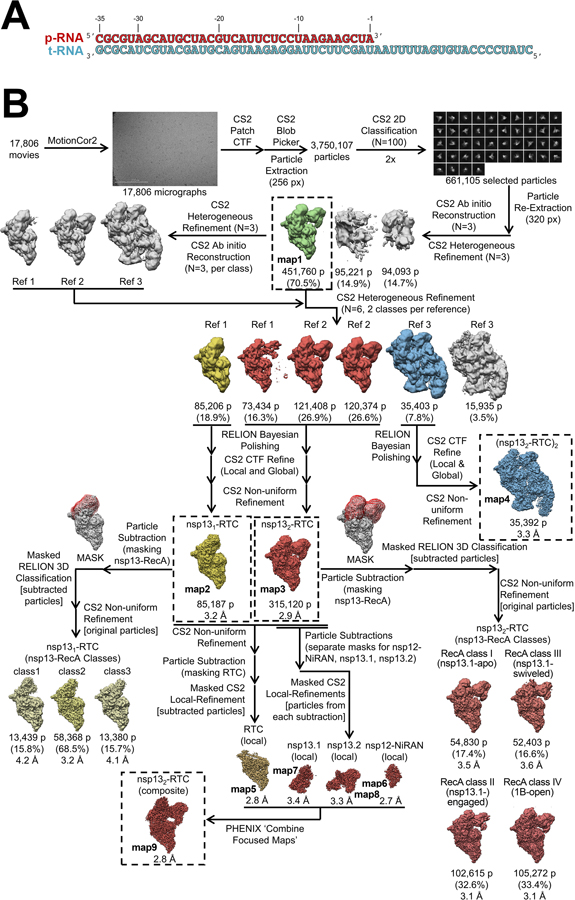
Extended Data Fig. 2 |. RTC-scaffold and cryo-EM processing pipeline for nsp13-RTC.
A. RTC scaffold used for RTC cryo-EM.
B. Cryo-EM processing pipeline.
Extended Data Fig. 3 |.
Processing flowchart overview and map nomenclature.
Extended Data Fig. 4 |. Cryo-EM of nsp13-RTC.
A. Gold-standard Fourier-shell correlation (FSC) plot for nsp131-RTC (yellow line), nsp132-RTC (red line), and (nsp132-RTC)2 (blue line) calculated by comparing the independently determined half-maps from cryoSPARC. The dotted line represents the 0.143 FSC cutoff which indicates a nominal resolution of 3.2 Å (nsp132-RTC), 2.9 Å (nsp132-RTC), and 3.3 Å [(nsp132-RTC)2].
B - D. The cryo-EM maps filtered by local resolution 3 are shown. The view on the right is a cross-section.
(top) Colored by subunit (key above).
(bottom) Colored by local resolution (key on the bottom).
B. Nsp131-RTC (map2).
C. Nsp132-RTC (map3).
D. (nsp132-RTC)2 (map4).
E - G. Directional 3D Fourier shell correlation calculated by 3DFSC (top) 4 and particle orientation distribution calculated by cryoSPARC (bottom).
E. Nsp131-RTC.
F. Nsp132-RTC.
G. (nsp132-RTC)2.
H. Gold-standard FSC plots for local-refined maps (dashed lines) and nsp132-RTC composite map (map9) (solid line).
I. The nsp132-RTC composite map (map9) filtered by local resolution 3.
(left) Colored by subunit.
(right) Colore by local resolution (key at the bottom).
Extended Data Fig. 5 |. Selected examples of nsp132-RTC composite cryo-EM map (map9).
A. NiRAN-ADP-Mg2+ bound in the RdRp NiRAN domain.
B. AU RNA base pair.
C. CG RNA base pair.
D. ADP-Mg2+-AlF3 bound to nsp13T.
Extended Data Fig. 6 |. Cryo-EM of nsp132-RTC classes.
A. Gold-standard Fourier-shell correlation (FSC) plot for the four nsp132-RTC classes calculated by comparing the independently determined half-maps from cryoSPARC 5. The dotted line represents the 0.143 FSC cutoff.
B - E. (left) The cryo-EM maps filtered by local resolution 3 are shown. The view on the right is a cross-section. In the top row, the maps are colored by subunit according to the key above. In the bottom row, the maps are colored according to the local resolution (color-key indicated in the bar at the bottom).
(top-right) Heat map showing particle orientation distribution, calculated using cryoSPARC 5.
(bottom-right) Directional 3D Fourier shell correlation calculated by 3DFSC (top) 4.
B. nsp13T-apo (map11).
C. nsp13T-engaged (map12).
D. Nsp13T-swiveled (map10).
E. 1B-open (map13).
F. Histogram denoting the distance separating the RecA1 center-of-gravity (RecA1cog) and the RecA2cog for nsp13T (red bars, left) and nsp13F (pink bars, right) for the four nsp132-RTC classes.
Extended Data Fig. 7 |. Nsp13T 1B domain open to closed transition clashes with nsp13F.
The histograms show the number of MD frames in each simulation in which nsp13T clashes with nsp13F during the nsp13T-1B domain open to closed states.
A. Nsp13T in the nsp13T-engaged position.
B. Nsp13T in the nsp13T-swiveled position.
Extended Data Fig. 8 |. Classification pipeline for the nsp132-BTC dataset and comparison of nsp132-RTC and nsp132-BTC class distribution.
A. Focused classification pipeline for nsp132-BTC dataset 6.
B. (top-middle) View of the nsp132-BTC-class4. Proteins are shown as backbone ribbons except nsp13F is shown as a transparent surface. The RNA is shown as spheres. The boxed region is magnified in the views below.
(bottom) Magnified views of the nsp13T RNA binding channel for nsp132-BTC-class4 (left) and nsp132-BTC-class1 (right). The downstream single-stranded t-RNA is shown as sticks. Cryo-EM difference densities for the downstream single-stranded t-RNA are shown (green mesh).
C. Histogram illustrating the nsp132-RTC particle distribution for the nsp132-RTC (black bars) and nsp132-BTC (white bars).
Supplementary Material
Acknowledgments.
We thank M. Ebrahim and L. Urnavicius at The Rockefeller University Evelyn Gruss Lipper Cryo-electron Microscopy Resource Center and H. Kuang at the New York Structural Biology Center (NYSBC) for help with cryo-EM data collection, and R. Landick, T. Appleby, and members of the Darst/Campbell laboratory for helpful discussions, and M. Grasso, P.M.M. Shelton, T. M. Kapoor, P.D.B. Olinares, and B.T. Chait (The Rockefeller University) for helpful discussions and initial sample characterizations and analyses. Some of the work reported here was conducted at the Simons Electron Microscopy Center (SEMC) and the National Resource for Automated Molecular Microscopy (NRAMM) and National Center for CryoEM Access and Training (NCCAT) located at the NYSBC, supported by grants from the NIH National Institute of General Medical Sciences (P41 GM103310), NYSTAR, the Simons Foundation (SF349247), the NIH Common Fund Transformative High Resolution Cryo-Electron Microscopy program (U24 GM129539) and NY State Assembly Majority. This work was supported by the Pels Family Center for Biochemistry and Structural Biology (The Rockefeller University), and NIH grants R01 GM114450 (E.A.C.), R35 GM118130 (S.A.D.), and R01 AI161278 (E.A.C./S.A.D).
Footnotes
Competing interests. The authors declare there are no competing interests.
Data Availability.
All unique/stable reagents generated in this study are available without restriction from one of the Lead Contacts, Seth A. Darst (darst@rockefeller.edu). The cryo-EM density maps and atomic coordinates have been deposited in the EMDataBank and Protein Data Bank as follows: nsp131-RTC (EMD-24431, 7RE2), nsp132-RTC (composite) (EMD-24430, 7RE1), (nsp132-RTC)2 (EMD-24432, 7RE3), nsp132-RTC (nsp13T-apo) (EMD-24428, 7RDZ), nsp132-RTC (nsp13T-engaged) (EMD-24427, 7RDY), nsp132-RTC (nsp13T-swiveled) (EMD-24429, 7RE0), nsp132-RTC (1B-open) (EMD-24426, 7RDX). The MD trajectories described in this work are available at https://www.deshawresearch.com/downloads/download_trajectory_sarscov2.cgi/.
REFERENCES
- 1.Wu F et al. A new coronavirus associated with human respiratory disease in China. Nature 579, 265–269 (2020). [DOI] [PMC free article] [PubMed] [Google Scholar]
- 2.Zhou P et al. A pneumonia outbreak associated with a new coronavirus of probable bat origin. Nature 579, 270–273 (2020). [DOI] [PMC free article] [PubMed] [Google Scholar]
- 3.Subissi L et al. One severe acute respiratory syndrome coronavirus protein complex integrates processive RNA polymerase and exonuclease activities. Proceedings of the National Academy of Sciences of the United States of America 111, E3900–9 (2014). [DOI] [PMC free article] [PubMed] [Google Scholar]
- 4.Kirchdoerfer RN & Ward AB Structure of the SARS-CoV nsp12 polymerase bound to nsp7 and nsp8 co-factors. Nature Communications 10, 2342–9 (2019). [DOI] [PMC free article] [PubMed] [Google Scholar]
- 5.Hillen HS et al. Structure of replicating SARS-CoV-2 polymerase. Nature 1–6 (2020) doi: 10.1038/s41586-020-2368-8. [DOI] [PubMed] [Google Scholar]
- 6.Gordon CJ et al. Remdesivir is a direct-acting antiviral that inhibits RNA-dependent RNA polymerase from severe acute respiratory syndrome coronavirus 2 with high potency. J Biol Chem 295, 6785–6797 (2020). [DOI] [PMC free article] [PubMed] [Google Scholar]
- 7.Tchesnokov EP et al. Template-dependent inhibition of coronavirus RNA-dependent RNA polymerase by remdesivir reveals a second mechanism of action. J Biol Chem 295, 16156–16165 (2020). [DOI] [PMC free article] [PubMed] [Google Scholar]
- 8.Kokic G et al. Mechanism of SARS-CoV-2 polymerase stalling by remdesivir. Nat Commun 12, 279 (2021). [DOI] [PMC free article] [PubMed] [Google Scholar]
- 9.Snijder EJ, Decroly E & Ziebuhr J The Nonstructural Proteins Directing Coronavirus RNA Synthesis and Processing. Adv Virus Res 96, 59–126 (2016). [DOI] [PMC free article] [PubMed] [Google Scholar]
- 10.Dinten L. C. van, Tol H. van, Gorbalenya AE & Snijder EJ The Predicted Metal-Binding Region of the Arterivirus Helicase Protein Is Involved in Subgenomic mRNA Synthesis, Genome Replication, and Virion Biogenesis. J Virol 74, 5213–5223 (2000). [DOI] [PMC free article] [PubMed] [Google Scholar]
- 11.Seybert A, Dinten L. C. van, Snijder EJ & Ziebuhr J Biochemical Characterization of the Equine Arteritis Virus Helicase Suggests a Close Functional Relationship between Arterivirus and Coronavirus Helicases. J Virol 74, 9586–9593 (2000). [DOI] [PMC free article] [PubMed] [Google Scholar]
- 12.Seybert A et al. A Complex Zinc Finger Controls the Enzymatic Activities of Nidovirus Helicases. J Virol 79, 696–704 (2005). [DOI] [PMC free article] [PubMed] [Google Scholar]
- 13.Lehmann KC, Snijder EJ, Posthuma CC & Gorbalenya AE What we know but do not understand about nidovirus helicases. Virus Res 202, 12–32 (2015). [DOI] [PMC free article] [PubMed] [Google Scholar]
- 14.Saikrishnan K, Powell B, Cook NJ, Webb MR & Wigley DB Mechanistic basis of 5’−3’ translocation in SF1B helicases. Cell 137, 849–59 (2009). [DOI] [PubMed] [Google Scholar]
- 15.Adedeji AO et al. Mechanism of Nucleic Acid Unwinding by SARS-CoV Helicase. Plos One 7, e36521 (2012). [DOI] [PMC free article] [PubMed] [Google Scholar]
- 16.Mickolajczyk KJ et al. Force-dependent stimulation of RNA unwinding by SARS-CoV-2 nsp13 helicase. Biophys J (2020) doi: 10.1016/j.bpj.2020.11.2276. [DOI] [PMC free article] [PubMed] [Google Scholar]
- 17.Singleton MR, Dillingham MS & Wigley DB Structure and Mechanism of Helicases and Nucleic Acid Translocases. Annu Rev Biochem 76, 23–50 (2007). [DOI] [PubMed] [Google Scholar]
- 18.Hao W et al. Crystal structure of Middle East respiratory syndrome coronavirus helicase. Plos Pathog 13, e1006474 (2017). [DOI] [PMC free article] [PubMed] [Google Scholar]
- 19.Jia Z et al. Delicate structural coordination of the Severe Acute Respiratory Syndrome coronavirus Nsp13 upon ATP hydrolysis. Nucleic Acids Res 47, 6538–6550 (2019). [DOI] [PMC free article] [PubMed] [Google Scholar]
- 20.Chen J et al. Structural basis for helicase-polymerase coupling in the SARS-CoV-2 replication-transcription complex. Cell 182, 1560–1573.e13 (2020). [DOI] [PMC free article] [PubMed] [Google Scholar]
- 21.Yan L et al. Architecture of a SARS-CoV-2 mini replication and transcription complex. Nat Commun 11, 5874 (2020). [DOI] [PMC free article] [PubMed] [Google Scholar]
- 22.Yan L et al. Cryo-EM Structure of an Extended SARS-CoV-2 Replication and Transcription Complex Reveals an Intermediate State in Cap Synthesis. Cell 184, 184–193.e10 (2021). [DOI] [PMC free article] [PubMed] [Google Scholar]
- 23.Hillen HS Structure and function of SARS-CoV-2 polymerase. Curr Opin Virol 48, 82–90 (2021). [DOI] [PMC free article] [PubMed] [Google Scholar]
- 24.Deng Z et al. Structural basis for the regulatory function of a complex zinc-binding domain in a replicative arterivirus helicase resembling a nonsense-mediated mRNA decay helicase. Nucleic Acids Res 42, 3464–77 (2013). [DOI] [PMC free article] [PubMed] [Google Scholar]
- 25.Tavares R. de C. A., Mahadeshwar G, Wan H, Huston NC & Pyle AM The Global and Local Distribution of RNA Structure throughout the SARS-CoV-2 Genome. J Virol 95, (2021). [DOI] [PMC free article] [PubMed] [Google Scholar]
- 26.Huston NC et al. Comprehensive in vivo secondary structure of the SARS-CoV-2 genome reveals novel regulatory motifs and mechanisms. Mol Cell 81, 584–598.e5 (2021). [DOI] [PMC free article] [PubMed] [Google Scholar]
- 27.Malone B et al. Structural basis for backtracking by the SARS-CoV-2 replication–transcription complex. Proc National Acad Sci 118, e2102516118 (2021). [DOI] [PMC free article] [PubMed] [Google Scholar]
- 28.Seifert M et al. Signatures and mechanisms of efficacious therapeutic ribonucleotides against SARS-CoV-2 revealed by analysis of its replicase using magnetic tweezers. Biorxiv 2020.08.06.240325 (2020) doi: 10.1101/2020.08.06.240325. [DOI] [Google Scholar]
- 29.Scheres SHW RELION: implementation of a Bayesian approach to cryo-EM structure determination. Journal of structural biology 180, 519–530 (2012). [DOI] [PMC free article] [PubMed] [Google Scholar]
- 30.Cardone G, Heymann JB & Steven AC One number does not fit all: mapping local variations in resolution in cryo-EM reconstructions. Journal of structural biology 184, 226–236 (2013). [DOI] [PMC free article] [PubMed] [Google Scholar]
- 31.Bai X, Rajendra E, Yang G, Shi Y & Scheres SHW Sampling the conformational space of the catalytic subunit of human γ-secretase. eLife 4, e11182 (2015). [DOI] [PMC free article] [PubMed] [Google Scholar]
- 32.Yan L et al. Coupling of N7-methyltransferase and 3′−5′ exoribonuclease with SARS-CoV-2 polymerase reveals mechanisms for capping and proofreading. Cell 184, 3474–3485.e11 (2021). [DOI] [PMC free article] [PubMed] [Google Scholar]
- 33.Newman JA et al. Structure, Mechanism and Crystallographic fragment screening of the SARS-CoV-2 NSP13 helicase. Biorxiv 2021.03.15.435326 (2021) doi: 10.1101/2021.03.15.435326. [DOI] [PMC free article] [PubMed] [Google Scholar]
- 34.Chakrabarti S et al. Molecular mechanisms for the RNA-dependent ATPase activity of Upf1 and its regulation by Upf2. Mol Cell 41, 693–703 (2011). [DOI] [PubMed] [Google Scholar]
- 35.Cheng Z, Muhlrad D, Lim MK, Parker R & Song H Structural and functional insights into the human Upf1 helicase core. Embo J 26, 253–264 (2007). [DOI] [PMC free article] [PubMed] [Google Scholar]
- 36.Dillingham MS, Wigley DB & Webb MR Demonstration of Unidirectional Single-Stranded DNA Translocation by PcrA Helicase: Measurement of Step Size and Translocation Speed †. Biochemistry-us 39, 205–212 (2000). [DOI] [PubMed] [Google Scholar]
- 37.Lohman TM, Tomko EJ & Wu CG Non-hexameric DNA helicases and translocases: mechanisms and regulation. Nat Rev Mol Cell Bio 9, 391–401 (2008). [DOI] [PubMed] [Google Scholar]
- 38.Tomko EJ, Fischer CJ, Niedziela-Majka A & Lohman TM A Nonuniform Stepping Mechanism for E. coli UvrD Monomer Translocation along Single-Stranded DNA. Mol Cell 26, 335–347 (2007). [DOI] [PMC free article] [PubMed] [Google Scholar]
- 39.Velankar SS, Soultanas P, Dillingham MS, Subramanya HS & Wigley DB Crystal structures of complexes of PcrA DNA helicase with a DNA substrate indicate an inchworm mechanism. Cell 97, 75–84 (1999). [DOI] [PubMed] [Google Scholar]
- 40.Yarranton GT & Gefter ML Enzyme-catalyzed DNA unwinding: Studies on Escherichia coli rep protein. Proc National Acad Sci 76, 1658–1662 (1979). [DOI] [PMC free article] [PubMed] [Google Scholar]
- 41.Minskaia E et al. Discovery of an RNA virus 3’->5’ exoribonuclease that is critically involved in coronavirus RNA synthesis. Proc National Acad Sci 103, 5108–5113 (2006). [DOI] [PMC free article] [PubMed] [Google Scholar]
- 42.Gorbalenya AE, Enjuanes L, Ziebuhr J & Snijder EJ Nidovirales: Evolving the largest RNA virus genome. Virus Res 117, 17–37 (2006). [DOI] [PMC free article] [PubMed] [Google Scholar]
- 43.Denison MR, Graham RL, Donaldson EF, Eckerle LD & Baric RS Coronaviruses: An RNA proofreading machine regulates replication fidelity and diversity. Rna Biol 8, 270–279 (2011). [DOI] [PMC free article] [PubMed] [Google Scholar]
- 44.Agostini ML et al. Coronavirus Susceptibility to the Antiviral Remdesivir (GS-5734) Is Mediated by the Viral Polymerase and the Proofreading Exoribonuclease. Mbio 9, e00221–18 (2018). [DOI] [PMC free article] [PubMed] [Google Scholar]
- 45.Morin A et al. Collaboration gets the most out of software. eLife 2, e01456 (2013). [DOI] [PMC free article] [PubMed] [Google Scholar]
- 46.Suloway C et al. Automated molecular microscopy: the new Leginon system. Journal of structural biology 151, 41–60 (2005). [DOI] [PubMed] [Google Scholar]
- 47.Zheng SQ et al. MotionCor2: anisotropic correction of beam-induced motion for improved cryo-electron microscopy. Nature methods 14, 331–332 (2017). [DOI] [PMC free article] [PubMed] [Google Scholar]
- 48.Punjani A, Rubinstein JL, Fleet DJ & Brubaker MA cryoSPARC: algorithms for rapid unsupervised cryo-EM structure determination. Nat Methods 14, 290–296 (2017). [DOI] [PubMed] [Google Scholar]
- 49.Zivanov J et al. New tools for automated high-resolution cryo-EM structure determination in RELION-3. eLife 7, (2018). [DOI] [PMC free article] [PubMed] [Google Scholar]
- 50.Punjani A, Zhang H & Fleet DJ Non-uniform refinement: adaptive regularization improves single-particle cryo-EM reconstruction. Nat Methods 17, 1214–1221 (2020). [DOI] [PubMed] [Google Scholar]
- 51.Afonine PV et al. New tools for the analysis and validation of cryo-EM maps and atomic models. Acta crystallographica. Section D, Structural biology 74, 814–840 (2018). [DOI] [PMC free article] [PubMed] [Google Scholar]
- 52.Adams PD et al. PHENIX: a comprehensive Python-based system for macromolecular structure solution. Acta Crystallographica Section D Biological Crystallography 66, 213–221 (2010). [DOI] [PMC free article] [PubMed] [Google Scholar]
- 53.Pettersen EF et al. UCSF Chimera--a visualization system for exploratory research and analysis. Journal of computational chemistry 25, 1605–1612 (2004). [DOI] [PubMed] [Google Scholar]
- 54.Emsley P & Cowtan K Coot: model-building tools for molecular graphics. Acta Crystallographica Section D Biological Crystallography 60, 2126–2132 (2004). [DOI] [PubMed] [Google Scholar]
- 55.Piana S, Robustelli P, Tan D, Chen S & Shaw DE Development of a Force Field for the Simulation of Single-Chain Proteins and Protein–Protein Complexes. J Chem Theory Comput 16, 2494–2507 (2020). [DOI] [PubMed] [Google Scholar]
- 56.Tan D, Piana S, Dirks RM & Shaw DE RNA force field with accuracy comparable to state-of-the-art protein force fields. Proc National Acad Sci 115, 201713027 (2018). [DOI] [PMC free article] [PubMed] [Google Scholar]
- 57.Piana S, Donchev AG, Robustelli P & Shaw DE Water Dispersion Interactions Strongly Influence Simulated Structural Properties of Disordered Protein States. J Phys Chem B 119, 5113–5123 (2015). [DOI] [PubMed] [Google Scholar]
- 58.Bowers KJ et al. Scalable Algorithms for Molecular Dynamics Simulations on Commodity Clusters. Acm Ieee Sc 2006 Conf Sc’06 43–43 (2006) doi: 10.1109/sc.2006.54. [DOI] [Google Scholar]
- 59.Shaw DE et al. Anton 2: Raising the Bar for Performance and Programmability in a Special-Purpose Molecular Dynamics Supercomputer. Sc14 Int Conf High Perform Comput Netw Storage Analysis 41–53 (2014) doi: 10.1109/sc.2014.9. [DOI] [Google Scholar]
- 60.Lippert RA et al. Accurate and efficient integration for molecular dynamics simulations at constant temperature and pressure. J Chem Phys 139, 164106 (2013). [DOI] [PubMed] [Google Scholar]
- 61.Martyna GJ, Tobias DJ & Klein ML Constant pressure molecular dynamics algorithms. J Chem Phys 101, 4177–4189 (1994). [Google Scholar]
- 62.Tuckerman M, Berne BJ & Martyna GJ Reversible multiple time scale molecular dynamics. J Chem Phys 97, 1990–2001 (1992). [Google Scholar]
- 63.Predescu C et al. The u -series: A separable decomposition for electrostatics computation with improved accuracy. J Chem Phys 152, 084113 (2020). [DOI] [PubMed] [Google Scholar]
- 64.Tan YZ et al. Addressing preferred specimen orientation in single-particle cryo-EM through tilting. Nature methods 14, 793–796 (2017). [DOI] [PMC free article] [PubMed] [Google Scholar]
- 65.Chen VB et al. MolProbity: all-atom structure validation for macromolecular crystallography. Acta Crystallographica Section D Biological Crystallography 66, 12–21 (2010). [DOI] [PMC free article] [PubMed] [Google Scholar]
Associated Data
This section collects any data citations, data availability statements, or supplementary materials included in this article.
Supplementary Materials
Data Availability Statement
All unique/stable reagents generated in this study are available without restriction from one of the Lead Contacts, Seth A. Darst (darst@rockefeller.edu). The cryo-EM density maps and atomic coordinates have been deposited in the EMDataBank and Protein Data Bank as follows: nsp131-RTC (EMD-24431, 7RE2), nsp132-RTC (composite) (EMD-24430, 7RE1), (nsp132-RTC)2 (EMD-24432, 7RE3), nsp132-RTC (nsp13T-apo) (EMD-24428, 7RDZ), nsp132-RTC (nsp13T-engaged) (EMD-24427, 7RDY), nsp132-RTC (nsp13T-swiveled) (EMD-24429, 7RE0), nsp132-RTC (1B-open) (EMD-24426, 7RDX). The MD trajectories described in this work are available at https://www.deshawresearch.com/downloads/download_trajectory_sarscov2.cgi/.


