

Abstract
Medications for type 2 diabetes (T2DM) offer a promising path for discovery and development of effective interventions for dementia syndromes. A common feature of dementia syndromes is an energy failure due to reduced energy supply to neurons and is associated with synaptic loss and results in cognitive decline and behavioral changes. Among diabetes medications, glucagon‐like peptide‐1 (GLP‐1) receptor agonists (RAs) promote protective effects on vascular, microglial, and neuronal functions. In this review, we present evidence from animal models, imaging studies, and clinical trials that support developing GLP‐1 RAs for dementia syndromes. The review examines how changes in brain energy metabolism differ in conditions of insulin resistance and T2DM from dementia and underscores the challenges that arise from the heterogeneity of dementia syndromes. The development of GLP‐1 RAs as dementia therapies requires a deeper understanding of the regional changes in brain energy homeostasis guided by novel imaging biomarkers.
Keywords: Alzheimer's disease, glucagon‐like peptide‐1, insulin resistance, type 2 diabetes
1. INTRODUCTION
A common feature of dementia syndromes is an energy failure in neurons 1 that associates with synaptic loss 2 and results in cognitive and behavioral changes. There are several explanations for energy failure in dementia syndromes. These include breakdown of the blood‐brain barrier (BBB), 3 changes to blood flow, 4 reduced glucose transporter protein expression, 5 or altered signaling pathways that regulate neuronal glucose utilization. 6 Low energy levels lead to failure in the production of high‐energy phosphate compounds such as ATP that further cascade into downstream failure of several energy‐dependent processes, ultimately leading to synaptic loss.
Medications for type 2 diabetes (T2DM) have favorable effects on brain energy metabolism and offer a viable path for the discovery and development of interventions for dementia syndromes. Indeed, large database studies reveal an association between several classes of anti‐diabetes medications and a lower risk of dementia. 7 , 8 Among T2DM medications, glucagon‐like peptide‐1 (GLP‐1) receptor agonists (RAs) have neuroprotective properties tied to restoring brain energy metabolism, 9 , 10 with direct effects on vascular, 11 microglial, 12 and synaptic functions. 13 Therefore, examining whether GLP‐1 agonists can enhance synaptic functions and alleviate the clinical burden of dementia associated with neuronal glucose hypometabolism presents an attractive strategy. With ongoing efforts to repurpose GLP‐1 RAs for clinical trials testing ability to reduce cognitive decline, a deeper understanding is needed of the pathophysiological changes that define brain energy utilization in T2DM, insulin resistance (IR), and dementia.
One of the fundamental mechanisms that underlying and preceding T2DM and its complications is the development of systemic IR. Insulin promotes glucose uptake in several peripheral tissues including the liver, where glucose is taken up and stored as glycogen. 14 In contrast, insulin does not promote brain glucose uptake. 15 , 16 IR can be considered from an evolutionary perspective a protective mechanism during starvation to maintain a constant supply of glucose to the brain, 14 while limiting glucose uptake and utilization by muscle, adipocytes, and liver cells. 17 IR becomes maladaptive in conditions of nutrition abundance and obesity, driving the development of T2DM and its complications. Unlike dementia syndromes that feature brain glucose hypometabolism, glucose transport at the BBB is not reduced in patients with T2DM/IR. 18 Indeed, some studies reveal an association between systemic hyperglycemia and insulinemia in T2DM/IR with brain glucose hypermetabolism by fluorodeoxyglucose–positron emission tomography (FDG‐PET) 19 and increased functional connectivity by resting‐state functional magnetic resonance imaging (fMRI). 20 Moreover, brain IR defined by reduced insulin signaling in brain cells can develop without any evidence of systemic IR. 6
Notwithstanding, T2DM increases the risk of dementia syndromes including Alzheimer's disease dementia (ADd) and vascular dementia (VaD), 21 , 22 , 23 and systemic IR is commonly found in both conditions. 24 , 25 It is important to note that vascular brain complications in T2DM associate with regional brain glucose hypometabolism that share some similarities with the dementia brain. 26 Examining these regional differences in brain glucose hypometabolism can help differentiate the pathology of the dysexecutive VaD clinical presentation from the amnestic ADd. 27 Such information can guide the development of clinical trials aimed at rescuing the brain energy failure with disease‐specific biomarkers and outcomes. Because the brain in T2DM/IR and VaD has inconsistent associations with the core neuropathological features of pure ADd, namely amyloid beta (Aβ) plaques and neurofibrillary tangles (NFTs), 28 , 29 utilizing these classic AD biomarkers to guide brain energy rescue therapies may prove futile.
In this review, we present evidence from animal models, imaging, and clinical studies to illustrate how changes in brain glucose uptake in T2DM/IR differ from the dementia brain and examine the key mechanisms that regulate brain glucose uptake and utilization, highlighting differences in regional brain pathology changes and cognitive functions that differ between these conditions. We then review preclinical and clinical studies in support of the application of GLP‐RAs in neurodegenerative diseases such as ADd and Parkinson's disease. As GLP‐1 RAs are poised to move quickly into larger cognition clinical trials, the evidence reviewed here supports targeting individuals at risk or with neurodegenerative disease while reconsidering the selection of conventional AD dementia (such as Aβ) biomarkers in favor of imaging biomarkers and clinical outcomes that reflect regional changes in energy metabolism.
RESEARCH IN CONTEXT
Systematic Review: A review of the literature covering FDG‐PET imaging, resting stage fMRIs, pre‐clinical and clinical investigations involving GLP‐1, its receptor, its receptor agonists (RAs) in dementia syndromes, type 2 diabetes (T2DM) and insulin resistance (IR) was performed using a PubMed search from 1993–2020.
Interpretation: Brain energy metabolism differs in the setting of IR and T2DM compared to the dementia brain. There is strong preclinical and early clinical evidence in support of developing GLP‐1 RA in dementia. GLP‐1 RA can enhance brain metabolism. Whether enhancing brain energy homeostasis by GLP‐1 RA can reverse synaptic loss and cognitive decline merits further investigation.
Future Directions: Imaging biomarkers reflective of brain energy metabolism and synaptic activity can better help guide the development of GLP‐RAs than the classical amyloid beta (Aβ) and tau biomarkers currently used in dementia drug development.
1.1. Brain energy failure underly neuronal dysfunction
Glucose is the preferred brain energy substrate, 30 although during metabolic stress, for example, fasting, exercise, or severe disease, ketone bodies replace glucose as fuel. 31 Brain glucose metabolism declines during aging and this decline is accelerated in persons with genetic risk of dementia, such as in apolipoprotein E (APOE) ε4 carriers, 32 or in women who are post‐menopausal. 33 Indeed, glucose hypometabolism is a common feature of several dementia syndromes, and the pattern of glucose hypometabolism can help distinguish the type of dementia. 34 , 35 Breakdown of the BBB, 3 atherosclerosis causing alteration in cerebral blood flow, 4 or reduced glucose transporter expression 5 can all result in a reduction in neuronal glucose supply. Brain energy failure resulting from limited glucose supply or utilization is believed to be one of the main crucial precursor events that underlies neuronal dysfunction 1 and associates with synaptic loss, dendrite pruning, loss of network connectivity, or apoptosis. 2 It is notable that low energy levels lead to failure in the production of high‐energy phosphate compounds such as ATP, leading to a cascade of further downstream failure of energy‐dependent processes. One example is calcium ion signaling 36 leading to a deterioration in Ca2+ depolarizations. A key claim of the Ca2+ hypothesis 37 is that repetitive ischemic molecular events on an extended time scale could account for the sequence of cellular stress mechanisms (such as endoplasmic reticulum (ER) stress, mitochondrial Ca2+ overload, activation of lipases, and generation of reactive oxygen species 38 ) that underlie a number of neurodegenerative disorders including ADd. 37
Brain glucose hypometabolism also forces a shift toward utilization of ketones as sources of energy. 39 When generation of energy from systemic ketones is compromised, the brain resorts to its own myelin to generate ATP by activating lipid‐digesting enzymes such as phospholipase A2. 40 This process promotes the production of lysophospholipids that induce potent inflammatory responses 41 and arachidonic acid derivatives that generate oxidative stress. 42 To rescue this brain energy gap, several interventions have been recently exploited using hormones, ketone meals, mitochondria‐focused therapeutics, and diabetes medications. 43 Among diabetes medications, GLP‐1 RAs are particularly attractive given their capacity to restore the neurovascular unit. 10 However, a better understanding of how the diabetes brain differs from the dementia brain in energy consumption and requirement can help guide their development into cognition applications.
1.2. Brain insulin and glucose metabolism changes in T2DM/IR versus ADd/VaD
Systemic IR leads to distinct effects on brain glucose metabolism that differ from neurodegenerative diseases. Systemic IR is generally defined as the reduced response to insulin in skeletal muscle, liver, and adipocytes (compared with subjects with normal glucose tolerance). This classic definition of systemic IR was based on insulin‐mediated glucose uptake such as lower peripheral glucose consumption (skeletal muscle IR), greater endogenous glucose release (hepatic IR), and impaired suppression of lipolysis in the presence of high insulin levels in adipose tissues. 17 As our understanding of insulin signaling advanced, it became increasingly clear that insulin has many functions beyond glucose uptake, such as on lipid and protein metabolism, ion and amino acid transport, cell cycle and proliferation, cell differentiation, and nitric oxide synthesis. 44 As a result, systemic IR is now defined more broadly as reduced sensitivity to the diverse cell actions of insulin. 45 IR might be considered a protective mechanism during starvation to maintain a constant supply of glucose to the brain, 14 while limiting glucose uptake in peripheral insulin‐sensitive cells. 17
Brain IR, in comparison, is not defined on the basis of brain glucose uptake. In the brain, insulin does not appear to directly trigger neuronal 6 , 46 , 47 , 48 , 49 or astrocytic 50 , 51 glucose uptake. A broader definition of brain IR is the reduced insulin signaling on brain cellular activity, which would include glucose‐independent effects of insulin such as neuronal activity. As such, brain IR can be directly measured by testing the responsiveness of insulin‐signaling molecules to physiological levels of insulin, preferably the responsiveness of the insulin receptor and/or IRS‐1/2, since these are selectively activated by insulin, unlike more downstream signaling molecules such as Akt. 6 Insulin receptors are widely expressed in the brain, with prominence in olfactory, limbic areas, and the cerebellum. 52 Brain insulin receptors have also been localized in capillary fractions constituting the BBB. One brain IR definition is centered on the inability of a physiological increase of plasma insulin levels to suppress hepatic glucose production via the mediobasal hypothalamus. 53 As in peripheral tissues, neuronal insulin action involves the intracellular IRS‐PI3K signal transduction pathway. Hypothalamic IRS‐PI3K signaling is increased following either intracerebroventricular (icv) or systemic insulin administration, 54 and the inhibitory effect of icv insulin on both food intake 54 and hepatic glucose production can be blocked by icv pretreatment with a PI3K inhibitor. 55 In rats with untreated insulin‐deficient diabetes mellitus induced by the β cell toxin streptozotocin, hypothalamic PI3K signaling is reduced and plays an essential role in the glycemic response to insulin. 56 These findings suggest that changing systemic insulin levels per se may not have a profound impact on brain glucose utilization and may help us understand the limited potential of using brain glucose uptake as surrogate for brain IR in cognitive diseases.
Brain glucose uptake is not regulated by physiological insulin levels during normoglycemia. In healthy volunteers, hyperinsulinemia within the normal physiological range does not affect BBB glucose transport or net cerebral glucose metabolism. 15 , 16 Glucose brain uptake is regulated by complex mechanisms. The predominant brain glucose transporters, GLUT1 and GLUT3, are not regulated by insulin (Table 1). GLUT1 and GLUT3 can be found both in the periphery, in various brain cells, and in the endothelial cells of the BBB. Both GLUT1 and GLUT3 are regulated by cAMP, a second messenger involved in various signaling and metabolic pathways. GLUT2, known largely for having a fairly low affinity for glucose, but playing a role in glucose sensing and glucose metabolism, is also found in the brain and periphery and is not dependent on insulin for activation. GLUT4, the predominant glucose transporter in peripheral cells, is insulin dependent but is also regulated by leptin and exercise. Table 1 summarizes the localization and regulators of GLUT 1‐4. Glucose uptake from the blood occurs mainly as a result of the high‐affinity glucose transporter GLUT1 on capillary epithelial cells and astrocytic end feet at the BBB. 57 During experimental diabetes, GLUT1 expression is decreased in the BBB and in many, although not all, brain areas. 58 , 59 This adaptive decrease in GLUT1 expression may provide one explanation for the blunted brain hyperglycemia in those who are obese 60 and/or type 1 diabetes, 61 perhaps a protective mechanism against chronic brain hyperglycemia. Similarly, in the presence of mild hypoglycemia, the brain extracts an increased fraction of glucose from the blood by enhancing GLUT1 expression. 62 The role of the insulin‐dependent GLUT4 in brain glucose metabolism is less clear, but memory training increases hippocampal GLUT4 translocation and memory acquisition is impaired by GLUT4 blockade in male rats. 63
TABLE 1.
Glucose transporter expression and regulation
| GLP‐1R | GLUT1 | GLUT2 | GLUT3 | GLUT4 | |
|---|---|---|---|---|---|
| Locations of expression | Brain: Hypothalamus, medulla, hippocampus, thalamus, caudate‐putamen and globus pallidum 113 , 119 , 159 | Brain: BBB, astrocytes | Brain: hypothalamus, caudate‐putamen, mesencephalon and bulb 113 | Brain: Hippocampus, cerebellum 160 | Brain: cerebellum, hippocampus, the cortex, and hypothalamus 160 |
| Periphery: Endothelial cells of blood tissue barriers 161 | Periphery: liver, intestine, kidney and pancreatic islet beta cells 162 | Periphery: Placenta, liver, heart, kidneys 163 | Periphery: Fat, skeletal muscle, and cardiac muscle 163 | ||
| Insulin‐dependent | ‐ | ‐ | ‐ | + | |
| Other regulators | GLP‐1, GLP‐1 RA | IGF‐1, cAMP | Glucose | cAMP | Leptin, muscle contractions |
The brains of ADd and VaD patients differ from those with T2DM/IR in that they exhibit reduced concentrations of endothelial GLUT1 and neuronal GLUT3 in the neocortex, hippocampal formation, and caudate nucleus. 5 , 18 , 64 The GLUT1 reductions in brains of ADd cases are restricted to endothelial cells of capillaries, 65 which is probably a major factor in the reduced uptake of glucose at the BBB in such cases. 66 The GLUT3 reductions in the brains of ADd cases are expected to decrease glucose uptake by neurons, especially by their dendrites. The brains of T2DM cases have been less frequently studied for glucose transporters than AD cases, but it has been found that GLUT3 levels in T2DM, as in ADd, are reduced in frontal neocortex. 18 Otherwise, glucose transporter levels in the neocortex of T2DM and ADd cases differ with GLUT1 levels being normal in T2DM, GLUT2 being elevated only in ADd, and GLUT3 levels being lower in T2DM than in ADd. 18 The levels of insulin‐sensitive GLUT4 in the brains of ADd cases are comparable to control brains (ie., frontal neocortex). 67 GLUT4 levels in the brains of T2DM cases have not been reported, but systemic IR after a high‐fat diet is associated with reduced insulin PI3K signaling in hippocampal neurons and memory impairment, potentially via a GLUT4‐dependent mechanism. 68 The largely intact GLUT1 transporters at the BBB in T2DM/IR may indicate that brain glucose uptake is not reduced in these patients. Indeed, this observation is further corroborated by imaging studies discussed below.
It might be expected that the brain in ADd would be hypoglycemic given the reduced blood‐brain glucose transport in such cases, 10 , 66 probably due to reduced expression of GLUT1 at the BBB in ADd. 5 Yet cerebrospinal fluid (CSF) glucose levels are normal in ADd cases 69 and post‐mortem studies on such cases report hyperglycemia in brain areas of ADd cases even in the absence of T2DM, specifically in the middle frontal gyrus, 70 inferior temporal gyrus, 70 and posterior cingulate/precuneus gyri. 71 In the inferior temporal gyrus, hyperglycemia is significantly correlated with AD pathology. 70 Other post‐mortem studies on ADd cases without T2DM using an ex vivo insulin stimulation method have shown IR in all tested brain areas, namely the prefrontal cortex, hippocampal formation, and cerebellum. 6 These findings support that brain hyperglycemia and brain IR develop independently of T2DM or systemic IR. Notwithstanding, systemic hyperglycemia and IR could promote or accelerate AD pathogenesis. This is supported by two lines of evidence. The first is that systemic hyperglycemia accelerates conversion from mild cognitive impairment to dementia. 72 , 73 The second line of evidence is that systemic IR in animal models of T2DM often induces brain IR and brain pathology with similarities to AD. 74 , 75 , 76 More recently, it was demonstrated that metabolic stress induced from high fat consumption, but not changes induced by IR, contributed to worsening brain Aβ pathology in these models. 77 It is notable that it is still unclear whether therapeutic approaches taken to combat hyperglycemia and systemic IR per se but without directly affecting brain fuel utilization pathways can be effective in treating or preventing dementia.
1.3. Brain glucose uptake by FDG‐PET in T2DM/IR versus ADd/VaD
FDG‐PET is the most direct imaging modality for measuring brain glucose uptake in live humans. FDG behaves similarly to glucose if not identically. It moves from the circulation to into brain via GLUT1. 78 It also undergoes phosphorylation as the first step of intracellular glycolysis like glucose does, but the similarity stops there. Normal glucose can further degrade to produce ATP. In contrast, FDG remains in the neurons as FDG‐6‐phosphate (FDG‐6‐P). 79 , 80 Therefore, hypometabolism identified by FDG‐PET in neurodegenerative diseases could be a sign of either poor transport of glucose from extracellular space into the cells or impaired glucose phosphorylation.
FDG‐PET has already been put to a great deal of use in the observation of brain glucose hypometabolism as a diagnostic biomarker in clinical AD. The pattern of hypometabolism in AD is similar to atrophy involving temporo‐parietal regions and the posterior cingulate gyrus. Originally it was claimed that the hypometabolism in AD was a result of cell death and volume loss; however, later data confirmed that changes in FDG‐PET precede volume loss and structural changes seen on MRI. 81 Moreover, in patients with prodromal AD, glucose hypometabolism has commonly been observed in default mode network (DMN) areas such as parietotemporal association cortices, posterior cingulate cortex, and the precuneus. 82 , 83 Because neurotransmission and synaptic activity are responsible for at least 80% of metabolic demands in the brain, 84 it is believed that glucose metabolism correlates strongly with local neuronal activity in the DMN within individuals. FDG‐PET signal is also associated with synaptophysin, a marker of synaptic density. 85 Other data also showed that changes in FDG‐PET uptake is associated with the glutamate activity and level of excitatory glutamate neurotransmitter. 81 Therefore, lower glucose uptake in AD may represent lower synaptic activity and density in the vulnerable AD regions. As the disease progresses, the affected regions spread to involve the frontal cortices, whereas the metabolism in the striatum, thalamus, primary sensorimotor cortices, visual cortices, and cerebellum are relatively preserved. 82 , 86 There is strong evidence that lower glucose uptake and intracellular metabolism disrupts synaptic function as discussed before. 35 , 87 , 88 It is yet to be determined whether restoring brain energy homeostatic can rescue synaptic functions, and we hypothesize that GLP1 RAs present an exciting opportunity to do so.
ADd glucose uptake pattern on FDG‐PET differs from that of VaD. Kerrouche et al. 34 used a voxel‐based multivariate analysis of FDG‐PET performed on 153 subjects to separate patients with VaD or ADd from age‐matched control subjects. Lower metabolism in the deep gray nuclei, cerebellum, primary cortexes, middle temporal gyrus, and anterior cingulate cortex differentiated VaD from AD, whereas lower metabolism in the hippocampal region, orbitofrontal, posterior cingulate, and posterior parietal cortexes was characteristic of AD, and separated patients with AD from VaD. Hypometabolic patterns common to VaD and AD were shown to be the posterior parietal, precuneus, posterior cingulate, pre‐frontal, and anterior hippocampal regions. 34
FDG‐PET findings in IR and T2DM studies have similarities to and differences from FDG‐PET findings in ADd. Young obese individuals have higher global brain glucose uptake and higher plasma insulin levels, whereas older prediabetic and obese individuals at risk of AD may develop the opposite findings. Likely, differences in brain glucose uptake between these conditions are influenced by age, sex, genetics, cognitive state, co‐morbid conditions, and importantly GLUT1 activity at the BBB that may decrease with aging and compromised BBB integrity. 89 In contrast to ADd, there is some evidence that systemic IR increases brain glucose uptake. For example, in one study, 13 patients with impaired glucose tolerance and 9 healthy subjects underwent an FDG‐PET during a hyperinsulinemic clamp, a measure of IR via insulin and glucose infusion. The hyperinsulinemic clamp increased brain glucose metabolism in patients with impaired glucose tolerance but not in healthy subjects. 90 During normal glucose tolerance, insulin has no effect on brain glucose uptake, with the insulin and its receptor interaction at saturation kinetics. However, with systemic IR, increasing insulin levels may increase brain glucose uptake when the response to insulin has not reached maximum saturation. These findings are corroborated by a decrease in brain glucose uptake in 22 morbidly obese patients 6 months after bariatric surgery induced weight loss that was associated with improved peripheral insulin sensitivity. 19
Older prediabetic and obese individuals at risk of AD have evidence of lower brain glucose uptake in AD affected areas, but it is not likely that IR per se is driving the lower brain glucose uptake. In a group of 150 older individuals from the Wisconsin ADRC registry, higher HOMA‐IRs (a surrogate of IR) was associated with lower glucose uptake in several AD‐affected areas. 91 Another study of 749 participants showed that diabetes and poor glycemic control in non‐diabetic individuals was associated with greater glucose hypometabolism in AD‐related areas even after adjustment for age, sex, education, apolipoprotein E (APOE) ε4 genotype, glycemic level, and cognitive status. 26 Similarly, a small study (n = 23) correlated greater IR by HOMA‐IR with an AD‐like pattern of reduced CMRglu in frontal, parietotemporal, and cingulate regions in adults with prediabetes and no cognitive impairment. 92 This association of lower brain glucose metabolism with IR can possibly be explained through confounding factors such as vascular disease, inflammation, dyslipidemia, or oxidative stress that affect BBB or neuronal glucose transport.
1.4. Functional connectivity in T2DM/IR versus ADd/VaD
The application of fMRI to assess brain connectivity reflects the neurovascular signaling response to synaptic activity 93 and has an indirect relationship with glucose uptake. Directly, fMRI measures changes in blood oxygenation levels that are associated with blood flow change. Specifically, synaptic activity results in vasodilation that promotes increased blood flow, an effect mediated by the signaling of neurotransmitters (especially glutamate) after binding to the post‐synaptic cells. The glutamate released by the presynaptic cell is also transported into astrocytes, a process that helps to focus neurotransmitter transmission temporally and prevent glutamatergic excitotoxicity. In addition to contributing to the neurovascular response, glutamate also helps to couple neuronal activity with glucose utilization by stimulating the ability of astrocytes to use glucose and produce lactate (glycolysis). 94 Functional connectivity, or the extent to which signal over time correlates between multiple brain regions, is further influenced by the integrity of the structural connections between those regions. 95 , 96 Within subject, the fMRI regional synchronicity of activity over time in adjacent voxels (regional homogeneity—indicating greater synchronization of local field potentials) mirrors FDG‐PET signal, although resting state fMRI (rs‐fMRI) signal may only correlate well with FDG‐PET signal across subjects in a smaller number of voxels. 97
fMRI studies of patients with pre‐AD, AD, or T2DM and VaD have found some overlap in trends of connectivity across the conditions, but results were inconsistent. The effect of T2DM on connectivity changes over time and do not reflect a linear pattern. Macro and microvascular disease are common in longstanding T2DM and might affect the fMRI response by impairing vascular reactivity or through white matter hyperintensities. In one study, those with early stage T2DM (<10 years after diagnosis) had a greater DMN functional connectivity than controls. This effect was reversed in those with later stage (10+ years after diagnosis) T2DM. 20 Similar to early onset T2DM, those with obesity and pre‐diabetes may have an increase in brain connectivity compared to healthy controls, 98 although findings regarding the direction of those differences are inconsistent. The increase in functional connectivity seen sometimes in obesity/early T2DM agree with the brain glucose hypermetabolism observed in FDG‐PET studies. For example, compared with women who have normal weight, obese women showed an increase in task‐based fMRI signal during a working memory task and in resting state fMRI connectivity. This decreased after weight loss induced by gastric bypass, 99 and these findings were similar to those observed by FDG‐PET. 19
In a prior study of functional connectivity, significant changes in the negative connectivity of T2DM patients were observed in brain areas affected in AD, between the DMN and right superior parietal gyrus, as well as significant changes in the right middle temporal gyrus and the left precentral gyrus. 20 Positive connectivity followed a similar overall trend to negative connectivity, with early stage T2DM showing significantly larger increases in connectivity to the DMN seen than those with late stage T2DM, although the functional connectivity was not significantly different from normal controls in either group. 20 The bilateral superior frontal gyrus and right caudate exhibited significant differences in positive connectivity with the DMN, similar to trends in FDG‐PET scans of AD and T2DM patients. 20 Both negative and positive DMN connectivity were correlated with diabetes duration (r = 0.32, P < .01 and r = ‐0.26, P = .02). 20 In patients with amnestic MCI compared to healthy older adults, the lower synchronicity of signal that was observed was specific to a subset of resting state networks, whereas other networks remained unaffected. 100 The regions affected included the left posterior cingulate cortex and right medial prefrontal cortex of the DMM as well as bilateral superior parietal lobes and bilateral inferior frontal gyri of the executive attention network. This reflects altered connectivity between the medial temporal lobe and neocortical areas and functional dysconnectivity of the executive attention network. 100 VaD in contrast to AD, appears to affect lower functional connectivity in the medial frontal and superior frontal gyri, part of the central executive network (CEN), 101 more than the DMN itself.
1.5. Cognitive changes in T2DM/IR versus ADd/VaD
In contrast to prodromal AD and Add, which are generally characterized by an amnestic cognitive pattern, patients with T2DM appear to be mostly vulnerable to subtle changes in executive function, with these changes in executive functioning become more pronounced in VaD. Executive function can be characterized as a top‐down family of mental processes used in working memory and problem‐solving. As T2DM advances, there is evidence of brain atrophy, inflammation, and changes to the brain vasculature. 102 , 103 Early on, the domains of cognitive function most affected in T2DM include processing speed, memory, and executive function, but these domains may also be impaired in individuals with prodromal AD and ADd. 103
Over 100 research studies investigating the relationship between T2DM and executive function have been carried out, with a handful of meta‐analyses synthesizing their findings. In Vincent and Hall's meta‐analysis of 59 studies, a significant mild‐to‐moderate association between T2DM and decreased executive function (d = ‐0.248, P < .001) was reported, including verbal fluency, mental flexibility, response inhibition, working memory, and attention. 103 Controlling for the duration of a patient's T2DM significantly diminished the effect of T2DM status on executive function. 103 Sadanand et al., further reported in a meta‐analysis of 15 studies that T2DM patients had worse scores on executive function than controls, most notably in phonemic fluency (d = −0.35), cognitive flexibility (d = −0.52), and speed of processing (d = −0.22). T2DM patients also had worse episodic memory (d = −0.51) and combined logical memory scores (d = −0.24). 104 The importance of executive function in T2DM is further demonstrated after weight loss in women with obesity and T2DM. An active weight loss program started before and immediately after menopause in Look AHEAD was associated with improvement in measures of executive functions but not in memory domains. 105 Although patients with T2DM had lower cognitive functions at baseline in an analysis of the National Alzheimer's Coordinating Center's Uniform Data, the rate of cognitive decline in patients with T2DM did not differ from those without T2DM. 106 A summary of the differences between T2DM/IR, ADd, and VaD is presented in Table 2.
TABLE 2.
Comparison of AD pathology with IR, T2DM, and VaD pathology
| Characteristic | Prodromal AD | ADd | IR | T2DM | VaD |
|---|---|---|---|---|---|
| Cognitive domains affected early in disease | Episodic Memory 164 | Global cognitive decline that predominantly amnestic with decrease in activities in daily living 165 | Improvement in executive functions after weight loss 105 | Executive function (information processing speed) 22 | Global cognitive decline that manifests as dysexecutive function with decrease in activities in daily living 166 |
| Pathogenic pathways | Greater amyloid deposition in AD‐related areas early biomarker 167 | Greater amyloid deposition in AD related areas early biomarker together with evidence of increase in tau NFT 168 | No consistent association with amyloid deposition 26 | Pleiotropic effects with a vascular component that vary by disease duration. 169 | Cerebral small vessel disease, as well as thrombo‐embolic stroke 170 |
| Glucose metabolism by FDG PET | Lower uptake in AD affected areas in APOE4 carriers or positive maternal family history of AD 171 , 172 | Lower glucose uptake in AD affected areas and correlates with amyloid deposition 86 | Small differences in the fasting state, but greater glucose uptake after hyperinsulinemia during middle age 92 | Lower uptake in older age in AD‐affected areas 91 | Lower uptake in deep gray nuclei, cerebellum, primary cortexes, middle temporal gyrus, and anterior cingulate 34 |
| Resting state connectivity | Inconsistent. Greater hippocampal connectivity in AD‐affected areas in younger APOE4 carriers but lower connectivity between in older APOE4 carriers or have MCI. 100 | Lower hippocampal/DMN connectivity to several areas in the brain 173 | Inconsistent findings. | Lower connectivity when T2DM duration exceeds 10 years 20 | Lower functional connectivity in the medial frontal and superior frontal gyri, part of the central executive network (CEN) 101 . |
| Brain glucose transporters affected by disease | Less GLUT1 at the BBB 174 | Less GLUT1 at the BBB, and GLUT3 in cortical tissues 5 | GLUT4 expressed in hippocampus but not clear if expression is altered in IR or T2DM in humans 175 . | White matter lesions associated with glucose hypometabolism in frontal lobe 176 | |
Even within ADd, there is heterogeneity in clinical dementia syndromes. A recent tau PET brain imaging study revealed four subgroups of ADd that present with regional differences of tau spread and subsequent distinct cognitive domain impairments. 107 There is an opportunity for future studies to select cognitive outcomes based on regional hypometabolism identified by imaging in patients at risk for both AD and VaD. Utilizing imaging biomarkers would not only help classify dementia subtypes with information on regional brain energy hypometabolism but also help select the corresponding cognitive outcomes affected.
1.6. GLP‐1 RAs and relevance to ADd/VaD versus the diabetes brain
GLP‐1 is the most potent of the incretin hormones originally known for their ability to potentiate glucose‐stimulated insulin secretion by the pancreas, but is now known to play many other roles in various organs, including the brain. As discussed earlier, the primary interest in GLP‐1 RAs results from their ability to influence brain energy metabolism. GLP‐1 exerts its physiological effects by binding classic GLP‐1 receptors (GLP‐1Rs) and novel GLP‐1Rs yet to be identified. 108 The classic GLP‐1R is of primary interest here because it mediates the effects of GLP‐1 on glucose uptake and insulin sensitivity. 108 They include the 31‐44 amino acid GLP‐1 analogues or mimetics approved by the US Food and Drug Administration (FDA) for T2DM, that is, exendin‐4 (Byetta), liraglutide (Victoza), lixisenatide (Adlyxin, Lyxumia), dulaglutide (Trulicity), and semaglutide (Ozempic). The acylation of GLP‐1 RAs that avoids renal clearance and the ability to resist DPP‐4 degradation protracted their half‐life to extended periods. 109 Although they differ in their ability to enter the brain after systemic administration, GLP‐1 RAs can do so by infiltration of circumventricular organs 110 and subsequent export into CSF by tanycytes 111 and/or by crossing the BBB. 112 Consequently, peripherally administered GLP‐1 RAs could activate GLP‐1Rs known to be expressed by subsets of neurons in the brainstem, basal forebrain, and the cerebral cortex, including the hippocampal formation. 113 , 114 , 115 , 116 , 117 , 118 , 119 Cultured astrocytes and microglia also express GLP‐1Rs. 12 Although liraglutide has been effective in animal models, there is no evidence that this particular GLP‐1 RA can effectively pass through the blood‐CSF barrier, suggesting that it may not be unable to enter the brain. 120
Figure 1 delineates possible mechanisms of action for GLP‐1 RA in the brain, which include effects on endothelial glucose transport, neuronal energy metabolism pathways, and glial activity to support the neurovascular unit and thereby promoting synaptic activity. GLP‐1 RA functions in the brain are not fully known but probably share pathways similar to as in the periphery, stimulating cAMP production and activating the EPAC, PKA, PI3K/Akt, and β‐arrestin/ERK pathways to induce expression and translocation of GLUT1 and GLUT3. 124 GLP‐1 RA appears to work in the endothelial cells of the BBB to induce glucose uptake. 122 , 123 Synaptic transmission functions as a result of glutamine‐glutamate shuttling into the neuron from the astrocyte, powered by the ATP made from the mitochondria after astrocytic glucose uptake. 94 , 124 ATP produced from enhanced glucose uptake allows the interconversion between glutamine and glutamate to induce uptake by the neuron. 124 , 125 ATP produced through glycolysis and from metabolic processes in the mitochondria works to acidify vesicles via V‐ATPase function so glutamate may enter the synaptic vesicles. 126 Glutamate entry into the synaptic vesicle is powered by the ATP produced following increased glucose uptake by GLUT1, GLUT3, and GLUT4. 94 Formation of synaptic vesicles containing glutamate works to continually activate GLUT4 glucose uptake functioning as a positive feedback loop. 127 , 128 , 129 Glutamate is then exocytosed from the presynapse. 126 Once in the synaptic cleft, glutamate can bind NMDAR on the postsynaptic neuronal membrane and subsequently activate Ca2+ signaling and produce nitric oxide that can diffuse into blood and produce cyclic guanosine monophosphate (cGMP). 93 , 130 cGMP in the blood can trigger vasodilation, inducing an influx of oxygen and glucose into vessels. 93 Glucose can then be re‐taken up by GLUT1 on the endothelium of the BBB. 131 Excess glutamate release into the synaptic cleft is allowed to be taken up again by the astrocyte via a coupled Na+/K+ channel, where it can be converted into glutamine and transported back into the neuron. 94 , 124 , 125 During limited glucose supply, lower ATP production can compromise several energy‐dependent processes, such as Ca2+ signaling, leading to Ca2+ overload, cellular stress, and ultimately synaptic loss that is associated with activation of astrocytes and microglia.
FIGURE 1.
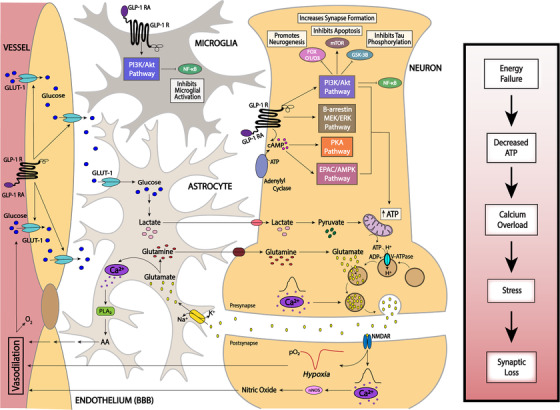
In this illustration of the neurovascular unit, GLP‐1 RA functions on glucagon‐like peptide 1 (GLP‐1) receptors through insulin‐independent mechanisms to stimulate cAMP production and activate the EPAC, PKA, PI3K/Akt, and β‐arrestin/ERK pathways resulting in expression and translocation of GLUT1 at the BBB with several neuroprotective properties. Synaptic activity at the neurovascular units is highly dependent on the availability of ATP, regulating its function. Conditions of reduced ATP supply can lead to Ca2+ overload in both neurons and astrocytes, leading to cellular stress, activation of lipases such as phospholipase A2, and activation of microglia, ultimately leading to synaptic loss
1.7. GLP‐1 RA for brain energy failure and cognitive decline
Analogous to glucose transport in peripheral tissues, cellular studies support that glucose utilization 9 , 132 and uptake across the BBB 10 is facilitated by GLP‐1 RAs but there is a paucity of preclinical and clinical data to support this mechanism. However, there is stronger evidence that GLP‐1 RAs reverse several features of brain IR that are independent of glucose uptake per se. It is well known that the major insulin signaling pathways mediated by IRS/PI3K/Akt and by Shc/Grb2/ERK are shared by insulin‐receptive tissue throughout the body. As in peripheral tissues, IR in neurons is associated with serine phosphorylation of IRS‐1 136 and it is reduced by GLP‐1 RAs. 133 , 134 This final point is especially important because the degree of IR in the hippocampus is inversely and closely associated with cognitive status in humans. 6
It is not surprising then that the most frequently studied GLP‐1 RAs (exendin‐4, liraglutide, and semaglutide), shown in Table 3, are often found to exert the same therapeutic effects in and outside the brain on many conditions directly or indirectly related to energy homeostasis and/or insulin sensitivity. 108 These effects include cell promotion of survival, 135 inhibition of apoptosis, 135 inflammation, 136 oxidative stress, 137 cardiac, 138 astrocyte, 139 and neuronal protection, 135 transcription and/or translation of trophic factors, including brain‐derived neurotrophic factor (BDNF), glial‐derived neurotrophic factor (GDNF), and nerve growth factor (NGF), 12 , 140 adult neurogenesis, synaptic plasticity, 141 and cognition. 121 , 141 , 142 Many experimental studies on animal models of obesity and/or T2DM have shown that the GLP‐1 RAs exendin‐4 and liraglutide can reduce IR and its mechanistic basis in the absence of weight loss. 143 , 144 , 145 , 146 However, in a recent post hoc analysis of semaglutide trials, the effects of treatment on IR assessed using HOMA‐IR was explained by weight loss. 147 It is likely that GLP‐1 RA benefits have both weight loss dependent and independent effects.
TABLE 3.
Pre‐clinical GLP‐1 RA studies
| Author | Drug (treatment) | Animal | Key findings |
|---|---|---|---|
| Exendin‐4/Exenatide | |||
| Isacson et al. 115 | Exendin‐4 (i.p.) (0.1 μg/kg twice daily for 2 weeks) |
Male Sprague–Dawley rats (radial maze) Male CD‐1 mice (forced swim test) |
The time necessary to solve a radial maze task and the duration of immobility in the forced swim test were significantly reduced compared to respective vehicle groups when the animals were pre‐treated with Ex‐4 |
| Gault et al. 150 | Exendin‐4 (s.c.) (25 nmol/kg twice daily for 21 days) | Mice fed high‐fat diet | Treated mice exhibited improved improves cognitive function (increased recognition index highlighting improved learning and memory) and ameliorates impaired hippocampal synaptic plasticity in dietary‐induced obesity |
| Jia et al. 152 | Exendin‐4 (icv) (0.02, 0.2, 2 nmol per rat) | Adult male Sprague–Dawley rats | icv pre‐treatment with Ex‐4 was able to protect against Aβ1‐42‐induced impairment of spatial memory and learning in rats. |
| Bomba et al. 140 | Exendin‐4,(i.p.) (500 μg/kg body weight, five times a week for 2 months) | 2‐month old WT mice | Exenatide‐treated mice performed significantly better in parameters related to long‐term memory activities. |
| Bomfim et al. 134 | Exendin‐4 (25 nmol/kg/d for 3 weeks) | APP/PS1 mice | Exendin‐4 treatment decreased levels of hippocampal IRS‐1pSer, activated JNK, and improved behavioral measures of cognition following Aβ‐induced AD in mice. |
| Bomba et al 148 | Exenatide or saline (500 mg/kg BW) or vehicle, 5 days a week for 9 months | 3xTg‐AD and PSK1 mice | Exenatide improved cognition in PS1‐KI mice, driven by increasing the brain anaerobic glycolysis rate. |
| Zhao et al 149 | Exenatide (5 nmol/kg bw, or saline, intra‐peritoneally (I.P.) at 17 to 18 months old for 4 to 5 weeks prior to experiment | Aged C57BL/6 J mice | Functional recovery in the aged BBB with upregulated energy utilization pathways, and lower microglial inflammatory signaling expression. |
| Lixisenatide | |||
| Lennox et al. 151 | Lixisenatide (s.c.) (50 nmol/kg twice daily for 40 days) | Mice fed high‐fat diet | Treated mice exhibited improved recognition memory, enhanced progenitor cell proliferations, and an upregulation in genes associated with synaptic plasticity and long‐term potentiation. |
| Cai et al. 177 | Lixisenatide (i.p.) (10 nmol/kg/d for 60 days) | 12‐month‐old APP/PS1/tau female mice | Treatment in lixisenatide in AD model female mice reduced amyloid plaques, neurofibrillary tangles, and neuroinflammation in the hippocampus. |
| Liraglutide | |||
| Hansen et al. 178 | Liraglutide (s.c.) (100 or 500 μg/kg/d for 4 months) | Senescence‐accelerated mouse prone 8 (SAMP8) mice | Liraglutide delayed or partially halted the progressive decline in memory function associated with hippocampal neuronal loss in a mouse model of pathological aging with characteristics of neurobehavioral and neuropathological impairments observed in early‐stage sporadic AD |
| McClean et al. 141 | Liraglutide (i.p.) (25 nmol/kg/d for 8 weeks) | APP/PS1 adult mice | Liraglutide prevented memory impairments in object recognition and water maze tasks, prevented synapse loss and deterioration of synaptic plasticity in the hippocampus, and reduced level of activated microglia. |
| Qi et al. 179 | Liraglutide (s.c.) (25 nmol/d for 8 weeks) | Amyloid β protein (Aβ)‐induced AD mice | Pre‐treatment with liraglutide in Aβ1‐42‐induced AD mice prevent memory impairment, alleviated the ultra‐structural changes of pyramidal neurons and chemical synapses in the hippocampal CA1 region, and reduced Aβ1‐42‐induced tau phosphorylation. |
| Yang et al. 180 | Liraglutide (s.c.) (0.2 mg/kg for 4 weeks) | T2DM adult rats | Liraglutide treatment in T2DM rats ameliorated hyperglycemia and peripheral IR, as well as reversed decreases in CSF insulin and hyperphosphorylation of tau at AD‐relevant phosphorylation sites. |
| Batista et al. 181 | Liraglutide (i.p.) (25 nmol/kg/d for 7 days) | Male Swiss mice | Liraglutide prevented loss of brain insulin receptors and synapses, and reversed memory impairment induced by AD‐linked amyloid‐β oligomers in AD mouse models. |
| Batista et al. 181 | Liraglutide (icv) (0.006 mg/kg for the first week and 0.012 mg/kg after; 1 month total) | Non‐human primates (16‐year‐old macaques) | Liraglutide provided partial protection, decreasing AD‐related insulin receptor, synaptic, and tau pathology in specific brain regions following infusion of amyloid‐β oligomers |
| McClean et al. 153 |
Liraglutide (i.p) (2.5 or 25 nmol/kg/d staggered across 10 weeks). Lixisenatide (i.p) (1 or 10 nmol/kg/d staggered across 10 weeks) |
APP/PS1 adult mice | Lixesenatide treatment was equally as effective at a lower dose compared with Liraglutide at improving object recognition, increasing long‐term potentiation in the hippocampus, and reducing chronic inflammation caused by microglia activation |
| Porter et al. 182 | Liraglutide (s.c.) (50 nmol/kg twice a day for 21 days) | Ob/ob mice | Long‐term potentiation defects were rescued, and hippocampal synaptic plasticity associated with increased expression of Mash1 was improved. Treatment also reduced plasma glucose and increased plasma |
| Hansen et al. 183 | Liraglutide (100 or 500 ng/kg/d for 3 months in hAPPLon or 500 ng/kg/d for 5 months in hAPPSwe) | 5‐month‐old hAPPLon/PS1A246E and 7 month‐old hAPPSwe/PS1ΔE9 mice | Long‐term liraglutide treatment exhibited no effect on cerebral plaque load in two transgenic mouse models of low‐ and high‐grade amyloidosis. |
| McClean et al 153 |
Liraglutide (i.p) (2.5 or 25 nmol/kg/d staggered across 10 weeks). Lixisenatide (i.p) (1 or 10 nmol/kg/d staggered across 10 weeks) |
APP/PS1 adult mice | Lixesenatide equally as effective at a lower dose compared with liraglutide at improving objection recognition, increasing long‐term potentiation in hippocampus, and reducing chronic inflammation caused by microglia activation |
1.8. GLP‐1 RA pre‐clinical animal studies
The majority of animal studies involving treatments with GLP‐1 RA provide some evidence of metabolic benefit to the brain based on reversal of brain IR, favorable effects on energy utilization pathways, restoring microglial homeostasis and BBB integrity (Table 3). However, there is a paucity of data that directly investigated the effect of GLP‐RA on brain glucose uptake. 148 , 149 Animals studies, shown in Table 3, suggest that these RAs may be effective in improving cognitive function, mood, and cell function. Adult rats pretreated for 2 weeks with the GLP‐1 RA, exendin‐4 (Ex‐4), needed less time than controls to find the baits in a radial maze test, indicating increased reference memory. 115 In the same study, male mice treated chronically with Ex‐4, two intraperitoneal (i.p.) injections daily for 1 week, spent significantly less time immobile during the forced swim test than the vehicle‐treated mice, indicating elevated mood. 115 In mice fed high‐fat diets to induce obesity, Ex‐4 improved cognitive function and ameliorated impaired hippocampal synaptic plasticity caused by dietary‐induced obesity. 150 In high‐fat fed mice Lixisenatide, another GLP‐1 RA, improved recognition memory during a novel object recognition task, enhanced progenitor cell proliferation in the brain, and was associated with the upregulation of genes involved in synaptic plasticity and long‐term potentiation. 151 In rats treated with neurotoxic Aβ, icv pre‐treatment with Ex‐4 protected against Aβ1‐42‐induced impairment of spatial memory and learning. 152 In AD mouse models, Lixesenatide treatment was equally as effective at a lower dose compared with Liraglutide treatment at improving objection recognition, increasing long‐term potentiation in the hippocampus, and reducing chronic inflammation caused by microglia activation. 153 Overall, the effects of GLP‐1 RA in these studies on brain Aβ pathology were inconsistent, but Ex‐4 displayed prominent anti‐inflammatory effects on brain microglia, 149 which is consistent protective effects on the neurovascular unit.
1.9. GLP‐1 RA clinical studies
Despite a large number of in vitro, cell‐based, and preclinical studies performed over the last decade showing neuroprotective effects, GLP‐1 RA clinical trials have not yet directly demonstrated any significant cognitive benefits. Clinical studies, shown in Table 4, suggest that GLP‐1 RAs can improve brain connectivity and cerebral glucose uptake, but effects on cognitive function are still unclear. GLP‐1 RA, exendin‐4, potently increased cerebral glucose metabolism in humans with prediabetes or new T2DM. 154 In a randomized, double‐blinded, placebo‐controlled, two‐period crossover study in nine healthy males, FDG‐PET was used to determine the effect of a synthetic GLP‐1 (7 to 36) amide on cerebral glucose transport and metabolism during a hyperglycemic clamp. 155 GLP‐1 lowered brain glucose in all regions. The cerebral metabolic rate for glucose was increased overall but not to the same extent in all regions. The unidirectional glucose transfer across the BBB remained unchanged in all regions, whereas the unidirectional clearance and the phosphorylation rate increased, leading to increased net clearance of the glucose tracer. These findings suggest that GLP‐1 may play a role in a regulatory mechanism involved in the actions of GLUT1 and glucose metabolism by promoting less fluctuation of brain glucose levels in response to alterations in plasma glucose. 155
TABLE 4.
Completed clinical GLP‐1 RA controlled trials
| Study | Drug (dose; duration) | Sample (age) | Study design | Outcomes |
|---|---|---|---|---|
| GLP‐1 analog peptide | ||||
| Gejl et al. 155 (NCT01185119) | GLP‐1 analog peptide (s.c.) (1.2 pmol/kg/min; 300 min total) | Healthy male adults (20‐24 years old) N = 9 | Phase 2, Phase 3 placebo‐controlled, randomized, crossover assignment, quadruple masking (participant, care provider, investigator, outcomes assessor) | Primary: Acute GLP‐1 infusion lowered the intracerebral concentration of glucose, raised cerebral glucose metabolism, and increased glucose clearance and phosphorylation in the brain (18F‐FDG PET) |
| Exenatide | ||||
| Daniele et al. 154 | Exenatide (5 mg) or placebo 30 min before an oral glucose tolerance test (OGTT) | Male adults without diabetes, prediabetes or early T2DM N = 15 | Double‐blind, randomized | Exenatide increased CMRglu in areas of the brain related to glucose homeostasis, appetite, and food reward. (18F‐FDG PET) |
| Liraglutide | ||||
| Watson et al. 72 (NCT02140983) | Liraglutide (s.c.) (0.6 mg/d for 1 week; dose increased to 1.8 mg/d within 3 weeks; 12 weeks total) | Cognitively normal with subjective cognitive complaints (44‐74 years old) N = 32 | Phase 1, placebo‐ controlled, randomized, parallel group, triple masked (participant, care provider, assessor) |
Primary: Liraglutide increased resting state connectivity in the default mode network between the bilateral hippocampus and three clusters centered on the left middle frontal gyrus, bilateral posterior cingulate, and the left lateral occipital cortex (fMRI). Secondary: No changes in a meta‐memory task; glucose tolerance declined slightly in treatment group (OGTT); no difference in fasting plasma glucose at baseline or 12 weeks |
| Gejl et al. 132 (NCT01469351) | Liraglutide (s.c.) (0.6 mg/d for 1 week; increased to 1.8 mg/d within 3 weeks; 26 weeks total) | AD patients (50‐80 years old) N = 34 | Phase Not Applicable Placebo‐controlled, Randomized, Parallel Assignment, Quadruple Masking (Participant, Care Provider, Investigator, Outcomes Assessor) |
Primary: Not statistically significant, numerical increase in Aβ accumulation in all cortical areas after 6 months of treatment, with no differences between treatment arms (11C PIB PET). Secondary: Liraglutide prevented decline of glucose metabolism in several major brain regions, including the precuneus, cerebellum, parietal, temporal, and occipital lobes compared to placebo (18F‐FDG PET); no change in cognitive scores (WMS‐IV) |
| Dulaglutide | ||||
| Cukierman‐Yaffe et al. 184 (NCT01394952) | Dulaglutide (1.5 mg/wk) or placebo over 5.4 years | Participants with T2DM and cardiovascular risk factors N = 9901 | Multicenter, randomized, double‐blind placebo‐controlled trial | Exploratory primary cognitive outcome. Hazard ratio for substantive cognitive impairment for those assigned to dulaglutide compared to placebo (HR 0.86, 95% CI 0.79 to 0.95; P = .0018) |
In a placebo‐controlled trial, 43 participants were randomized to 12 weeks of treatment with liraglutide or placebo and 26 individuals completed the study. Participants were between 45 and 70 years of age with subjective cognitive complaints and a Mini Mental Status Exam (MMSE) score of >27. Patients with T2DM were excluded. The investigators found an inverse correlation between fasting plasma glucose and functional connectivity between the bilateral hippocampus and anterior medial frontal cortex. Treatment with liraglutide resulted in a greater rs‐fMRI connectivity in the DMN between the bilateral hippocampus and three clusters centered on the left middle frontal gyrus, bilateral posterior cingulate, and the left lateral occipital cortex. 72 In a trial of patients with mild AD, 38 patients were randomized to liraglutide (n = 18) or placebo (n = 20) for 6 months, and blood‐brain glucose transfer capacity (T max) in the two groups and a healthy age‐matched control group (n = 6) were determined. Liraglutide, compared to placebo, significantly raised the T max estimates of cerebral cortex, equal to T max estimates in healthy volunteers. 132 The result was consistent with the GLP‐1 analog treatment restoring glucose transport at the BBB, which was positively correlated with cognition. 10 Three randomized, double‐blind, multicenter, placebo‐controlled trials (LEADER, SUSTAIN 6, and PIONEER 6) evaluated the cardiovascular effect of liraglutide or semaglutide versus placebo, added to standard of care. The trials included patients with T2DM and established or high risk of cardiovascular disease. A post hoc analysis on pooled data from 15,820 patients with a median follow‐up of 3.6 years was included. Fifteen GLP‐1 RA–treated patients and 32 placebo‐treated patients were identified with development of dementia. Post hoc analysis on the pooled data showed a significant estimated hazard ratio of 0.47 [95% CI 0.25, 0.86] in favor of the GLP‐1 RA treatment versus placebo. 156
Ongoing clinical trials investigating GLP‐1 RAs and cognition are shown in Table 5. The ELAD study, using liraglutide in patients over 50‐years‐old with probable AD, is evaluating the change in cerebral glucose metabolic rate after 12 months of treatment with liraglutide compared to the placebo arm. In the DRINN study, researchers are evaluating the ability of weekly Exenatide treatment for 32 weeks to prevent or slow the progression of cognitive dysfunction and related biomarkers in dysglycemic/prediabetic patients with mild cognitive impairment. 72 In another recent study, investigators are examining the effect of weekly liraglutide treatment on cognitive function, measured by various cognitive tests. EVOKE (NCT04777396) and EVOKE plus (NCT04777409) trials are planned phase 3 randomized placebo‐controlled multi‐centered clinical trials to test the effect of oral semaglutide (14 mg) in patients with mild cognitive impairment or dementia without (EVOKE) and with significant small vessel brain disease (EVOKE plus) on cognitive outcomes over a period of 173 weeks. It is important to note, that GLP‐1 RAs are not only being investigated in individuals with T2DM or AD, but are also being explored as a potential treatment for PD. 157
TABLE 5.
Ongoing GLP‐1 RA clinical trials investigating cognitive changes
| Study | Drug (dose; duration) | Sample (age) | Study design | Outcomes | Status |
|---|---|---|---|---|---|
| Exenatide | |||||
| DRINN (NCT02847403) | Exenatide (s.c.) (2 mg/wk; 32 weeks total) | Dysglycemia/prediabetes with MCI (over 50 years old) N = 40 (estimated) | Phase 3 placebo‐controlled, randomized, parallel assignment, no masking (open label) |
Primary: Improvement of ADAS‐cog at 16 and at 32 weeks compared to baseline (V1) and placebo group. Secondary: Improvement in MMSE, phonemic verbal fluency test, semantic verbal fluency test, GDS, CDR, NPI, ADL, and IADL and changes neuronal connectivity (fMRI) |
Recruiting as of October 5, 2020 |
| University of Florida (NCT03456687) | Exenatide (s.c.) (2 mg/wk; 1 year total) | Early stage PD (40‐77 years old). N = 15 (estimated) | Phase 1 Single group, open label | Primary: MRI, change in free‐water accumulation in the substantia nigra, blood oxygen level‐dependent 157 signal in the posterior putamen, M1, and the supplementary motor area after 12 months (fMRI and structural MRI) | Active, not recruiting |
| Liraglutide | |||||
| ELAD (NCT01843075) | Liraglutide (s.c.) (0.6 mg/wk, escalated to 1.8 mg/wk within 4 weeks; 12 mo total) | Probable AD (over 50 years old) N = 204 | Phase 2 Placebo‐controlled, randomized, parallel group, quadruple masking (participant, care provider, investigator, assessor) |
Primary: Change in cerebral glucose metabolic rate after 12 months compared to placebo. Secondary: Change in z‐scores for the ADAS Exec, MRI changes, microglial activation, and CSF markers (tau and cortical amyloid) after 12 months |
Completed |
| Cedars‐Sinai Medical Center (NCT02953665) | Liraglutide (s.c.) (6 mg/mL/d at a maximum dose of 1.8 mg/d; 52 weeks total) | Idiopathic PD (25‐65 years old) N = 63 (estimated) | Phase 2 Placebo‐controlled, randomized, parallel assignment, quadruple masking (participant, care provider, investigator, outcomes assessor) |
Primary: Change in motor function (MDS‐UPDRS score; Part III), non‐motor function (NMSS score), and cognitive function (MADRS‐2) in the active treatment arm versus placebo between baseline, 28, and 54 weeks. Secondary: Change in peripheral IR (HoMA‐IR), total MDS‐UPDRS, functional status and quality of life (PDQ39), adverse events frequency in the active treatment arm versus placebo between baseline, 28, and 54 weeks |
Recruiting |
| Zhiming Zhu, Third Military Medical University (NCT03707171) | Liraglutide (s.c.) (0.6 mg/wk, and the dose will be escalated to 1.8 mg/wk within 4 weeks; 12 weeks total) | T2DM (18‐80 years old) N = 30 | Phase 3 placebo‐controlled, non‐randomized, parallel assignment, no masking (open label) |
Primary: Changes in cognitive function after 12 weeks (DST, RAVL, LDFR, TMT, ANT, CDT, MMSE, MES, functional near‐infrared spectroscopy). Secondary: Changes in systolic blood pressure, fasting plasma glucose, and other biomarkers |
Completed, results not yet published as of October 5, 2020 |
| Semaglutide | |||||
| GIPD (NCT03659682) | Semaglutide (s.c.) (1.0 mg/wk; 48 mo total) | Newly diagnosed PD (40‐77 years old) N = 120 (estimated) | Phase 2 Placebo‐controlled, crossover, delayed start design, quadruple masking (participant, care provider, investigator, outcomes assessor) | Primary: Change in motor functions (MDSR‐UPDRS Part III), nigrostriatal degeneration (DAT‐scan uptake), cognitive function (MME and MOCA, quality of life (EQFDQ, PDQ) and non‐motor symptoms of PD (NMSS) at 12, 24, 36, and 48 months in the treatment arm compared to baseline and placebo | Not yet recruiting |
| EVOKE (NCT04777396) | Oral Semaglutide once‐daily, dose gradually increased to 14 mg over 173 weeks | 1840 participants with MCI or mild AD (55‐85 years old) excluding participants with significant small brain vessel pathology | Phase 3 Randomized Double‐blind Placebo‐controlled Clinical Trial |
Primary: Change in the Clinical Dementia Rating–Sum of Boxes (CDR‐SB) score. Secondary: ADCS‐ADLMCI, Time to progression to dementia, ADAS‐Cog‐13, MoCA, ADCOMS, MMSE, NPI, high sensitivity C‐reactive protein, time to MACE, time to stroke, EQ‐5D‐5L |
Not yet recruiting |
| EVOKE plus (NCT04777409) | Oral Semaglutide once‐daily, dose gradually increased to 14 mg over 173 weeks | 1840 participants with MCI or mild AD (55‐85 years old) allowing participants with significant small brain vessel pathology | Phase 3 Randomized Double‐blind Placebo‐controlled Clinical Trial |
Primary: Change in the Clinical Dementia Rating–Sum of Boxes (CDR‐SB) score. Secondary: ADCS‐ADLMCI, Time to progression to dementia, ADAS‐Cog‐13, MoCA, ADCOMS, MMSE, NPI, high sensitivity C‐reactive protein, time to MACE, time to stroke, EQ‐5D‐5L |
Not yet recruiting |
1.10. Summary, recommendations, and future directions
Substantial evidence supports that dementia syndromes are associated with glucose hypometabolism in the brain. Whether restoring brain energy pathways can reverse synaptic loss and cognitive decline is yet to be determined. In contrast, T2DM and IR per se are associated with more subtle changes in executive function domains that reflect how systemic IR affects the function of the brain. Longstanding T2DM together with components of the metabolic syndrome (hypertension and dyslipidemia) can aggravate existing cognitive impairment and increase the risk of both ADd and VaD.
Recent preclinical studies and clinical trials suggest that GLP‐1 RAs can restore brain energy metabolism and BBB integrity, and attenuate neurovascular inflammation, offering some hope for reversing that process that leads to synaptic loss in the dementia syndromes. There is no current evidence that reversing brain glucose hypometabolism per se can treat or attenuate cognitive impairment in dementia syndromes. Glucose hypometabolism reflects a late‐stage neurodegenerative process and can help identify dementia subtypes. Restoring brain energy homeostasis may require several metabolic adjustments that not only involve glucose transport, but also other energy substrates (fatty acids, amino acids, and ketone bodies) that influence neurotransmission, Ca2+ flux, and synaptic activity. These interlinked metabolic systems may not be simply assessed by measuring only brain glucose uptake. Indeed, glucose uptake can be normal or hypermetabolic in cases of mild cognitive impairment despite evidence of brain pathology. GLP‐1 RA agonist treatment reverses several features of brain IR independent of effects on neuronal glucose uptake. As GLP‐1 RAs are being studied in patients with and without T2DM and dementia, a consideration of specific populations, novel biomarkers, and disease‐specific outcomes is warranted. We propose the following recommendations:
Additional research to standardize brain glucose uptake cut‐offs and regional distributions by FDG‐PET can help define specific disease phenotypes. Because ADd and VaD are heterogenous syndromes, regional glucose uptake changes identified by imaging can guide the selection of cognitive outcomes and refine patient selections for a greater chance of detecting a beneficial effect of treatment.
Functional connectivity, MRI‐dynamic contrast‐enhanced imaging of BBB integrity, 89 and synaptic imaging 158 are novel biomarkers that can provide insight into the functionality of the neurovascular unit and present attractive biomarkers for GLP‐RA development. Additional research is required, however, to validate these imaging modalities.
Imaging microglial and astrocytic activation are additional attractive modalities for future development that can guide the efficacy of GLP‐1 RA during early stages of the disease before the onset of hypometabolism.
Clinical outcomes in trials that target patients with T2DM and early VaD need to emphasize changes in executive function within cognitive domains.
The data reviewed do not support using Aβ biomarkers to guide the efficacy of GLP‐1 RA treatments.
2. METHODS
A systematic review of major literature reviews concerning brain glucose uptake and metabolism in association with T2DM and AD was performed on PubMed searching terms “Alzheimer's disease and Type 2 diabetes,” “brain IR,” “brain glucose metabolism and cognition,” “Alzheimer's disease and IR,” and “cognitive effects of Type 2 diabetes,” for articles published between 1993 and 2020. Sixty‐eight publications were included in this review. Of those publications, 29 were literature reviews.
Studies involving brain imaging modalities in MCI, AD, prediabetes, and diabetes were also compiled and summarized. Twenty‐seven articles involving fMRI in diabetic, prediabetic, AD, mildly cognitively impaired, and cognitively healthy populations from the years 2002 to 2017 were included in this review along with 14 publications involving FDG‐PET brain imaging in diabetic, prediabetic, AD, mildly cognitively impaired, and cognitively healthy populations from the years 2005 to 2019. Eight literature reviews were cited in our summary.
A review of published literature on pre‐clinical and clinical investigations involving GLP‐1, its receptor, its RAs, and cognition was also performed on PubMed searching terms “GLP1‐RA treatment effects on cognition,” “GLP 1 effects in the brain,” and “GLP 1 treatment in AD” from January 2003 until December 2020. Sixteen pre‐clinical studies and three clinical studies involving GLP‐1 RAs were included in this review. A query into ongoing clinical trials involving GLP‐1 RAs was also carried out via clinicaltrials.gov searching terms “Lixisenatide,” “Exenatide,” “Liraglutide,” “GLP‐1,” “Dulaglutide,” and “Semaglutide.” Only ongoing trials investigating cognition as a primary or secondary outcome were included in the summary table.
CONFLICT OF INTEREST
Hussein N. Yassine is the co‐chair of the Nutrition, Metabolism and Dementia Professional Interest Area (PIA), ISTAART. HCC sits on advisory panel of the Alzheimer's Association Los Angeles–no payments received. MNB is the director of the Masters in Neuroimaging and Informatics program at USC. Lon S. Schneider receives consulting fees from Abbott, AC Immune, Avraham, Ltd, Boehringer Ingelheim, Cognition Therapeutics, Cortexyme, Eisai, Fujifilm, Immunobrain Checkpoint Ltd, Neurally Inc, Neurim Ltd, Neuronix Ltd, Samus, Takeda, and vTv. All other authors report no other disclosures.
ACKNOWLEDGMENTS
Hussein N. Yassine was supported by R01AG055770, R01AG054434, and R01AG067063 from the National Institute on Aging and NIRG‐15‐361854 from the Alzheimer's Association. Konrad Talbot was supported by R01AG057658 and Cure Parkinson's Trust U.K. This work was also supported by P50AG05142 (HCC) from the National Institutes of Health. Lon S. Schneider was supported by the Della Martin Chair of Psychiatry and Neuroscience at USC, R01AG051346, R01AG062687, R01AG057684, and grants from Eisai, Eli Lilly, Roche/Genentech, Biogen, Biohaven, Novartis, and Washington University/NIA DIAN‐TU. Nasim Sheikh‐Bahaei was supported by RF1MH123223, P30AG066530, R01AG062007, and U01AG051218. Helena C. Chui was supported by P30 AG066530, P50AG05142, R01AG055770, and R01AG054434. Honorarium to KT was paid by the University of Southern California and the Seattle Institute for Biomedical and Clinical Research for symposium talks. All grants were made to the institutions. Funders had no role in study design, data collection, data analysis, interpretation, or writing of the report.
Yassine HN, Solomon V, Thakral A, et al. Brain energy failure in dementia syndromes: Opportunities and challenges for glucagon‐like peptide‐1 receptor agonists. Alzheimer's Dement. 2022;18:478–497. 10.1002/alz.12474
REFERENCES
- 1. Minoshima S, Cross DJ, Foster NL, Henry TR, Kuhl DE. Discordance between traditional pathologic and energy metabolic changes in very early Alzheimer's disease. Pathophysiological implications. Ann N Y Acad Sci. 1999;893:350‐352. [DOI] [PubMed] [Google Scholar]
- 2. Scheff SW, Neltner JH, Nelson PT. Is synaptic loss a unique hallmark of Alzheimer's disease? Biochem Pharmacol. 2014;88:517‐528. [DOI] [PMC free article] [PubMed] [Google Scholar]
- 3. Nation DA, Sweeney MD, Montagne A, et al. Blood–brain barrier breakdown is an early biomarker of human cognitive dysfunction. Nat Med. 2019;25:270‐276. [DOI] [PMC free article] [PubMed] [Google Scholar]
- 4. Iturria‐Medina Y, Sotero RC, Toussaint PJ, Mateos‐Pérez JM, Evans AC. Early role of vascular dysregulation on late‐onset Alzheimer's disease based on multifactorial data‐driven analysis. Nat Commun. 2016;7:11934. [DOI] [PMC free article] [PubMed] [Google Scholar]
- 5. Simpson IA, Chundu KR, Davies‐Hill T, Honer WG, Davies P. Decreased concentrations of GLUT1 and GLUT3 glucose transporters in the brains of patients with Alzheimer's disease. Ann Neurol. 1994;35:546‐551. [DOI] [PubMed] [Google Scholar]
- 6. Talbot K, Wang H‐Y, Kazi H, et al. Demonstrated brain insulin resistance in Alzheimer's disease patients is associated with IGF‐1 resistance, dysregulated IRS‐1, and cognitive decline. J Clin Invest. 2012;122:1316‐1338. [DOI] [PMC free article] [PubMed] [Google Scholar]
- 7. Mcintosh EC, Nation DA. Importance of treatment status in links between type 2 diabetes and Alzheimer's disease. Diabetes Care. 2019;42:972‐979. [DOI] [PMC free article] [PubMed] [Google Scholar]
- 8. Akimoto H, Negishi A, Oshima S, et al. Antidiabetic drugs for the risk of Alzheimer disease in patients with type 2 DM using FAERS. Am J Alzheimers Dis Other Demen. 2020;35:153331751989954. [DOI] [PMC free article] [PubMed] [Google Scholar]
- 9. Daniele G, Iozzo P, Molina‐Carrion M, et al. Exenatide regulates cerebral glucose metabolism in brain areas associated with glucose homeostasis and reward system. Diabetes. 2015;64:3406‐3412. [DOI] [PMC free article] [PubMed] [Google Scholar]
- 10. Gejl M, Brock B, Egefjord L, Vang K, Rungby J, Gjedde A. Blood‐brain glucose transfer in Alzheimer's disease: effect of GLP‐1 analog treatment. Sci Rep. 2017;7:17490. [DOI] [PMC free article] [PubMed] [Google Scholar]
- 11. Bangshaab M, Gutierrez A, Huynh KD, et al. Different mechanisms involved in liraglutide and glucagon‐like peptide‐1 vasodilatation in rat mesenteric small arteries. Br J Pharmacol. 2019;176:386‐399. [DOI] [PMC free article] [PubMed] [Google Scholar]
- 12. Spielman LJ, Gibson DL, Klegeris A. Incretin hormones regulate microglia oxidative stress, survival and expression of trophic factors. Eur J Cell Biol. 2017;96:240‐253. [DOI] [PubMed] [Google Scholar]
- 13. Wang X‐H, Yang W, Hölscher C, et al. Val⁸‐GLP‐1 remodels synaptic activity and intracellular calcium homeostasis impaired by amyloid β peptide in rats. J Neurosci Res. 2013;91:568‐577. [DOI] [PubMed] [Google Scholar]
- 14. Perry RJ, Wang Y, Cline GW, et al. Shulman Leptin mediates a glucose‐fatty acid cycle to maintain glucose homeostasis in starvation. Cell. 2018;172:234‐248.e17.e217. [DOI] [PMC free article] [PubMed] [Google Scholar]
- 15. Hasselbalch SG, Knudsen GM, Videbaek C, et al. No effect of insulin on glucose blood‐brain barrier transport and cerebral metabolism in humans. Diabetes. 1999;48:1915‐1921. [DOI] [PubMed] [Google Scholar]
- 16. Seaquist ER, Damberg GS, Tkac I, Gruetter R. The effect of insulin on in vivo cerebral glucose concentrations and rates of glucose transport/metabolism in humans. Diabetes. 2001;50:2203‐2209. [DOI] [PubMed] [Google Scholar]
- 17. Defronzo RA, Tripathy D. Skeletal muscle insulin resistance is the primary defect in type 2 diabetes. Diabetes Care. 2009;32(Suppl 2):S157‐S163. [DOI] [PMC free article] [PubMed] [Google Scholar]
- 18. Liu Y, Liu F, Grundke‐Iqbal I, Iqbal K, Gong C‐X. Brain glucose transporters, O‐GlcNAcylation and phosphorylation of tau in diabetes and Alzheimer's disease. J Neurochem. 2009;111:242‐249. [DOI] [PMC free article] [PubMed] [Google Scholar]
- 19. Tuulari JJ, Karlsson HK, Hirvonen J, et al. Weight loss after bariatric surgery reverses insulin‐induced increases in brain glucose metabolism of the morbidly obese. Diabetes. 2013;62:2747‐2751. [DOI] [PMC free article] [PubMed] [Google Scholar]
- 20. Liu H, Liu J, Peng L, et al. Changes in default mode network connectivity in different glucose metabolism status and diabetes duration. Neuroimage Clin. 2019;21:101629. [DOI] [PMC free article] [PubMed] [Google Scholar]
- 21. Rawlings AM, Sharrett AR, Schneider ALC, et al. Diabetes in midlife and cognitive change over 20 years, a cohort study. Ann Intern Med. 2014;161:785‐793. [DOI] [PMC free article] [PubMed] [Google Scholar]
- 22. Dash SK. Cognitive impairment and diabetes. Recent Pat Endocr Metab Immune Drug Discov. 2013;7:155‐165. [DOI] [PubMed] [Google Scholar]
- 23. Li X, Leng S, Song D. Link between type 2 diabetes and Alzheimer's disease: from epidemiology to mechanism and treatment. Clin Interv Aging. 2015;10:549‐560. [DOI] [PMC free article] [PubMed] [Google Scholar]
- 24. Janson J, Laedtke T, Parisi JE, O'brien P, Petersen RC, Butler PC. Increased risk of type 2 diabetes in Alzheimer disease. Diabetes. 2004;53:474‐481. [DOI] [PubMed] [Google Scholar]
- 25. Macesic M, Lalic MN, Kostic SV, et al. Impaired insulin sensitivity and secretion in patients with Alzheimer's disease: the relationship with other atherosclerosis risk factors. Curr Vasc Pharmacol. 2017;15:158‐166. [DOI] [PubMed] [Google Scholar]
- 26. Roberts RO, Knopman DS, Cha RH, et al. Diabetes and elevated hemoglobin A1c levels are associated with brain hypometabolism but not amyloid accumulation. J Nucl Med. 2014;55:759‐764. [DOI] [PMC free article] [PubMed] [Google Scholar]
- 27. Chui HC, Zheng L, Reed BR, Vinters HV, Mack WJ. Vascular risk factors and Alzheimer's disease: are these risk factors for plaques and tangles or for concomitant vascular pathology that increases the likelihood of dementia? An evidence‐based review. Alzheimer's Res Ther. 2012;3:1. [DOI] [PMC free article] [PubMed] [Google Scholar]
- 28. Tomita N, Furukawa K, Okamura N, et al. Brain accumulation of amyloid β protein visualized by positron emission tomography and BF‐227 in Alzheimer's disease patients with or without diabetes mellitus. Geriatr Gerontol Int. 2013;13:215‐221. [DOI] [PubMed] [Google Scholar]
- 29. Roberts RO, Knopman DS, Geda YE, et al. Association of diabetes with amnestic and nonamnestic mild cognitive impairment. Alzheimers Dement. 2014;10:18‐26. [DOI] [PMC free article] [PubMed] [Google Scholar]
- 30. Chih C‐P, Roberts EL Energy substrates for neurons during neural activity: a critical review of the astrocyte‐neuron lactate shuttle hypothesis. J Cereb Blood Flow Metab. 2003;23:1263‐1281. [DOI] [PubMed] [Google Scholar]
- 31. Svart M, Gormsen LC, Hansen J, et al. Regional cerebral effects of ketone body infusion with 3‐hydroxybutyrate in humans: reduced glucose uptake, unchanged oxygen consumption and increased blood flow by positron emission tomography. A randomized, controlled trial. PLoS One. 2018;13:e0190556‐e0190556. [DOI] [PMC free article] [PubMed] [Google Scholar]
- 32. Wolf AB, Caselli RJ, Reiman EM, Valla J. APOE and neuroenergetics: an emerging paradigm in Alzheimer's disease. Neurobiol Aging. 2013;34:1007‐1017. [DOI] [PMC free article] [PubMed] [Google Scholar]
- 33. Mosconi L, Berti V, Guyara‐Quinn C, et al. Perimenopause and emergence of an Alzheimer's bioenergetic phenotype in brain and periphery. PLoS One. 2017;12:e0185926. [DOI] [PMC free article] [PubMed] [Google Scholar]
- 34. Kerrouche N, Herholz K, Mielke R, Holthoff V, Baron J‐C. 18FDG PET in vascular dementia: differentiation from Alzheimer's disease using voxel‐based multivariate analysis. J Cereb Blood Flow Metab. 2006;26:1213‐1221. [DOI] [PubMed] [Google Scholar]
- 35. Hoffman JM, Welsh‐Bohmer KA, Hanson M, et al. FDG PET imaging in patients with pathologically verified dementia. J Nucl Med. 2000;41:1920‐1928. [PubMed] [Google Scholar]
- 36. Khachaturian ZS. Workgroup, A. s. A. C. H . Calcium Hypothesis of Alzheimer's disease and brain aging: a framework for integrating new evidence into a comprehensive theory of pathogenesis. Alzheimer's Dement. 2017;13:178‐182.e117. [DOI] [PubMed] [Google Scholar]
- 37. Hachinski V, Einhäupl K, Ganten D, et al. Preventing dementia by preventing stroke: the berlin manifesto. Alzheimers Dement. 2019;15, 961‐984. [DOI] [PMC free article] [PubMed] [Google Scholar]
- 38. Esteras N, Abramov AY. Mitochondrial calcium deregulation in the mechanism of beta‐amyloid and tau pathology. Cells. 2020;9:2135. [DOI] [PMC free article] [PubMed] [Google Scholar]
- 39. Yassine HN, Finch CE. APOE alleles and diet in brain aging and Alzheimer's disease. Front Aging Neurosci. 2020;12:150. [DOI] [PMC free article] [PubMed] [Google Scholar]
- 40. Klosinski LP, Yao J, Yin F, et al. White matter lipids as a ketogenic fuel supply in aging female brain: implications for Alzheimer's disease. EBioMedicine. 2015;2:1888‐1904. [DOI] [PMC free article] [PubMed] [Google Scholar]
- 41. Sato H, Taketomi Y, Murakami M. Metabolic regulation by secreted phospholipase A2. Inflamm Regen. 2016;36:7. [DOI] [PMC free article] [PubMed] [Google Scholar]
- 42. Schönfeld P, Reiser G. Why does brain metabolism not favor burning of fatty acids to provide energy? Reflections on disadvantages of the use of free fatty acids as fuel for brain. J Cereb Blood Flow Metab. 2013;33:1493‐1499. [DOI] [PMC free article] [PubMed] [Google Scholar]
- 43. Cunnane SC, Trushina E, Morland C, et al. Brain energy rescue: an emerging therapeutic concept for neurodegenerative disorders of ageing. Nat Rev Drug Discovery. 2020;19:609‐633. [DOI] [PMC free article] [PubMed] [Google Scholar]
- 44. Morisco C, Lembo G, Trimarco B. Insulin resistance and cardiovascular risk: new insights from molecular and cellular biology. Trends Cardiovasc Med. 2011;16:183‐188. [DOI] [PubMed] [Google Scholar]
- 45. Goldstein BJ. Insulin resistance as the core defect in type 2 diabetes mellitus. Am J Cardiol. 2002;90:3‐10. [DOI] [PubMed] [Google Scholar]
- 46. Sloviter HA, Yamada H. Absence of direct action of insulin on metabolism of the isolated perfused rat brain. J Neurochem. 1971;18:1269‐1274. [DOI] [PubMed] [Google Scholar]
- 47. Diamond I, Fishman RA. High affinity transport of 2‐deoxyglucose in isolated synaptic nerve endings. Nature. 1973;242:122‐123. [DOI] [PubMed] [Google Scholar]
- 48. Bhattacharyya MV, Brodsky JL. Characterization of the glucose transporter from rat brain synaptosomes. Biochem Biophys Res Commun. 1988;155:685‐691. [DOI] [PubMed] [Google Scholar]
- 49. Uemura E, Greenlee HW. Insulin regulates neuronal glucose uptake by promoting translocation of glucose transporter GLUT3. Exp Neurol. 2006;198:48‐53. [DOI] [PubMed] [Google Scholar]
- 50. Heni M, Hennige AM, Peter A, et al. Insulin promotes glycogen storage and cell proliferation in primary human astrocytes. PLoS One. 2011;6:e21594. [DOI] [PMC free article] [PubMed] [Google Scholar]
- 51. Muhič M, Vardjan N, Chowdhury HH, Zorec R, Kreft M. Insulin and IGF‐1 modulate cytoplasmic glucose and glycogen levels but not glucose transport across the membrane in astrocytes. J Biol Chem. 2015;290(17):11167‐11176. [DOI] [PMC free article] [PubMed] [Google Scholar]
- 52. Hill JM, Lesniak MA, Pert CB, Roth J. Autoradiographic localization of insulin receptors in rat brain: prominence in olfactory and limbic areas. Neuroscience. 1986;17:1127‐1138. [DOI] [PubMed] [Google Scholar]
- 53. Pocai A, Lam TKT, Gutierrez‐Juarez R, et al. Hypothalamic K(ATP) channels control hepatic glucose production. Nature. 2005;434:1026‐1031. [DOI] [PubMed] [Google Scholar]
- 54. Niswender KD, Morrison CD, Clegg DJ, et al. Insulin activation of phosphatidylinositol 3‐kinase in the hypothalamic arcuate nucleus: a key mediator of insulin‐induced anorexia. Diabetes. 2003;52:227‐231. [DOI] [PubMed] [Google Scholar]
- 55. Obici S, Feng Z, Morgan K, Stein D, Karkanias G, Rossetti L. Central administration of oleic acid inhibits glucose production and food intake. Diabetes. 2002;51:271‐275. [DOI] [PubMed] [Google Scholar]
- 56. Gelling RW, Morton GJ, Morrison CD, et al. Insulin action in the brain contributes to glucose lowering during insulin treatment of diabetes. Cell Metab. 2006;3:67‐73. [DOI] [PubMed] [Google Scholar]
- 57. Gruetter R, Ugurbil K, Seaquist ER. Steady‐state cerebral glucose concentrations and transport in the human brain. J Neurochem. 1998;70:397‐408. [DOI] [PubMed] [Google Scholar]
- 58. Pardridge WM, Triguero D, Farrell CR. Downregulation of blood‐brain barrier glucose transporter in experimental diabetes. Diabetes. 1990;39:1040‐1044. [DOI] [PubMed] [Google Scholar]
- 59. Duelli R, Maurer MH, Staudt R, Heiland S, Duembgen L, Kuschinsky W. Increased cerebral glucose utilization and decreased glucose transporter Glut1 during chronic hyperglycemia in rat brain. Brain Res. 2000;858:338‐347. [DOI] [PubMed] [Google Scholar]
- 60. Hwang JJ, Jiang L, Hamza M, et al. Blunted rise in brain glucose levels during hyperglycemia in adults with obesity and T2DM. JCI Insight. 2017;2:e95913. [DOI] [PMC free article] [PubMed] [Google Scholar]
- 61. Hwang JJ, Jiang L, Sanchez Rangel E, et al. Glycemic variability and brain glucose levels in type 1 diabetes. Diabetes. 2019;68:163‐171. [DOI] [PMC free article] [PubMed] [Google Scholar]
- 62. Shapiro ET, Cooper M, Chen C‐T, Given BD, Polonsky KS. Change in hexose distribution volume and fractional utilization of [18F]‐2‐deoxy‐2‐fluoro‐D‐glucose in brain during acute hypoglycemia in humans. Diabetes. 1990;39:175. [DOI] [PubMed] [Google Scholar]
- 63. Pearson‐Leary J, Mcnay EC. Novel roles for the insulin‐regulated glucose transporter‐4 in hippocampally dependent memory. J Neurosci. 2016;36:11851‐11864. [DOI] [PMC free article] [PubMed] [Google Scholar]
- 64. Harr SD, Simonian NA, Hyman BT. Functional alterations in Alzheimer's disease: decreased glucose transporter 3 immunoreactivity in the perforant pathway terminal zone. J Neuropathol Exp Neurol. 1995;54:38‐41. [PubMed] [Google Scholar]
- 65. Koepsell H. Glucose transporters in brain in health and disease. Pflügers Arch. 2020;472:1299‐1343. [DOI] [PMC free article] [PubMed] [Google Scholar]
- 66. Jagust WJ, Seab JP, Huesman RH, et al. Diminished glucose transport in Alzheimer's disease: dynamic PET studies. J Cereb Blood Flow Metab. 1991;11:323‐330. [DOI] [PubMed] [Google Scholar]
- 67. Liu Y, Liu F, Iqbal K, Grundke‐Iqbal I, Gong C‐X Decreased glucose transporters correlate to abnormal hyperphosphorylation of tau in Alzheimer disease. FEBS Lett. 2008;582:359‐364. [DOI] [PMC free article] [PubMed] [Google Scholar]
- 68. Mcnay EC, Ong CT, Mccrimmon RJ, Cresswell J, Bogan JS, Sherwin RS. Hippocampal memory processes are modulated by insulin and high‐fat‐induced insulin resistance. Neurobiol Learn Mem. 2010;93:546‐553. [DOI] [PMC free article] [PubMed] [Google Scholar]
- 69. Fujisawa Y, Sasaki K, Akiyama K. Increased insulin levels after OGTT load in peripheral blood and cerebrospinal fluid of patients with dementia of Alzheimer type. Biol Psychiatry. 1991;30:1219‐1228. [DOI] [PubMed] [Google Scholar]
- 70. An Y, Varma VR, Varma S, et al. Evidence for brain glucose dysregulation in Alzheimer's disease. Alzheimer's Dement. 2018;14:318‐329. [DOI] [PMC free article] [PubMed] [Google Scholar]
- 71. Mullins R, Reiter D, Kapogiannis D Magnetic resonance spectroscopy reveals abnormalities of glucose metabolism in the Alzheimer's brain. Ann Clin Transl Neurol. 2018;5, 262‐272. [DOI] [PMC free article] [PubMed] [Google Scholar]
- 72. Watson KT, Wroolie TE, Tong G, et al. Neural correlates of liraglutide effects in persons at risk for Alzheimer's disease. Behav Brain Res. 2019;356:271‐278. [DOI] [PubMed] [Google Scholar]
- 73. Morris JK, Vidoni ED, Honea RA, Burns JM. Impaired glycemia increases disease progression in mild cognitive impairment. Neurobiol Aging. 2014a;5:585‐589. [DOI] [PMC free article] [PubMed] [Google Scholar]
- 74. Mielke JG, Taghibiglou C, Liu L, et al. A biochemical and functional characterization of diet‐induced brain insulin resistance. J Neurochem. 2005;93:1568‐1578. [DOI] [PubMed] [Google Scholar]
- 75. Calvo‐Ochoa E, Hernández‐Ortega K, Ferrera P, Morimoto S, Arias C Short‐term high‐fat‐and‐fructose feeding produces insulin signaling alterations accompanied by neurite and synaptic reduction and astroglial activation in the rat hippocampus. J Cereb Blood Flow Metab. 2014;34:1001‐1008. [DOI] [PMC free article] [PubMed] [Google Scholar]
- 76. Kothari V, Luo Y, Tornabene T, et al. High fat diet induces brain insulin resistance and cognitive impairment in mice. Biochim et Biophys Acta. 2017;1863:499‐508. [DOI] [PubMed] [Google Scholar]
- 77. Wakabayashi T, Yamaguchi K, Matsui K, et al. Differential effects of diet‐ and genetically‐induced brain insulin resistance on amyloid pathology in a mouse model of Alzheimer's disease. Mol Neurodegener. 2019;14:15. [DOI] [PMC free article] [PubMed] [Google Scholar]
- 78. Chiaravalloti A, Fiorentini A, Francesco U, et al. Is cerebral glucose metabolism related to blood‐brain barrier dysfunction and intrathecal IgG synthesis in Alzheimer disease?: A 18F‐FDG PET/CT study. Medicine (Baltimore). 2016;95:e4206. [DOI] [PMC free article] [PubMed] [Google Scholar]
- 79. Chen Z, Zhong C. Decoding Alzheimer's disease from perturbed cerebral glucose metabolism: implications for diagnostic and therapeutic strategies. Prog Neurobiol. 2013;108:21‐43. [DOI] [PubMed] [Google Scholar]
- 80. Muzic RF, Chandramouli V, Huang H‐M, Wu C, Wang Y, Ismail‐Beigi F. Analysis of metabolism of 6FDG: a PET glucose transport tracer. Nucl Med Biol. 2011;38:667‐674. [DOI] [PMC free article] [PubMed] [Google Scholar]
- 81. Calsolaro V, Edison P. Alterations in glucose metabolism in Alzheimer's disease. Recent Pat Endocr Metab Immune Drug Discov. 2016;10, 31‐39. [DOI] [PubMed] [Google Scholar]
- 82. Marcus C, Mena E, Subramaniam RM. Brain PET in the diagnosis of Alzheimer's disease. Clin Nucl Med. 2014;39:e413‐e426; quiz e423‐416. [DOI] [PMC free article] [PubMed] [Google Scholar]
- 83. Ishii K. PET approaches for diagnosis of dementia. AJNR Am J Neuroradiol. 2014;35:2030‐2038. [DOI] [PMC free article] [PubMed] [Google Scholar]
- 84. Berti V, Mosconi L, Pupi A. Brain: normal variations and benign findings in fluorodeoxyglucose‐PET/computed tomography imaging. PET Clin. 2014;9:129‐140. [DOI] [PMC free article] [PubMed] [Google Scholar]
- 85. Rocher AB, Chapon F, Blaizot X, Baron J‐C, Chavoix C. Resting‐state brain glucose utilization as measured by PET is directly related to regional synaptophysin levels: a study in baboons. Neuroimage. 2003;20:1894‐1898. [DOI] [PubMed] [Google Scholar]
- 86. Mosconi L. Brain glucose metabolism in the early and specific diagnosis of Alzheimer's disease. FDG‐PET studies in MCI and AD. Eur J Nucl Med Mol Imaging. 2005;32:486‐510. [DOI] [PubMed] [Google Scholar]
- 87. Silverman DHS, Small GW, Chang CY, et al. Positron emission tomography in evaluation of dementia: regional brain metabolism and long‐term outcome. JAMA. 2001;286:2120‐2127. [DOI] [PubMed] [Google Scholar]
- 88. Minoshima S, Foster NL, Sima AAF, Frey KA, Albin RL, Kuhl DE. Alzheimer's disease versus dementia with Lewy bodies: cerebral metabolic distinction with autopsy confirmation. Ann Neurol. 2001;50:358‐365. [DOI] [PubMed] [Google Scholar]
- 89. Montagne A, Barnes SR, Sweeney MD, et al. Blood‐brain barrier breakdown in the aging human hippocampus. Neuron. 2015;85:296‐302. [DOI] [PMC free article] [PubMed] [Google Scholar]
- 90. Hirvonen J, Virtanen KA, Nummenmaa L, et al. Effects of insulin on brain glucose metabolism in impaired glucose tolerance. Diabetes. 2011;60:443‐447. [DOI] [PMC free article] [PubMed] [Google Scholar]
- 91. Willette AA, Bendlin BB, Starks EJ, et al. Association of insulin resistance with cerebral glucose uptake in late middle‐aged adults at risk for Alzheimer disease. JAMA Neurol. 2015;72:1013‐1020. [DOI] [PMC free article] [PubMed] [Google Scholar]
- 92. Baker LD, Cross DJ, Minoshima S, Belongia D, Watson GS, Craft S. Insulin resistance and Alzheimer‐like reductions in regional cerebral glucose metabolism for cognitively normal adults with prediabetes or early type 2 diabetes. Arch Neurol. 2011;68:51‐57. [DOI] [PMC free article] [PubMed] [Google Scholar]
- 93. Attwell D, Buchan AM, Charpak S, Lauritzen M, Macvicar BA, Newman EA. Glial and neuronal control of brain blood flow. Nature. 2010;468:232‐243. [DOI] [PMC free article] [PubMed] [Google Scholar]
- 94. Pellerin L, Magistretti PJ. Glutamate uptake into astrocytes stimulates aerobic glycolysis: a mechanism coupling neuronal activity to glucose utilization. Proc Natl Acad Sci U S A. 1994;91:10625‐10629. [DOI] [PMC free article] [PubMed] [Google Scholar]
- 95. Greicius MD, Supekar K, Menon V, Dougherty RF. Resting‐state functional connectivity reflects structural connectivity in the default mode network. Cereb Cortex. 2009;19:72‐78. [DOI] [PMC free article] [PubMed] [Google Scholar]
- 96. Van Den Heuvel M, Mandl R, Luigjes J, Hulshoff Pol H. Microstructural organization of the cingulum tract and the level of default mode functional connectivity. J Neurosci. 2008;28:10844‐10851. [DOI] [PMC free article] [PubMed] [Google Scholar]
- 97. Aiello M, Salvatore E, Cachia A, et al. Relationship between simultaneously acquired resting‐state regional cerebral glucose metabolism and functional MRI: a PET/MR hybrid scanner study. Neuroimage. 2015;113:111‐121. [DOI] [PubMed] [Google Scholar]
- 98. Xu J, Chen F, Liu T, et al. Brain functional networks in type 2 diabetes mellitus patients: a resting‐state functional MRI Study. Front Neurosci. 2019;13:239‐239. [DOI] [PMC free article] [PubMed] [Google Scholar]
- 99. Frank S, Wilms B, Veit R, et al. Altered brain activity in severely obese women may recover after Roux‐en Y gastric bypass surgery. Int J Obes (Lond). 2014;38:341‐348. [DOI] [PubMed] [Google Scholar]
- 100. Sorg C, Riedl V, Muhlau M, et al. Selective changes of resting‐state networks in individuals at risk for Alzheimer's disease. Proc Natl Acad Sci U S A. 2007;104:18760‐18765. [DOI] [PMC free article] [PubMed] [Google Scholar]
- 101. Kim HJ, Cha J, Lee J‐M, et al. Distinctive resting state network disruptions among Alzheimer's disease, subcortical vascular dementia, and mixed dementia patients. J Alzheimers Dis. 2016;50:709‐718. [DOI] [PubMed] [Google Scholar]
- 102. Manschot SM, Brands AMA, Van Der Grond J, et al. Brain magnetic resonance imaging correlates of impaired cognition in patients with Type 2 diabetes. Diabetes. 2006;55:1106‐1113. [DOI] [PubMed] [Google Scholar]
- 103. Vincent C, Hall PA. Executive function in adults with type 2 diabetes: a meta‐analytic review. Psychosom Med. 2015;5:631‐642. [DOI] [PubMed] [Google Scholar]
- 104. Sadanand S, Balachandar R, Bharath S. Memory and executive functions in persons with type 2 diabetes: a meta‐analysis. Diabetes Metab Res Rev. 2016;32:132‐142. [DOI] [PubMed] [Google Scholar]
- 105. Yassine HN, Anderson A, Brinton R, et al. Do menopausal status and APOE4 genotype alter the long‐term effects of intensive lifestyle intervention on cognitive function in women with type 2 diabetes mellitus? Neurobiol Aging. 2020;92:61‐72. [DOI] [PMC free article] [PubMed] [Google Scholar]
- 106. Sano M, Zhu CW, Grossman H, Schimming C. Longitudinal cognitive profiles in diabetes: results from the national Alzheimer's coordinating center's uniform data. J Am Geriatr Soc. 2017;65, 2198‐2204. [DOI] [PMC free article] [PubMed] [Google Scholar]
- 107. Vogel JW, Young AL, Oxtoby NP, et al. Four distinct trajectories of tau deposition identified in Alzheimer's disease. Nat Med. 2021;27(5):871‐881. [DOI] [PMC free article] [PubMed] [Google Scholar]
- 108. Cantini G, Mannucci E, Luconi M. Perspectives in GLP‐1 research: new targets, new receptors. Trends Endocrinol Metab. 2016;27:427‐438. [DOI] [PubMed] [Google Scholar]
- 109. Trier S, Linderoth L, Bjerregaard S, Andresen TL, Rahbek UL Acylation of glucagon‐like peptide‐2: interaction with lipid membranes and in vitro intestinal permeability. PLoS One. 2014;9:e109939. [DOI] [PMC free article] [PubMed] [Google Scholar]
- 110. Secher A, Jelsing J, Baquero AF, et al. The arcuate nucleus mediates GLP‐1 receptor agonist liraglutide‐dependent weight loss. J Clin Invest. 2014;124:4473‐4488. [DOI] [PMC free article] [PubMed] [Google Scholar]
- 111. Helms HCC, Gallett S, Imbernon M, et al. In Abstract 235 from the 12th International Conference on Cerebral Vascular Biology . Melbourne, Australia; 2017. [Google Scholar]
- 112. Kastin AJ, Akerstrom V. Entry of exendin‐4 into brain is rapid but may be limited at high doses. Int J Obes Relat Metab Disord. 2003;27:313‐318. [DOI] [PubMed] [Google Scholar]
- 113. Alvarez E, Martinez MD, Roncero I, et al. The expression of GLP‐1 receptor mRNA and protein allows the effect of GLP‐1 on glucose metabolism in the human hypothalamus and brainstem. J Neurochem. 2005;92:798‐806. [DOI] [PubMed] [Google Scholar]
- 114. Hamilton A, Hölscher C. Receptors for the incretin glucagon‐like peptide‐1 are expressed on neurons in the central nervous system. Neuroreport. 2009;20:1161‐1166. [DOI] [PubMed] [Google Scholar]
- 115. Isacson R, Nielsen E, Dannaeus K, et al. The glucagon‐like peptide 1 receptor agonist exendin‐4 improves reference memory performance and decreases immobility in the forced swim test. Eur J Pharmacol. 2011;650:249‐255. [DOI] [PubMed] [Google Scholar]
- 116. Gu G, Roland B, Tomaselli K, Dolman CS, Lowe C, Heilig JS. Glucagon‐like peptide‐1 in the rat brain: distribution of expression and functional implication. J Comp Neurol. 2012;521:2235‐2261. [DOI] [PubMed] [Google Scholar]
- 117. Cork SC, Richards JE, Holt MK, Gribble FM, Reimann F, Trapp S. Distribution and characterisation of glucagon‐like peptide‐1 receptor expressing cells in the mouse brain. Mol Metab. 2015;4:718‐731. [DOI] [PMC free article] [PubMed] [Google Scholar]
- 118. Trapp S, Cork SC PPG neurons of the lower brain stem and their role in brain GLP‐1 receptor activation. Am J Physiol. 2015;309:R795‐R804. [DOI] [PMC free article] [PubMed] [Google Scholar]
- 119. Farr OM, Sofopoulos M, Tsoukas MA, et al. GLP‐1 receptors exist in the parietal cortex, hypothalamus and medulla of human brains and the GLP‐1 analogue liraglutide alters brain activity related to highly desirable food cues in individuals with diabetes: a crossover, randomised, placebo‐controlled trial. Diabetologia. 2016;59:954‐965. [DOI] [PMC free article] [PubMed] [Google Scholar]
- 120. Christensen M, Sparre‐Ulrich AH, Hartmann B, et al. Transfer of liraglutide from blood to cerebrospinal fluid is minimal in patients with type 2 diabetes. Int J Obes. 2015;39:1651‐1654. [DOI] [PubMed] [Google Scholar]
- 121. Müller TD, Finan B, Bloom SR, et al. Glucagon‐like peptide 1 (GLP‐1). Mol Metab. 2019;30:72‐130. [DOI] [PMC free article] [PubMed] [Google Scholar]
- 122. Gejl M, Lerche S, Egefjord L, et al. Glucagon‐like peptide‐1 (GLP‐1) raises blood‐brain glucose transfer capacity and hexokinase activity in human brain. Front Neuroenergetics. 2013;5:2. [DOI] [PMC free article] [PubMed] [Google Scholar]
- 123. Fu Z, Gong L, Liu J, et al. Brain endothelial cells regulate glucagon‐like peptide 1 entry into the brain via a receptor‐mediated process. Front Physiol. 2020;11:555. [DOI] [PMC free article] [PubMed] [Google Scholar]
- 124. Stobart JL, Anderson CM. Multifunctional role of astrocytes as gatekeepers of neuronal energy supply. Front Cell Neurosci. 2013;7:38. [DOI] [PMC free article] [PubMed] [Google Scholar]
- 125. Sibson NR, Dhankhar A, Mason GF, Rothman DL, Behar KL, Shulman RG. Stoichiometric coupling of brain glucose metabolism and glutamatergic neuronal activity. Proc Natl Acad Sci U S A. 1998;95:316‐321. [DOI] [PMC free article] [PubMed] [Google Scholar]
- 126. Tourigny DS, Karim MKA, Echeveste R, Kotter MRN, O'neill JS. Energetic substrate availability regulates synchronous activity in an excitatory neural network. PLoS One. 2019;14:e0220937. [DOI] [PMC free article] [PubMed] [Google Scholar]
- 127. Falkowska A, Gutowska I, Goschorska M, Nowacki P, Chlubek D, Baranowska‐Bosiacka I. Energy metabolism of the brain, including the cooperation between astrocytes and neurons, especially in the context of glycogen metabolism. Int J Mol Sci. 2015;16:25959‐25981. [DOI] [PMC free article] [PubMed] [Google Scholar]
- 128. Ashrafi G, Wu Z, Farrell RJ, Ryan TA. Glut4 mobilization supports energetic demands of active synapses. Neuron. 2017;93:606‐615.e3. [DOI] [PMC free article] [PubMed] [Google Scholar]
- 129. Pearson‐Leary J, Mcnay EC. Novel roles for the insulin‐regulated glucose transporter‐4 in hippocampally dependent memory. J Neurosci. 2016;36:11851‐11864. [DOI] [PMC free article] [PubMed] [Google Scholar]
- 130. Meng W, Tobin JR, Busija DW. Glutamate‐induced cerebral vasodilation is mediated by nitric oxide through N‐Methyl‐d‐aspartate receptors. Stroke. 1995;26:857‐863. [DOI] [PubMed] [Google Scholar]
- 131. Lee WL, Klip A. Shuttling glucose across brain microvessels, with a little help from GLUT1 and AMP kinase. Focus on “AMP kinase regulation of sugar transport in brain capillary endothelial cells during acute metabolic stress”. Cell Physiol. 2012;303:C803–C805. [DOI] [PMC free article] [PubMed] [Google Scholar]
- 132. Gejl M, Gjedde A, Egefjord L, et al. In Alzheimer's disease, 6‐month treatment with GLP‐1 analog prevents decline of brain glucose metabolism: randomized, placebo‐controlled, double‐blind clinical trial. Front Aging Neurosci. 2016;8:108. [DOI] [PMC free article] [PubMed] [Google Scholar]
- 133. Talbot K, Wang H‐Y. The nature, significance, and GLP‐1 analogue treatment of brain insulin resistance in Alzheimer's disease. Alzheimer's Dement. 2014;10:S12‐S25. [DOI] [PMC free article] [PubMed] [Google Scholar]
- 134. Bomfim TR, Forny‐Germano L, Sathler LB, et al. An anti‐diabetes agent protects the mouse brain from defective insulin signaling caused by Alzheimer's disease–associated Aβ oligomers. J Clin Invest. 2012;122:1339‐1353. [DOI] [PMC free article] [PubMed] [Google Scholar]
- 135. Sharma MK, Jalewa J, Hölscher C. Neuroprotective and anti‐apoptotic effects of liraglutide on SH‐SY5Y cells exposed to methylglyoxal stress. J Neurochem. 2014;128:459‐471. [DOI] [PubMed] [Google Scholar]
- 136. Lee Y‐S, Jun H‐S. Anti‐inflammatory effects of GLP‐1‐based therapies beyond glucose control. Mediators Inflamm. 2016;2016:3094642. [DOI] [PMC free article] [PubMed] [Google Scholar]
- 137. Oh Y, Jun H‐S. Effects of glucagon‐like peptide‐1 on oxidative stress and Nrf2 signaling. Int J Mol Sci. 2018;19:26. [DOI] [PMC free article] [PubMed] [Google Scholar]
- 138. Nauck MA, Meier JJ, Cavender MA, Abd El Aziz M, Drucker DJ. Cardiovascular actions and clinical outcomes with glucagon‐like peptide‐1 receptor agonists and dipeptidyl peptidase‐4 inhibitors. Circ Res. 2017;136:849‐870. [DOI] [PubMed] [Google Scholar]
- 139. Bao Y, Jiang L, Chen H, Zou J, Liu Z, Shi Y. The neuroprotective effect of liraglutide is mediated by glucagon‐like peptide 1 receptor‐mediated activation of cAMP/& 2366‐2378., P. C. p. C. P. a. B. The neuroprotective effect of liraglutide is mediated by glucagon‐like peptide 1 receptor‐mediated activation of cAMP/PKA/CREB pathway. Cell Physiol Biochem. 2015;36:2366‐2378. [DOI] [PubMed] [Google Scholar]
- 140. Bomba M, Granzotto A, Castelli V, et al. Exenatide exerts cognitive effects by modulating the BDNF‐TrkB neurotrophic axis in adult mice. Neurobiol Aging. 2017;64:33‐43. [DOI] [PubMed] [Google Scholar]
- 141. Mcclean PL, Parthsarathy V, Faivre E, Holscher C. The diabetes drug liraglutide prevents degenerative processes in a mouse model of Alzheimer's disease. J Neurosci. 2011;31:6587‐6594. [DOI] [PMC free article] [PubMed] [Google Scholar]
- 142. During MJ, Cao L, Zuzga DS, et al. Glucagon‐like peptide‐1 receptor is involved in learning and neuroprotection. Nat Med. 2003;9:1173‐1179. [DOI] [PubMed] [Google Scholar]
- 143. Gedulin BR, Nikoulina SE, Smith PA, et al. Exenatide (exendin‐4) improves insulin sensitivity and {beta}‐cell mass in insulin‐resistant obese fa/fa Zucker rats independent of glycemia and body weight. Endocrinology. 2005;146:2069‐2076. [DOI] [PubMed] [Google Scholar]
- 144. Mells JE, Fu PP, Sharma S, et al. Glp‐1 analog, liraglutide, ameliorates hepatic steatosis and cardiac hypertrophy in C57BL/6J mice fed a Western diet. Am J Physiol Gastrointest Liver Physiol. 2012;302:G225‐G235. [DOI] [PMC free article] [PubMed] [Google Scholar]
- 145. Gastaldelli A, Brodows RG, D'alessio D. The effect of chronic twice daily exenatide treatment on β‐cell function in new onset type 2 diabetes. Clin Endocrinol (Oxf). 2014;80:545‐553. [DOI] [PubMed] [Google Scholar]
- 146. Noyan‐Ashraf MH, Shikatani EA, Schuiki I, et al. A glucagon‐like peptide‐1 analog reverses the molecular pathology and cardiac dysfunction of a mouse model of obesity. Circulation. 2013;127:74‐85. [DOI] [PubMed] [Google Scholar]
- 147. Fonseca VA, Capehorn MS, Garg SK, et al. Reductions in insulin resistance are mediated primarily via weight loss in subjects with type 2 diabetes on semaglutide. J Clin Endocrinol Metab. 2019:4078‐4086. [DOI] [PubMed] [Google Scholar]
- 148. Bomba M, Ciavardelli D, Silvestri E, et al. Exenatide promotes cognitive enhancement and positive brain metabolic changes in PS1‐KI mice but has no effects in 3xTg‐AD animals. Cell Death Dis. 2013;4:e612‐e612. [DOI] [PMC free article] [PubMed] [Google Scholar]
- 149. Zhao L, Li Z, Vong JSL, et al. Pharmacologically reversible zonation‐dependent endothelial cell transcriptomic changes with neurodegenerative disease associations in the aged brain. Nat Commun. 2020;11:4413. [DOI] [PMC free article] [PubMed] [Google Scholar]
- 150. Gault VA, Porter WD, Flatt PR, Hölscher C. Actions of exendin‐4 therapy on cognitive function and hippocampal synaptic plasticity in mice fed a high‐fat diet. Int J Obes (Lond). 2010;34:1341‐1344. [DOI] [PubMed] [Google Scholar]
- 151. Lennox R, Flatt PR, Gault VA. Lixisenatide improves recognition memory and exerts neuroprotective actions in high‐fat fed mice. Peptides. 2014;61:38‐47. [DOI] [PubMed] [Google Scholar]
- 152. Jia X‐T, Ye‐Tian, Yuan‐Li, et al. Exendin‐4, a glucagon‐like peptide 1 receptor agonist, protects against amyloid‐β peptide‐induced impairment of spatial learning and memory in rats. Physiol Behav. 2016;159:72‐79. [DOI] [PubMed] [Google Scholar]
- 153. Mcclean PL, Hölscher C. Lixisenatide, a drug developed to treat type 2 diabetes, shows neuroprotective effects in a mouse model of Alzheimer's disease. Neuropharmacology. 2014;86, 241‐258. [DOI] [PubMed] [Google Scholar]
- 154. Daniele G, Iozzo P, Molina‐Carrion M, et al. Exenatide regulates cerebral glucose metabolism in brain areas associated with glucose homeostasis and reward system. Diabetes. 2015;64:3406. [DOI] [PMC free article] [PubMed] [Google Scholar]
- 155. Gejl M, Egefjord L, Lerche S, et al. Glucagon‐like peptide‐1 decreases intracerebral glucose content by activating hexokinase and changing glucose clearance during hyperglycemia. J Cereb Blood Flow Metab. 2012;32:2146‐2152. [DOI] [PMC free article] [PubMed] [Google Scholar]
- 156. Ballard C, Nørgaard CH, Friedrich S, et al. Liraglutide and semaglutide: pooled post hoc analysis to evaluate risk of dementia in patients with type 2 diabetes. Alzheimer's Dement. 2020;16, e042909. [Google Scholar]
- 157. Molnar G, Farago N, Kocsis AK, et al. GABAergic neurogliaform cells represent local sources of insulin in the cerebral cortex. J Neurosci. 2014;34:1133–1137. [DOI] [PMC free article] [PubMed] [Google Scholar]
- 158. Bastin C, Bahri MA, Meyer F, et al. In vivo imaging of synaptic loss in Alzheimer's disease with [18F]UCB‐H positron emission tomography. Eur J Nucl Med Mol Imaging. 2020;47:390‐402. [DOI] [PubMed] [Google Scholar]
- 159. Zheng H, Cai Li, Rinaman L. Distribution of glucagon‐like peptide 1‐ immunopositive neurons in human caudal medulla. Brain Struct Funct. 2015;220:1213‐1219. [DOI] [PMC free article] [PubMed] [Google Scholar]
- 160. Simpson IA, Carruthers A, Vannucci SJ. Supply and demand in cerebral energy metabolism: the role of nutrient transporters. J Cereb Blood Flow Metab. 2007;27:1766‐1791. [DOI] [PMC free article] [PubMed] [Google Scholar]
- 161. Simmons R. Cell glucose transport and glucose handling during fetal and neonatal development. Fetal Neonat Physiol. 2017;1:428‐435. [Google Scholar]
- 162. Thorens B. GLUT2, glucose sensing and glucose homeostasis. Diabetelogia. 2014;58:221‐232. [DOI] [PubMed] [Google Scholar]
- 163. Fladeby C, Skar R, Serck‐Hanssen G. Distinct regulation of glucose transport and GLUT1/GLUT3 transporters by glucose deprivation and IGF‐I in chromaffin cells. Biochim Biophys Acta. 2003;1593:201‐208. [DOI] [PubMed] [Google Scholar]
- 164. Grober E, Hall CB, Lipton RB, Zonderman AB, Resnick SM, Kawas C. Memory impairment, executive dysfunction, and intellectual decline in preclinical Alzheimer's disease. J Int Neuropsychol Soc. 2008;14:266‐278. [DOI] [PMC free article] [PubMed] [Google Scholar]
- 165. Kelley BJ, Petersen RC. Alzheimer's disease and mild cognitive impairment. Neurol Clin. 2007;25:577‐609. [DOI] [PMC free article] [PubMed] [Google Scholar]
- 166. Ramirez‐Gomez L, Zheng L, Reed B, et al. Neuropsychological profiles differentiate Alzheimer disease from subcortical ischemic vascular dementia in an autopsy‐defined cohort. Dement Geriatr Cogn Disord. 2017;44:1‐11. [DOI] [PMC free article] [PubMed] [Google Scholar]
- 167. Engler H, Forsberg A, Almkvist O, et al. Two‐year follow‐up of amyloid deposition in patients with Alzheimer's disease. Brain. 2006;129(Pt 11):2856‐2866. [DOI] [PubMed] [Google Scholar]
- 168. Goedert M, Sisodia SS, Price DL. Neurofibrillary tangles and beta‐amyloid deposits in Alzheimer's disease. Curr Opin Neurobiol. 1991;1:441‐447. [DOI] [PubMed] [Google Scholar]
- 169. Ho L, Qin W, Pompl PN, et al. Diet‐induced insulin resistance promotes amyloidosis in a transgenic mouse model of Alzheimer's disease. FASEB J. 2004;18:902‐904. [DOI] [PubMed] [Google Scholar]
- 170. Exalto LG, Whitmer RA, Kappele LJ, Biessels GJ. An update on type 2 diabetes, vascular dementia and Alzheimer's disease. Exp Gerontol. 2012;47, 858‐864. [DOI] [PubMed] [Google Scholar]
- 171. Liu M, Paranjpe MD, Zhou X, et al. Quantitative imaging APOE4 effects on brain tau deposition and glucose metabolism in mild cognitive impairment patients with [18F]AV1451 and [18F]FDG PET. J Nucl Med. 2018;59:80. [Google Scholar]
- 172. Mosconi L, Brys M, Switalski R, et al. Maternal family history of Alzheimer's disease predisposes to reduced brain glucose metabolism. Proc Natl Acad Sci U S A. 2007;104:19067‐19072. [DOI] [PMC free article] [PubMed] [Google Scholar]
- 173. Xue J, Guo H, Gao Y, et al. Altered directed functional connectivity of the hippocampus in mild cognitive impairment and Alzheimer's disease: a resting‐state fMRI Study. Front Aging Neurosci. 2019;11:326. [DOI] [PMC free article] [PubMed] [Google Scholar]
- 174. Winkler EA, Nishida Y, Sagare AP, et al. GLUT1 reductions exacerbate Alzheimer's disease vasculoneuronal dysfunction and degeneration. Nat Neurosci. 2015;18:521‐530. [DOI] [PMC free article] [PubMed] [Google Scholar]
- 175. Mcnay EC, Pearson‐Leary J. GluT4: a central player in hippocampal memory and brain insulin resistance. Exp Neurol. 2020;323:113076. [DOI] [PMC free article] [PubMed] [Google Scholar]
- 176. Tullberg M, Fletcher E, Decarli C, et al. White matter lesions impair frontal lobe function regardless of their location. Neurology. 2004;63:246‐253. [DOI] [PMC free article] [PubMed] [Google Scholar]
- 177. Cai H‐Y, Yang J‐T, Wang Z‐J, et al. Lixisenatide reduces amyloid plaques, neurofibrillary tangles and neuroinflammation in an APP/PS1/tau mouse model of Alzheimer's disease. Biochem Biophys Res Commun. 2018;495:1034‐1040. [DOI] [PubMed] [Google Scholar]
- 178. Hansen HH, Fabricius K, Barkholt P, et al. The GLP‐1 receptor agonist liraglutide improves memory function and increases hippocampal CA1 neuronal numbers in a senescence‐accelerated mouse model of Alzheimer's disease. J Alzheimers Dis. 2015;46:877‐888. [DOI] [PMC free article] [PubMed] [Google Scholar]
- 179. Qi L, Ke L, Liu X, et al. Subcutaneous administration of liraglutide ameliorates learning and memory impairment by modulating tau hyperphosphorylation via the glycogen synthase kinase‐3β pathway in an amyloid β protein induced Alzheimer disease mouse model. Eur J Pharmacol. 2016;783:23‐32. [DOI] [PubMed] [Google Scholar]
- 180. Yang Y, Zhang J, Ma D, et al. Subcutaneous administration of liraglutide ameliorates Alzheimer‐associated tau hyperphosphorylation in rats with type 2 diabetes. J Alzheimers Dis. 2013;37:637‐648. [DOI] [PubMed] [Google Scholar]
- 181. Batista AF, Forny‐Germano L, Clarke JR, et al. The diabetes drug liraglutide reverses cognitive impairment in mice and attenuates insulin receptor and synaptic pathology in a non‐human primate model of Alzheimer's disease. J Pathol. 2018;245:85‐100. [DOI] [PMC free article] [PubMed] [Google Scholar]
- 182. Porter WD, Flatt PR, Hölscher C, Gault VA. Liraglutide improves hippocampal synaptic plasticity associated with increased expression of Mash1 in ob/ob mice. Int J Obes. 2013;37:678‐684. [DOI] [PubMed] [Google Scholar]
- 183. Hansen HH, Fabricius K, Barkholt P, et al. Long‐term treatment with liraglutide, a Glucagon‐Like Peptide‐1 (GLP‐1) receptor agonist, has no effect on β‐amyloid plaque load in two transgenic APP/PS1 mouse models of Alzheimer's disease. PLoS One. 2016;11:e0158205. [DOI] [PMC free article] [PubMed] [Google Scholar]
- 184. Cukierman‐Yaffe T, Gerstein HC, Colhoun HM, et al. Effect of dulaglutide on cognitive impairment in type 2 diabetes: an exploratory analysis of the REWIND trial. Lancet Neurol. 2020;19:582‐590. [DOI] [PubMed] [Google Scholar]