

Abstract
Exposure to ozone and fine particle (PM2.5) air pollution results in premature death. These pollutants are predominantly secondary in nature and can form from nitrogen oxides (NOX), sulfur oxides (SOX), and volatile organic compounds (VOCs). Predicted health benefits for emission reduction scenarios often incompletely account for VOCs as precursors as well as the secondary organic aerosol (SOA) component of PM2.5. Here, we show that anthropogenic VOC emission reductions are more than twice as effective as equivalent fractional reductions of SOX or NOX at reducing air pollution-associated cardiorespiratory mortality in the United States. A 25% reduction in anthropogenic VOC emissions from 2016 levels is predicted to avoid 13,000 premature deaths per year, and most (85%) of the VOC-reduction benefits result from reduced SOA with the remainder from ozone. While NOX (−5.7 ± 0.2 % yr−1) and SOX (−12 ± 1 % yr−1) emissions have declined precipitously across the U.S. since 2002, anthropogenic VOC emissions (−1.8 ± 0.3 % yr−1) and concentrations of non-methane organic carbon (−2.4 ± 1.0 % yr−1) have changed less. This work indicates preferentially controlling VOCs could yield significant benefits to human health.
Graphical Abstract

Introduction
More than 100 million Americans live in counties with unhealthy levels of ozone or fine particles (PM2.5) and numbers could increase as a result of climate change.1 Criteria pollutants, including ozone and PM2.5, can be emitted or formed via secondary processes such as reaction in the atmosphere. Depending on the meteorology, chemical regime, and fine particle composition, different precursor or source controls may be more effective than others in reducing adverse health outcomes. For example, ozone concentrations could be reduced via controls on nitrogen oxides (NOx) or volatile organic compound (VOC) precursors. Fine particles can be mitigated by controlling direct emissions, sulfur dioxide (SO2), NOx, ammonia, or VOCs. Historically, ozone-related benefits and those due to VOC reductions have not been quantified in benefit-per-ton analyses attributing monetized benefits to specific mass of emissions due to the complexity and non-linearity of ozone chemistry and uncertainty in predicting secondary organic aerosol (SOA).2, 3
The health impacts of ambient fine particles generally exceed those of ozone,4 and SOA is a major contributor to PM2.5 in the United States.5 SOA formation from the oxidation of VOCs from vegetation and anthropogenic sources6–10 generally dominates over direct emission of organic PM2.5.11 Significant advances in the understanding of SOA chemistry have resulted in chemical transport model algorithms that can realistically predict ambient fine particle concentrations including organic carbon.12 In addition, SOA may be an important driver of the adverse cardiorespiratory impacts of fine particle pollution in the United States.13
In this work, we examine how changes in secondary pollutant precursors impact fine particle and ozone concentrations. Specifically, we ask whether equivalent fractional reductions in NOX, SOX, or VOC emissions in the U.S. are most effective in reducing mortality and which pollutant component changes drive the reduced mortality. In addition, results are placed in the context of historical changes in emissions and concentrations to highlight opportunities to improve public health.
Materials and Methods
The Community Multiscale Air Quality (CMAQ) model was used to create air pollution concentration fields for baseline and emission reduction scenarios. Relationships between cardiorespiratory mortality and pollutant concentrations were used with CMAQ-predicted changes in concentration to quantify changes in mortality for each emission scenario. The emission reductions in the hypothetical scenarios were compared to 2002 through 2019 trends.
Pollutant concentrations
Output from CMAQv5.3.114 for year 2016 conditions over the contiguous U.S. was obtained from the work of Appel et al.12 CMAQv5.3.1 predictions are generally within 10% of observations12, 13 and the responsiveness of CMAQ predictions to emission changes has been characterized in previous work.15, 16 Emissions were based on 2014 National Emissions Inventory methods17 with year-specific information when available. Three simulations were conducted with changes in anthropogenic emissions of SOX (SO2 and sulfuric acid), NOX (NO, NO2, and HONO), and VOCs (including all gas-phase non-methane organic carbon, NMOC, precursors to ozone and SOA) in CMAQ using the Detailed Emissions Scaling, Isolation, and Diagnostic module.18 Anthropogenic sectors include electric generating utilities (EGUs), non-EGU point sources, residential wood combustion, oil and gas sources, mobile sources, and other point and area sources. Emission sectors held constant in all simulations include fires, biogenic activity (e.g. vegetation), lightning, and sea spray (Table S4).
Health impact quantification
Health impacts of simulated pollutant reductions were quantified based on changes in concentrations and the association between individual pollutants and cardiorespiratory mortality. The association between individual pollutant concentrations and county-level age-adjusted cardiorespiratory mortality rates, R’, were calculated in a cross-sectional framework using single pollutant models for 2016 and data from the Centers for Disease Control and Prevention (CDC)19 as well as relevant confounders (Table S1), Cj, following the single pollutant multiple linear regression methods of Pye et al.13:
| (1) |
Where all β are regressed coefficients and βi represent the pollutant (Pi) coefficients connecting a change in pollutant concentration with a change in mortality. Pollutants were SOA, sulfate (SO4), nitrate (NO3), and ammonium (NH4) in PM2.5 (defined by Pye et al.13) as well as O3 due to their regional nature and the fact that they can be impacted by changes to NOX, SOX, and VOC emissions. Other PM2.5 components (sea spray, soot, dust, and primary organic aerosol) were included in all CMAQ simulations but were not considered in the health impact calculations as they are emitted, can show large variability within counties, and were not directly modified compared to the baseline in any simulation. O3 was converted to mass per volume at standard conditions using 101.325 kPa and 298K (1 ppb ~ 2 μg sm−3). Single pollutant models were the same as specified in Pye et al.13 with one exception: race was reduced to one confounder as it reduced the standard error on the regressed pollutant coefficients. Changes in county-level cardiorespiratory mortality were estimated using the regression coefficients (1) and the PM2.5 component changes from the CMAQ emission scenarios (Supplementary Note 1).
Trends in emissions and concentrations
Nationwide anthropogenic emissions and observed pollutant concentrations were obtained from U.S. Environmental Protection Agency (EPA) datasets. Anthropogenic emissions of criteria pollutants from 2002 to 2019 were obtained from the National Emissions Inventory (NEI).20 Trends in mean concentrations of NMOC (24 HOUR), sulfur dioxide (24-HR BLK AVG), and oxides of nitrogen (1 HOUR) were created from Air Quality System (AQS) measurements (Supplementary Note 2).21
Results and Discussion
Reductions in NOX, SOX, or VOC emissions generally resulted in reduced annual-mean concentrations of fine particles and ozone (Figure 1a). The 25% reduction in NOX emissions led to a 0.11 μg m−3 reduction in predicted ammonium and nitrate and a 0.22 ppb (0.44 μg sm−3) reduction in predicted ozone (nationwide, population-weighted). Simulated ozone increased up to 2 ppb in urban areas because of reduced NOX titration but decreased throughout the Southeast and rural parts of the country by 2–5%. Ammonium and nitrate together decreased up to ~0.4 μg m−3 in locations with significant agricultural activity such as the Midwest, eastern North Carolina, and California’s Central Valley in addition to the Northeast U.S. SOA decreased up to 5% (~0.2 μg m−3) in the Southeast but increased up to 6% in urban locations where ozone also increased. SOA from monoterpene nitrates22 was predicted to decrease ~15% in the southeastern U.S., but other SOA systems were less sensitive to NOX due to a lack of direct NOX dependence or competing effects.22, 23 Predicted sulfate generally increased by 1–2% across the Midwest through Northeast as a result of greater oxidation (Figures S2–S6).
Figure 1:

Predicted (a) population-weighted change in annual-mean concentration, (b) change in mortality, and (c) avoided mortality per Tg of emission reduction resulting from a 25% reduction in anthropogenic NOX (−2.2 Tg), SOX (−0.6 Tg), or VOC (−2.5 Tg) emissions compared to 2016 levels. In (a), PM2.5 component concentrations (SOA, SO4, NH4, and NO3) are μg m−3 while ozone is μg sm−3.
The overall, predicted impact of SOX emission reductions on fine particles was comparable to that from the reduction in NOX, but SOX emission reductions did not meaningfully affect O3 (<0.07% change in predicted concentration, Figure 1a). As expected, SOX emission reductions led to less sulfate over the entire eastern U.S. by up ~14% or 0.1 to 0.2 μg m−3 with a population-weighted decrease in concentration of 0.10 μg m−3. SOA showed modest decreases of 1.4% or 0.03 μg m−3 in the East as a result of decreased acid-catalyzed reactions of isoprene expoxydiols.24 While the epoxydiol pathways responded almost linearly to the reduction in SOX, other SOA pathways were generally not responsive to SOX emissions.25 As SOX emissions continue to decrease, changes in diffusivity26 or acidity27, 28 could slow uptake of isoprene epoxydiols, further modifying the responsiveness of SOA to SOX emissions.
A 25% reduction in anthropogenic VOC emissions was predicted to lead to greater PM2.5 and ozone reductions than the equivalent fractional reductions in NOX and SOX due to substantial reductions in predicted SOA and ozone. Anthropogenic VOC-induced reductions in SOA exceeded 15% (up to 22%) over a wide portion of the US including the Midwest, Northeast, and parts of California. The largest magnitude absolute concentrations changes (as much as −0.8 μg m−3, generally −0.3 μg m−3) occurred throughout the East, southern California, and California’s Central Valley, and resulted primarily from decreased anthropogenic SOA (reductions up to 0.6 μg m−3) coupled with more modest reductions in SOA from monoterpene oxidation (up to 0.1 μg m−3) due to absorptive partitioning and oxidant feedbacks. Almost no net change in the SOA from isoprene was predicted. Predicted ozone decreased almost universally throughout the eastern U.S. and California by as much as 2%. In much of the remaining western U.S., almost no change in ozone concentrations were found. Concentration decreases in ozone were highest in urban areas and on the order of 0.5 to 1 ppb. Predicted inorganic aerosol concentrations were not strongly affected by reductions in anthropogenic VOCs.
The fine particle and ozone concentrations for 2016 conditions were associated with 110,000 ± 58,000 and 70,000 ± 23,000 cardiorespiratory deaths, respectively, in the contiguous U.S. (Supplementary Note 1), consistent with previous work.29–31 The reductions in fine particle mass and ozone summed across the three individual emission reduction scenarios (effective change of −8.0% in PM2.5 and −1.6% in O3) were associated with 24,000 fewer cardiorespiratory deaths. Individual fine particle components showed some variation in their health impacts per unit mass (β ranged from 8.0 to 13 deaths per 100,000 in population for 1 μg m−3, Table S2), but the cardiorespiratory mortality impacts of those components generally exceeded that of O3 per unit mass by around a factor of 10. As a result, the change in mortality compared to change in concentration (Figure 1 a,b) is mainly explained by the difference in particulate component- vs. ozone-associated mortality. Individually, the 25% reductions in NOX, SOX, and VOC emissions were associated with 5,500; 5,100; and 13,000 fewer deaths, respectively.
The largest predicted mortality benefits resulted from the anthropogenic VOC reduction and were driven by the predicted reduction in SOA, which accounted for 85% of the avoided deaths. VOC reductions led to less predicted mortality throughout the East and California with the largest impacts on mortality rates in urban areas (Figure 2). The spatial pattern of mortality illustrates that as NOx decreases from urban to rural locations, ozone and pollutants that rely on oxidant levels switch from being VOC-limited to NOx-limited32 and changes in mortality due to one emission change will depend on the other precursor levels. When viewed in terms of nationwide, mean county-level changes in predicted mortality rates, NOX and VOC emission reductions showed associations of 2.4 and 2.7 fewer deaths per 100,000 in population (age-adjusted). SOX emission reductions were associated with 1.5 fewer age-adjusted deaths per 100,000 in population.
Figure 2:
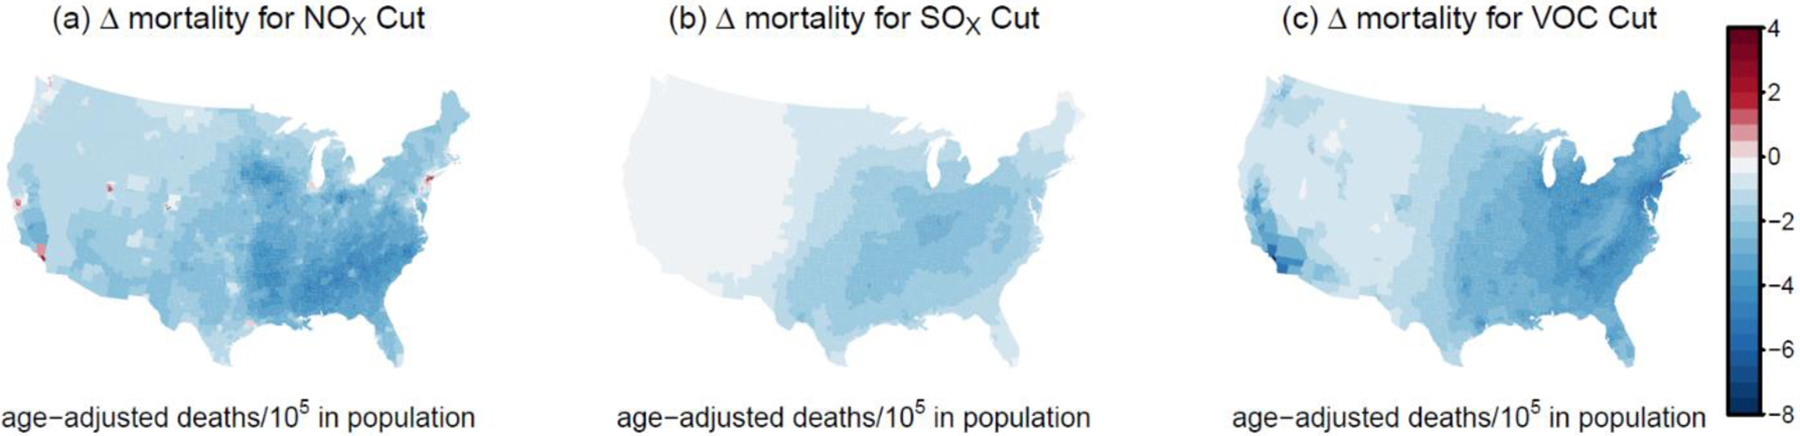
Change in cardiorespiratory mortality rate (age-adjusted deaths per 100,000 in population) predicted to result from secondary pollutant concentration changes due to a 25% reduction in anthropogenic (a) NOX, (b) SOX, or (d) VOC emissions.
Fractional reductions from 2016 conditions corresponded to different absolute emission reductions (Table S4). Normalizing the avoided mortality by the mass of avoided emissions, indicated 2,500; 9,100; and 5,200 fewer deaths per Tg of NOX, SOX, or VOC reduced (Figure 1c). This suggests that on both a relative and per mass basis, VOC reduction benefits could exceed those of NOX by at least a factor of 2. While SOX reductions can have large benefits per unit mass33 due to a more direct relationship between precursor and particulate component, marginal abatement costs are also higher as emissions are reduced.34
U.S. NOX and SOX emission levels have been decreasing at a rate of −0.79 ± 0.05 Tg yr−1 (−5.7 ± 0.2 % yr−1) and −0.81± 0.08 Tg yr−1 (−12 ± 1 % yr−1) while VOCs have decreased more slowly at a rate of −0.24 ± 0.04 Tg yr−1 (−1.8 ± 0.3 % yr−1) since 2002 (Figure 3). Ambient concentrations show good correspondence with the trend in emissions35 although an exact correspondence is not expected due to limited monitor coverage (particularly for VOCs, n=14 monitors), uncertainty in emission reporting, and changes in atmospheric chemical lifetime.36 The observed VOC proxy could also include biogenic VOCs and is operationally defined. The trend in NEI emissions suggests that the 25% SOX and NOX emissions reductions examined here have likely already occurred.
Figure 3:

Trend in U.S. National Emissions Inventory anthropogenic emissions and gas-phase concentrations of NOX, SO2, and VOCs. Concentrations are from the EPA AQS and use total non-methane organic compounds as a proxy for VOC concentrations. Values on right indicate the 2019 emissions level relative to 2002.
However, given the current trend in anthropogenic VOC emissions, the 25% reduction (2.5 Tg) examined here would take about a decade to achieve. Observed NMOC concentrations decreased consistent with VOC emissions at a rate of −4.2 ± 1.6 ppbC yr−1 (−2.4 ± 1.0 % yr−1, Table S6). While Azusa, California indicated a downward trend in NMOC (−7.2 % yr−1, Table S7) consistent with historical trends in that area from 1960 to 2010,37, 38 other locations showed less change and Beltsville, Maryland even indicated increasing NMOC since 2002 (7.4 ppbC yr−1, 4.3 % yr−1). Trends were not uniform across demographics and counties with high fractions of Black populations were predicted to experience higher SOA concentrations and less NMOC mitigation (Figure S8) indicating the potential for an exposure disparity that could grow in time. In addition to more steady levels of NMOC over the 18-year time period, ambient concentrations of non-methane organic compounds (160 ± 48 ppb C) exceeded those of NOX (9.7 ± 6.2 ppb N) and SOX (0.8 ± 0.8 ppb S) in 2019 (Table S6).
Fine particle pollution is a driver of adverse health outcomes, and reducing anthropogenic emissions of VOCs could reduce cardiorespiratory mortality associated with air pollution by reducing SOA. VOCs differ from NOX and SOX in terms of their emission sources with SOX and NOX having large combustion sources that have been targeted for control39 as evident in their trends since 2002. VOC sources are varied and concentrations are monitored at 10x fewer sites than are NOX and SOX. Sparse observations limit our ability to understand exposure disparities for vulnerable populations. Further efforts to understand the composition and magnitude of emissions of organic compounds, for example, using co-located VOC and PM2.5 speciation measurements, as well as how they are transformed in the atmosphere could inform public health strategies. This information may become more critical in the future as VOC concentrations in urban areas respond to temperature40 and thus could increase with climate change. Air quality model development will also benefit from this information as model studies33, 41, 42 often lack anthropogenic SOA sources comparable to those used here, and many models for future air quality predictions only include SOA from biogenic precursors.43 In addition, time series or long-term exposure cohort analysis could refine the epidemiologic evidence used to quantify pollutant-specific risks.
While fine particles and ozone have known linkages to negative health outcomes, emerging pollutants are not considered in calculations of the impacts of environmental pollution on mortality.44 A significant fraction of VOCs evaporate from products,9 and result in near-field exposure before reaching air.10 VOCs, and more generally total reactive organic carbon,45 include hundreds of thousands of species including known hazardous air pollutants like benzene and species with unquantified adverse health impacts like per- and polyfluoroalkyl substances.46, 47 Addressing VOCs released to air could reduce chemical pollutant exposure, bringing additional health benefits beyond reduced criteria pollutant formation.
Supplementary Material
Acknowledgements
The U.S. EPA through its Office of Research and Development supported the research described here. It has been subjected to Agency administrative review and approved for publication but may not necessarily reflect official Agency policy. We thank Tesh Rao, Emma D’Ambro, Luke Valin, Neal Fann, and Lars Perlmutt for useful discussion. We thank CDC and EPA for making datasets publicly available. KMS was supported by the Oak Ridge Institute for Science and Education (ORISE) Research Participation Program for the U.S. Environmental Protection Agency (EPA).
Footnotes
Supporting Information
Additional information on calculation methods, intermediate values, predicted changes in pollutant concentrations across the U.S., and final figure values are available. Additional supporting data is available at data.gov (https://doi.org/10.23719/1523341).
References
- 1.U.S. Global Change Research Program Impacts, Risks, and Adaptation in the United States: Fourth National Climate Assessment , Volume II; Washington, D.C., USA, 2018. [Google Scholar]
- 2.Fann N; Baker KR; Fulcher CM, Characterizing the PM2.5-related health benefits of emission reductions for 17 industrial, area and mobile emission sectors across the U.S. Environ. Int 2012, 49, 141–151. [DOI] [PubMed] [Google Scholar]
- 3.U.S. Environmental Protection Agency Estimating the Benefit per Ton of Reducing PM2.5 Precursors from 17 Sectors. https://www.epa.gov/sites/production/files/2018-02/documents/sourceapportionmentbpttsd_2018.pdf (accessed 20 August 2021). [Google Scholar]
- 4.Cohen AJ; Brauer M; Burnett R; Anderson HR; Frostad J; Estep K; Balakrishnan K; Brunekreef B; Dandona L; Dandona R; Feigin V; Freedman G; Hubbell B; Jobling A; Kan H; Knibbs L; Liu Y; Martin R; Morawska L; Pope CA III; Shin H; Straif K; Shaddick G; Thomas M; van Dingenen R; van Donkelaar A; Vos T; Murray CJL; Forouzanfar MH, Estimates and 25-year trends of the global burden of disease attributable to ambient air pollution: an analysis of data from the Global Burden of Diseases Study 2015. Lancet 2017, 389 (10082), 1907–1918. [DOI] [PMC free article] [PubMed] [Google Scholar]
- 5.Robinson AL; Donahue NM; Shrivastava MK; Weitkamp EA; Sage AM; Grieshop AP; Lane TE; Pierce JR; Pandis SN, Rethinking organic aerosols: Semivolatile emissions and photochemical aging. Science 2007, 315 (5816), 1259. [DOI] [PubMed] [Google Scholar]
- 6.Murphy BN; Woody MC; Jimenez JL; Carlton AMG; Hayes PL; Liu S; Ng NL; Russell LM; Setyan A; Xu L; Young J; Zaveri RA; Zhang Q; Pye HOT, Semivolatile POA and parameterized total combustion SOA in CMAQv5.2: impacts on source strength and partitioning. Atmos. Chem. Phys 2017, 17 (18), 11107–11133. [DOI] [PMC free article] [PubMed] [Google Scholar]
- 7.Lu Q; Murphy BN; Qin M; Adams PJ; Zhao Y; Pye HOT; Efstathiou C; Allen C; Robinson AL, Simulation of organic aerosol formation during the CalNex study: updated mobile emissions and secondary organic aerosol parameterization for intermediate-volatility organic compounds. Atmos. Chem. Phys 2020, 20 (7), 4313–4332. [DOI] [PMC free article] [PubMed] [Google Scholar]
- 8.McDonald BC; de Gouw JA; Gilman JB; Jathar SH; Akherati A; Cappa CD; Jimenez JL; Lee-Taylor J; Hayes PL; McKeen SA; Cui YY; Kim S-W; Gentner DR; Isaacman-VanWertz G; Goldstein AH; Harley RA; Frost GJ; Roberts JM; Ryerson TB; Trainer M, Volatile chemical products emerging as largest petrochemical source of urban organic emissions. Science 2018, 359 (6377), 760. [DOI] [PubMed] [Google Scholar]
- 9.Seltzer KM; Pennington E; Rao V; Murphy BN; Strum M; Isaacs KK; Pye HOT, Reactive organic carbon emissions from volatile chemical products. Atmos. Chem. Phys 2021, 21 (6), 5079–5100. [DOI] [PMC free article] [PubMed] [Google Scholar]
- 10.Qin M; Murphy BN; Isaacs KK; McDonald BC; Lu Q; McKeen SA; Koval L; Robinson AL; Efstathiou C; Allen C; Pye HOT, Criteria pollutant impacts of volatile chemical products informed by near-field modelling. Nat. Sustain 2021, 4 (2), 129–137. [DOI] [PMC free article] [PubMed] [Google Scholar]
- 11.Zhang Q; Jimenez JL; Canagaratna MR; Allan JD; Coe H; Ulbrich I; Alfarra MR; Takami A; Middlebrook AM; Sun YL; Dzepina K; Dunlea E; Docherty K; DeCarlo PF; Salcedo D; Onasch T; Jayne JT; Miyoshi T; Shimono A; Hatakeyama S; Takegawa N; Kondo Y; Schneider J; Drewnick F; Borrmann S; Weimer S; Demerjian K; Williams P; Bower K; Bahreini R; Cottrell L; Griffin RJ; Rautiainen J; Sun JY; Zhang YM; Worsnop DR, Ubiquity and dominance of oxygenated species in organic aerosols in anthropogenically-influenced Northern Hemisphere midlatitudes. Geophys. Res. Lett 2007, 34 (13). [Google Scholar]
- 12.Appel KW; Bash JO; Fahey KM; Foley KM; Gilliam RC; Hogrefe C; Hutzell WT; Kang D; Mathur R; Murphy BN; Napelenok SL; Nolte CG; Pleim JE; Pouliot GA; Pye HOT; Ran L; Roselle SJ; Sarwar G; Schwede DB; Sidi FI; Spero TL; Wong DC, The Community Multiscale Air Quality (CMAQ) model versions 5.3 and 5.3.1: system updates and evaluation. Geosci. Model Dev 2021, 14 (5), 2867–2897. [DOI] [PMC free article] [PubMed] [Google Scholar]
- 13.Pye HOT; Ward‐Caviness Cavin K; Murphy BN; Appel KW; Seltzer KM, Secondary organic aerosol association with cardiorespiratory disease mortality in the United States. Nat. Commun 2021, 12 (1), 7215. [DOI] [PMC free article] [PubMed] [Google Scholar]
- 14.U.S. EPA Office of Research and Development CMAQ (Version 5.3.1). 10.5281/zenodo.3585898. [DOI]
- 15.Foley KM; Hogrefe C; Pouliot G; Possiel N; Roselle SJ; Simon H; Timin B, Dynamic evaluation of CMAQ part I: Separating the effects of changing emissions and changing meteorology on ozone levels between 2002 and 2005 in the eastern US. Atmos. Environ 2015, 103, 247–255. [Google Scholar]
- 16.Gan CM; Pleim J; Mathur R; Hogrefe C; Long CN; Xing J; Wong D; Gilliam R; Wei C, Assessment of long-term WRF–CMAQ simulations for understanding direct aerosol effects on radiation “brightening” in the United States. Atmos. Chem. Phys 2015, 15 (21), 12193–12209. [Google Scholar]
- 17.U.S. Environmental Protection Agency 2014 National Emissions Inventory, version 2 Technical Support Document; 2018. [Google Scholar]
- 18.Murphy BN; Nolte CG; Sidi F; Bash JO; Appel KW; Jang C; Kang D; Kelly J; Mathur R; Napelenok S; Pouliot G; Pye HOT, The Detailed Emissions Scaling, Isolation, and Diagnostic (DESID) module in the Community Multiscale Air Quality (CMAQ) modeling system version 5.3.2. Geosci. Model Dev 2021, 14 (6), 3407–3420. [DOI] [PMC free article] [PubMed] [Google Scholar]
- 19.Centers for Disease Control and Prevention National Center for Health Statistics Compressed Mortality File 1999–2016 on CDC WONDER Online Database, released June 2017. Data are from the Compressed Mortality File 1999–2016 Series 20 No.2U, 2016, as compiled from data provided by the 7 vital statistics jurisdictions through the Vital Statistics Cooperative Program. Accessed 31 Aug 2020 9:15:06 a.m. http://wonder.cdc.gov/cmf-icd10.html (accessed 31 Aug 2020 9:15:06 a.m.).
- 20.U.S. Environmental Protection Agency Air Pollutant Emissions Trends Data: National Annual Emissions Trend. https://www.epa.gov/air-emissions-inventories/air-pollutant-emissions-trends-data (accessed 10 February 2021). [Google Scholar]
- 21.U.S. Environmental Protection Agency Pre-Generated Data Files: Annual Summary Data. https://aqs.epa.gov/aqsweb/airdata/download_files.html#Annual (accessed 10 February 2021). [Google Scholar]
- 22.Pye HOT; Luecken DJ; Xu L; Boyd CM; Ng NL; Baker KR; Ayres BR; Bash JO; Baumann K; Carter WPL; Edgerton E; Fry JL; Hutzell WT; Schwede DB; Shepson PB, Modeling the current and future roles of particulate organic nitrates in the southeastern United States. Environ. Sci. Technol 2015, 49 (24), 14195–14203. [DOI] [PubMed] [Google Scholar]
- 23.Zheng Y; Unger N; Hodzic A; Emmons L; Knote C; Tilmes S; Lamarque JF; Yu P, Limited effect of anthropogenic nitrogen oxides on secondary organic aerosol formation. Atmos. Chem. Phys 2015, 15 (23), 13487–13506. [Google Scholar]
- 24.Pye HOT; Pinder RW; Piletic IR; Xie Y; Capps SL; Lin Y-H; Surratt JD; Zhang Z; Gold A; Luecken DJ; Hutzell WT; Jaoui M; Offenberg JH; Kleindienst TE; Lewandowski M; Edney EO, Epoxide pathways improve model predictions of isoprene markers and reveal key role of acidity in aerosol formation. Environ. Sci. Technol 2013, 47 (19), 11056–11064. [DOI] [PubMed] [Google Scholar]
- 25.Zheng Y; Thornton JA; Ng NL; Cao H; Henze DK; McDuffie EE; Hu W; Jimenez JL; Marais EA; Edgerton E; Mao J, Long-term observational constraints of organic aerosol dependence on inorganic species in the southeast US. Atmos. Chem. Phys 2020, 20 (21), 13091–13107. [Google Scholar]
- 26.Riva M; Chen Y; Zhang Y; Lei Z; Olson NE; Boyer HC; Narayan S; Yee LD; Green HS; Cui T; Zhang Z; Baumann K; Fort M; Edgerton E; Budisulistiorini SH; Rose CA; Ribeiro IO; e Oliveira RL; dos Santos EO; Machado CMD; Szopa S; Zhao Y; Alves EG; de Sá SS; Hu W; Knipping EM; Shaw SL; Duvoisin Junior S; de Souza RAF; Palm BB; Jimenez J-L; Glasius M; Goldstein AH; Pye HOT; Gold A; Turpin BJ; Vizuete W; Martin ST; Thornton JA; Dutcher CS; Ault AP; Surratt JD, Increasing Isoprene Epoxydiol-to-Inorganic Sulfate Aerosol Ratio Results in Extensive Conversion of Inorganic Sulfate to Organosulfur Forms: Implications for Aerosol Physicochemical Properties. Environ. Sci. Technol 2019, 53 (15), 8682–8694. [DOI] [PMC free article] [PubMed] [Google Scholar]
- 27.Shah V; Jaeglé L; Thornton JA; Lopez-Hilfiker FD; Lee BH; Schroder JC; Campuzano-Jost P; Jimenez JL; Guo H; Sullivan AP; Weber RJ; Green JR; Fiddler MN; Bililign S; Campos TL; Stell M; Weinheimer AJ; Montzka DD; Brown SS, Chemical feedbacks weaken the wintertime response of particulate sulfate and nitrate to emissions reductions over the eastern United States. P. Natl. Acad. Sci. USA 2018, 115 (32), 8110. [DOI] [PMC free article] [PubMed] [Google Scholar]
- 28.Zheng G; Su H; Wang S; Andreae MO; Pöschl U; Cheng Y, Multiphase buffer theory explains contrasts in atmospheric aerosol acidity. Science 2020, 369 (6509), 1374. [DOI] [PubMed] [Google Scholar]
- 29.Burnett R; Chen H; Szyszkowicz M; Fann N; Hubbell B; Pope CA; Apte JS; Brauer M; Cohen A; Weichenthal S; Coggins J; Di Q; Brunekreef B; Frostad J; Lim SS; Kan H; Walker KD; Thurston GD; Hayes RB; Lim CC; Turner MC; Jerrett M; Krewski D; Gapstur SM; Diver WR; Ostro B; Goldberg D; Crouse DL; Martin RV; Peters P; Pinault L; Tjepkema M; van Donkelaar A; Villeneuve PJ; Miller AB; Yin P; Zhou M; Wang L; Janssen NAH; Marra M; Atkinson RW; Tsang H; Quoc Thach T; Cannon JB; Allen RT; Hart JE; Laden F; Cesaroni G; Forastiere F; Weinmayr G; Jaensch A; Nagel G; Concin H; Spadaro JV, Global estimates of mortality associated with long-term exposure to outdoor fine particulate matter. P. Natl. Acad. Sci. USA 2018, 115 (38), 9592. [DOI] [PMC free article] [PubMed] [Google Scholar]
- 30.Seltzer KM; Shindell DT; Malley CS, Measurement-based assessment of health burdens from long-term ozone exposure in the United States, Europe, and China. Environmental Research Letters 2018, 13 (10), 104018. [Google Scholar]
- 31.Thakrar SK; Balasubramanian S; Adams PJ; Azevedo IML; Muller NZ; Pandis SN; Polasky S; Pope CA; Robinson AL; Apte JS; Tessum CW; Marshall JD; Hill JD, Reducing Mortality from Air Pollution in the United States by Targeting Specific Emission Sources. Environ. Sci. Tech. Lett 2020, 7 (9), 639–645. [Google Scholar]
- 32.Sillman S, The relation between ozone, NOx and hydrocarbons in urban and polluted rural environments. Atmos. Environ 1999, 33 (12), 1821–1845. [Google Scholar]
- 33.Gilmore EA; Heo J; Muller NZ; Tessum CW; Hill JD; Marshall JD; Adams PJ, An inter-comparison of the social costs of air quality from reduced-complexity models. Environmental Research Letters 2019, 14 (7), 074016. [Google Scholar]
- 34.Rentz O; Haasis HD; Jattke A; Ruβ P; Wietschel M; Amann M, Influence of energy-supply structure on emission-reduction costs. Energy 1994, 19 (6), 641–651. [Google Scholar]
- 35.Silvern RF; Jacob DJ; Mickley LJ; Sulprizio MP; Travis KR; Marais EA; Cohen RC; Laughner JL; Choi S; Joiner J; Lamsal LN, Using satellite observations of tropospheric NO2 columns to infer long-term trends in US NOX emissions: the importance of accounting for the free tropospheric NO2 background. Atmos. Chem. Phys 2019, 19 (13), 8863–8878. [Google Scholar]
- 36.Laughner JL; Cohen RC, Direct observation of changing NOx; lifetime in North American cities. Science 2019, 366 (6466), 723. [DOI] [PMC free article] [PubMed] [Google Scholar]
- 37.Pollack IB; Ryerson TB; Trainer M; Neuman JA; Roberts JM; Parrish DD, Trends in ozone, its precursors, and related secondary oxidation products in Los Angeles, California: A synthesis of measurements from 1960 to 2010. J. Geophys. Res.-Atmos 2013, 118 (11), 5893–5911. [Google Scholar]
- 38.Warneke C; de Gouw JA; Holloway JS; Peischl J; Ryerson TB; Atlas E; Blake D; Trainer M; Parrish DD, Multiyear trends in volatile organic compounds in Los Angeles, California: Five decades of decreasing emissions. J. Geophys. Res.-Atmos 2012, 117 (D21). [Google Scholar]
- 39.Finding of Significant Contribution and Rulemaking for Certain States in the Ozone Transport Assessment Group Region for Purposes of Reducing Regional Transport of Ozone. In 40 CFR Parts 51, 72, 75, 96, Code of Federal Regulations: United States, 1998; Vol. 40. [Google Scholar]
- 40.Nussbaumer CM; Cohen RC, The Role of Temperature and NOX in Ozone Trends in the Los Angeles Basin. Environ. Sci. Technol 2020, 54 (24), 15652–15659. [DOI] [PubMed] [Google Scholar]
- 41.Carlton AG; Pye HOT; Baker KR; Hennigan CJ, Additional Benefits of Federal Air-Quality Rules: Model Estimates of Controllable Biogenic Secondary Organic Aerosol. Environ. Sci. Technol 2018, 52 (16), 9254–9265. [DOI] [PMC free article] [PubMed] [Google Scholar]
- 42.Kelly JT; Jang C; Zhu Y; Long S; Xing J; Wang S; Murphy BN; Pye HOT, Predicting the Nonlinear Response of PM2.5 and Ozone to Precursor Emission Changes with a Response Surface Model. submitted to Atmosphere 2021, 12. [DOI] [PMC free article] [PubMed] [Google Scholar]
- 43.Turnock ST; Allen RJ; Andrews M; Bauer SE; Deushi M; Emmons L; Good P; Horowitz L; John JG; Michou M; Nabat P; Naik V; Neubauer D; O’Connor FM; Olivié D; Oshima N; Schulz M; Sellar A; Shim S; Takemura T; Tilmes S; Tsigaridis K; Wu T; Zhang J, Historical and future changes in air pollutants from CMIP6 models. Atmos. Chem. Phys 2020, 20 (23), 14547–14579. [Google Scholar]
- 44.Landrigan PJ; Fuller R; Acosta NJR; Adeyi O; Arnold R; Basu N; Baldé AB; Bertollini R; Bose-O’Reilly S; Boufford JI; Breysse PN; Chiles T; Mahidol C; Coll-Seck AM; Cropper ML; Fobil J; Fuster V; Greenstone M; Haines A; Hanrahan D; Hunter D; Khare M; Krupnick A; Lanphear B; Lohani B; Martin K; Mathiasen KV; McTeer MA; Murray CJL; Ndahimananjara JD; Perera F; Potočnik J; Preker AS; Ramesh J; Rockström J; Salinas C; Samson LD; Sandilya K; Sly PD; Smith KR; Steiner A; Stewart RB; Suk WA; van Schayck OCP; Yadama GN; Yumkella K; Zhong M, The Lancet Commission on pollution and health. The Lancet 2018, 391 (10119), 462–512. [DOI] [PubMed] [Google Scholar]
- 45.Safieddine SA; Heald CL; Henderson BH, The global nonmethane reactive organic carbon budget: A modeling perspective. Geophys. Res. Lett 2017, 44 (8), 3897–3906. [Google Scholar]
- 46.D’Ambro EL; Pye HOT; Bash JO; Bowyer J; Allen C; Efstathiou C; Gilliam RC; Reynolds L; Talgo K; Murphy BN, Characterizing the air emissions, fransport, and deposition of per- and polyfluoroalkyl substances from a fluoropolymer manufacturing facility. Environ. Sci. Technol 2021, 55 (2), 862–870. [DOI] [PMC free article] [PubMed] [Google Scholar]
- 47.Kwiatkowski CF; Andrews DQ; Birnbaum LS; Bruton TA; DeWitt JC; Knappe DRU; Maffini MV; Miller MF; Pelch KE; Reade A; Soehl A; Trier X; Venier M; Wagner CC; Wang Z; Blum A, Scientific Basis for Managing PFAS as a Chemical Class. Environ. Sci. Tech. Lett 2020, 7 (8), 532–543. [DOI] [PMC free article] [PubMed] [Google Scholar]
Associated Data
This section collects any data citations, data availability statements, or supplementary materials included in this article.