Key Points
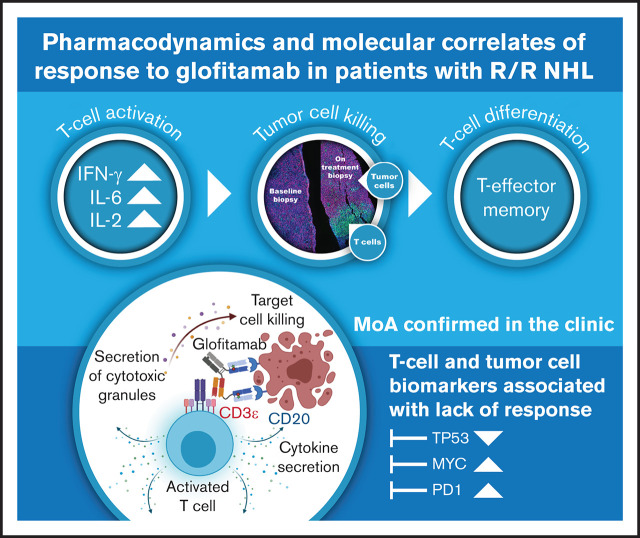
Glofitamab induced dose-dependent induction of cytokines and T-cell margination, proliferation, and activation in peripheral blood.
Tumor cell intrinsic factors (eg, TP53 and MYC signaling) are associated with resistance to glofitamab.
Visual Abstract
Abstract
Glofitamab, a novel CD20xCD3, T-cell–engaging bispecific antibody, exhibited single-agent activity in Study NP30179, a first-in-human, phase 1 trial in relapsed/refractory B-cell non-Hodgkin lymphoma. Preclinical studies showed that glofitamab leads to T-cell activation, proliferation, and tumor cell killing upon binding to CD20 on malignant cells. Here, we provide evidence of glofitamab’s clinical activity, including pharmacodynamic profile, mode of action, and factors associated with clinical response, by evaluating biomarkers in patient samples from the dose-escalation part of this trial. Patients enrolled in Study NP30179 received single-dose obinutuzumab pretreatment (1000 mg) 7 days before IV glofitamab (5 µg-25 mg). Glofitamab treatment lasted ≤12 cycles once every 2 or 3 weeks. Blood samples were collected at predefined time points per the clinical protocol; T-cell populations were evaluated centrally by flow cytometry, and cytokine profiles were analyzed. Immunohistochemical and genomic biomarker analyses were performed on tumor biopsy samples. Pharmacodynamic modulation was observed with glofitamab treatment, including dose-dependent induction of cytokines, and T-cell margination, proliferation, and activation in peripheral blood. Gene expression analysis of pretreatment tumor biopsy samples indicated that tumor cell intrinsic factors such as TP53 signaling are associated with resistance to glofitamab, but they may also be interlinked with a diminished effector T-cell profile in resistant tumors and thus represent a poor prognostic factor per se. This integrative biomarker data analysis provides clinical evidence regarding glofitamab’s mode of action, supports optimal biological dose selection, and will further guide clinical development. This trial was registered at www.clinicaltrials.gov as #NCT03075696.
Introduction
The introduction of the monoclonal anti-CD20 therapeutic antibodies rituximab and obinutuzumab, in combination with chemotherapy, has significantly improved outcomes for patients with various types of B-cell non-Hodgkin lymphoma (B-NHL) over the past 20 years.1 However, despite improved survival rates, nearly one-half of advanced-stage indolent B-NHL and aggressive lymphomas remain incurable.2,3 Thus, an unmet clinical need remains to further improve disease-free survival and ultimately achieve a cure in a greater fraction of patients with B-NHL.
Significant advances into cancer therapy have been made through the introduction of immune-checkpoint inhibitors. However, despite success in solid tumors, studies introducing checkpoint inhibitors have shown disappointing efficacy in most B-NHL subtypes. Chimeric antigen receptor (CAR) T-cell therapies have shown that direct promotion of T cell–mediated cell death can lead to clinically meaningful remissions.4 However, this approach is complicated by significant challenges such as unpredictable toxicity events and clinical delays due to complex manufacturing and implementation requirements.
Glofitamab is a bispecific T-cell engager with a 2:1 molecular format of anti-CD20:anti-CD3ɛ binders.5 Through the formation of a transient immunologic synapse between CD20+ B cells and CD3+ polyclonal T cells, T cells become activated, rapidly proliferate, and subsequently drive antilymphoma activity through T cell–mediated B-cell lysis. Furthermore, glofitamab exhibited significantly higher potency compared with other bispecific antibody formats in preclinical studies5 and may have an improved safety profile compared with CAR T-cell therapies.6
Study NP30179 (#NCT03075696) is a multicenter, open-label, phase 1, dose-escalation trial with single-agent glofitamab dosing after obinutuzumab (Gazyva/Gazyvaro; Genentech USA, South San Francisco, CA) pretreatment (Gpt) that reported dose-dependent clinical activity in heavily pretreated patients with relapsed/refractory (R/R) aggressive or indolent B-NHL.6 Here, we present the blood and tissue biomarker analysis from the same phase 1 dose-escalation study, to characterize glofitamab’s mode of action in the clinic and to explore response predictive factors.
Methods
Study design and patients
Biomarker data are described for adult patients with histolopathologically confirmed R/R B-NHL enrolled in the fixed dose-escalation cohorts (parts 1 and 2) of Study NP30179, a multicenter, open-label, phase 1 trial investigating the safety, efficacy, tolerability, pharmacokinetic variables, and pharmacodynamic biomarkers of glofitamab after a fixed, single dose of Gpt. Patient inclusion and study design have been previously reported.6 Briefly, patients had at least 1 prior lymphoma treatment and at least 1 measurable target lesion of >1.5 cm. All enrolled patients received an initial 1000 mg dose of Gpt 7 days before receiving glofitamab. Dose escalation was guided by a Bayesian-modified continuous reassessment method.7 Glofitamab was administered at doses of 5 µg to 25 mg for up to 12 cycles once every 2 or 3 weeks. Response assessments were conducted at baseline, after 2 and 5 cycles, at the end of treatment, and every 3 months until disease progression. Overall response rates, best overall response, and complete response (CR) rates were evaluated per the Lugano classification.8
All patients provided written informed consent. The trial was approved by each center’s ethics committee or institutional review board and was performed in compliance with the Declaration of Helsinki and International Conference on Harmonisation Guidelines for Good Clinical Practice.
Specimen collection
Blood samples were collected from all patients at predefined time points per clinical protocol during the course of treatment. T/B/natural killer (NK) cells, activated T/B/NK cells, proliferating T cells, naive and memory T cells, and regulatory T cells were evaluated centrally by using validated flow cytometry analyses (Q2 Solutions, Livingstone, United Kingdom). Plasma samples were collected for cytokine (B cell–activating factor, interleukin [IL]-1β, IL-2, IL-6, IL-8, IL-10, IL-15, IL-17, interferon-γ [IFN-γ], monocyte chemoattractant protein-1, macrophage inflammatory protein-1β, soluble IL-2R, transforming growth factor-β, and tumor necrosis factor-α) analysis using validated multiplex immunoassays on a ProteinSimple Ella platform or by a single enzyme-linked immunosorbent assay for transforming growth factor-β (Microcoat Biotechnologie GmbH, Bernried am Starnberger See, Germany).
Patients entering the study also provided a baseline biopsy sample, fresh (n = 24) or a formalin-fixed, paraffin-embedded archival specimen (n = 35; median age of 4 months), for retrospective immunohistochemical (IHC) and genomic biomarker analyses. Biopsy samples were optionally collected 2 or 7 weeks after the first glofitamab infusion to study the drug’s mode of action. Biopsy specimens were sent to the central pathology laboratory (Targos Molecular Pathology GmbH, Kassel, Germany), and fresh tissues were embedded on receipt. All biopsy samples were quality checked by a pathologist on hematoxylin and eosin staining, and sections were provided to HistoGeneX (Antwerp, Belgium) for IHC and immunofluorescence (IF) analyses and to EA Genomics (Morrisville, NC) for DNA/RNA extraction and RNA sequencing. If quality and quantity allowed, the extracted DNA/RNA samples were also sent to Foundation Medicine (Cambridge, MA) for targeted sequencing using the FoundationOne Heme test. Although consecutive sections of the same biopsy sample were used for different analyses, we found that the gene expression and IHC/IF findings for biomarkers of interest were highly concordant (data not shown).
IHC and IF analyses
Tissue sections were stained at HistoGeneX for CD20 using the CONFIRM IHC (L26 Clone, chromogenic, diaminobenzidine) assay on a Ventana BenchMark XT (Roche Diagnostics, Penzberg, Germany) and for quantitation of CD8 (C8/144B, Abcam, Cambridge, United Kingdom)/Ki67 (clone 30.9)-positive cells using a duplex IF assay on a Discovery XT platform (Roche Diagnostics). Image quantifications were focused on the whole tumor area, including the diffuse or the pseudo-follicles (for CD20 IHC and CD8/Ki67 IF). The hematoxylin and eosin assessment and consecutive CD20-stained slides were used to define the tumor area. For CD20 staining, H scores were calculated by using the following formula: (3 × percentage of strongly staining cell membranes + 2 × percentage of moderately staining cell membranes + percentage of weakly staining cell membranes), giving a range of 0 to 300. CD8/Ki67 nucleated cells, determined by Hoechst counterstaining, were enumerated across the entire tumor region, and fractions were provided as the percentage of total nucleated cells. Cells were classified accordingly as CD8+Ki67+, CD8+Ki67–, CD8–Ki67+, and CD8–Ki67–. A board-certified pathologist reviewed the results.
Gene expression analysis
Normalized expression values (transcripts per million [TPM]) were obtained by using an in-house next-generation sequencing with RNA-sequencing pipeline. Briefly, base calling was performed with BCL to FASTQ file converter bcl2fastq2 version 2.20.0 (Illumina, San Diego, CA).9 FASTQ files were quality checked with FastQC version 0.11.5.10 RNA-sequencing paired-end reads were mapped onto the human genome (build hg38) with read aligner STAR version 2.5.2a using default mapping parameters.11 Aligned reads were quality checked with MultiQC version 1.7.12 Number of mapped reads for all RefSeq and/or Ensembl transcript variants of a gene were combined into a single value (ie, count), assuming unstranded library, by featureCounts version 1.5.213 and normalized as TPM.
To predict cell-of-origin (COO) from RNA-sequencing samples, a new COO classifier was defined using data from the GOYA clinical trial dataset (GSE125966).14 Starting from a list of 165 COO-associated genes, penalized regression was used to select the features most strongly associated with the NanoString Linear Predictor Score (LPS). The final list of features contained a total of 21 genes (BATF, GNA13, PIM2, CCDC50, MAST2, TNFRSF13B, SACS, HCK, SERPINA9, IRF4, ITPKB, MME, MYBL1, CYB5R2, BSPRY, MAML3, CREB3L2, SMARCA4, ASB13, LIMD1, and S1PR2), including 11 that are included in the NanoString prediction model. Weights for each gene were determined by using a linear model, and the final COO determination was made by using the same cutoffs as NanoString (germinal center B cell–like, LPS <1920; activated B cell–like, LPS >2430). To apply this model to other data sets, the RNA-sequencing data are first normalized by using a robust library size estimation with the GOYA data as a reference. LPS scores and COO calls were then calculated based on the fitted model weights.
Mutational analysis
Exons from 465 cancer-related genes were analyzed for base substitutions, small insertions and deletions, copy number alterations (focal amplifications and homozygous deletions), and gene fusions/rearrangements, as previously described.15 Only mutations known or likely to be pathogenic were included in the analysis, and alterations were summarized as presence/absence calls for each gene.
Gene signatures
TPM were log-transformed and analyzed using limma, with the International Prognostic Index (IPI; >2 or ≤2) and log(glofitamab dose) as fixed factors. Scores of signatures were computed by using BioQC,16 taking into account the biserial rank correlation as a qualitative measure of enrichment for a signature. Similar to log-transformed TPM, the signature scores were then analyzed using limma, with IPI (>2 or ≤2) and log(glofitamab dose) as fixed factors.
Statistical analysis
Statistical analyses were performed by using SAS JMP Pro version 15.1 (SAS Institute, Inc., Cary, NC) and R version 3.5.0 (R Foundation for Statistical Computing, Vienna, Austria). Associations between baseline biomarker values or changes from baseline value at a particular time point and best overall response (eg, CR vs partial response [PR]/stable disease/progressive disease) were measured with the use of a logistic regression model in samples of aggressive NHL only (including diffuse large B-cell lymphoma [DLBCL], transformed follicular lymphoma, and Richter’s transformation), after accounting for log(glofitamab dose) and IPI category. The latter was defined as “low-mid category” for IPI scores ≤2, and “mid-high category” for IPI scores >2. The P values and confidence intervals were not adjusted for multiple testing. Association between COO and response was analyzed by using a χ2 test.
Results
Patient population
In total, 122 patients with R/R NHL were enrolled in fixed-dose, monotherapy, dose-escalation parts 1 and 2 of Study NP30179 between February 2017 and December 2019.6 The biomarker objectives included assessment of pharmacodynamic modulations and association with response. Data included peripheral blood immunophenotyping by flow cytometry (n = 119), plasma cytokine measurement by enzyme-linked immunosorbent assay (n = 119), IHC/IF analysis of pretreatment (n = 59) and on-treatment (n = 3) tumor biopsy samples, and bulk RNA-sequencing (n = 35) and mutational profiling by targeted-sequencing using the FoundationOne Heme panel (n = 33) on pretreatment biopsy specimens.
Gpt effectively depletes peripheral B cells
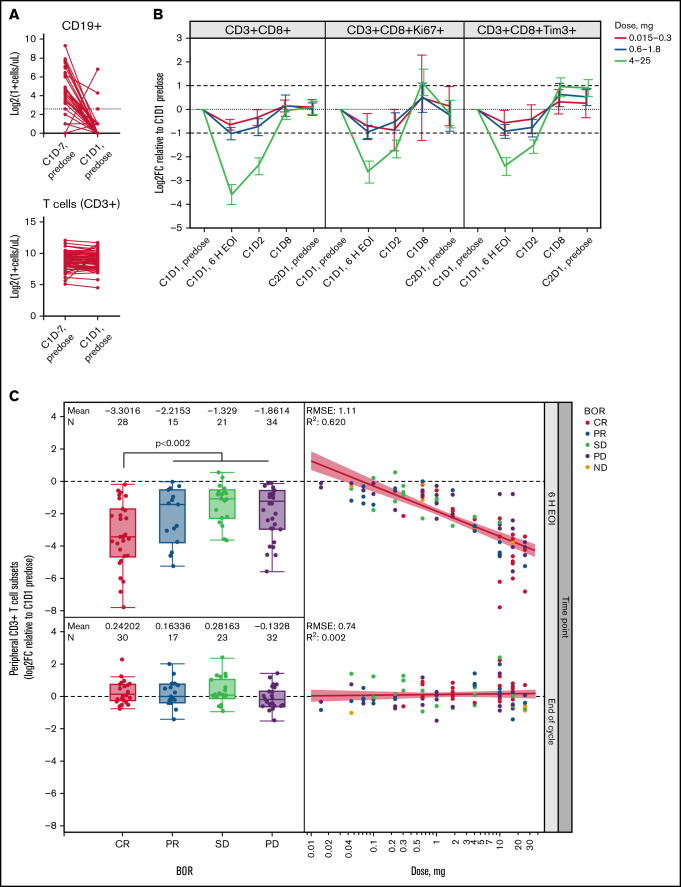
To reduce the risk of cytokine release syndrome, a single dose of 1000 mg Gpt was administered to every patient 7 days before the first dose of glofitamab to de-bulk peripheral blood and secondary lymphoid organ B cells.5,17 We evaluated absolute peripheral blood cell counts before Gpt (C1D-7, predose) and 7 days after Gpt (ie, before the first dose of glofitamab, C1D1, predose) by flow cytometry (Figure 1A). We observed that peripheral CD19+ B-cell counts before Gpt were low in most patients. This was most likely due to multiple prior lines of anti-CD20 immuno-chemotherapy regimens. Nevertheless, peripheral CD19+ B-cell counts at C1D1 predose were successfully depleted in nearly all patients, whereas the total number of monocytes, T, and NK cells remained largely unaffected (Figure 1A; supplemental Figure 1A).
Figure 1.
T-cell margination after first glofitamab infusion is dose and response dependent. (A) Flow cytometric analysis of peripheral CD19+ B cells and CD3+ T cells before obinutuzumab pretreatment (C1D-7, predose) and before the first glofitamab infusion (C1D1, predose; n = 110 pairs). Dotted line indicates 5 cells/µL. (B) Graphs represent log2 fold change (Log2FC) from baseline (C1D1 predose) of peripheral CD8+ T-cell subsets at indicated time points during C1, as measured by flow cytometry. Error bars indicate confidence intervals, dotted lines indicate baseline levels, and dashed lines indicate twofold change from baseline. (C) Box plots (left) represent Log2FC from baseline (C1D1 predose) of peripheral CD3+ T cells at 6 hours’ post–end of infusion (6 H EOI; top) and end of C1 (bottom) time points, as measured by flow cytometry, in relation to the best overall response (BOR). Scatter plots (right) indicate the correlation between Log2FC from baseline (C1D1 predose) of peripheral CD3+ T cells and the administered glofitamab dose (milligrams) at 6 H EOI (top) and end of C1 (bottom) time points. Data in panels B and C are from n = 119 patients with evaluable flow cytometry data. Colors indicate BOR categories. P value represents CR vs PR/stable disease (SD)/progressive disease (PD) and was not adjusted for log(glofitamab dose) and IPI category. C, cycle; D, day; ND, not disclosed; RMSE, root mean square error.
T-cell margination, activation, and proliferation in peripheral blood show glofitamab dose dependency
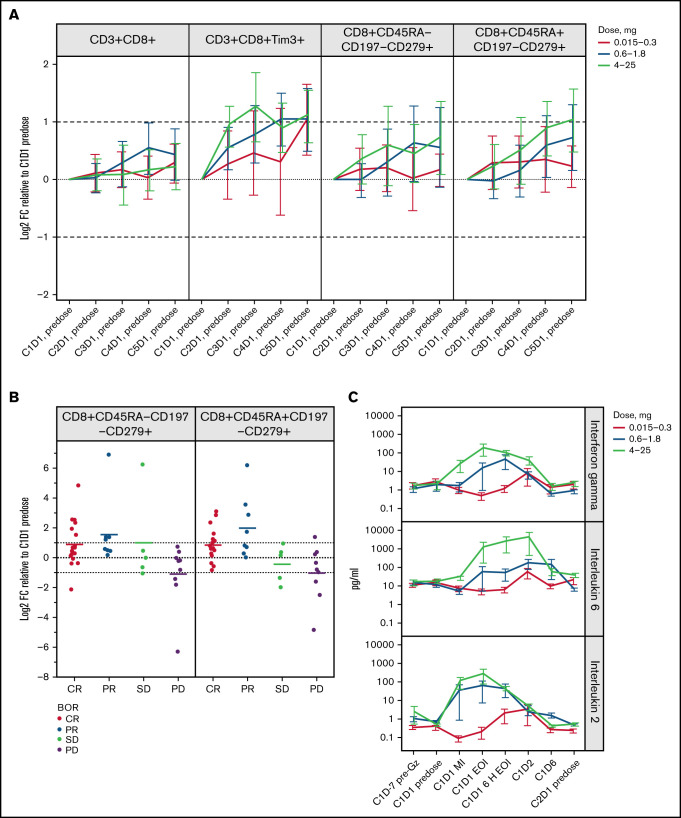
We observed a strong, transient glofitamab dose-dependent reduction of peripheral blood CD8+ and CD4+ T-cell counts within 20 hours’ post-glofitamab infusion in C1, which was reversed by the end of the cycle (Figure 1B; supplemental Figure 1B). The reduction of T-cell counts reached a nadir ∼6 hours after the end of glofitamab infusion, and the magnitude of change was significantly greater in patients with clinical CR compared with other response categories (P < .002 without adjustment for dose and prognostic factors) (Figure 1C). The transient dose- and response-dependent margination effect was not observed in the subsequent cycles (supplemental Figure 1C). By day 8 post-glofitamab infusion (C1D8), we observed a twofold dose-dependent, transient induction of proliferating (Ki67+) and TIM3+ CD8+ and CD4+ T-cell subsets in the peripheral blood (Figure 1B, supplementary Figure 1B), which persisted for 5 treatment cycles in the ≥0.6 mg dose cohorts (Figure 2A). In addition, we observed a dose-dependent twofold expansion of differentiated programmed cell death protein 1 (PD1) (CD279)+ CD8+ effector memory (Tem) and effector memory T cells re-expressing CD45RA (Temra) in the ≥0.6 mg dose cohorts in CR/PR patients (C3 onward) (Figure 2B; supplemental Figure 1D), similar to their PD1- parental populations (data not shown). The strongest immuno-pharmacodynamic trend was seen in the 4 to 25 mg dose cohorts, although this was not statistically significant. Together, the dynamic profile of peripheral T-cell markers associated with activation, proliferation, and differentiation provide adequate proof of mechanism for glofitamab in the clinic.
Figure 2.
Induction of T-cell memory subsets and inflammatory cytokines are associated with the pharmacodynamic profile of glofitamab. (A) Graphs represent Log2 fold change (Log2FC) from baseline (C1D1 predose) of peripheral CD8+ T-cell subsets measured by flow cytometry on the first day (D1 predose) of the first 5 cycles. Error bars indicate confidence intervals. Data generated from n = 119 patients with evaluable flow cytometry data. (B) Plots show Log2FC from baseline (C1D1 predose) of CD8+ T-cell effector memory subsets measured by flow cytometry on the first day of cycle 3 (C3D1, predose) for the 4 to 25 mg dose cohort. The x-axes indicate the best overall response (BOR). Means of each response category are shown, and error bars indicate confidence intervals. P values >.05 for CR vs PR/stable disease (SD)/progressive disease (PD) and were not adjusted for log(glofitamab dose) and IPI category. (C) Plasma cytokine concentrations (pg/mL) of IFN-γ, IL-6, and IL-2 are shown at indicated time points, including before obinutuzumab pretreatment and during the first cycle before infusion, mid-infusion (MI), and end of infusion (EOI). Data generated from n = 119 patients with evaluable cytokine data. The y-axes are in logarithmic scales. Error bars indicate standard error of the mean. In panels A and B, dotted lines indicate baseline levels, and dashed lines indicate twofold change from baseline. 6 H EOI, 6 hours post-end of infusion; C, cycle; D, day; Gz, obinutuzumab; CD45RA−CD197−, Tem; CD45RA+CD197−, Temra.
Dose-dependent induction of inflammatory cytokines
In addition to the pharmacodynamic changes in peripheral blood T cells, we observed a dose-dependent and transient induction of most peripheral blood inflammatory cytokines (IFN-γ, IL-6, IL-2, IL-8, IL-10, IL-15, IL-17, IL-1β, monocyte chemoattractant protein-1, macrophage inflammatory protein-1β, soluble IL-2R, and tumor necrosis factor-α) immediately after the first glofitamab infusion (C1) (Figure 2C; supplemental Figure 2A). In the 4 to 25 mg dose cohorts, the IFN-γ and IL-2 levels peaked at the end of first infusion, reaching an average of 168 pg/mL and 275 pg/mL, respectively, whereas IL-6 levels peaked later at 6 hours after the end of infusion, reaching an average of 3931 pg/mL. However, the IFN-γ and IL-6 release peaked later and considerably lower in the intermediate-dose cohorts (0.6 1.8 mg), at 6 hours and 24 hours after the end of infusion (IFN-γ average, 42 pg/mL; IL-6 average, 167 pg/mL) (Figure 2C). Whereas the cytokine release in C1 provided a bona fide pharmacodynamic biomarker linked to glofitamab activity,5 the cytokine release was not associated with clinical response (data not shown) and was diminished in subsequent cycles (supplemental Figure 2B-D).
Glofitamab induces spatial reorganization of CD8+ T cells in tumors
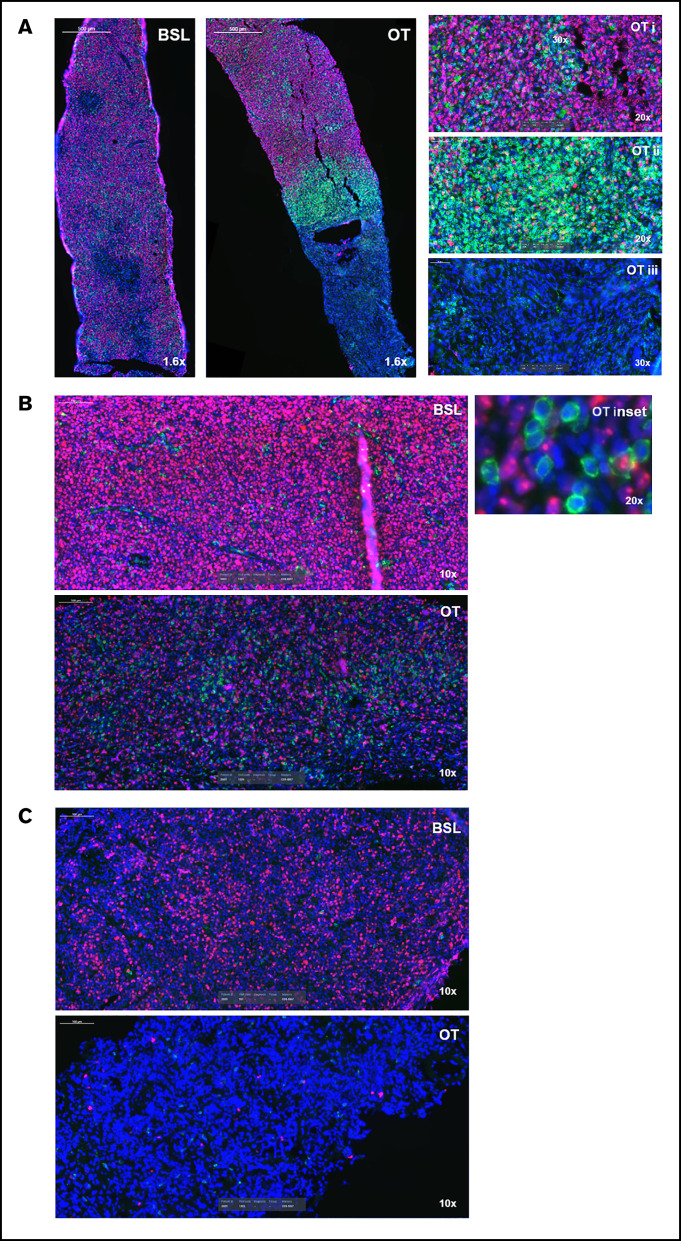
We analyzed a limited number of paired tumor biopsy samples (n = 3) by IHC and IF to explore the effects of glofitamab on the immune component of the tumor microenvironment. The first case was a patient with DLBCL who achieved a PR (clinical response assessment at C3D1), and the on-treatment biopsy was taken 2 weeks after the first glofitamab (0.22 mg) infusion (C2D1). The tumor cells of the on-treatment biopsy sample were interspersed with and surrounded by abundant CD8+ T cells with a higher density than the pretreatment baseline biopsy sample (Figure 3A). This area was close to a dense band of closely packed CD8+ T cells, with less viable tumor cells followed by necrotic tissue, indicating an earlier tumor lysis event. A second case was a patient with DLBCL who had an on-treatment biopsy specimen taken after 3 glofitamab doses of 10 mg (∼7 weeks into treatment). Despite progressing (as shown by the detection of a new lesion), the on-treatment biopsy specimen (taken from the same lesion as the baseline biopsy) was interspersed with CD8+ T cells in close proximity to the highly proliferative tumor cells, unlike the baseline biopsy sample itself (Figure 3B). The third case was another patient with DLBCL who achieved a PR (C3D1), with an on-treatment biopsy specimen taken 2 weeks after the first glofitamab infusion (0.6 mg). The on-treatment biopsy sample revealed extensive areas of necrosis, suggesting earlier tumor lysis events (Figure 3C). These observations, albeit anecdotal, provide proof of mechanism by showing spatial reorganization of T cells and necrosis within the tumor due to T cell–mediated cell lysis after glofitamab infusion.
Figure 3.
Glofitamab treatment induces spatial reorganization of CD8+ T cells in tumors. Images represent CD8+ (green), Ki67+ (pink), and 4′,6-diamidino-2-phenylindole (blue) immunofluorescence analysis of 3 DLBCL core biopsy specimens at baseline (BSL; before obinutuzumab pretreatment) and during treatment (OT). OT biopsy samples were taken on the first day of the second cycle (predose) (A and C) and on the eighth day of the third cycle (B). The insets in panel A indicate proliferative tumor cores (i), CD8+ T-cell area surrounding the core (ii), and area of necrosis (iii). The inset in panel B shows tumor cells (pink) interspersed and in close contact with CD8+ T cells (green). The OT biopsy in panel C is completely necrotic.
Baseline blood and tissue biomarkers, including gene expression and mutational status, are associated with response to glofitamab
As mentioned in the previous section, sustained pharmacodynamic peripheral blood activity was observed at dose levels ≥0.6 mg, which coincided with the observation of reproducible CR in patients treated with ≥0.6 mg of glofitamab.6 We therefore investigated the association between pretreatment peripheral blood and tissue biomarkers with CR in ≥0.6 mg dose cohorts, using a statistical model with log(glofitamab dose) and IPI as covariables accounting for drug exposure and the main prognostic factors, respectively. Patients with indolent NHL were excluded from this particular CR association analysis due to the small sample size, and herein we focus on patients with aggressive NHL.
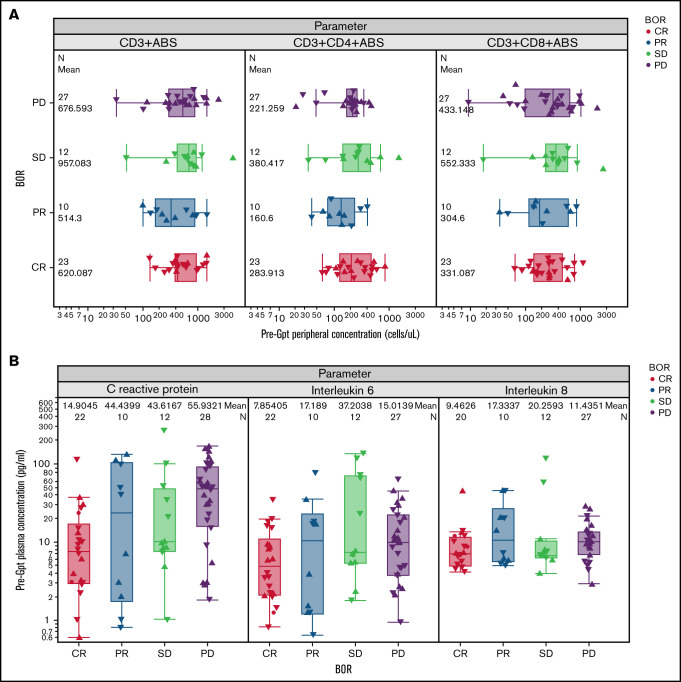
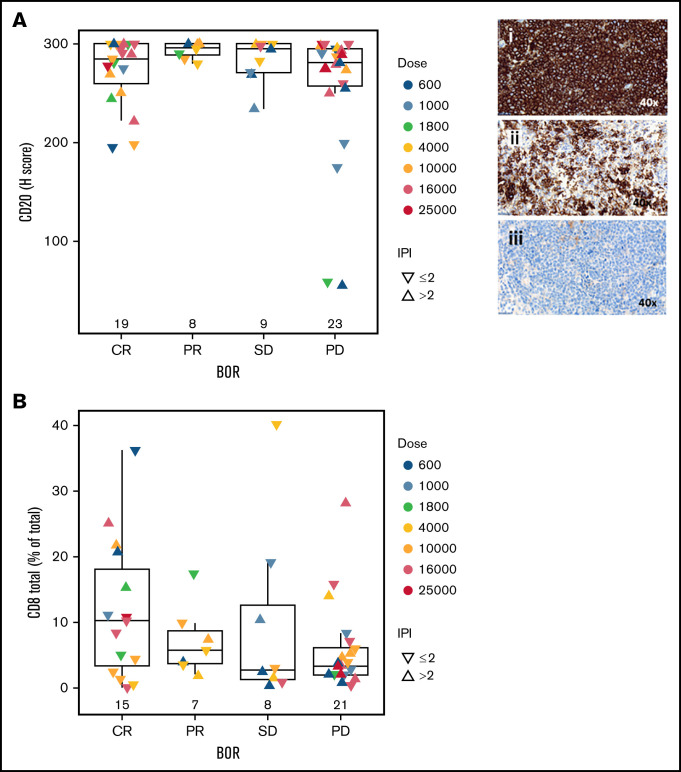
Baseline levels of peripheral blood immune subsets including CD3+, CD4+, and CD8+ T cells did not show a significant association with CR (Figure 4A). However, CR patients had lower levels of C-reactive protein (CRP), IL-6, and IL-8 at baseline compared with other response groups (CRP, P = .004; IL-6, P = .07; IL-8, P = .06) (Figure 4B). In addition to peripheral blood biomarkers, we analyzed B and T cells in pretreatment tumor biopsy specimens to explore their association with CR. Importantly, the percentage and intensity of CD20 staining (H score) and percentage of proliferating (Ki67+) tumor cells were not associated with CR, although there was a trend toward a higher fraction of proliferative tumor cells in progressing patients (Figure 5A; supplemental Figure 3A). Two patients with low CD20 staining intensity (H score <60) progressed after glofitamab treatment. Furthermore, we observed a trend toward a higher percentage of CD8+ T cells at tumor baseline in CRs (P = .1) (Figure 5B) that could also be observed in CD8+ Ki67+/− fractions (supplemental Figure 3B-C).
Figure 4.
Association of baseline blood biomarkers with response to glofitamab. (A) Box plots show the baseline (pre-obinutuzumab pretreatment [Gpt]) peripheral concentrations of CD3+, CD4+, and CD8+ T cells in relation to the best overall response (BOR) categories, as measured by flow cytometry (n = 75). P values >.05. (B) Box plots represent the baseline (pre-Gpt) plasma concentrations of CRP, IL-6, and IL-8 in relation to the BOR categories (n = 72). CRP (P = .004), IL-6 (P = .07), and IL-8 (P = .06) levels were lower at baseline in patients who achieved a CR compared with other response categories (PR, stable disease [SD], progressive disease [PD]).
Figure 5.
Association of baseline tissue biomarkers with response to glofitamab. Box plots demonstrate CD20 H score (immunohistochemistry; n = 59) (A) and percentage of total CD8+ T cells (out of total cells in tumor area; immunofluorescence; n = 51) (B) in baseline tumor biopsy specimens in relation to the best overall response (BOR) categories. P values >.05. In panel A, images represent H scores of 300 (i), 175 (ii), and 59 (iii). Statistical analyses were performed for CR vs PR/stable disease (SD)/progressive disease (PD) and adjusted for log(glofitamab dose) and IPI category.
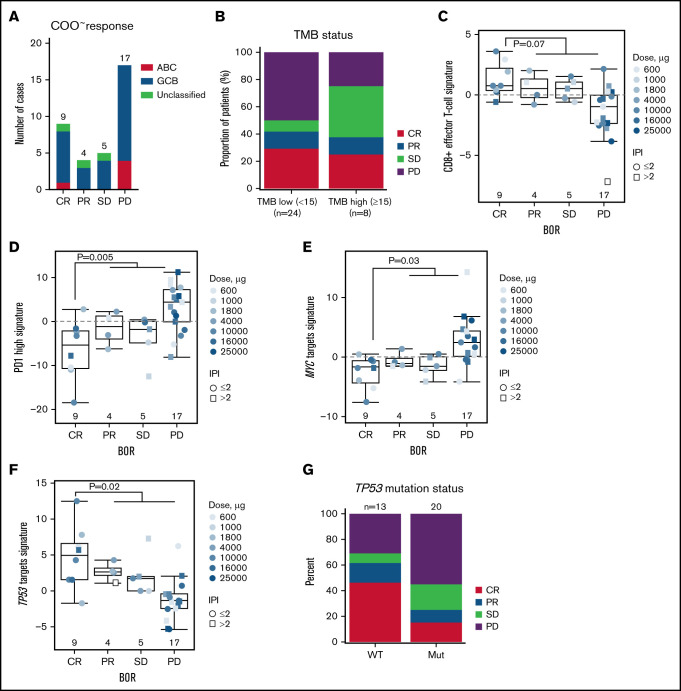
We next analyzed the gene expression (n = 35) and mutational profile (n = 33) of pretreatment biopsy samples to identify biomarkers that are associated with CR. Biopsies were optional per protocol and hence available for a subpopulation only. Statistical analysis accounted for glofitamab dose and IPI to factor in biomarker evaluable population differences. COO analysis by RNA-sequencing identified 5 patients with activated B cell–like, 27 patients with germinal center B-cell–like, and the remaining 3 with unclassified DLBCL (Figure 6A). However, there was no association with COO and CR (P = .90). Similarly, tumor mutational burden did not correlate with CR (P = .95) (Figure 6B). Interestingly, gene expression signature analysis, using a statistical model with log(glofitamab dose) and IPI as covariables, revealed a trend toward a higher effector-like CD8+ T-cell and significantly lower PD-1 high T-cell signatures18,19 in tumors of CR patients (Figure 6C-D; supplemental Table 1).
Figure 6.
Association of gene expression signatures and mutational status of baseline tumors with response to glofitamab. (A) Bar plots show the distribution of COO classes in baseline biopsy samples (analyzed by RNA-sequencing) according to the best overall response (BOR) category (P = .9). (B) Bar plots represent the distribution of the BOR categories in tumor mutational burden (TMB) low subsets (<15 mutations/Mb) and high subsets (≥15 mutations/Mb), measured by targeted-sequencing in baseline biopsy samples (P = .95). Box plots show signature scores (RNA-sequencing) of baseline biopsy samples for CD8+ effector T cells (C), PD1 high (D), MYC (E), and TP53 (F) target genes in different BOR categories. Values above 0 indicate signature enrichments in each biopsy. (G) Bar plots represent distribution of the BOR categories in TP53 wild-type (WT) and mutant (mut) subsets measured by targeted-sequencing in baseline biopsy samples (P = .09). Statistical analyses in panels B to F were performed for CR vs PR/stable disease (SD)/progressive disease (PD) and adjusted for log(glofitamab dose) and IPI category. Data in panel A and panels C to F are generated from n = 35 patients with RNA-sequencing data, and in panels B and G from n = 33 patients with targeted sequencing data. ABC, activated B-cell; GCB, germinal center B-cell.
In addition to immune-related signatures, we unbiasedly identified upregulated MYC targets and downregulated TP53 target signatures20,21 to be significantly associated with non-CRs (Figure 6E-F; supplemental Table 1). Intriguingly, a significantly negative correlation was also observed between CD8A expression and the MYC signature scores, whereas CD8A expression was positively correlated with the TP53 signature scores (supplemental Figure 4A-B). Together, these observations point to a more proliferative, aggressive, and immunosuppressive lymphoma phenotype in non-CR patients.22-26 Furthermore, mutational profiling of pretreatment biopsy samples with matched gene expression data showed a trend toward more non-CR patients in the TP53 mutant group (P = .09) (Figure 6G). Consistent with the loss-of-function nature of these mutations, we also observed a significantly lower enrichment of TP53 target expression in the TP53 mutant group, thus explaining the lower expression of TP53 target genes in non-CRs. However, CD8A expression levels were not associated with TP53 mutational status (supplemental Figure 4C-F).
Discussion
Assessment of pharmacodynamic and response-associated biomarkers is essential in early clinical development, enabling a deeper understanding of the mechanism of action, dose optimization, and ultimately improving the overall success rate of clinical trials.27
Clinical evidence of the expected mode of action of glofitamab was shown in the current study. Assessment of pharmacodynamic effects aims to support identification of an optimal biological dose. To ensure clinical relevance of the optimal biological dose, it is favorable to select pharmacodynamic biomarkers that are associated with clinical benefit. For the first time, our study identified that the magnitude of T-cell margination and effector memory expansion is not only associated with dose but also with clinical benefit. Peripheral blood cytokines are commonly used as surrogate markers for immune and T-cell activation28,29 and were shown to increase with escalating glofitamab dose in this study. Combined consideration of all pharmacodynamic biomarkers showed that a dose of 0.6 mg glofitamab is the lowest dose associated with T-cell activation and that doses >0.6 mg are beneficial to maximize T-cell activation. Furthermore, the reduction of inflammatory cytokine release in the intermediate-dose cohorts (0.6-1.8 mg) provides a rationale for exploration of step-up dosing regimens to uncouple cytokine release syndrome and cytotoxicity. Finally, combined consideration of clinical, pharmacodynamic, and safety data led to investigation of a step-up dosing regimen to improve tolerability by decreasing the rate of cytokine release syndrome in the initial dosing, while maximizing T-cell activation and tumor killing.6
Despite successful demonstration of mode of action and highly encouraging single-agent activity of glofitamab in heavily pretreated and refractory B-NHL, some patients did not achieve clinical responses. The inevitable question is: what are the underlying resistance mechanisms? Glofitamab monotherapy clinical activity seems to be independent of pretreatment peripheral blood T-cell counts and their activation or differentiation status, tumor-infiltrating T-cell counts, COO, and tumor mutational burden, indicating that glofitamab is effectively applicable in a broad patient population. Although CD20 expression is a prerequisite for response to glofitamab as expected, magnitude of CD20 expression intensity before treatment does not seem to be predictive for response.
Interestingly, baseline levels of factors involved in adaptive immunity impairment (CRP, IL-6, and IL-8) appeared to be higher in the plasma of nonresponding patients. Elevated levels of CRP and IL-8 have been shown to be associated with poor prognosis to immunotherapies,30-33 and CRP also reportedly negatively affects immunologic synapse formation and early events in T-cell receptor engagement.34 These observations overlap with risk factors reported for resistance to CAR T-cell therapies.35 The preexisting unfavorable environment for T-cell engagement and killing might, at least partly, contribute to resistance to glofitamab.36
In the current study, we found evidence that baseline characteristics of the tumor may be associated with resistance to glofitamab monotherapy and disease progression. Tumors of patients achieving CR showed enrichment for gene transcripts associated with CD8+ T-effector cells at baseline, while progressing tumors exhibited a high PD1 signature phenotype at baseline that was previously described to be associated with dysfunctional tumor-infiltrating lymphocytes.19 Transcriptionally distinct and dysfunctional T-cell phenotypes have lately been associated with resistance to anti–PD-1/PDL-1 therapy in patients with non–small cell lung cancer.37 Together, these results show the potential importance of distinct T-cell populations for response to cancer immunotherapy. Interpretation of these specific gene signatures should be made with caution because definite judgment of T-cell functionality cannot be drawn based on bulk gene expression only; for example, PD1 expression is not only restricted to dysfunctional T cells, and further single-cell high-dimensional and functional analyses are required to address T-cell functionality.
In addition, whereas TP53 mutational status was not significantly associated with resistance, overexpression of MYC and downregulation of TP53 targets were shown to be significantly associated with resistance to glofitamab. MYC amplification and TP53 mutations are known abnormalities in B-NHL and are linked to poor prognosis.23-26 Importantly, recent studies have highlighted the impact of TP53 mutations on immune escape and promotion of an immunosuppressive microenvironment that might be the primary driver of the poor prognosis in this molecularly defined subset.22,38-40 Taken together, these tumor cell intrinsic factors may also be associated with disease progression but might also be interlinked with a diminished effector T-cell profile and thus represent a poor prognostic factor per se.
To maximize the relevance of the response prediction analysis, confounding factors such as dose and IPI were taken into account in our statistical model. However, these analyses are still limited due to nonrandomization, small sample size, potential sampling bias due to limitations of sample availability, and heterogeneity of patients. Further studies are therefore required to define patient populations who may not benefit from treatment, especially in the step-up dosing and expansion cohorts planned at the recommended phase 2 dose.
Collectively, we show dose- and response-dependent effects and mechanism of action–related pharmacodynamic effects, some of which were associated with clinical activity and key to supporting dose optimization. Furthermore, the current study provides insights into potential tumor intrinsic modes of resistance that we believe may be relevant for T cell–bispecific therapies to enable future patient enrichment and inform combination strategies for glofitamab.
Supplementary Material
The full-text version of this article contains a data supplement.
Acknowledgments
The authors thank the patients and their families, as well as the study investigators, study coordinators, nurses, and representatives of the sponsor, who were involved in data collection and analyses.
Study NP30179 was sponsored by F. Hoffmann–La Roche Ltd. Third-party medical writing assistance, under the direction of the authors, was provided by Khalida Rizi and Stephanie Cumberworth of Ashfield MedComms, an Ashfield Health company, and was funded by F. Hoffmann–La Roche Ltd.
Authorship
Contribution: A.-M.E.B. designed research, analyzed and interpreted data, and wrote the manuscript; K.K. analyzed and interpreted data, and wrote the manuscript; A.B., S.W. and C.-H.O. analyzed and interpreted data, and performed statistical analysis; C.R.B., I.J., E.C.P., D.J.C., P.U., and M.B. analyzed and interpreted data; M.C. and E.G.A. performed research, and analyzed and interpreted data; N.D. performed statistical analysis; and M.W. and M.D. designed research, and analyzed and interpreted data.
Conflict-of-interest disclosure: A.-M.E.B. is an employee of and owns shares in F. Hoffmann–La Roche Ltd. K.K. is an employee of and owns shares in Roche Glycart AG. A.B. is an employee of F. Hoffmann–La Roche Ltd. C.-H.O. is an employee of and owns shares in F. Hoffmann–La Roche AG. C.R.B. is an employee of Genentech, Inc.; and has equity ownership in F. Hoffmann–La Roche Ltd. M.C. is an employee of and owns shares in F. Hoffmann–La Roche Ltd. I.J. is an employee of A4P, which provides services for F. Hoffmann–La Roche Ltd. E.C.P. is an employee of Genentech, Inc.; and has equity ownership in F. Hoffmann–La Roche Ltd. D.J.C. is an employee of F. Hoffmann–La Roche Ltd.; and reports shares in F. Hoffmann–La Roche Ltd. and AstraZeneca. N.D. is an employee of F. Hoffmann–La Roche Ltd. P.U. is an employee of, owns shares in, and is a coinventor in patents and patent applications owned by F. Hoffmann–La Roche Ltd. M.B. is an employee of, owns shares in, and holds patents with F. Hoffmann–La Roche Ltd. M.W. is an employee of and owns shares in F. Hoffmann-La Roche Ltd. M.D. reports consulting or advisory roles with Novartis, Bristol Myers Squibb, Gilead Sciences, and Janssen; an immediate family member has had a consulting or advisory role with F. Hoffmann–La Roche Ltd.; reports speakers bureau with Novartis; travel, accommodations, and expenses from F. Hoffmann–La Roche Ltd; and honoraria from F. Hoffmann–La Roche Ltd., Amgen, Merck Sharp & Dohme, Janssen, Bristol Myers Squibb, and Novartis. M.D. also reports their institution has received research funding from Novartis, F. Hoffmann–La Roche Ltd, Takeda, Bristol Myers Squibb, and Merck Sharp & Dohme. The remaining authors declare no competing financial interests.
Correspondence: Ann-Marie E. Bröske, Roche Innovation Center Munich, Roche Diagnostics GmbH, Nonnenwald 2, 82377, Penzberg, Germany; e-mail: ann-marie.broeske@roche.com.
References
- 1.Salles G, Barrett M, Foà R, et al. Rituximab in B-cell hematologic malignancies: a review of 20 years of clinical experience. Adv Ther. 2017;34(10):2232-2273. [DOI] [PMC free article] [PubMed] [Google Scholar]
- 2.Hübel K, Ghielmini M, Ladetto M, Gopal AK. Controversies in the treatment of follicular lymphoma. HemaSphere. 2020;4(1):e317. [DOI] [PMC free article] [PubMed] [Google Scholar]
- 3.Sehn LH, Berry B, Chhanabhai M, et al. The revised International Prognostic Index (R-IPI) is a better predictor of outcome than the standard IPI for patients with diffuse large B-cell lymphoma treated with R-CHOP. Blood. 2007;109(5):1857-1861. [DOI] [PubMed] [Google Scholar]
- 4.Galon J, Rossi J, Turcan S, et al. Characterization of anti-CD19 chimeric antigen receptor (CAR) T cell-mediated tumor microenvironment immune gene profile in a multicenter trial (ZUMA-1) with axicabtagene ciloleucel (axi-cel, KTE-C19). J Clin Oncol. 2017;35(15):3025. [Google Scholar]
- 5.Bacac M, Colombetti S, Herter S, et al. CD20-TCB with obinutuzumab pretreatment as next-generation treatment of hematologic malignancies. Clin Cancer Res. 2018;24(19):4785-4797. [DOI] [PubMed] [Google Scholar]
- 6.Hutchings M, Morschhauser F, Iacoboni G, et al. Glofitamab, a novel, bivalent CD20-targeting T-cell–engaging bispecific antibody, induces durable complete remissions in relapsed or refractory B-cell lymphoma: a phase I trial. J Clin Oncol. 2021;39(18):1959-1970. [DOI] [PMC free article] [PubMed] [Google Scholar]
- 7.Liu S, Yin G, Yuan Y. Bayesian data augmentation dose finding with continual reassessment method and delayed toxicity. Ann Appl Stat. 2013; 7(4):1837-2457. [DOI] [PMC free article] [PubMed] [Google Scholar]
- 8.Cheson BD, Fisher RI, Barrington SF, et al. ; United Kingdom National Cancer Research Institute . Recommendations for initial evaluation, staging, and response assessment of Hodgkin and non-Hodgkin lymphoma: the Lugano classification. J Clin Oncol. 2014;32(27):3059-3068. [DOI] [PMC free article] [PubMed] [Google Scholar]
- 9.bcl2fastq2 Conversion Software v2.20. Illumina; 2020. Available at: https://emea.support.illumina.com/sequencing/sequencing_software/bcl2fastq-conversion-software.html. Accessed 1 November 2020.
- 10.Fast QC. A quality control tool for high throughput sequence data. Babraham Institute; 2019. Available at: http://www.bioinformatics.babraham.ac.uk/projects/fastqc/. Accessed 1 November 2020.
- 11.Dobin A, Davis CA, Schlesinger F, et al. STAR: ultrafast universal RNA-seq aligner. Bioinformatics. 2013;29(1):15-21. [DOI] [PMC free article] [PubMed] [Google Scholar]
- 12.Ewels P, Magnusson M, Lundin S, Käller M. MultiQC: summarize analysis results for multiple tools and samples in a single report. Bioinformatics. 2016;32(19):3047-3048. [DOI] [PMC free article] [PubMed] [Google Scholar]
- 13.Liao Y, Smyth GK, Shi W. featureCounts: an efficient general purpose program for assigning sequence reads to genomic features. Bioinformatics. 2014;30(7):923-930. [DOI] [PubMed] [Google Scholar]
- 14.Bolen CR. GOYA DLBCL clinical trial–RNASeq dataset, geo, V1. 2019. Available at: https://www.ncbi.nlm.nih.gov/geo/query/acc.cgi?acc=GSE125966. Accessed 1 November 2020.
- 15.Frampton GM, Fichtenholtz A, Otto GA, et al. Development and validation of a clinical cancer genomic profiling test based on massively parallel DNA sequencing. Nat Biotechnol. 2013;31(11):1023-1031. [DOI] [PMC free article] [PubMed] [Google Scholar]
- 16.Zhang JD, Hatje K, Sturm G, et al. Detect tissue heterogeneity in gene expression data with BioQC [published correction appears in BMC Genomics. 2018;19(1):558]. BMC Genomics. 2017;18(1):277. [DOI] [PMC free article] [PubMed] [Google Scholar]
- 17.Mössner E, Brünker P, Moser S, et al. Increasing the efficacy of CD20 antibody therapy through the engineering of a new type II anti-CD20 antibody with enhanced direct and immune effector cell-mediated B-cell cytotoxicity. Blood. 2010;115(22):4393-4402. [DOI] [PMC free article] [PubMed] [Google Scholar]
- 18.Doering TA, Crawford A, Angelosanto JM, Paley MA, Ziegler CG, Wherry EJ. Network analysis reveals centrally connected genes and pathways involved in CD8+ T cell exhaustion versus memory. Immunity. 2012;37(6):1130-1144. [DOI] [PMC free article] [PubMed] [Google Scholar]
- 19.Thommen DS, Koelzer VH, Herzig P, et al. A transcriptionally and functionally distinct PD-1+ CD8+ T cell pool with predictive potential in non-small-cell lung cancer treated with PD-1 blockade. Nat Med. 2018;24(7):994-1004. [DOI] [PMC free article] [PubMed] [Google Scholar]
- 20.Yu D, Cozma D, Park A, Thomas-Tikhonenko A. Functional validation of genes implicated in lymphomagenesis: an in vivo selection assay using a Myc-induced B-cell tumor. Ann N Y Acad Sci. 2005;1059(1):145-159. [DOI] [PMC free article] [PubMed] [Google Scholar]
- 21.Scian MJ, Carchman EH, Mohanraj L, et al. Wild-type p53 and p73 negatively regulate expression of proliferation related genes. Oncogene. 2008;27(18):2583-2593. [DOI] [PubMed] [Google Scholar]
- 22.Blagih J, Buck MD, Vousden KH. p53, cancer and the immune response. J Cell Sci. 2020;133(5):jcs237453. [DOI] [PubMed] [Google Scholar]
- 23.Araf S, Korfi K, Bewicke-Copley F, et al. Genetic heterogeneity highlighted by differential FDG-PET response in diffuse large B-cell lymphoma. Haematologica. 2020;105(6):318-321. [DOI] [PMC free article] [PubMed] [Google Scholar]
- 24.Wang XJ, Medeiros LJ, Bueso-Ramos CE, et al. P53 expression correlates with poorer survival and augments the negative prognostic effect of MYC rearrangement, expression or concurrent MYC/BCL2 expression in diffuse large B-cell lymphoma. Mod Pathol. 2017;30(2):194-203. [DOI] [PubMed] [Google Scholar]
- 25.Zenz T, Kreuz M, Fuge M, et al. ; German High-Grade Non-Hodgkin Lymphoma Study Group (DSHNHL) . TP53 mutation and survival in aggressive B cell lymphoma. Int J Cancer. 2017;141(7):1381-1388. [DOI] [PubMed] [Google Scholar]
- 26.Ott G, Rosenwald A, Campo E. Understanding MYC-driven aggressive B-cell lymphomas: pathogenesis and classification. Blood. 2013;122(24):3884-3891. [DOI] [PubMed] [Google Scholar]
- 27.Cook D, Brown D, Alexander R, et al. Lessons learned from the fate of AstraZeneca’s drug pipeline: a five-dimensional framework. Nat Rev Drug Discov. 2014;13(6):419-431. [DOI] [PubMed] [Google Scholar]
- 28.Coyle L, Morley NJ, Rambaldi A, et al. Open-label, phase 2 study of blinatumomab as second salvage therapy in adults with relapsed/refractory aggressive B-cell non-Hodgkin lymphoma. Leuk Lymphoma. 2020;61(9):2103-2112. [DOI] [PubMed] [Google Scholar]
- 29.Costa L, Wong SW, Bermúdez A, et al. First clinical study of the B-cell maturation antigen (BCMA) 2 + 1 T cell engager (TCE) CC-93269 in patients (pts) with relapsed/refractory multiple myeloma (RRMM): interim results of a phase 1 multicenter trial. Blood. 2019;134(suppl 1):143. [Google Scholar]
- 30.Oya Y, Yoshida T, Kuroda H, et al. Predictive clinical parameters for the response of nivolumab in pretreated advanced non-small-cell lung cancer. Oncotarget. 2017;8(61):103117-103128. [DOI] [PMC free article] [PubMed] [Google Scholar]
- 31.Schalper KA, Carleton M, Zhou M, et al. Elevated serum interleukin-8 is associated with enhanced intratumor neutrophils and reduced clinical benefit of immune-checkpoint inhibitors. Nat Med. 2020;26(5):688-692. [DOI] [PMC free article] [PubMed] [Google Scholar]
- 32.Riedl JM, Barth DA, Brueckl WM, et al. C-reactive protein (CRP) levels in immune checkpoint inhibitor response and progression in advanced non-small cell lung cancer: a bi-center study. Cancers (Basel). 2020;12(8):2319. [DOI] [PMC free article] [PubMed] [Google Scholar]
- 33.Yuen KC, Liu LF, Gupta V, et al. High systemic and tumor-associated IL-8 correlates with reduced clinical benefit of PD-L1 blockade [published correction appears in Nat Med. 2021;27(3):560]. Nat Med. 2020;26(5):693-698. [DOI] [PMC free article] [PubMed] [Google Scholar]
- 34.Yoshida T, Ichikawa J, Giuroiu I, et al. C reactive protein impairs adaptive immunity in immune cells of patients with melanoma [published correction appears in J Immunother Cancer. 2020;8(1):e000234corr1]. J Immunother Cancer. 2020;8(1):e000234. [DOI] [PMC free article] [PubMed] [Google Scholar]
- 35.Cheng J, Zhao L, Zhang Y, et al. Understanding the mechanisms of resistance to CAR T-cell therapy in malignancies. Front Oncol. 2019;9:1237. [DOI] [PMC free article] [PubMed] [Google Scholar]
- 36.Cremasco F, Menietti E, Speziale D, et al. Cross-linking of T cell to B cell lymphoma by the T cell bispecific antibody CD20-TCB induces IFNγ/CXCL10-dependent peripheral T cell recruitment in humanized murine model. PLoS One. 2021;16(1):e0241091. [DOI] [PMC free article] [PubMed] [Google Scholar]
- 37.Sanmamed MF, Nie X, Desai SS, et al. A burned-out CD8+ T-cell subset expands in the tumor microenvironment and curbs cancer immunotherapy. Cancer Discov. 2021;11(7):1700-1715. [DOI] [PMC free article] [PubMed] [Google Scholar]
- 38.Pascual M, Mena-Varas M, Robles EF, et al. PD-1/PD-L1 immune checkpoint and p53 loss facilitate tumor progression in activated B-cell diffuse large B-cell lymphomas. Blood. 2019;133(22):2401-2412. [DOI] [PMC free article] [PubMed] [Google Scholar]
- 39.Ghosh M, Saha S, Bettke J, et al. Mutant p53 suppresses innate immune signaling to promote tumorigenesis. Cancer Cell. 2021;39(4): 494-508.e5. [DOI] [PMC free article] [PubMed] [Google Scholar]
- 40.Kotlov N, Bagaev A, Revuelta MV, et al. Clinical and biological subtypes of B-cell lymphoma revealed by microenvironmental signatures. Cancer Discov. 2021;11(6):1468-1489. [DOI] [PMC free article] [PubMed] [Google Scholar]
Associated Data
This section collects any data citations, data availability statements, or supplementary materials included in this article.


