Abstract
Mice with global deletion of Arid5b expression are lean and resistant to diet-induced obesity, and Arid5b is required for adipogenesis in a variety of in vitro models. To determine whether the lean phenotype of Arid5b−/− mice can be explained by its absence in adipose tissues, we generated mice with Fabp4-mediated ablation of Arid5b. Arid5b expression was ablated in adipocytes, from Fabp4-CREpos; Arid5bFLOX/FLOX (FSKO) mice. FSKO mice were not lean when maintained on standard chow, but males were resistant to weight gains when placed on high-fat diets (HFD). This was mainly due to decreased lipid accumulation in subcutaneous (inguinal) white adipose tissue (IWAT), and the liver. Lipid accumulation proceeded normally in gonadal WAT (GWAT) and glucose intolerance developed to the same degree in FSKO and WT controls when subjected to HFD. CD68-positive macrophages were also significantly reduced in both inguinal and gonadal fat depots. RNA-Seq analysis of IWAT adipocytes from FSKO mice on HFD revealed significant decreases in the expression of genes associated with inflammation. Although Arid5b expression was normal in livers of FSKO mice, tissue weight gains and triglyceride accumulation, and expression of genes involved in lipid metabolism were markedly reduced in livers of FSKO mice on HFD. These results suggest that Arid5b plays a critical role in lipid accumulation in specific WAT depots, and in the inflammatory signaling from WAT depots to liver that lead to lipid accumulation and hepatic steatosis.
Keywords: Arid5b, Obesity, Diet, Steatosis
Introduction:
The incidence of obesity and its associated co-morbidities continues to increase in the United States and throughout the developed world (Haczeyni et al., 2018). The rational design of strategies for the prevention and management of these conditions requires a more complete understanding of the processes that underlie the development of new adipocytes from stem cell populations, and the accumulation of lipid in both new and established adipocytes. It is now becoming evident that these processes differ at different times and in different adipose depots. The development of adipocytes in the perinatal period and in adult animals exposed to dietary stress involves an overlapping, but by no means identical set of genes (Wang et al., 2013, Wang et al., 2015, Lee et al., 2019). In response to dietary stress, the increased fat mass appears to involve fundamentally different processes in different fat depots (Wang et al., 2013, Haczeyni et al., 2018). In subcutaneous adipose tissue, fat mass accumulates principally by hypertrophy– an increase in the size of existing cells. Abdominal fat tissue undergoes transient hypertrophy, but transitions to hyperplasia after prolonged periods of high-fat feeding (Pellegrinelli et al., 2016, Wang et al., 2013). These differences are likely to be highly relevant in the management of obesity and its sequelae.
Inflammatory processes play a key role in the development of obesity (Pirola and Ferraz, 2017, Asterholm et al., 2014). Fat mass accumulation is consistently accompanied by the recruitment of macrophages and other immune cells to adipose tissue, but the details of these interactions have not yet been fully elucidated (Murano et al., 2008). Nonalcoholic fatty liver disease and hepatic steatosis are also strongly associated with obesity (Byrne and Targher, 2015, Williams et al., 2014). It is clear that growing fat depots emit a number of signals that lead to fat accumulation in liver (Manne et al., 2018, Reilly et al., 2015). The exact nature of the signals from different fat depots is likely to be different; and it is unclear whether the various depots contribute equally to the development of hepatic steatosis.
In genomewide association studies, variants in Arid5b have been associated with heart disease, type II diabetes, obesity, and leukemia (Wang et al., 2012, Selvanayagam et al., 2018, Kennedy et al., 2015, Zhou et al., 2019, Ge et al., 2018). Loss of a putative Arid5b binding site in the FTO obesity locus has been shown to de-repress IRX3 and IRX5, and leads to the loss of thermogenesis in beige adipocytes, and the accumulation of white adipose tissue (WAT) in mice and humans (Claussnitzer et al., 2015). Arid5b is essential for adipocyte development and normal lipid metabolism in a variety of in vitro systems (Yamakawa et al., 2008, Yamakawa et al., 2010). The global deletion of Arid5b in mice leads to a high rate of neonatal mortality, extreme leanness and resistance to diet-induced obesity (Yamakawa et al., 2010, Whitson et al., 2003, Zhu et al., 2001). However, the elimination of Arid5b in adipose tissue and its resulting phenotype have not been explored. We show that mice with Fabp4-driven ablation of Arid5b expression in adipose tissue (FSKO mice) do not have neonatal mortality or leanness. Male FSKO mice are resistant to diet-induced obesity; this occurs principally through suppression of weight gains in the subcutaneous fat depot and liver. We further show that when these mice are exposed to prolonged HFD, the expression of pro-inflammatory genes in adipocytes isolated from subcutaneous fat and the invasion of monocytes are markedly suppressed, compared to controls. Finally, we show that HFD-induced weight gains in the livers of FSKO mice are markedly suppressed, despite the fact that the accumulation of visceral fat and the development of glucose intolerance occur to the same extent as in WT controls. These results offer insights into the relative contributions of different fat depots to the co-morbidities associated with obesity.
Materials and Methods:
Mice and Feeding:
C57Bl/6J mouse ES cell line was obtained from the UC Davis KOMP Repository (CSD79126) targeting Exon 6 of the Arid5b gene. Briefly, ES cells were inserted into 8-cell stage embryos transferred into pseudo-pregnant females, and chimeras identified by coat color and PCR verified using Primer Set 1 (Table 1). Male chimeras were mated with females, and heterozygous offspring crossed. Arid5bTg/0 males were mated to females that expresses Flp-recombinase (129S4/SvJae-Gt(ROSA)26Sortm2(FLP*)Sor/J; Jackson labs #007844) and Flppos offspring were identified using Primer Set 2. Insert removal was verified using Primer Set 3. Flppos: Arid5bTg/0mice were back-crossed to wildtype C57Bl6J, and mice that had lost the Flp cassette, but retained the cleaved transgene (designated Arid5bFLOX/0 – detected using Primer Set 4) were selected for further breeding. Arid5bFLOX/FLOX mice were mated to Fabp4-Crepos mice (Strain # 005069, B6.CgTg (Fabp4-Cre) 1RevJ, Jackson Labs, Bar Harbor, Maine) on a C57/Bl6J background. The presence of Fabp4-Cre was detected using PCR Primer Set5. Wild-type (WT-Fabp4CRENEG; Arid5bFLOX/0 or Fabp4CRENEG; Arid5bFLOX/FLOX heterozygous (Fabp4CREPOS; Arid5bFLOX/0) and knockout (Fabp4CREPOS; Arid5bFLOX/FLOX (hereafter referred to as FSKO) mice were born and survived at the expected Mendelian ratios (2:1:1). For high-fat diet (HFD, Test Diet 58Y1– 60% calories from fat) studies, mice were maintained on standard chow (STD, Lab Diet 5053 –13.5% calories from fat) for 125 days and randomly assigned to HFD or STD groups. All mice were fed ad libitum and maintained on the indicated diets for 12 weeks, or one week (Fig. 3). All experiments with mice were reviewed and approved by the City of Hope Institutional Animal Care and Use Committee and were housed in the Animal Resources Center. Mice were humanely euthanized by CO2 asphyxiation after ketamine/xylazine anesthesia.
Table 1:
PCR primers used for analyses.
| Primer Set | Description | Forward | Reverse |
|---|---|---|---|
| 1 | 5' Homologous recombination targeting event | CAGCTAGGAAGCCGATATCCACACCAAGAC | CACAACGGGTTCTTCTGTTAGTCC |
| 2 | 3' Homologous recombination targeting event | CACACCTCCCCCTGAACCTGAAAC | GTTGCCTGACCGCAATGTACTCAAG |
| 3 | Frt Recombinase | ATAGCAGCTTTGCTCCTTCG | TGGCTCATCACCTTCCTCTT |
| 4 | Floxed Arid5b | GGGAAGAAGAGGGTTCCATT | AGCTTTCAGCACGTCTATTTCC |
| 5 | Fabp4-Cre | GCGGTCTGGCAGTAAAAACTATC | GTGAAACAGCATTGCTGTCACTT |
| 6 | Arid5b | AGAAAAACGCCCATCGAGC | CTCCCAGGATTACCACCTAAC |
| 7 | Cyclophilin (PPIA) | TGGCAAGACCAGCAAGAAG | TGAGAGCAGAGATTACAGGAC |
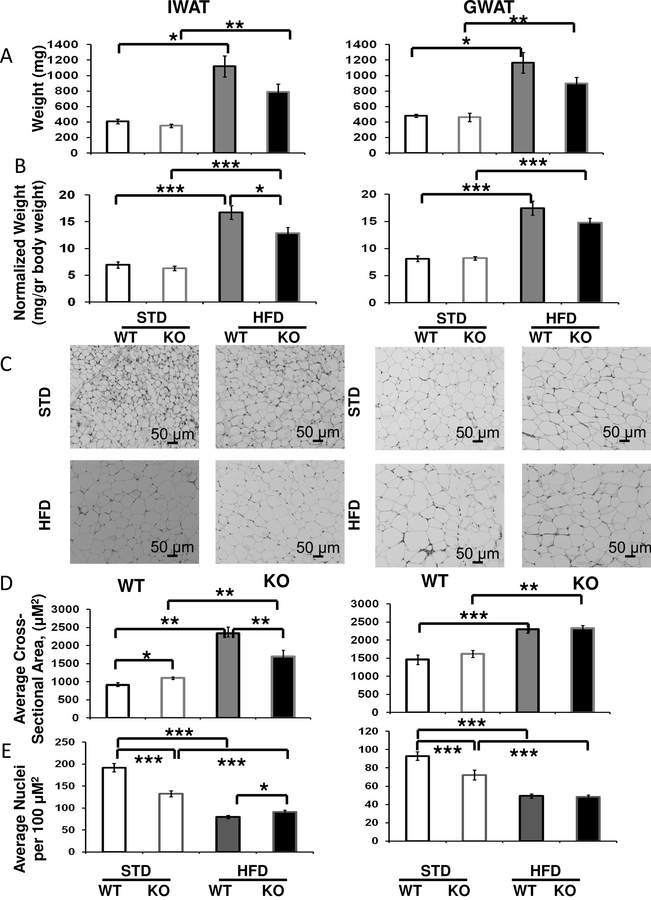
Figure 3. Effects of Fabp4-Cre ablation of Arid5b on adipocyte cross-sectional area in WAT depots for mice on HFD for one week.
Cohorts of WT (black borders), and FSKO mice (gray borders) were assigned to STD chow (open bars) or HFD (solid bars) at the age of 120 days. The mice were maintained on these diets for one week, and euthanized. A. Tissue weights. B. Tissue weights normalized to body weights. C. Photomicrographs. WAT from the indicated depots was dissected, fixed, sectioned and stained as described in Methods. Photomicrographs are representative images from each group. D. Quantitative analyses of fat vacuoles. Four photomicrographs were taken from representative areas in each of three serial sections, and the cross-sectional areas of the fat vacuoles were measured using ImagePro Plus® software. Values are means ± SE for 12 images from 3–6 mice in each group. E. Fat cell density. Fat cell nuclei were counted in the same micrographs analyzed in (D), using ImagePro Plus® software. *P < 0.05, **P < 0.01, ***P < 0.001..
Tissue, Fat Cell Isolation and Analysis:
Tissues were dissected and immediately frozen in liquid nitrogen and weighed. Tissues to be fixed for staining or digested with collagenase for adipocyte and stromovascular fraction (SVF) separation were weighed fresh. Adipocytes were isolated as described (Rodbell, 1964). White adipose tissue (WAT) depots were isolated and digested with collagenase at 37°C for one hour after which the digests were filtered through 70μM mesh and centrifuged at 2,000g for 10 minutes. Adipocytes were recovered by aspiration, and the SVF was recovered from the pellet. Adipocyte size and cell density were determined for WT or FSKO mice maintained on HFD or STD chow for one week, beginning at 125 days of age. Subcutaneous white adipose tissue depots were isolated and placed in neutral-buffered 10% formalin (NBF). After fixation, tissues were sectioned, stained with H&E, and serial sections taken in four representative areas were examined and photomicrographed. Cross-sectional areas of each lipid droplet per field were quantified, and adipocyte nuclei were counted using ImagePro® software.
Metabolic and Blood Serum Measurements:
For intraperitoneal glucose tolerance tests (IPGTT) mice were fasted for 7hr, and injected with glucose (1g/kg, i.p.). Blood samples from tail nicks were collected into heparinized capillary tubes at time zero (prior to injection), and at 10, 20, 30, 60 and 120 minutes post glucose-injection and glucose measured using a Becton Dickinson Accu-check® glucometer. Time-zero blood samples were clotted, centrifuged to obtain serum, and stored at −70°C for insulin assays. Insulin was assayed using a mouse insulin ELISA kit from Linco (Cat. # EZRMI-13K). Triglyceride levels were measured in frozen liver tissue by pulverizing in ceramic mortars under liquid nitrogen. The powder was dissolved in PBS, and homogenates were diluted and assayed for triglycerides using an immunofluorescent assay (Sigma Cat. #MAK016) following the manufacturer’s directions. For cytokine measurements, mice were anesthetized and 0.8–1.0ml of blood was collected via cardiac puncture. Blood was placed in a serum separator, and frozen at −70°C. Cytokines were analyzed using the Luminex FlexMap 3D bead array technology. Luminex multiplex kits (Cat No. LXSAMSM) were purchased from R&D Systems (Minneapolis, MN) and assays performed according to manufacturer’s instructions.
Macrophage Invasion in Adipose Tissue:
Mice that had been maintained on STD chow or HFD for 12 weeks were euthanized and adipose tissue was isolated, fixed in NBF, sectioned, and stained with anti-CD68 antibody (Abcam Cat. #ab955), and counterstained with H&E. Samples were reviewed blindly by a veterinary pathologist. Each sample was scored for the presence of CD68-positive macrophages using a scale from 0–4.
RNA Analyses:
RNA was isolated from the indicated cells and tissues using Trizol®. After reverse transcription, aliquots were pooled to create a qPCR dilution standard, and the remaining RT reactions were diluted two-fold. The pooled standard was diluted using five two-fold serial dilutions (for normalization), or five four-fold serial dilutions, with the undiluted standard designated as a relative expression value of two. qPCR was done using BioRad Sybergreen® as described by the manufacturer. RT-PCR assays for Arid5b were normalized using cyclophilin (PPIA, Table 1). For RNA-Seq analysis, low yields of adipocytes for mice on STD diet necessitated pooling four WT and four FSKO mice prior to RNA extraction. These RNA samples were analyzed in parallel with separate RNA samples from two WT and two FSKO mice that were maintained on HFD for 12 weeks. For RNA-Seq of liver, WT and FSKO mice on either STD chow or HFD (two mice in each group) were used. Briefly, sample reads were aligned to the mm10 assembly using Bowtie and differential gene expression (>1.5-fold, p<0.05) based on FPKM was calculated using Edge R (v3.16.5) using standard methods. Four pairwise comparisons were made for each data set as follows: adipocytes: WT versus FSKO on STD or HFD, liver: WT versus FSKO on STD or HFD. For gene ontology analysis (GO) gene sets (WT vs FSKO) with significant increases or decreases in either were generated. Each gene set (WT or FSKO) was analyzed independently using g:Profiler (https://biit.cs.ut.ee/gprofiler/).
Statistics:
Data were analyzed using a two-tailed Student’s T-test for unpaired samples.
RESULTS:
Arid5b expression is reduced specifically in WAT adipocytes of FSKO mice.
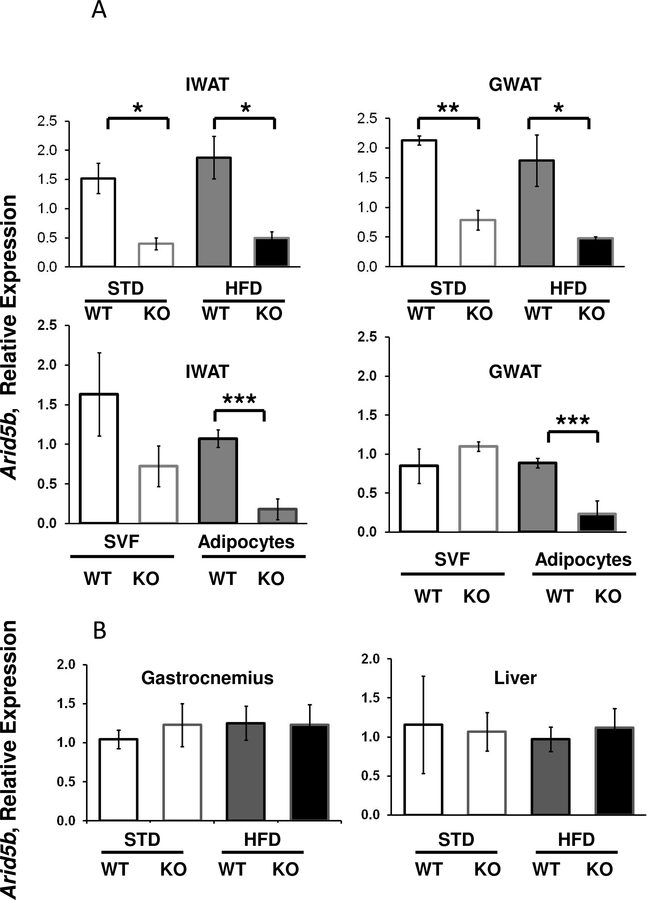
RT-PCR analyses of whole adipose tissues from FSKO mice showed significant reductions in Arid5b expression in IWAT and GWAT as expected (Fig. 1A). To distinguish whether thie reduction occurred in adipocytes or the SVF, we partitioned adipocytes from the SVF by collagenase digestion and centrifugation. Arid5b expression was significantly reduced in adipocytes, but not in the SVF (Fig. 1A). Since the Fabp4 Cre driver has been shown to be expressed at lower levels in tissues other than fat, we examined other tissues of FSKO mice for Cre expression, and for the cleavage of the Arid5b gene. We did not see significant reductions of Arid5b expression in liver or gastrocnemius, supporting an adipocyte-specific ablation, in agreement with prior results using Fabp4 Cre-driven constructs (Fig. 1B) (Lee et al., 2013). The adipocyte-specific exon 6 deletion was verified by RNA Seq (Supp. Fig. S1).
Figure 1. Arid5b Expression in Cells and Tissues of WT and FSKO mice.
A. Arid5b expression in WAT, adipocytes and SVF. IWAT, and GWAT, were isolated from WT and FSKO mice that had been maintained on STD or HFD. Fat tissue was digested with collagenase, filtered and centrifuged as described in Methods, and RNA was extracted from both floating adipocytes (solid bars) and the stromovascular fraction (SVF-open bars). B. Arid5b expression in liver and gastrocnemius muscle was only isolated from WT and FSKO mice on HFD. Arid5b expression was determined using RT-PCR as described in Methods. Values are means ± SE of tissues from 6 animals in each group. *P < 0.05, **P < 0.01, ***P < 0.001.
Mice with Fabp4-Cre-driven ablation of Arid5b do not phenocopy mice with global deletion of Arid5b.
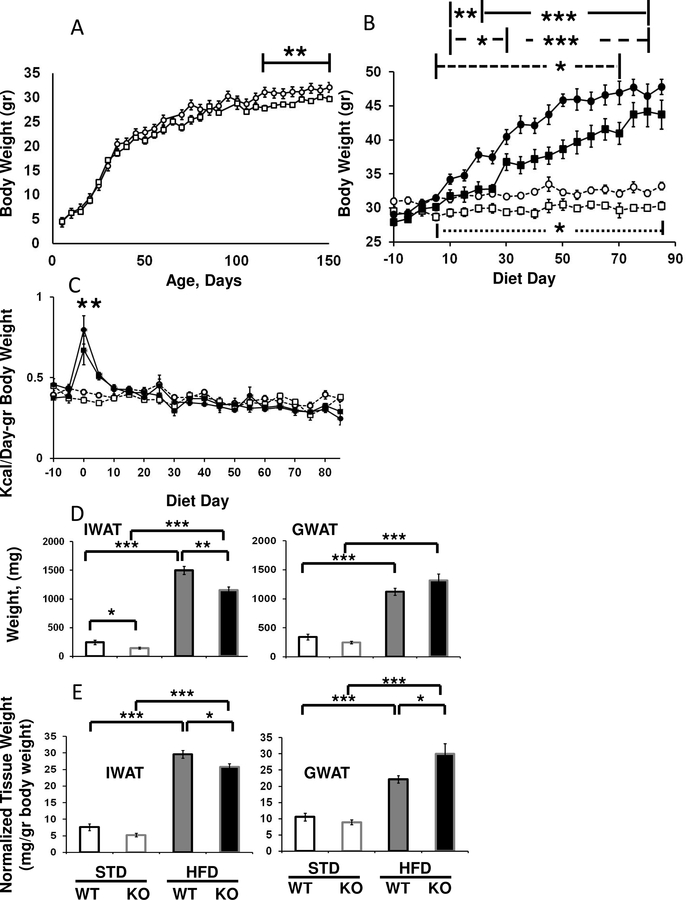
While global deletion of Arid5b led to mice that weighed significantly less than littermate controls on STD or HFD, FSKO mice were not leaner than controls when maintained on STD. Male FSKO mice did weigh slightly less than controls, but not until they were beyond 120 days of age (Fig. 2A). The weights of female FSKO mice were not significantly different than controls, on either STD or HFD, nor did we observe any changes in the weights of WAT or other tissues (data not shown). We did not observe any phenotypes in heterozygous mice (data not shown).
Figure 2. Effects of Fabp4-Cre ablation of Arid5b on tissue and weight gains in male mice.
A. Body weights for male mice maintained on standard diets. Body weights are shown for WT (circles), and FSKO mice (squares). Values are means ± SE for eight mice in each group. B. Body weights for male mice maintained on STD and HFD. At 120 days of age (Diet Day 0), male WT (circles) and FSKO mice (squares) were randomly-assigned to STD (open symbols) or HFD (closed symbols) diets and maintained on these diets until they reached 200 days of age. Body weights were assessed every five days. Values are means ± SE for 10–20 mice in each group at each time point. Solid line, WT HFD versus WT STD; long-dashed line, FSKO HFD versus STD; short-dashed line, for WT HFD versus FSKO HFD, and (lower) dotted line for WT STD versus KO STD. C. Calorie consumption for mice maintained on STD chow and HFD. Calorie consumption was calculated for the mice shown in B. Values are means ± SE for 10–20 observations in each group at each time point. FSKO and WT HFD versus STD chow for the five-day period beginning at the indicated diet day. D Raw tissue weights for WT (black borders) and FSKO mice (gray borders) that were maintained on STD chow (open boxes) or switched to HFD for 12 weeks (filled boxes). E. Tissue weights normalized to total body weight. Values are means ± SE for 4–7 mice in each group. *P < 0.05, **P < 0.01, ***P < 0.001.
Arid5b Deficient Mice are resistant to HFD weight gains.
We tested the effects of HFD on FSKO and WT mice, beginning at 125 days of age (when body weights had reached a plateau), and continuing for 12 weeks. Both FSKO and WT mice had significant weight gains on the HFD. Nonetheless, male FSKO mice gained significantly less weight than controls from 160-to-190 days of age (Diet Days 40–70; Fig. 2B). In the first ten days of HFD, both WT and FSKO mice consumed significantly more calories than STD chow mice (Fig. 2C). Thereafter, calorie consumption in the HFD mice declined to STD diet levels for both genotypes. Weight differences in the subcutaneous inguinal WAT (IWAT) and liver contributed to the overall differences in weight gains (Fig. 2D and Fig.7A, B). Interestingly, FSKO mice gained just as much weight in abdominal (gonadal) white adipose fad pads (GWAT) as WT mice (Fig. 2D). In fact, the normalized weight of the GWAT on HFD was significantly higher, owing to the comparative reduction in body weight gains (Fig. 2E).
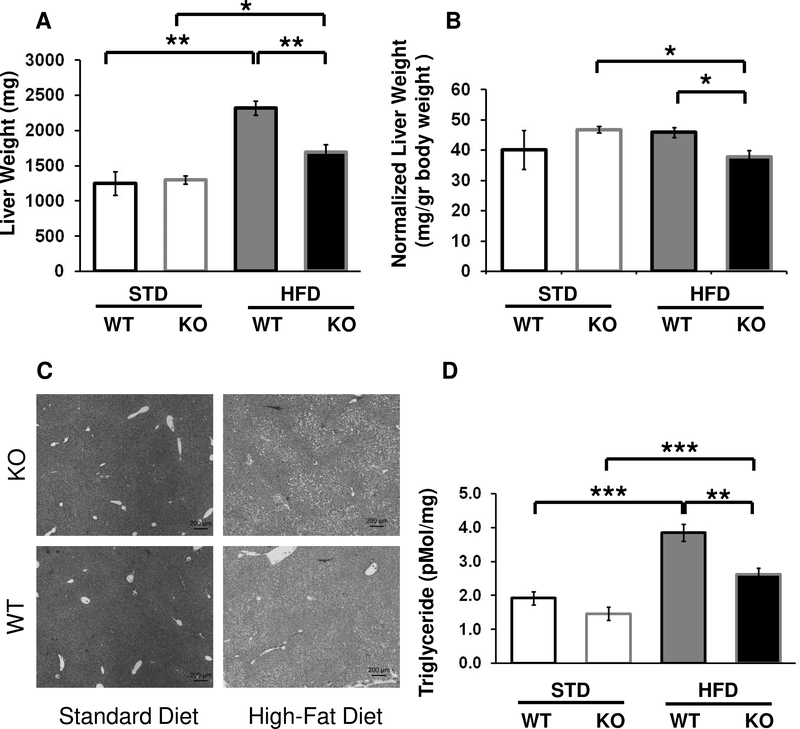
Figure 7. Effects of Fabp4-Cre Arid5b ablation on liver weights and triglyceride levels.
Cohorts of WT and FSKO mice were maintained for 12 weeks as described in Fig. 1. The mice were euthanized, and livers were dissected out and weighed. Values are means ± SE of raw weights (A) or weights normalized to total body weight (B) for 4–7 mice in each group. C. Photomicrographs of WT and FSKO liver sections stained with H&E. D. Liver Triglycerides. Livers from the mice shown in Figure 7 A and B were homogenized and extracted, and triglycerides were measured as described in Methods. *P < 0.05, **P < 0.01.
HFD-induced Adipocyte hypertrophy is suppressed in IWAT of FSKO mice.
Lineage tracing experiments have indicated that when mice are placed on HFD, IWAT accumulates mass primarily through hypertrophy, while GWAT accumulates mass initially by hypertrophy, and then by hyperplasia after prolonged high-fat feeding (Wang, et al., 2013). Thus our results suggested that Arid5b might be important for hypertrophy rather than hyperplasia. To test this hypothesis, we placed a second cohort of mice on HFD for only one week, during which time hypertrophy is the dominant mechanism for lipid accumulation in both IWAT and GWAT. During this short exposure to HFD, mice of both genotypes experienced significant weight gains in both IWAT and GWAT, but gains in IWAT were significantly lower for FSKO than for WT (Fig. 3 A, B). Additionally, fat cell size was significantly smaller in IWAT, but unchanged in GWAT (Fig. 3 C, D). As expected, fat cell density exhibited the reciprocal effects (Fig. 3E). These results suggested that the differences in fat accumulation in FSKO mice were due to altered responses to HFD in these two fat depots, rather than an intrinsic difference in adipocyte hypertrophy.
Arid5b FSKO Mice develop impaired glucose tolerance on HFD.
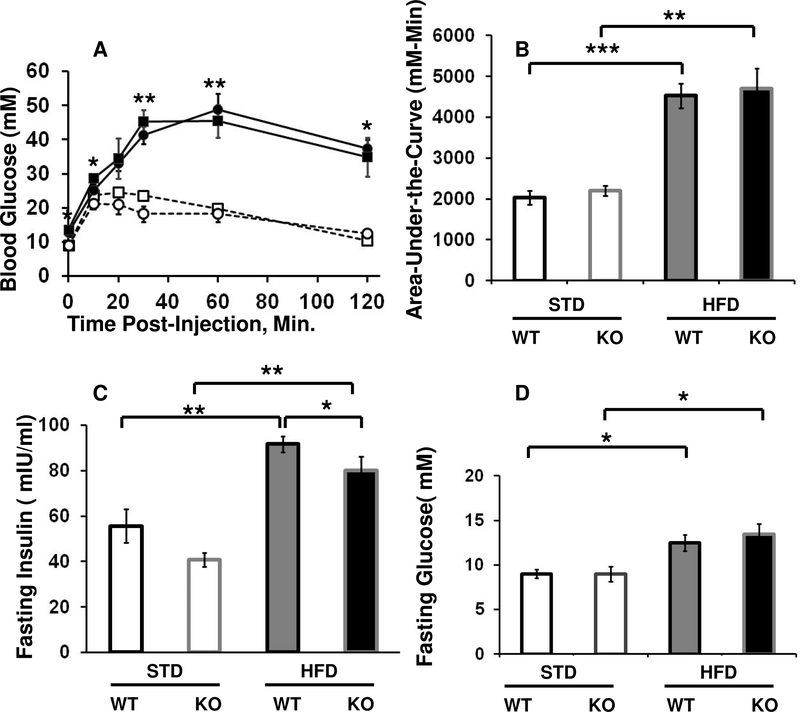
We next tested the effects of HFD on glucose metabolism by subjecting the mice to IPGTT. When maintained on STD, FSKO mice and WT controls had efficient rates of glucose disposal that were nearly identical. After prolonged HFD, however, both groups showed significantly impaired glucose disposal (Fig. 4A, B). This is consistent with reports that adiposity in abdominal fat depots correlates better with impaired glucose tolerance than adiposity in subcutaneous fat (Fox et al., 2007). As expected, both WT and FSKO mice on HFD had significantly elevated levels of fasting insulin and fasting glucose than their respective STD cohorts (Fig. 4C, D). FSKO mice did have lower levels of fasting insulin than WT mice on HFD, but the similarly high levels of fasting glucose and low rates of glucose disposal indicate that Arid5b ablation gave relatively little protection against HFD-mediated glucose intolerance (Fig. 4C).
Figure 4. Effects of Fabp4-Cre ablation of Arid5b and HFD on glucose tolerance in male mice.
A. IPGTT’s. Cohorts of WT (circles), and FSKO mice (squares) were assigned to STD chow (open symbols) or HFD (closed symbols) at the age of 120 days. The mice were maintained on these diets for 12 weeks, then subjected to IPGTT’s. Asterisks indicate P values for comparisons of WT and FSKO STD versus HFD at the indicated time points. B. Area-under-the curve for the graphs in part A for the indicated comparisons. C, D Fasting insulin and fasting glucose values (respectively) for the mice shown in part A. Values are means, ± SE for 4–8 mice in each group. *P < 0.05, **P < 0.01, ***P < 0.001.
Arid5b Deficient Mice exhibit reduced expression of inflammatory genes in IWAT on HFD.
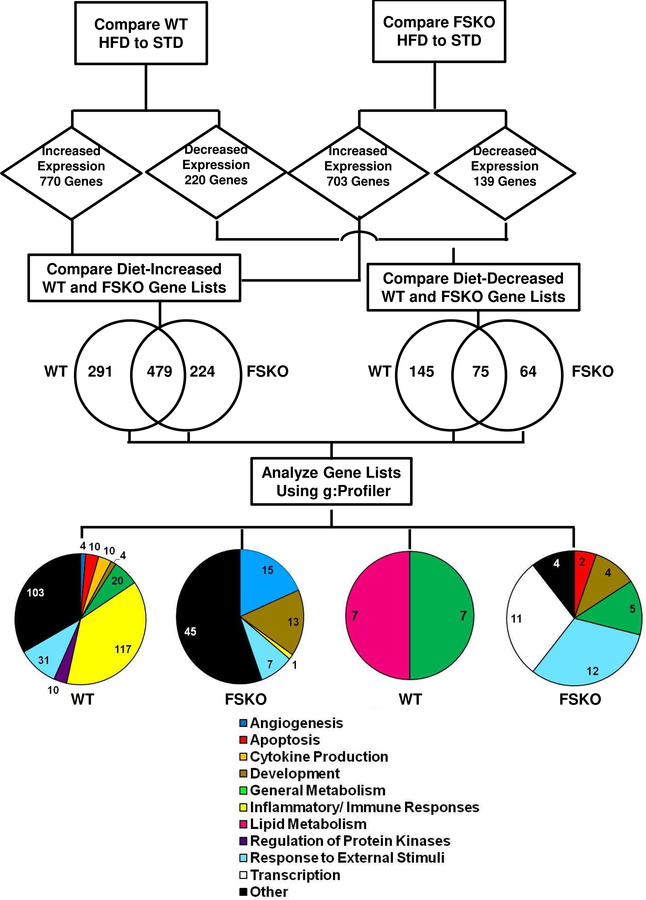
Although Arid5b expression was reduced in both IWAT and GWAT, challenge with HFD revealed changes in both tissue weights and adipocyte hypertrophy that were specific to IWAT (Figs. 2, 3). Therefore, we analyzed gene expression in isolated IWAT adipocytes using RNA-Seq. Our goal was to identify gene sets unique to both genotype and diet that resulted in differentially expressed genes that could later be explored for differences in biological pathways as depicted in Fig. 5. Subjecting WT mice to HFD resulted in increased expression of 770 genes in adipocytes; while FSKO mice showed increased expression of 703 genes. We compared these gene lists and found that there were 479 genes in common. This is unsurprising since adipocytes in both groups were responding to the same dietary challenge. However, there were 291 genes with increased expression in WT adipocytes and 224 genes increased in FSKO First, we performed biological pathway analyses of the genes that were increased in WT and found significant involvement in pathways leading to inflammatory responses (117 of 306 pathways versus only 1 of 81 pathways for FSKO, Fig. 5). The 73 genes associated with the WT inflammatory pathways included seven members of the C-C motif cytokine (CCL) family, CXCl2, Serpin E1, and the ICOS ligand (ICOSLG). Ccl7, a macrophage attractant protein, showed a 5.6-fold increase in WT on HFD. (Supp Table 1). Next genes that were increased in FSKO demonstrated significant involvement in pathways relating to angiogenesis (15 of 81 pathways, Fig. 5). Similar analyses showed decreased expression of 220 and 139 genes in WT and FSKO adipocytes, respectively. Seventy-five of the decreased genes were common to both WT and FSKO, whereas 145 and 64 genes were decreased in WT or FSKO respectively. It was noteworthy that genes with decreased expression in WT but not in FSKO, showed significant involvement in pathways relating to lipid metabolism, including such genes as Fasn and Cidea (4.3 and 3.2-fold change respectively). (7 of 14 pathways, Fig. 5 Genes that were decreased only in FSKO were involved mainly in the control of response to external stimuli and transcription (11 and 12 of 38 pathways, respectively Fig. 5, Supp Table 1).
Figure 5. Work-Flow Diagram for the Analysis of RNA-Seq Data in IWAT.
Differential gene expression analysis was used to compare RNA-Seq data in IWAT adipocytes from WT STD versus HFD mice and from FSKO STD versus HFD mice. Genes that were significantly increased or decreased according to the criteria outlined in Methods, were identified for each genotype. The gene lists were compared, and genes that were unique to each genotype were subjected to pathway analysis using g:Profiler. Pie charts depict the numbers of gene ontology pathways in the indicated categories.
Arid5b FSKO mice are resistant to HFD-induced macrophage invasion of WAT.
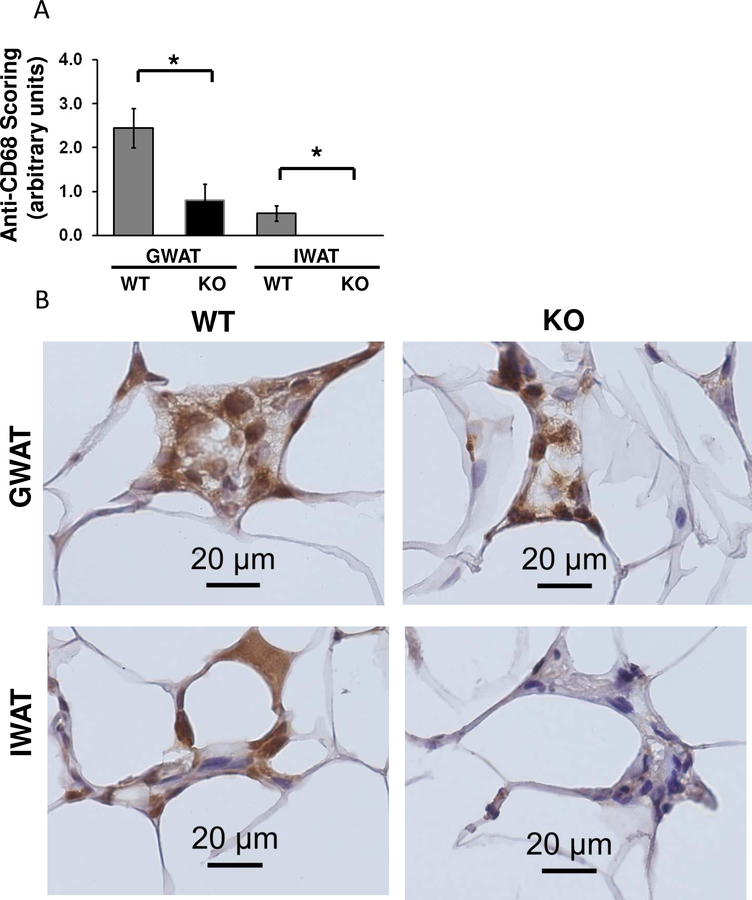
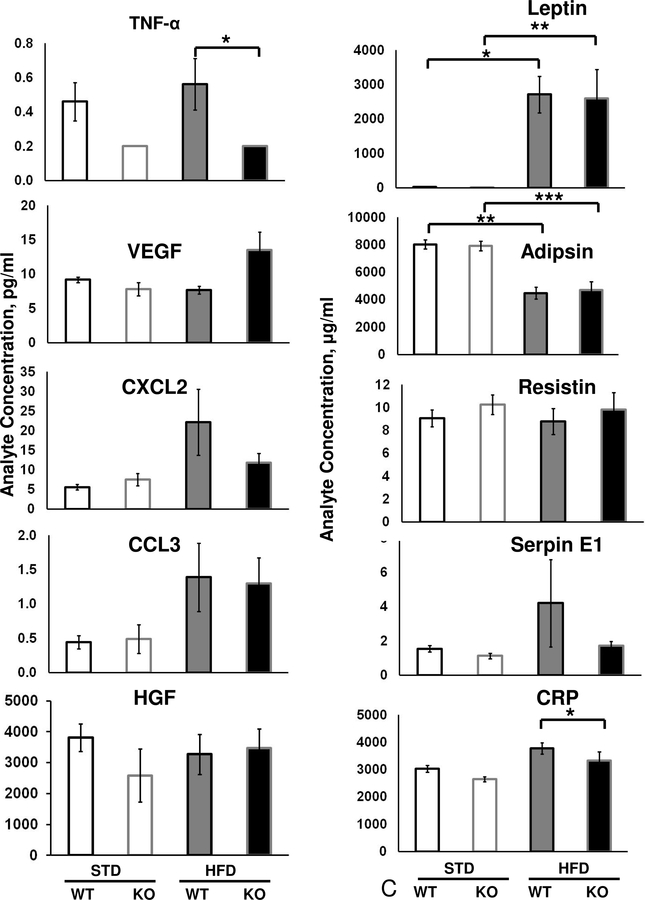
Since RNA-Seq revealed that FSKO mice demonstrated a reduction in multiple immune response pathways, we compared the inflammatory response in adipose tissue of FSKO and WT mice. WAT depots from WT and FSKO mice on STD and HFD were fixed, sectioned and stained with the macrophage-specific marker CD68. Microscopic analysis of the sections indicated there were significantly fewer macrophages and crown-like structures in both GWAT and IWAT of FSKO versus WT mice (Fig. 6A, B). Since macrophage invasion is known to be associated with cytokine signaling from WAT, we next compared the levels of select serum cytokines in WT and FSKO mice maintained on STD or HFD (Byrne and Targher, 2015, Reilly et al., 2015). Of the ten cytokines tested, only TNF-α levels were markedly reduced in FSKO relative to WT mice on HFD (Fig. 6B). Serum levels of CXCl2 and Serpin E1 were lower in FSKO mice than in WT mice on HFD, but the differences were not significant. Adipsin/Factor D decreased significantly after HFD in both WT and FSKO mice but showed no differences between WT and FSKO mice, whereas leptin showed a reciprocal pattern and was elevated in both strains (Fig. 6C). The reduced TNF-α levels in FSKO mice on HFD support a model where ablation of Arid5b results in reduced inflammation in IWAT and GWAT fat depots. The Fabp4 CRE driver has been reported to be expressed in macrophages, but does not appear to mediate the ablation of floxed genes in adipocyte macrophages (Fu et al., 2000, Lee et al., 2013).
Figure 6. Effects of Fabp4-Cre Arid5b ablation on Adipose Macrophages and Serum Cytokines.
A. Macrophage invasion in WAT depots. Cohorts of WT and FSKO mice were maintained high-fat diets for 12 weeks as described in Figure 1. The indicated fat depots were fixed, sectioned and stained with antibodies to CD68 as described in Methods. The sections were examined by a veterinary pathologist, and scored for anti-CD68 staining. Values are means, ± SE for 4–8 mice. B. Photomicrogaphs of GWAT and IWAT stained with anti-CD68 antibodies. The crown-like structures were less frequent in FSKO WAT, and contained fewer large, CD68-positive (brown-staining) nuclei. C. Serum adipokine levels. Adipokine levels were measured in sera of WT and FSKO mice that were maintained on STD chow or HFD for 12 weeks as described in Methods. Values are means, ± SE for 3–8 mice in each group. *P < 0.05**P < 0.01.
Arid5b Deficient Mice are resistant to HFD-induced hepatic steatosis.
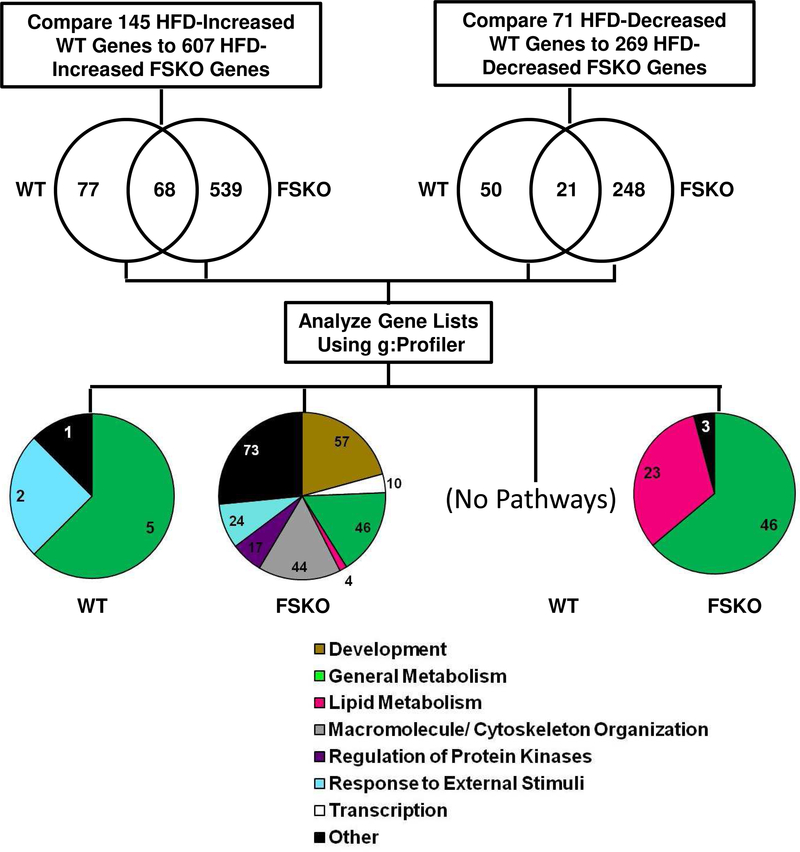
Although both WT and FSKO mice on HFD experienced significant weight gains in liver, post-diet liver weights in FSKO mice were significantly lower (Fig. 7 A,B). Microscopic examination of liver specimens showed pronounced increases in fat deposits as a result of HFD in both WT and FSKO, but we observed almost no difference between HFD WT and HFD FSKO (Fig 7C). We then performed assays of liver triglycerides, and found that HFD-induced increases in liver triglycerides were markedly lower in FSKO than in WT mice. This suggests that fat-specific ablation of Arid5b may reduce lipid storage and decrease the likelihood of hepatic steatosis (Fig. 7 D). We next examined genes and their cognate pathways affected by employing RNA Seq analysis of livers from WT and FSKO mice on STD and HFD diets. Following the strategy depicted in Figure 5, we found that HFD increased the expression of 145 genes in livers of WT mice. Remarkably, HFD increased expression of 607 genes in livers of FSKO mice, despite the fact that Arid5b expression was unaffected in liver (Fig 1B). Sixty-eight of the genes with increased expression were common to both WT and FSKO. There were 77 genes with increased expression only in WT livers, and 539 genes with increased expression only in FSKO livers (Supp. Table 2). Pathway analysis of the latter genes showed significant involvement in pathways relating to both developmental and metabolic pathways processes (57 and 50 of 279 pathways, Fig. 8). We found that HFD decreased the expression of 71 genes in livers of WT mice and 269 genes in livers of FSKO mice. Twenty-one of the decreased genes were in common between the two genotypes, while 50 genes were decreased in WT and 248 genes were decreased in FSKO (Suppl. Table 2). Of the latter, a significant number were found in pathways relating to lipid metabolism This includes Cidea, increased 20.5-fold in WT mice 23 of 79 pathways, Fig. 8). Many of these pathways (12 of the 23) involved the synthesis of eicosanoids.
Figure 8. Analysis of RNA-Seq Data in Liver.
Differential gene expression analysis was used to compare RNA-Seq data in livers from WT STD versus HFD mice and from FSKO STD versus HFD mice. Genes that were significantly increased or decreased according to the criteria outlined in Methods, were identified for each genotype. The lists were compared, and genes that were unique to each genotype were subjected to pathway analysis using g:Profiler. Pie charts show the numbers of gene ontology pathways in the indicated categories.
DISCUSSION:
Mice with a global knockout of Arid5b have a high rate of neonatal mortality, and both male and female adults are lean and resistant to diet-induced obesity (Whitson et al., 2003). By contrast, FSKO mice survived normally as neonates, and were not lean on STD. Mice that were homozygous for the Arid5b-targeting transgene prior to Flp-mediated excision of the Lac-Z cassette exhibited phenotypes that were identical to our global Arid5b knockout (data not shown). Therefore, the phenotypic differences between the FSKO mice in this study and the previous global knockout cannot be ascribed to differences in the mouse strains that were used to generate them (Lahoud et al., 2001, Whitson et al., 2003, Schmahl et al., 2007). FSKO males weighed slightly less than their WT littermates, but only after 125 days of age; females showed no weight differences (Fig. 2A, and data not shown). Inasmuch as we have shown that the Fabp4-Cre driver effectively diminishes Arid5b expression in WAT adipocytes (Fig. 1), the failure of FSKO mice to phenocopy Arid5b−/− mice suggests that the lean phenotype of the latter does not arise solely from a lack of Arid5b expression in WAT.
Despite the fact that FSKO mice were not lean on a standard diet, the males were resistant to weight gains on HFD (Fig. 2B). This was due to a resistance to weight gains in IWAT, and liver (Fig. 2D, 7A,B). Weight gains in GWAT, the main abdominal WAT depot were as robust in FSKO mice as in WT controls. Under the stress of HFD, adipose tissue stores excess fat by two distinct mechanisms: hypertrophy and hyperplasia. Lineage tracing experiments have shown that the pattern varies in different WAT depots. During the initial phase of HFD, both IWAT and GWAT increase by hypertrophy, but after prolonged HFD hyperplasia becomes more important in GWAT (Wang et al., 2013). Therefore, if Arid5b is required for hypertrophy in all WAT depots, fat cell size would be smaller in both IWAT and GWAT at the earlier stages of HFD. To test this, we placed WT and FSKO mice on HFD for one week – a time period when hypertrophy is the dominant mechanism for lipid accumulation in both IWAT and GWAT. We found that Arid5b ablation suppressed hypertrophy in IWAT but not GWAT (Fig. 3 C, D). Thus, the failure to suppress weight gains in GWAT after long-term exposure to HFD cannot be attributed to differences in the preferred mechanism for fat accumulation in these two depots after long-term HFD (i.e., hypertrophy in IWAT and hyperplasia in GWAT). The ability of Arid5b ablation to suppress fat mass accumulation in IWAT must be viewed as being specific to that tissue, rather than resulting from a general suppression of fat cell hypertrophy. In GWAT, the increase in hypertrophy at seven days of HFD, and the robust increase of fat mass (presumably due to hyperplasia) at 12 weeks clearly shows that the ablation of Arid5b in this tissue has different consequences than ablation in IWAT. Glucose intolerance is more strongly associated with an increase in abdominal fat (GWAT) than with an increase in subcutaneous fat (IWAT) (Pou et al., 2007). FSKO mice on HFD developed glucose intolerance to the same extent as WT mice and is consistent with the similar weight gains we observed in GWAT (Fig. 4, 2). It is interesting to note that obesity-induced glucose intolerance is believed to result from a failure of insulin to suppress hepatic glucose output (Reilly et al., 2015, Toulis et al., 2020). Although, we did not test this directly, our results suggest that adipokines or other signals from WAT that mediate this response in liver remain intact in FSKO mice.
Our analysis of the RNA-Seq data for IWAT indicated that a number of genes involved in inflammatory responses were increased in HFD WT adipocytes, but not in HFD FSKO adipocytes (Fig. 5). Interestingly, pathways related to angiogenesis were increased in FSKO IWAT adipocytes, and stimulation of angiogenesis is known to favor hyperplasia over hypertrophy in WAT (Cao, 2007). Likewise, a number of genes involved in lipid metabolism were decreased in WT adipocytes, but not in FKSO adipocytes (Fig. 5). These results suggest that Arid5b expression in IWAT is required for changes in gene expression that lead to both inflammation and lipid accumulation that normally occur in response to HFD.
There has been increasing emphasis on the importance of inflammatory responses, including macrophage invasion, in the development of obesity (Pirola and Ferraz, 2017, Asterholm et al., 2014, Murano et al., 2008). Following a prolonged HFD exposure, staining of WAT depots with anti-CD68, a general macrophage marker, revealed a significant decrease in CD68-positive cells in WAT depots from FSKO mice (Fig. 6A). The diminished invasion in IWAT by macrophages could result from a reduction in chemoattractant signals emanating from adipocytes or a lack of response by macrophages themselves. Genes with HFD-increased expression in WT adipocytes, but not in FSKO adipocytes included seven members of the CCL family, CXCL2, Serpin E1 and ICOSLG, all of which are important pro-inflammatory signals (Engin, 2017, Rouault et al., 2013, Samad and Ruf, 2013, Richter and Burdach, 2004). Although we cannot rule out completely the possibility that Arid5b was ablated in circulating monocytes or macrophages when mice were subjected to the stress of HFD, we believe that the lack of Arid5b expression in WAT and the concomitant decreases in these inflammatory signals prevents the recruitment of macrophages during HFD. Using a Fabp4-driven dominant-negative form of TNFα, others have demonstrated that pro-inflammatory responses are essential for the expansion of both IWAT and GWAT in HFD (Asterholm et al., 2014). Thus it is plausible that ablation of Arid5b expression in IWAT inhibits hypertrophy during HFD by suppressing the expression of pro-inflammatory genes.
When mice were placed on HFD, the effects of Fabp4-Cre-mediated Arid5b ablation on liver were unexpected. Both RT-PCR and RNA-Seq analyses, verified that Arid5b expression was not reduced in liver (Fig. 1B, and data not shown). The lack of Arid5b ablation in FSKO livers is consistent with the lack of an overt liver phenotype when the mice were on STD. When FSKO mice were subjected to HFD; however, they gained significantly less weight in liver than WT mice (Fig. 7A, B) and liver triglycerides were significantly reduced (Fig. 7D). We also showed that TNFα is significantly lower in serum from FSKO mice than in serum from WT mice on HFD (Fig. 6B). Given these differences and the failure of HFD to induce the expression of multiple cytokines in FSKO IWAT adipocytes and, we speculate that Arid5b ablation in adipocytes leads to a reduction in the WAT-generated signals that mediate hepatic lipid accumulation during dietary stress. The results of RNA-Seq analysis in liver suggest that, in addition to the lack of inflammatory signals, FSKO WAT may actually generate aberrant signals during HFD. Dramatic changes in gene expression occurred in liver in response to HFD. This treatment led to increased expression of 539 genes, and decreased expression of 248 genes that were not significantly affected by HFD in WT livers. Such extensive changes in gene expression would not be expected from the loss of an inflammatory signal alone. It is also interesting to note that a number of pathways relating to eicosanoids were suppressed by HFD in FSKO livers. Since these fatty acid derivatives are known to play important roles in signaling through PPARγ, it is possible that signaling from liver to WAT is also affected in FSKO mice on HFD (Marion-Letellier et al., 2016).
Both insulin-resistance and lipid accumulation are believed to be exacerbated by inflammatory signals emanating from WAT depots of obese individuals (Manne et al., 2018, Byrne and Targher, 2015, Williams et al., 2014). Conversely, our data showed that hepatic steatosis was diminished in mice where inflammatory pathways were strongly suppressed in IWAT (Figs 5 & 7). This may be mediated by ectopic deposition of fat in the liver when the normal accumulation of fat in both IWAT and GWAT was suppressed (Asterholm et al., 2014). When challenged with HFD, our FSKO mice accumulated WT levels of fat in GWAT, but not in IWAT, and developed glucose intolerance, but had reduced deposition of triglycerides in liver. Taken together, our results show that Arid5b plays distinct roles in different WAT depots, and is required for the generation of the inflammatory signals in WAT that may lead to hepatic steatosis, but is not required for the signals that lead to impaired glucose disposal.
Supplementary Material
Mice with Fabp4-CRE mediated ablation of Arid5b expression (FSKO) are resistant to diet-induced obesity
FSKO mice show reduced lipid accumulation in IWAT when subjected to a high fat diet (HFD)
FSKO mice are resistant to HFD-driven hepatic steatosis
IWAT adipocytes and livers from FSKO mice exhibit profound changes in gene expression related to inflammatory responses and lipid accumulation
WAT from FSKO mice has significantly less CD68+ macrophage invasion when subjected to HFD
Funding and Acknowledgments
This research was supported by Genentech royalties to K.I. Research reported in this publication included work performed in the Analytical Pharmacology, Analytical Cytometry, Anatomical Pathology and Integrative Genomics Cores supported by the National Cancer Institute of the National Institutes of Health (P30CA033572). In addition we thank the Light Microscopy and Pathology cores for excellent technical support and Steven Vonderfecht for quantifying CD68 staining in WAT fat depots.
Declaration of Interest and Acknowledgements
There are no conflicts of interest. R.H.W., G.Z and S.L. performed experiments. R.H.W., G.P.L. and K.I. interpreted data, wrote and edited the manuscript.
Footnotes
Competing interests-None
Publisher's Disclaimer: This is a PDF file of an unedited manuscript that has been accepted for publication. As a service to our customers we are providing this early version of the manuscript. The manuscript will undergo copyediting, typesetting, and review of the resulting proof before it is published in its final form. Please note that during the production process errors may be discovered which could affect the content, and all legal disclaimers that apply to the journal pertain.
References
- ASTERHOLM I, TAO C, MORLEY TS, WANG QA, DELGADO-LOPEZ F, WANG ZV & SCHERER PE 2014. Adipocyte inflammation is essential for healthy adipose tissue expansion and remodeling. Cell Metab, 20, 103–18. [DOI] [PMC free article] [PubMed] [Google Scholar]
- BYRNE CD & TARGHER G 2015. NAFLD: a multisystem disease. J Hepatol, 62, S47–64. [DOI] [PubMed] [Google Scholar]
- CLAUSSNITZER M, DANKEL SN, KIM KH, QUON G, MEULEMAN W, HAUGEN C, GLUNK V, SOUSA IS, BEAUDRY JL, PUVIINDRAN V, ABDENNUR NA, LIU J, SVENSSON PA, HSU YH, DRUCKER DJ, MELLGREN G, HUI CC, HAUNER H & KELLIS M 2015. FTO Obesity Variant Circuitry and Adipocyte Browning in Humans. N Engl J Med, 373, 895–907. [DOI] [PMC free article] [PubMed] [Google Scholar]
- ENGIN A 2017. The Pathogenesis of Obesity-Associated Adipose Tissue Inflammation. Adv Exp Med Biol, 960, 221–245. [DOI] [PubMed] [Google Scholar]
- FOX CS, MASSARO JM, HOFFMANN U, POU KM, MAUROVICH-HORVAT P, LIU CY, VASAN RS, MURABITO JM, MEIGS JB, CUPPLES LA, D’AGOSTINO RB SR. & O’DONNELL CJ 2007. Abdominal visceral and subcutaneous adipose tissue compartments: association with metabolic risk factors in the Framingham Heart Study. Circulation, 116, 39–48. [DOI] [PubMed] [Google Scholar]
- FU Y, LUO N & LOPES-VIRELLA MF 2000. Oxidized LDL induces the expression of ALBP/aP2 mRNA and protein in human THP-1 macrophages. J Lipid Res, 41, 2017–23. [PubMed] [Google Scholar]
- GE Z, HAN Q, GU Y, GE Q, MA J, SLOANE J, GAO G, PAYNE KJ, SZEKELY L, SONG C & DOVAT S 2018. Aberrant ARID5B expression and its association with Ikaros dysfunction in acute lymphoblastic leukemia. Oncogenesis, 7, 84. [DOI] [PMC free article] [PubMed] [Google Scholar]
- HACZEYNI F, BELL-ANDERSON KS & FARRELL GC 2018. Causes and mechanisms of adipocyte enlargement and adipose expansion. Obes Rev, 19, 406–420. [DOI] [PubMed] [Google Scholar]
- KENNEDY AE, KAMDAR KY, LUPO PJ, OKCU MF, SCHEURER ME & DORAK MT 2015. Genetic markers in a multi-ethnic sample for childhood acute lymphoblastic leukemia risk. Leuk Lymphoma, 56, 169–74. [DOI] [PubMed] [Google Scholar]
- LAHOUD MH, RISTEVSKI S, VENTER DJ, JERMIIN LS, BERTONCELLO I, ZAVARSEK S, HASTHORPE S, DRAGO J, DE KRETSER D, HERTZOG PJ & KOLA I 2001. Gene targeting of Desrt, a novel ARID class DNA-binding protein, causes growth retardation and abnormal development of reproductive organs. Genome Res, 11, 1327–34. [DOI] [PubMed] [Google Scholar]
- LEE JE, SCHMIDT H, LAI B & GE K 2019. Transcriptional and Epigenomic Regulation of Adipogenesis. Mol Cell Biol, 39. [DOI] [PMC free article] [PubMed] [Google Scholar]
- LEE KY, RUSSELL SJ, USSAR S, BOUCHER J, VERNOCHET C, MORI MA, SMYTH G, ROURK M, CEDERQUIST C, ROSEN ED, KAHN BB & KAHN CR 2013. Lessons on conditional gene targeting in mouse adipose tissue. Diabetes, 62, 864–74. [DOI] [PMC free article] [PubMed] [Google Scholar]
- MANNE V, HANDA P & KOWDLEY KV 2018. Pathophysiology of Nonalcoholic Fatty Liver Disease/Nonalcoholic Steatohepatitis. Clin Liver Dis, 22, 23–37. [DOI] [PubMed] [Google Scholar]
- MARION-LETELLIER R, SAVOYE G & GHOSH S 2016. Fatty acids, eicosanoids and PPAR gamma. Eur J Pharmacol, 785, 44–49. [DOI] [PubMed] [Google Scholar]
- MURANO I, BARBATELLI G, PARISANI V, LATINI C, MUZZONIGRO G, CASTELLUCCI M & CINTI S 2008. Dead adipocytes, detected as crown-like structures, are prevalent in visceral fat depots of genetically obese mice. J Lipid Res, 49, 1562–8. [DOI] [PubMed] [Google Scholar]
- PELLEGRINELLI V, CAROBBIO S & VIDAL-PUIG A 2016. Adipose tissue plasticity: how fat depots respond differently to pathophysiological cues. Diabetologia, 59, 1075–88. [DOI] [PMC free article] [PubMed] [Google Scholar]
- PIROLA L & FERRAZ JC 2017. Role of pro- and anti-inflammatory phenomena in the physiopathology of type 2 diabetes and obesity. World J Biol Chem, 8, 120–128. [DOI] [PMC free article] [PubMed] [Google Scholar]
- POU KM, MASSARO JM, HOFFMANN U, VASAN RS, MAUROVICH-HORVAT P, LARSON MG, KEANEY JF JR., MEIGS JB, LIPINSKA I, KATHIRESAN S, MURABITO JM, O’DONNELL CJ, BENJAMIN EJ & FOX CS 2007. Visceral and subcutaneous adipose tissue volumes are cross-sectionally related to markers of inflammation and oxidative stress: the Framingham Heart Study. Circulation, 116, 1234–41. [DOI] [PubMed] [Google Scholar]
- REILLY SM, AHMADIAN M, ZAMARRON BF, CHANG L, UHM M, POIRIER B, PENG X, KRAUSE DM, KORYTNAYA E, NEIDERT A, LIDDLE C, YU RT, LUMENG CN, ORAL EA, DOWNES M, EVANS RM & SALTIEL AR 2015. A subcutaneous adipose tissue-liver signalling axis controls hepatic gluconeogenesis. Nat Commun, 6, 6047. [DOI] [PMC free article] [PubMed] [Google Scholar]
- RICHTER G & BURDACH S 2004. ICOS: a new costimulatory ligand/receptor pair and its role in T-cell activion. Onkologie, 27, 91–5. [DOI] [PubMed] [Google Scholar]
- RODBELL M 1964. METABOLISM OF ISOLATED FAT CELLS. I. EFFECTS OF HORMONES ON GLUCOSE METABOLISM AND LIPOLYSIS. J Biol Chem, 239, 375–80. [PubMed] [Google Scholar]
- ROUAULT C, PELLEGRINELLI V, SCHILCH R, COTILLARD A, POITOU C, TORDJMAN J, SELL H, CLÉMENT K & LACASA D 2013. Roles of chemokine ligand-2 (CXCL2) and neutrophils in influencing endothelial cell function and inflammation of human adipose tissue. Endocrinology, 154, 1069–79. [DOI] [PubMed] [Google Scholar]
- SAMAD F & RUF W 2013. Inflammation, obesity, and thrombosis. Blood, 122, 3415–22. [DOI] [PMC free article] [PubMed] [Google Scholar]
- SCHMAHL J, RAYMOND CS & SORIANO P 2007. PDGF signaling specificity is mediated through multiple immediate early genes. Nat Genet, 39, 52–60. [DOI] [PubMed] [Google Scholar]
- SELVANAYAGAM T, WALKER S, GAZZELLONE MJ, KELLAM B, CYTRYNBAUM C, STAVROPOULOS DJ, LI P, BIRKEN CS, HAMILTON J, WEKSBERG R & SCHERER SW 2018. Genome-wide copy number variation analysis identifies novel candidate loci associated with pediatric obesity. Eur J Hum Genet. [DOI] [PMC free article] [PubMed] [Google Scholar]
- TOULIS KA, NIRANTHARAKUMAR K, POURZITAKI C, BARNETT AH & TAHRANI AA 2020. Glucokinase Activators for Type 2 Diabetes: Challenges and Future Developments. Drugs, 80, 467–475. [DOI] [PubMed] [Google Scholar]
- WANG G, WATANABE M, IMAI Y, HARA K, MANABE I, MAEMURA K, HORIKOSHI M, OZEKI A, ITOH C, SUGIYAMA T, KADOWAKI T, YAMAZAKI T & NAGAI R 2012. Associations of variations in the MRF2/ARID5B gene with susceptibility to type 2 diabetes in the Japanese population. J Hum Genet, 57, 727–33. [DOI] [PubMed] [Google Scholar]
- WANG QA, TAO C, GUPTA RK & SCHERER PE 2013. Tracking adipogenesis during white adipose tissue development, expansion and regeneration. Nat Med, 19, 1338–44. [DOI] [PMC free article] [PubMed] [Google Scholar]
- WANG QA, TAO C, JIANG L, SHAO M, YE R, ZHU Y, GORDILLO R, ALI A, LIAN Y, HOLLAND WL, GUPTA RK & SCHERER PE 2015. Distinct regulatory mechanisms governing embryonic versus adult adipocyte maturation. Nat Cell Biol, 17, 1099–111. [DOI] [PMC free article] [PubMed] [Google Scholar]
- WHITSON RH, TSARK W, HUANG TH & ITAKURA K 2003. Neonatal mortality and leanness in mice lacking the ARID transcription factor Mrf-2. Biochem Biophys Res Commun, 312, 997–1004. [DOI] [PubMed] [Google Scholar]
- WILLIAMS LM, CAMPBELL FM, DREW JE, KOCH C, HOGGARD N, REES WD, KAMOLRAT T, THI NGO H, STEFFENSEN IL, GRAY SR & TUPS A 2014. The development of diet-induced obesity and glucose intolerance in C57BL/6 mice on a high-fat diet consists of distinct phases. PLoS One, 9, e106159. [DOI] [PMC free article] [PubMed] [Google Scholar]
- YAMAKAWA T, SUGIMOTO K, WHITSON RH & ITAKURA K 2010. Modulator recognition factor-2 regulates triglyceride metabolism in adipocytes. Biochem Biophys Res Commun, 391, 277–81. [DOI] [PubMed] [Google Scholar]
- YAMAKAWA T, WHITSON RH, LI SL & ITAKURA K 2008. Modulator recognition factor-2 is required for adipogenesis in mouse embryo fibroblasts and 3T3-L1 cells. Mol Endocrinol, 22, 441–53. [DOI] [PMC free article] [PubMed] [Google Scholar]
- ZHOU J, GOU H, ZHANG L, WANG X, YE Y, LU X & YING B 2019. ARID5B Genetic Polymorphisms Contribute to the Susceptibility and Prognosis of Male Acute Promyelocytic Leukemia. DNA Cell Biol. [DOI] [PubMed] [Google Scholar]
- ZHU L, HU J, LIN D, WHITSON R, ITAKURA K & CHEN Y 2001. Dynamics of the Mrf-2 DNA-binding domain free and in complex with DNA. Biochemistry, 40, 9142–50. [DOI] [PubMed] [Google Scholar]
Associated Data
This section collects any data citations, data availability statements, or supplementary materials included in this article.


