

Abstract
The kinetics and efficiency of mitochondrial oxidative phosphorylation (OxPhos) can depend on the choice of respiratory substrates. Furthermore, potential differences in this substrate dependency among different tissues are not well-understood. Here, we determined the effects of different substrates on the kinetics and efficiency of OxPhos in isolated mitochondria from the heart and kidney cortex and outer medulla (OM) of Sprague-Dawley rats. The substrates were pyruvate+malate, glutamate+malate, palmitoyl-carnitine+malate, alpha-ketoglutarate+malate, and succinate±rotenone at saturating concentrations. The kinetics of OxPhos were interrogated by measuring mitochondrial bioenergetics under different ADP perturbations. Results show that the kinetics and efficiency of OxPhos are highly dependent on the substrates used, and this dependency is distinctly different between heart and kidney. Heart mitochondria showed higher respiratory rates and OxPhos efficiencies for all substrates in comparison to kidney mitochondria. Cortex mitochondria respiratory rates were higher than OM mitochondria, but OM mitochondria OxPhos efficiencies were higher than cortex mitochondria. State 3 respiration was low in heart mitochondria with succinate but increased significantly in the presence of rotenone, unlike kidney mitochondria. Similar differences were observed in mitochondrial membrane potential. Differences in H2O2 emission in the presence of succinate±rotenone were observed in heart mitochondria and to a lesser extent in OM mitochondria, but not in cortex mitochondria. Bioenergetics and H2O2 emission data with succinate±rotenone indicate that oxaloacetate accumulation and reverse electron transfer may play a more prominent regulatory role in heart mitochondria than kidney mitochondria. These studies provide novel quantitative data demonstrating that the choice of respiratory substrates affects mitochondrial responses in a tissue-specific manner.
Keywords: Mitochondrial bioenergetics, Respiration, Membrane potential, Oxidative phosphorylation, Reverse electron transport, ROS production, Substrate metabolism
1. Introduction
Mammalian tissues/organs and their cells have different energy demands and metabolic profiles which change during development, aging, and pathological states [1,2]. As such, mitochondrial density and distribution in mammalian cells varies greatly, depending on the energy demand of the tissues/organs and the health and age of the organism [2,3]. It is these tissue-specific energy requirements as well as specialized mitochondrial characteristics that account for the fact that some organs (e.g. heart) are more susceptible to mitochondrial dysfunction than others [4].
The heart is a constantly active muscle and the most energy consuming organ in the human body, deriving its energy from mitochondrial oxidative phosphorylation (OxPhos) [5,6]. As such, heart mitochondria account for approximately one third of the total volume of cardiomyocytes. Mammalian kidneys are second only to the heart in terms of mitochondrial content, energy requirements, O2 consumption, and metabolic rates at rest [7–11]. Kidneys filter waste from the blood, reabsorb nutrients, regulate blood pressure, and balance electrolytes and fluid. An abundance of mitochondria and ATP production is therefore required for normal kidney function. Cardiac and renal dysfunctions are interconnected, with cardiovascular disorders contributing to the pathogenesis of chronic kidney disease (CKD) and accounting for ~50% of mortality in patients with CKD [12–14]. Conversely, kidney dysfunction and even relatively minor reduction in estimated glomerular filtration rate increase the risk for cardiac failure and death [15].
Cellular metabolism and mitochondrial bioenergetics show remarkable plasticity when faced with changing energy needs [9]. Cellular fuel/substrate selection such as glucose, amino acids, and fatty acids is one of the crucial factors in energy production and O2 consumption [10,11]. The catabolism of these nutrients produces acetyl-CoA and other intermediates that feed into the tricarboxylic acid (TCA) cycle. From the TCA cycle, the reducing equivalents NADH and FADH2 feed electrons to the electron transport chain (ETC) for OxPhos resulting in O2 consumption, ADP phosphorylation, and ATP generation. Cells that are highly dependent on OxPhos require the greatest degree of metabolic flexibility for ATP production. For instance, 90% of ATP production in the heart is via OxPhos, with 60–70% of that ATP coming from lipid oxidation [16]. Similarly, in kidney, nearly 90% of ATP production also occurs via OxPhos under physiological conditions [11,17,18]. Kidneys use the majority of ATP for active reabsorption of sodium and other ions and metabolites filtered through the glomeruli. The proximal convoluted tubule (PCT) of renal cortex and the medullary thick ascending limb (mTAL) located at the outer medullary zone contain the greatest density of mitochondria [19–22]. Interestingly, the fuel/substrate preferences vary in different regions of the kidney. For instance, the glomerular cells and mTAL cells metabolize primarily glucose, whereas PCT cells oxidize free fatty acids and ketone body for ATP generation [9,11,23].
Since the glomeruli of human renal cortex filter ~170 l of fluid with 24,000 mEq sodium each day and must actively reabsorb 98–99% of this (~65% via PT and ~25% via mTAL), an enormous amount of energy is required for this work alone [11]. A large amount of blood flow is required to provide this necessary rate of filtration resulting in an abundant supply of O2 for the metabolic needs of renal cortex [24]. However, renal medulla, where the mTAL reabsorbs nearly 25% of the filtered Na+, receives less than 7% of the total renal blood flow and is therefore relatively under perfused and can easily slip into a hypoxic state if metabolic needs increase [25]. In contrast to renal cortex, one of the major tasks of renal medulla is to develop an interstitial concentration solute gradient for reabsorption of filtered water to prevent dehydration [24]. A high blood flow to this region results in a washout of this needed concentration gradient. Delivery of O2 to renal medulla is also compromised by the shunting of O2 that occurs in OM between the countercurrent configuration of the medullary vasa recta microvessels required for concentration of urine [26]. Therefore, understanding the regulation of mitochondrial bioenergetics in different segments of the nephron and different regions of the kidney is highly important.
Although it is well-recognized that the efficiency of mitochondrial OxPhos depends on the nature of the respiratory substrates, the role of these substrates in regulating mitochondrial bioenergetics and their utilization in energetic stress in a tissue-specific manner remains largely unexplored. It is also clear that the choice of substrates for energy metabolism can have a large effect on the kinetics of OxPhos. For example, in a study of mitochondria from the brown adipose tissue of Wistar rats in the presence of succinate, the rates of uncoupling of OxPhos and heat production were found to be five times slower than those observed in the presence of pyruvate+malate [27]. Mitochondrial bioenergetics has been more deeply studied in the heart as compared to the kidney, but neither has been systematically studied to determine the effects of a diverse combination of respiratory substrates on mitochondrial bioenergetics (respiration and ATP production).
The objective of the present study was to characterize and compare mitochondrial respiratory activity and ATP production (i.e. kinetics of OxPhos) in the heart and kidney cortex and OM from normal adult Sprague Dawley rats in the presence of a variety of substrate combinations. Specifically, mitochondria were isolated from the heart and kidney cortex and OM to measure: (i) respiratory rates at different states, (ii) citrate synthase activity, (iii) membrane potential, (iv) state 3 duration of ADP phosphorylation, (v) respiratory control ratio (RCR; state 3/state 2 respiration), (vi) ratio of ADP consumed to O2 consumed (P/O ratio), (vii) kinetics of ADP concentration-dependent O2 consumption and ATP production, and (viii) H2O2 emission in the presence of variety of substrate combinations. Results show that alterations of respiratory substrates led to dramatically different respiratory rates, membrane potentials, and H2O2 production (both kinetics and dynamics) of heart and kidney (cortex and OM) mitochondria. These results are essential for developing predictive computational models of mitochondrial bioenergetics in the heart and kidney and to study the emergent properties of cardiac and renal mitochondrial metabolic systems.
2. Materials and methods
2.1. Mitochondrial isolation
Male Sprague-Dawley (SD) rats (8 weeks old; 300–350 g) were purchased from Envigo (Madison, WI) and housed in our animal facilities for at least a week for acclimation to the new environment before being used. Rats were maintained at 21 ± 2 °C with a 12:12-h light-dark cycle and were provided water and food ad libitum. The Medical College of Wisconsin (MCW) Institutional Animal Care and Use Committee (IACUC) approved the animal use and the experimental protocols described below. Rats were anesthetized with pentobarbital (50 mg/kg, IP) and the heart and kidneys were harvested for mitochondrial isolation by differential centrifugation as described below with the tissue maintained at (4 °C) throughout the procedures.
2.1.1. Heart mitochondria
Heart mitochondria were isolated through differential centrifugation method, as described previously [28–31]. Briefly, the heart was minced in ice-cold isolation buffer (IB) containing (in mM) 200 mannitol, 50 sucrose, 5 KH2PO4, 5 3-(N-morpholino) propane sulfonic acid (MOPS), and 1 EGTA, with 0.1% bovine serum albumin (BSA) at pH 7.15 (adjusted with KOH). The minced heart was suspended in 2.5 ml IB with 5 U/ml protease and homogenized for 30 s. Next, 25 ml IB was added, and the suspension of heart tissue was homogenized further for 60 s. The suspension was then centrifuged at 8000g for 10 min. The supernatant was discarded, and the pellet was re-suspended in 25 ml IB and centrifuged at 8000g for 10 min. The supernatant was discarded, and the pellet was again re-suspended in 25 ml IB and centrifuged at 700g for 10 min. The pellet was discarded and supernatant from this step was centrifuged again at 8000g for 10 min to yield the final mitochondrial pellet which was suspended in IB and kept on ice until used (~30–60 min). The mitochondrial protein content was determined using BSA as the standard with Bio-Rad Quick Start Bradford Assay Kit [32]. Depending on the protein content, the suspension volume was adjusted to have a protein concentration of 12.5 mg protein/ml IB.
2.1.2. Kidney mitochondria
Kidney mitochondria were isolated via differential centrifugation method with slight modification from that for the heart mitochondria. Briefly, cortex and OM were dissected from the kidney. Both tissues were weighed and minced in the IB. For consistency in mitochondrial yield, ~0.1 g of OM tissue and ~0.8 g of cortex tissue was used for mitochondrial isolation. The volume was adjusted with IB to a total of 2 ml for OM and 15 ml for cortex which were then centrifuged at 600g at 4 °C for 10 min. The pellet was discarded, and the supernatant was centrifuged at 12,000g for 15 min. The pellet was then mixed well in IB and the volume was adjusted up to 2 ml for OM and 15 ml for cortex. This was centrifuged for the third time at 12,000 g for 15 min to yield the final mitochondrial pellet which was transferred to a 2 ml dark Eppendorf tube and placed on ice for measuring protein content. Protein content was measured using BSA as mentioned above, and the pellet suspension volume was adjusted to obtain a protein concentration of 12.5 mg protein/ml IB.
2.2. Mitochondrial O2 consumption measurement
The respirometry portion of isolated mitochondrial bioenergetics studies was divided into two protocols depending on ADP concentration used: (i) fixed ADP concentration and (ii) sequential increases in ADP concentration. Mitochondrial O2 consumption (respiration) was measured using an Oxygraph-2k (O2k) system (Oroboros Instruments, Innsbruck, Austria) with its DatLab 7 software used for data acquisition and analysis. The timeline protocols used for these two sets of respiration experiments are shown in Fig. 1A and 1B.
Fig. 1.
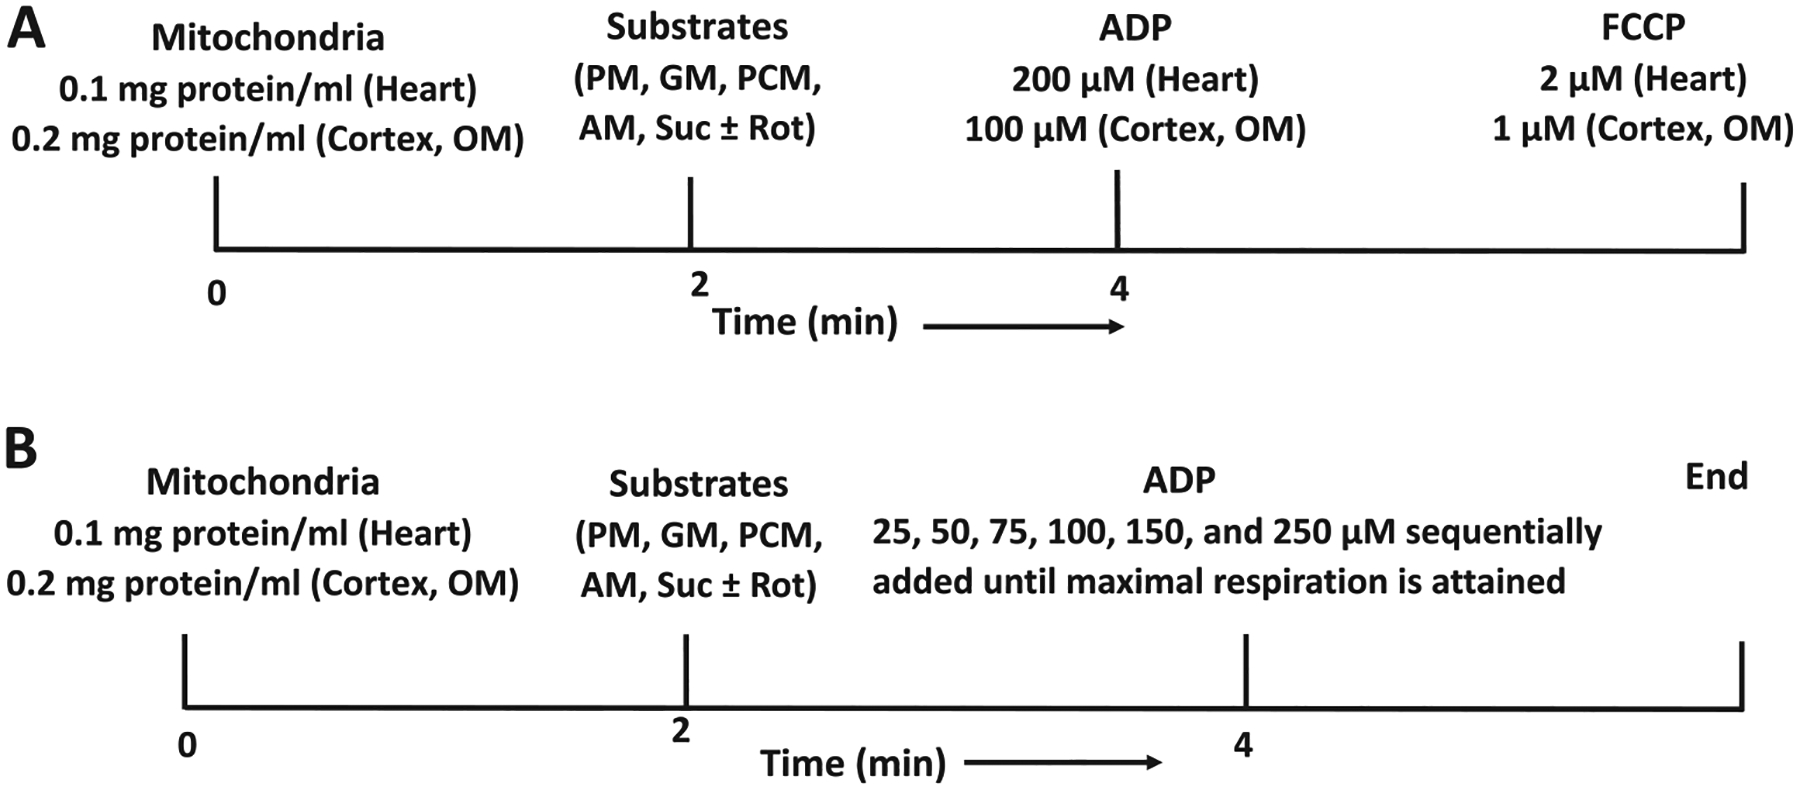
Timeline experimental protocols for isolated mitochondrial bioenergetics studies from the heart and kidney cortex and outer medulla (OM) of Sprague-Drawly (SD) rats. (A) Protocol for measuring time-courses of mitochondrial respiration and membrane potential under different substrates with the addition of a fixed ADP concentration. At time (t) = 0 min, mitochondria (0.1 mg protein/ml for heart and 0.2 mg protein/ml for cortex and OM) were added to the respiration buffer. Various substrate combinations (pyruvate+malate (PM), glutamate+malate (GM), palmitoyl-carnitine+malate (PCM), alpha-ketoglutarate+malate (AM), and succinate±rotenone (Suc ± Rot)) were added at t = 2 min to energize the mitochondria and reach state 2. This was followed by addition of a fixed concentration of ADP (200 μM for heart and 100 μM for cortex and OM) at t = 4 min for transitioning through state 3. Once all the ADP was consumed and respiratory state reached state 4, the uncoupler FCCP was added to attain state 5. (B) Protocol for measuring time-courses of mitochondrial respiration under different substrates with the sequential addition of incremental ADP concentrations. At t = 0 min, mitochondria (0.05 mg protein/ml for heart and 0.2 mg protein/ml for cortex and OM) were added to the respiration buffer. Above mentioned substrate combinations were added at t = 2 min to energize the mitochondria and reach state 2. This was followed by the sequential addition of incremental ADP concentrations starting with 25 μM at t = 4 min. Once all the ADP was consumed and respiratory state reached state 4, a higher concentration of ADP was added. Incremental concentrations of ADP (25, 50, 75, 100, 150, and 250 μM) was sequentially added until maximum respiration was observed.
For the addition of a fixed ADP concentration protocol (Fig. 1A), mitochondria (0.1 mg protein/ml for heart and 0.2 mg protein/ml for cortex and OM) were suspended in respiration buffer (RB) within the O2k chamber (2 ml) containing (in mM) 130 KCl, 5 K2HPO4, 20 MOPS, 1 EGTA, and 0.1% BSA at pH 7.15 adjusted with KOH. Before each experiment, O2 concentration in RB was equilibrated for 2–3 min with air in the O2k chambers at 37 °C until a stable signal was obtained at an O2 concentration of approximately 205 μM. In all cases, experiments were initiated at t = 0 min with isolated mitochondria suspended in RB to reach state 1. The mitochondrial suspension was constantly stirred (750 rpm) inside the O2k chambers, and chemicals were added through the titanium injection port of the stoppers using Hamilton syringes. State 2 respiration was initiated with different substrates combinations at saturating concentrations, including pyruvate+malate (PM; 5 + 2.5 mM), glutamate+malate (GM; 5 + 2.5 mM), palmitoyl-l-carnitine+malate (PCM; 25 μM + 2.5 mM), alpha-ketoglutarate+malate (AM; 5 + 2.5 mM), and succinate±rotenone (Suc ± Rot; 10 mM + 0.5 μM) at time t = 2 min. State 3 respiration was measured by adding 200 μM ADP for heart mitochondria and 100 μM ADP for cortex and OM mitochondria at t = 4 min. State 4 respiration was measured after the phosphorylation of added ADP to ATP. Finally, after all the added ADP is converted to ATP, state 5 respiration was measured by adding the uncoupler FCCP (1 μM for cortex and OM, 2 μM for heart). Oxygen consumption rates (OCR; JO2) during different states of respiration were calculated as the negative time derivative of O2 concentration measured in the closed O2k chambers and expressed as nmol of O2/min/mg protein. Data were recorded at every 1 s and 5 data points averaging was used to calculate the slope of the O2 concentration data using the DatLab 7 software. Respiratory control ratio (RCR) was calculated as state 3/state 2 OCR for each substrate and each tissue. RCR at saturating concentrations of ADP (400 μM for heart mitochondria and 200 μM for cortex and OM mitochondria) with PM as substrate was used to access the functional integrity of isolated mitochondria.
The timeline protocol shown in Fig. 1B (sequential addition of incremental ADP concentrations) was designed to assess the dependency of mitochondrial respiration on ADP concentrations for different substrates. At t = 0 min, isolated mitochondria (0.05 for heart and 0.2 mg protein/ml for cortex and OM) were added to the O2k chamber (2 ml) filled with RB, with its constituents as described above (state 1). Various substrate combinations (PM, GM, PCM, AM, and Suc ± Rot) were added at t = 2 min to energize the mitochondria (state 2) followed by sequential additions of incremental ADP concentrations starting with 25 μM at t = 4 min. A higher concentration of ADP (e.g., 50 μM) was then added when state 4 respiration was reached (e.g., when all the added ADP was converted to ATP). Incremental concentrations of ADP were subsequently added until maximum state 3 respiration was attained. For these data, RCR was calculated as a function of the added ADP concentration for each substrate combination and each tissue as the ratio of state 3 OCR at any given ADP to state 2 OCR at ADP = 0 μM. As stated above, to test the functional integrity of isolated mitochondria on a given experimental day, maximal RCR was calculated as state 3/state 2 OCR, with the state 3 OCR obtained at saturated concentrations of ADP (see above) for the PM substrate combination.
2.3. Apparent Vmax and Km of ADP for state 3 OCR
To characterize the tissue-specific effects of different respiratory substrates on the apparent Vmax (maximal state 3 OCR or JO2) and Km of ADP for state 3 JO2, we fitted the following Michaelis-Menten equation to the state 3 JO2 data as a function of ADP concentration ([ADP]) for different substrates and different tissues:
| (1) |
where V0 is state 2 JO2 (i.e. JO2 at [ADP] = 0).
2.4. Citrate synthase (CS) specific activity measurement
Citrate synthase (CS) is the first enzyme of the tricarboxylic acid (TCA) cycle and an exclusive marker of mitochondrial content [33,34]. It catalyzes the reaction between acetyl coenzyme A (ACoA) and oxaloacetic acid (OAA) to form citric acid. CS activity in isolated mitochondria was determined using an assay kit, catalog number CS0720 (Sigma Aldrich). It is a colorimetric plate-based assay in which CoA-SH, a byproduct of the CS-mediated reaction of OAA and ACoA, interacts with 5′, 5′-Dithiobis 2-nitrobenzoic acid (DTNB) to form 5-thio-2-nitrobenzoic acid (TNB; OD: 412 nm). The reaction catalyzed by the CS enzyme is: i) ACoA + OAA + H2O ↔ Citrate + CoA-SH + H+, and ii) the colorimetric reaction is: CoA-SH + DTNB → TNB + CoA-S-S-TNB. The assay buffer provided by the kit was supplemented with DTNB (0.1 mM) and ACoA (0.3 mM) and loaded in a 96-well round bottom plate along with isolated mitochondria (0.5 μg/uL protein) from heart, cortex, and OM freshly diluted in lysis buffer. The absorbance of the reaction mixture was followed for ~3 min to measure baseline reaction with absorbance at 412 nm (A412), due to endogenous levels of thiol or deacetylase activity. The principle of the assay was to initiate the reaction of ACoA with OAA (1 mM) which was recorded for 90 s. The net CS activity was calculated by subtracting the rate of change of absorbance at 412 nm (ΔA412/min) of the endogenous activity from the ΔA412/min of the total activity of the mitochondrial sample. The CS activity was determined using the Beer-Lambert law and a molar absorption coefficient of 13.6 mM/cm for TNB at 412 nm. The CS activity in μmol/min/ml or U/ml was then normalized to the total sample protein content and reported as CS specific activity in μmol/min/mg protein or U/mg protein.
2.5. Mitochondrial membrane potential measurement
Isolated mitochondrial membrane potential (ΔΨm) was measured during different states of respiration spectrofluorometrically following the timeline protocol of Fig. 1A. This was conducted using a Photon Technology International (PTI) spectrofluorometer (Horiba Scientific Inc.) and the fluorescent dye rhodamine 123 (R123; 1 μM) in the respiration buffer (RB), with the excitation wavelength (λex) set at 500 nm and emission wavelength (λem) set at 530 nm. R123 is a monovalent cationic dye that is sequestered electrophoretically into the mitochondrial matrix driven by ΔΨm [35]. Mitochondrial energization with a respiratory substrate quenches R123 fluorescence, where the rate of fluorescence decay is proportional to the rate of ΔΨm rise [28,36–38]. The kinetics of R123 fluorescence decrease observed by adding different substrate combinations (PM, GM, AM, PCM, and Suc ± Rot) and the kinetics of R123 fluorescence increase by adding ADP were determined, where the overall R123 fluorescence alteration rate was proportional to the rate of increase in ΔΨm during state 2 respiration and the rate of decrease in ΔΨm during state 3 respiration. The uncoupler FCCP (5 μM) was added after ADP phosphorylation (state 4) to maximally depolarize the mitochondria at the end of the experiment, resulting in a maximal R123 fluorescence increase. The R123 signal intensity at a given time was normalized by the initial R123 signal intensity obtained at the beginning of mitochondrial addition to the RB, which normally is not significantly different from the R123 signal intensity obtained following maximal depolarization with FCCP.
2.6. Mitochondrial membrane potential calibration
R123 is widely used for dynamic measurements of isolated mitochondrial membrane potential (ΔΨm), but quantitative interpretation of changes in the measured R123 fluorescence is not straight forward because of quenching and logarithmic relationship between R123 concentration and ΔΨm. It requires an appropriate calibration method for which we used a computational model of mitochondrial bioenergetics coupled with R123 dye transport across the inner mitochondrial membrane (IMM) and partitioning of the dye into the mitochondrial matrix [38]. This model suggests: (i) a nonlinear calibration curve between experimentally measured R123 fluorescence intensity and ΔΨm, and (ii) both the R123 fluorescence intensity and the calibration curve are sensitive to the total concentrations of the dye and mitochondria in the RB. The model was parameterized and validated with kinetic measurements in isolated mitochondria to determine ΔΨm transients from R123 fluorescence intensity and thereby quantifying the kinetics of mitochondrial bioenergetics under tissue and substrate-specific experimental conditions. This calibration method is further described in the Supplementary materials.
2.7. Mitochondrial H2O2 emission measurement and H2O2 calibration
Mitochondrial H2O2 is the direct product of superoxide (O2•−) catalyzed by superoxide dismutase (SOD) in the absence of nitric oxide. Mitochondrial H2O2 emission was measured spectrofluorometrically using the amplex red reagent (10-acetyl-3, 7-dihydroxyphenoxazine; 50 μM) in the presence of 0.1 U/ml horseradish peroxidase (HRP) at 37 °C. This assay is based on the oxidation of amplex red, which is catalyzed by HRP in the presence of H2O2 to produce a red fluorescent oxidation product, viz. resorufin, at a 1:1 ratio. Resorufin fluorescence was measured using a spectrofluorometer (PTI, Horiba Scientific Inc.) with excitation and emission wavelengths set at 530 and 583 nm, respectively. Resorufin fluorescence was calibrated to H2O2 concentration by sequential additions of known concentrations of H2O2 into the respiration buffer (RB) in the absence of mitochondria over a range of 0.1–3.5 μM with 0.1–0.5 μM increments for n = 5 individual experiments, as shown in the Supplemental Fig. S1(A). When using the resorufin fluorescence intensity as a mean for detection of H2O2, a linear relationship between fluorescent signal and H2O2 concentration was observed (Fig. S1(B)) (standard curve). Using linear regression analysis, H2O2 concentrations in the range of 0.1 to 3.5 μM can be detected with a high degree of confidence, as the coefficient of determination (R2) was 0.9973. Following H2O2 calibration (standard curve), mitochondrial H2O2 emission measurements were performed in RB containing isolated mitochondria from heart, cortex and OM following the timeline protocol depicted in Fig. 1A. ROS generation was stimulated with complex II substrate Succinate (10 mM) in the presence and absence of complex I inhibitor Rotenone (0.5 μM).
2.8. Data analysis and statistics
Matlab, GraphPad Prism, and MS Excel programs/softwares were used to perform the necessary calculations needed to calibrate the R123 fluorescence signals to absolute ΔΨm values and to determine changes in different variables from one state to the other, including statistical analyses (i.e., computations of mean, standard deviation (S.D.), and standard error (S.E.) of a particular variable over multiple day experiments; one-way ANOVA; post-hoc test), and to plot the resulting data. Statistical tests (t-test and one-way ANOVA for p < 0.05) were done for both tissue and substrate-specific mitochondrial functional parameters. Data are shown as representative traces and as mean ± S.E. of n = 4–9 independent experiments.
3. Results
We measured tissue-specific (i) respiratory states and rates, (ii) CS specific activity, (iii) membrane potential (ΔΨm), (iv) state 3 duration of ADP phosphorylation, (v) RCR, (vi) P/O ratio, (vii) H2O2 emission, and (viii) kinetics of ADP concentration-dependent O2 consumption and ATP production using isolated mitochondria from the heart and kidney cortex and OM of healthy adult SD rats in the presence of various respiratory substrate combinations (PM, GM, PCM, AM and Suc ± Rot). These diverse results are described next under different subsections.
3.1. Functional integrity of isolated mitochondria from heart and kidney tissues
Comparison of mitochondrial bioenergetic functions among different tissues requires evaluation of important markers that characterize the functional integrity and intactness of isolated mitochondria from these tissues. For all studies, the functional integrity of isolated mitochondria was ensured by measuring maximal RCR (maximal state 3/state 2 OCR) and CS specific activity. The maximal RCR was measured with PM substrates at saturated ADP concentration (400 μM for heart mitochondria and 200 μM for kidney mitochondria) most experimental days. The maximal RCRs for the reported experiments averaged 10 ± 0.4 for heart, 6.8 ± 0.1 for cortex, and 6.4 ± 0.2 for OM mitochondria (Fig. 2A). The measured CS specific activities for heart, cortex, and OM mitochondria were 0.26 ± 0.02, 0.16 ± 0.02, and 0.17 ± 0.01 (U/mg protein); respectively. Thus, the CS specific activity in heart mitochondria was approximately 1.5 times higher than that in kidney (cortex and OM) mitochondria (Fig. 2B). This difference in CS specific activity between heart and kidney mitochondria is virtually the same as that for the corresponding RCR values (Fig. 2A).
Fig. 2.
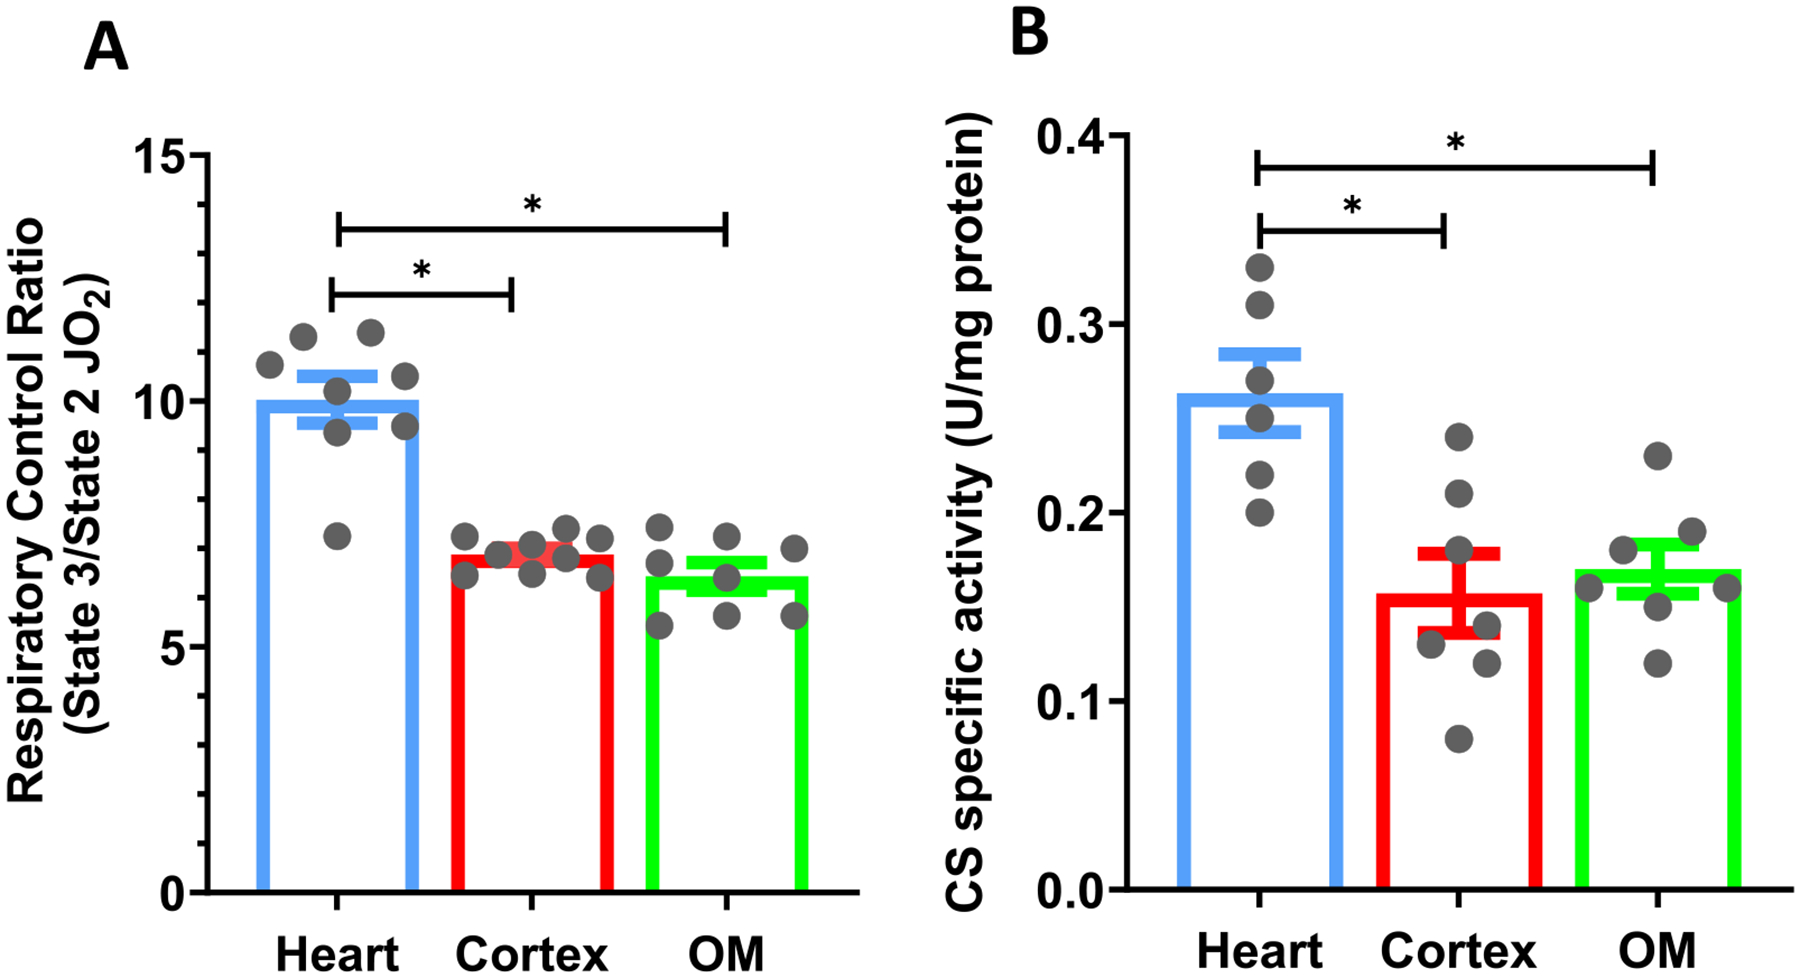
Characterization of the functional markers of isolated mitochondria. (A) Tissue-specific comparisons of the maximal respiratory control ratio (RCR; state 3/state 2 respiration) for isolated mitochondria from the heart, cortex, and OM with the PM substrate. (B) Tissue-specific comparisons of the citrate synthase (CS) specific activity (U/mg protein) in isolated mitochondria from the heart, cortex and OM. Data are shown as average over n = 6–9 independent biological replicates ± S.E. for each tissue. The symbol ‘*’ shows the statistical significance (p < 0.05) based on one-way ANOVA with repeated measures. Figures were generated using GraphPad Prism 9 software.
3.2. Mitochondrial respiratory rate substrate response differences between heart and kidney tissues with addition of a fixed ADP concentration
Fig. 3 shows representative time courses of mitochondrial O2 consumption rates (JO2; OCR) for isolated heart, cortex, and OM mitochondria transitioning from state 1 to state 5 respiration. These time courses follow the timeline protocol of Fig. 1A. Transitions from states 1 to 5 respiration were monitored by first adding isolated mitochondria (0.1 mg protein/ml for heart and 0.2 mg protein/ml for cortex and OM) to the respiration buffer at t = 0 min leading to state 1 respiration. Different substrate combinations (PM, GM, PCM, AM, or Suc ± Rot) were added at t = 2 min leading to state 2 respiration. This was followed by addition of ADP (200 μM for heart and 100 μM for cortex and OM) at t = 4 min, which initiated state 3 respiration and then transitioned to state 4 respiration after the phosphorylation of added ADP to ATP. The uncoupler FCCP was added once all the added ADP was converted to ATP to attain state 5. Fig. 4 shows the summary of the substrate and tissue-specific comparisons of OCR (states 2, 3 and 5), RCR, state 3 durations (sec), and P/O ratios derived from the dynamic data exemplified in Fig. 3. The data in Fig. 4 are also shown in alternative Supplemental Fig. S2, comparing different respiratory parameters for different substrates and different tissues. Some of the substrate and tissue-specific differences in these respiratory parameters can be better appreciated from Fig. S2.
Fig. 3.
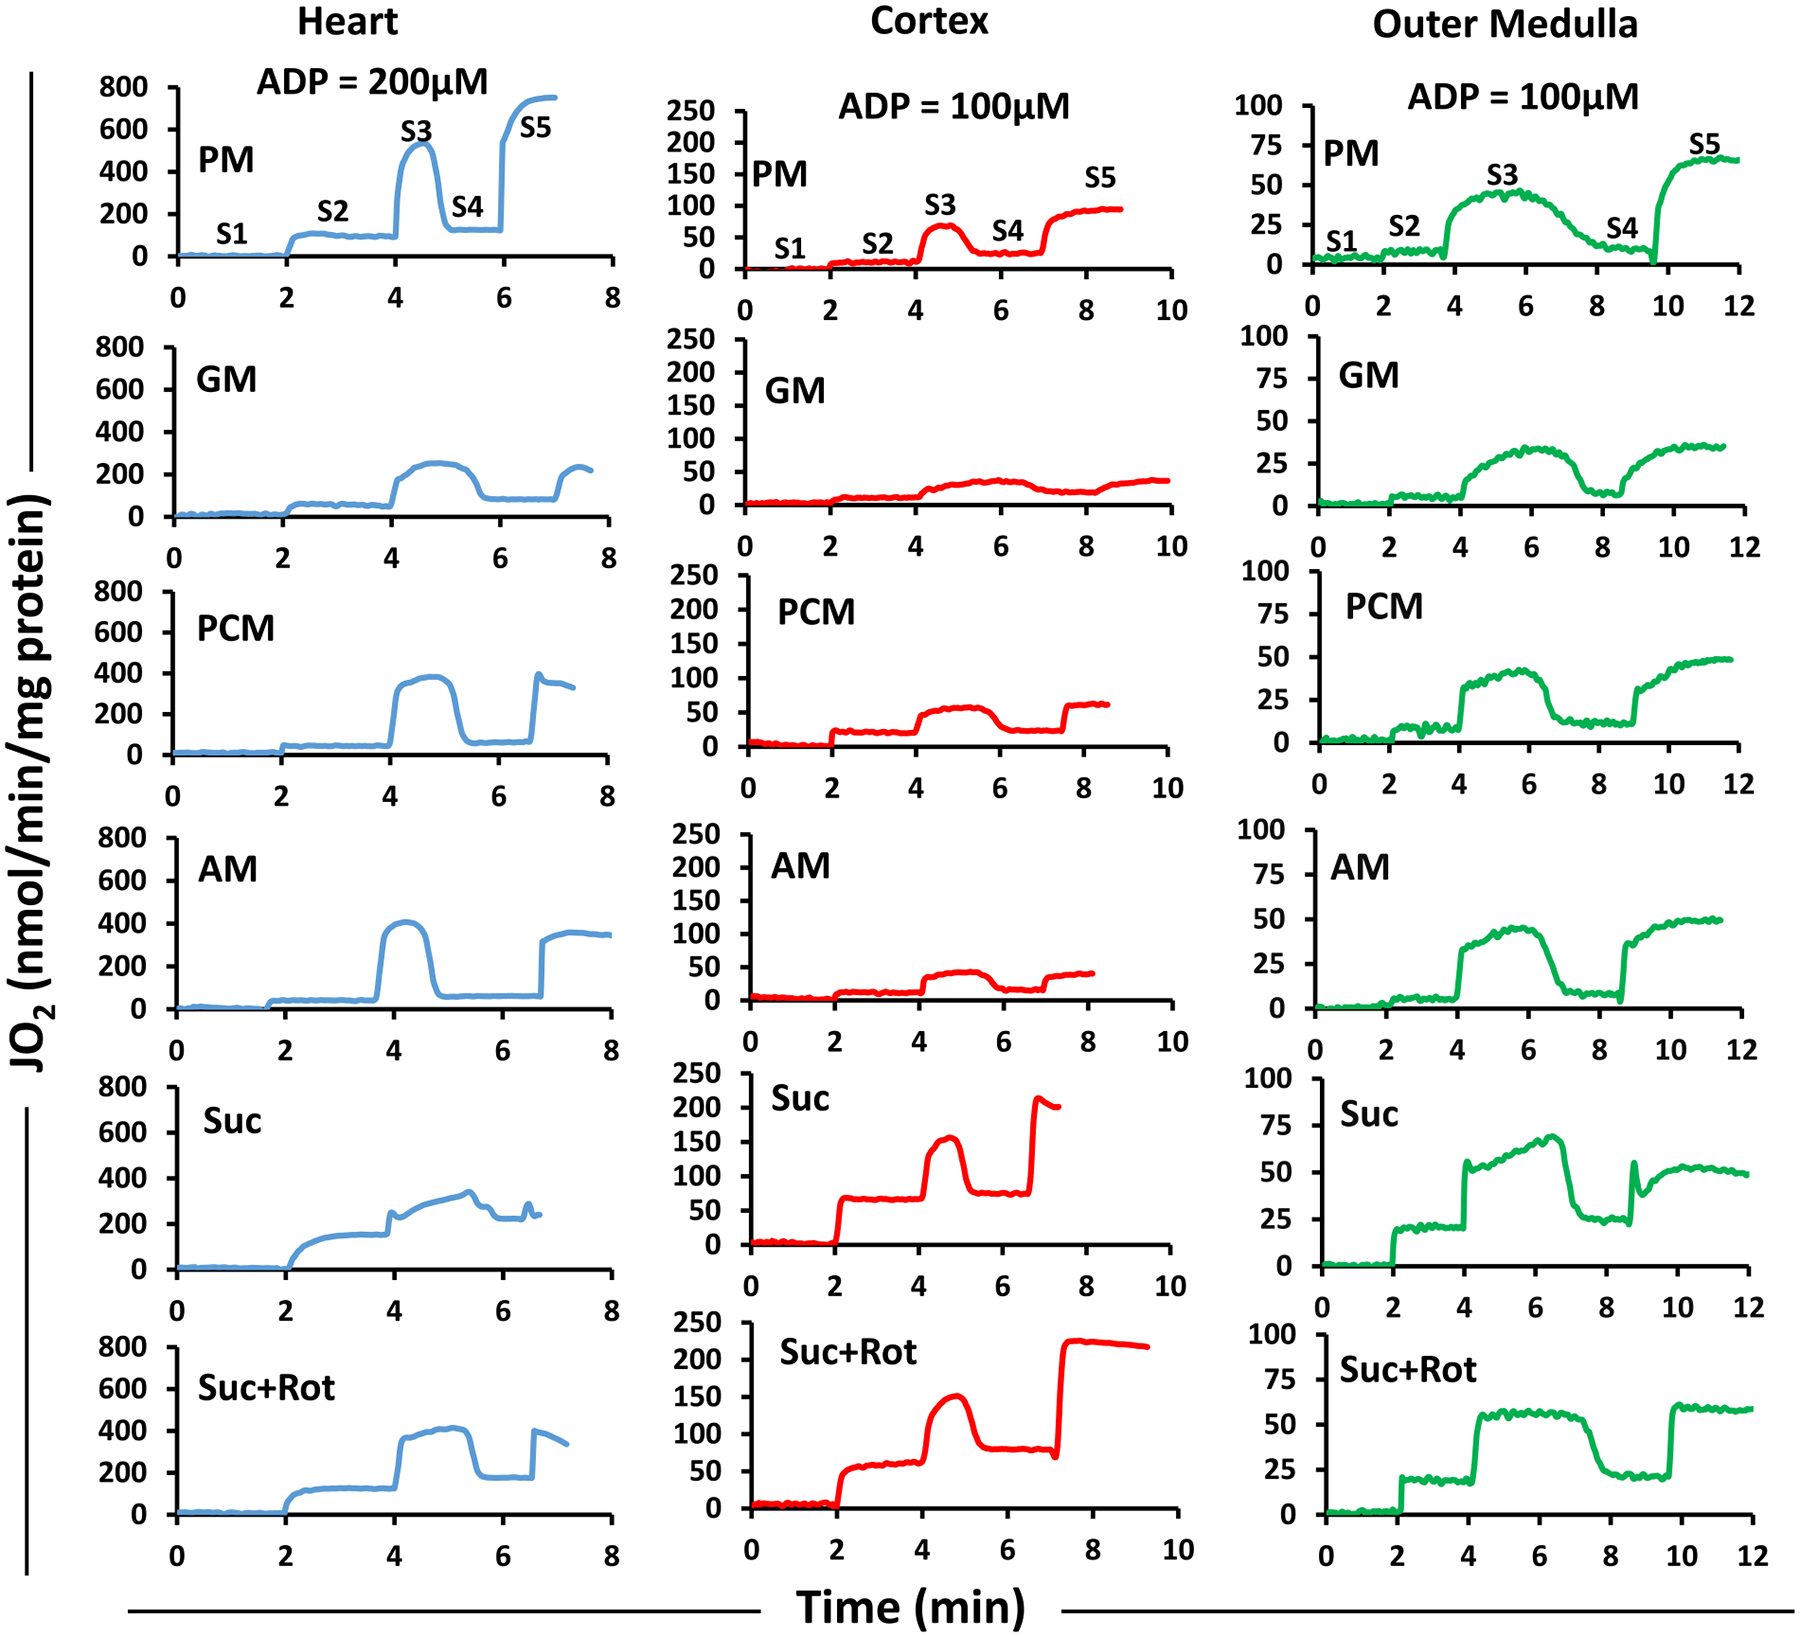
Representative time-courses of isolated mitochondrial respiration for the heart, cortex, and OM transiting from state 1 to state 5 respiration under different substrates. The timeline experimental protocol is as described in Fig. 1A. The respiratory rates (O2 consumption rates; JO2) are expressed as nmol/min/mg mitochondrial protein. The transitions from state 1 to state 5 respiration were monitored by first adding isolated mitochondria (0.1 mg protein/ml for heart and 0.2 mg protein/ml for cortex and OM) to the respiration buffer at t = 0 min leading to state 1. This was followed by addition of different substrate combinations (PM, GM, PCM, AM, or Suc ± Rot) at t = 2 min leading to state 2. This was followed by addition of ADP (200 μM for heart and 100 μM for cortex and OM) at t = 4 min which initiated state 3 respiration proceeding to state 4 after the phosphorylation of the added ADP to ATP. Once all the ADP was consumed, the uncoupler FCCP was added to attain state 5. The rows are for different tissues and the columns are for different substrates. PM: pyruvate+malate, GM: glutamate+malate, PCM: palmitoyl-carnitine+malate, AM: alpha-ketoglutarate+malate, and Suc ± Rot: succinate±rotenone.
Fig. 4.
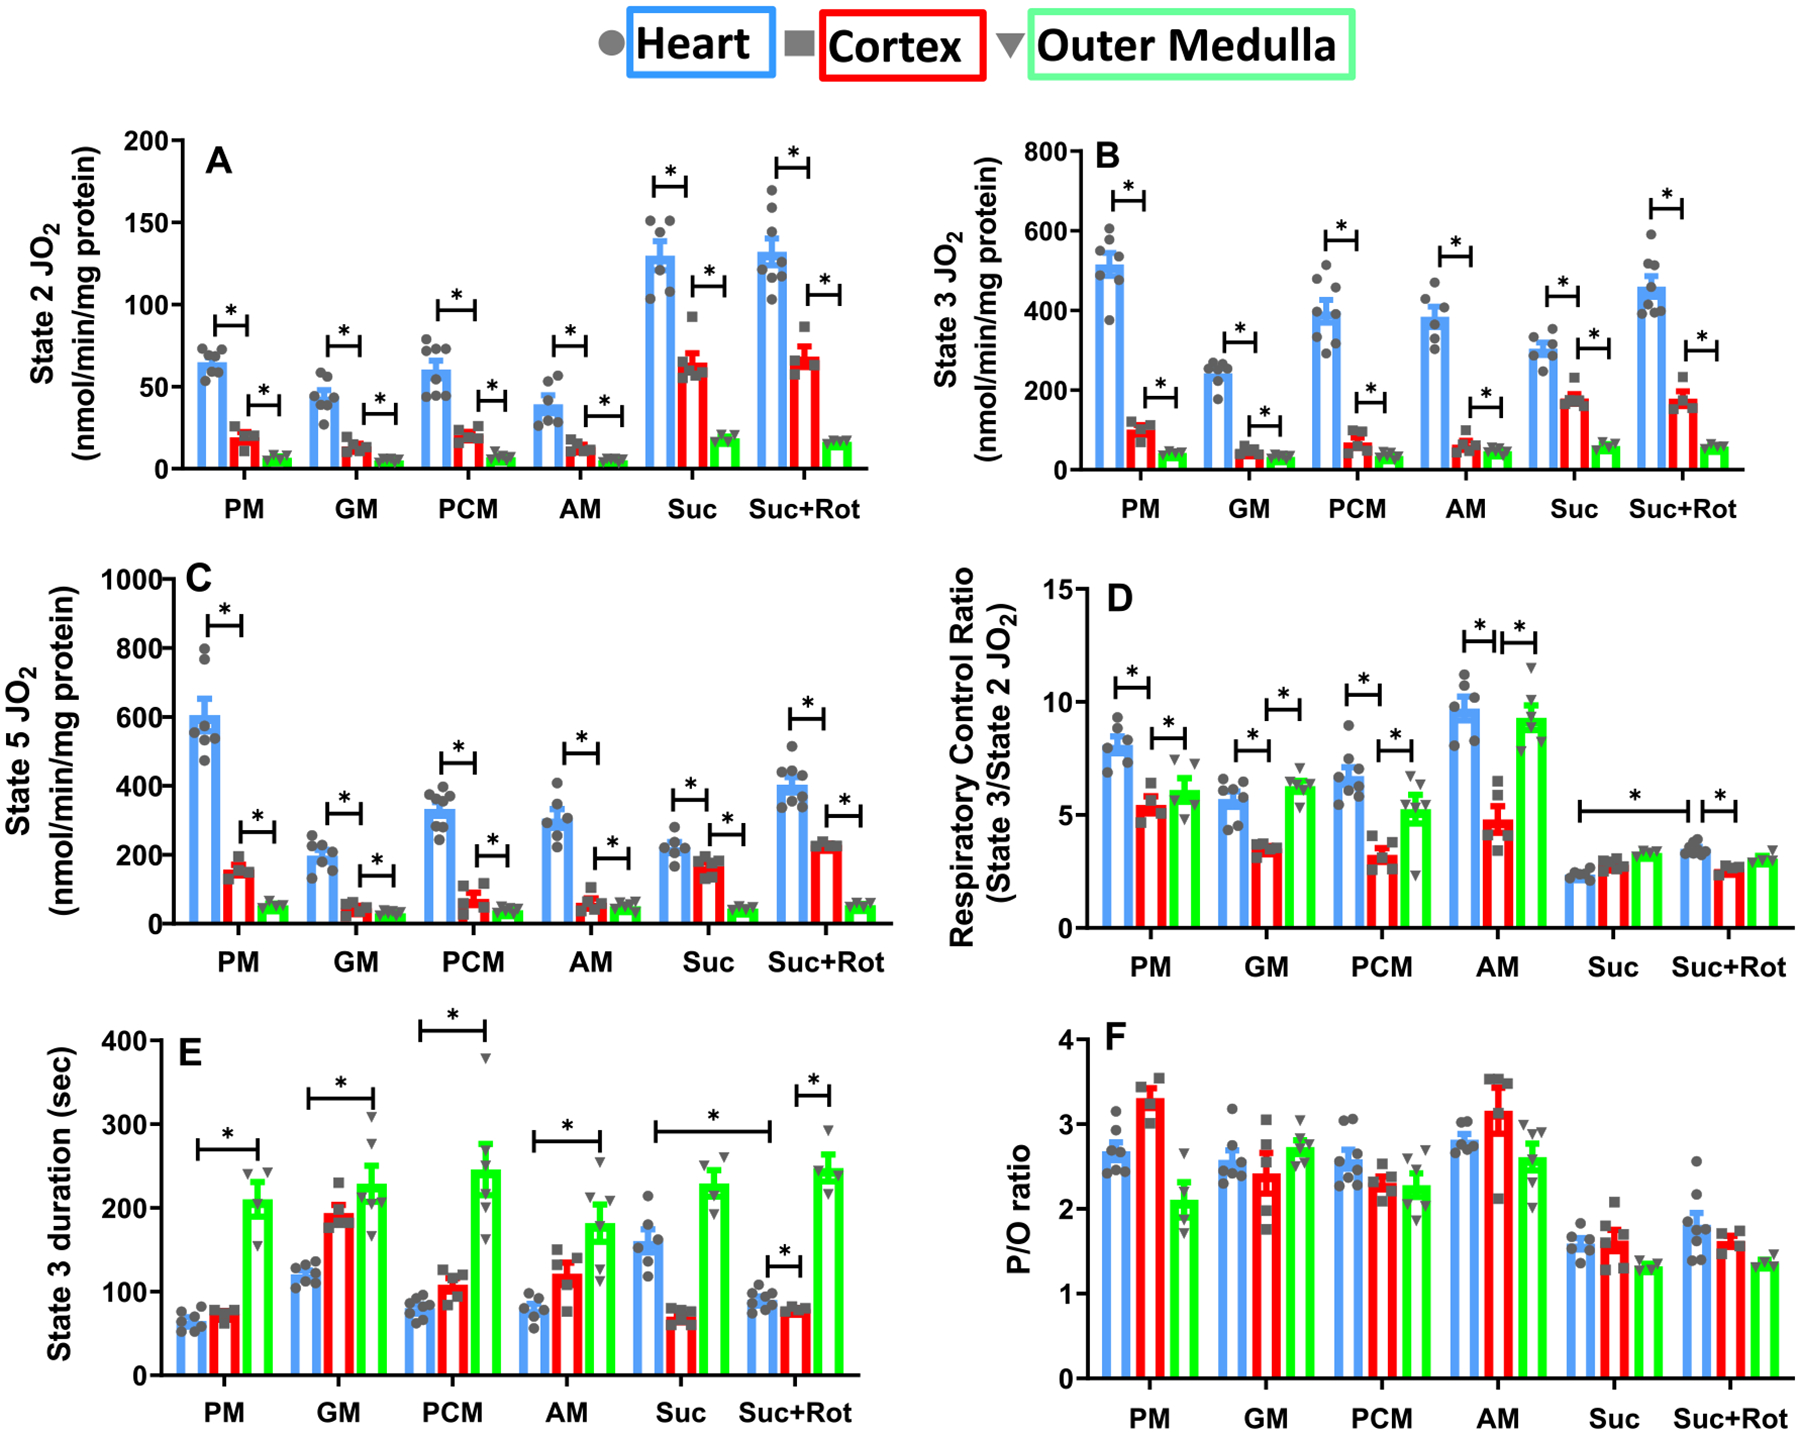
Substrate- and tissue-specific comparisons of isolated mitochondrial respiratory markers for the heart, cortex, and OM with different substrates. Shown are the respiratory rates at state 2 (A), state 3 (B), state 4 (C), and state 5 (D); state 3 duration (E); and P/O ratio (F) for the heart, cortex, and OM under substrates combinations of PM, GM, PCM, AM, and Suc ± Rot. These data are derived from the dynamic data shown in Fig. 3. Data are shown as average over n = 4–6 independent replicates ± S.E. for each substrate and tissue. The symbol ‘*’ shows the statistical significance (p < 0.05) based on one-way ANOVA with repeated measures. Figures were generated using GraphPad Prism 9 software.
For all substrates studied, OCR under states 2, 3 and 5 were significantly higher for heart mitochondria than those for cortex or OM mitochondria (Fig. 4A–C). OCR at state 2 was highest with Suc ± Rot for all tissues (Fig. 4A). In heart mitochondria, state 3 OCR was highest with PM followed by Suc + Rot, PCM, AM, Suc and GM (Fig. 4B). In contrast, in mitochondria from kidney cortex and OM, the highest OCR for state 3 was achieved with Suc ± Rot (Fig. 4B). The descending order of state 3 OCR for cortex mitochondria is Suc ± Rot followed by PM, PCM, AM and GM. Similarly, for OM mitochondria, it is Suc ± Rot followed by AM, PM, PCM and GM.
For a given tissue and substrate combination, state 5 OCR was measured by uncoupling mitochondria using FCCP (Fig. 4C). Heart mitochondria had the highest state 5 OCR in comparison to mitochondria from cortex and OM for all substrates studied. Comparison of OCR under state 3 (Fig. 4B) and state 5 (Fig. 4C) shows that the heart mitochondrial OCR under state 5 was significantly higher than that under state 3 in the presence of PM, but not in the presence of the other substrate combinations studied.
RCR values with sub-saturating added ADP (200 μM for heart and 100 μM for cortex and OM) were compared between heart, cortex, and OM mitochondria for different substrates (Fig. 4D). The RCR data showed that heart mitochondria had higher RCR values than kidney (cortex and OM) mitochondria. It also showed that OM mitochondria are more efficient than cortex mitochondria as the RCR values for OM were higher than those for cortex. The RCR values were lowest with Suc ± Rot for all three tissues. Interestingly, heart mitochondria RCR values increased when Suc was provided in the presence of Rot, but not for kidney mitochondria.
State 3 duration (s) was calculated as the difference between the time when ADP was added to the mitochondrial suspension and the time once all the added ADP was consumed (start of state 4). As expected, state 3 duration was longest for OM mitochondria and shortest for heart mitochondria, except in the presence of Suc where state 3 duration was longer for heart mitochondria than that for cortex mitochondria (Fig. 4E). For heart and cortex mitochondria, the shortest state 3 duration was in the presence of PM. In contrast, state 3 durations were not significantly different for OM mitochondria for the substrate combinations studied.
The tissue and substrate-specific P/O ratios (amount of ADP consumed/amount of O2 consumed) were determined as a measure of mitochondrial efficiency for ATP synthesis (Fig. 4F) based on the sub-saturating added ADP mentioned in Fig. 1A (200 μM for heart and 100 μM for cortex and OM). It is the same ADP concentration at which state 3 respiration was measured. For mitochondria from all three tissues, P/O ratio was lowest (1.4–1.6) in the presence of Suc ± Rot. For cortex mitochondria, P/O ratio was highest for the fatty-acid-based PCM substrate, followed by PM, GM, and AM. For NADH-linked substrates, P/O ratios were in the range 2.4–2.8 for cortex mitochondria, 2.1–2.7 for OM mitochondria, and 2.6–2.8 for heart mitochondria.
3.3. Mitochondrial membrane potential substrate response differences between heart and kidney tissues with addition of a fixed ADP concentration
To elucidate how respiratory substrates influence inner mitochondrial membrane (IMM) functionality in the heart, cortex, and OM, ΔΨm was evaluated using the cationic dye R123. The timeline protocol is as in Fig. 1A. The R123 fluorescent intensity (a.f.u.) was normalized by its initial intensity. As illustrated in Supplemental Fig. S3, the R123 fluorescence signal decreased following the addition of isolated mitochondria and addition of a substrate to the respiratory buffer indicative of increased polarization of the IMM and hence a more energized ΔΨm. As expected, ADP-stimulated OxPhos caused a reversible increase in the fluorescence signal indicating ΔΨm depolarization. It is due to inward proton pumping through the F1F0-ATP synthase to phosphorylate the added ADP to ATP. The addition of FCCP at the end of the protocol uncoupled ΔΨm (maximum depolarization) and resulted in a sudden increase in the R123 fluorescence signal.
The R123 fluorescence signals (Supplemental Fig. S3) were converted to ΔΨm (in mV) as represented in Fig. 5 using a previously developed computational model by Huang et al. [38] for R123 disposition in isolated mitochondria. This computational method of calibration is briefly described in Supplemental materials. The ADP-stimulated transient ΔΨm depolarization was lower in heart mitochondria compared to that in kidney cortex and OM mitochondria for all substrates studied except Suc. In contrast, it was highest in OM mitochondria for all substrates studied. For heart mitochondria, state 2 ΔΨm was ~200 mV for all substrates studied (Fig. 5). However, state 3 ΔΨm ranged between ~166 mV in the presence of PM and ~150 mV in the presence of Suc ± Rot. For cortex mitochondria, the ranges of ΔΨm under state 2 and state 3 were ~160–180 mV and ~135–160 mV, respectively, for all six substrates studied. For OM mitochondria, the ranges of ΔΨm under state 2 and state 3 were ~140–160 mV and ~105–130 mV, respectively, for all substrates studied. We also calculated state 3 duration (sec) between ΔΨm depolarization with ADP addition (start of state 3) and subsequent ΔΨm repolarization upon conversion of the added ADP to ATP (start of state 4). This duration was longest for OM mitochondria for all substrates, especially for GM (Fig. 5B). In contrast, state 3 duration was shortest for heart mitochondria for all substrates except Suc. State 3 durations in the presence of Suc (~213 ± 5 s) and Suc + Rot (~146 ± 3 s) were different for heart mitochondria (Fig. 5E, F).
Fig. 5.
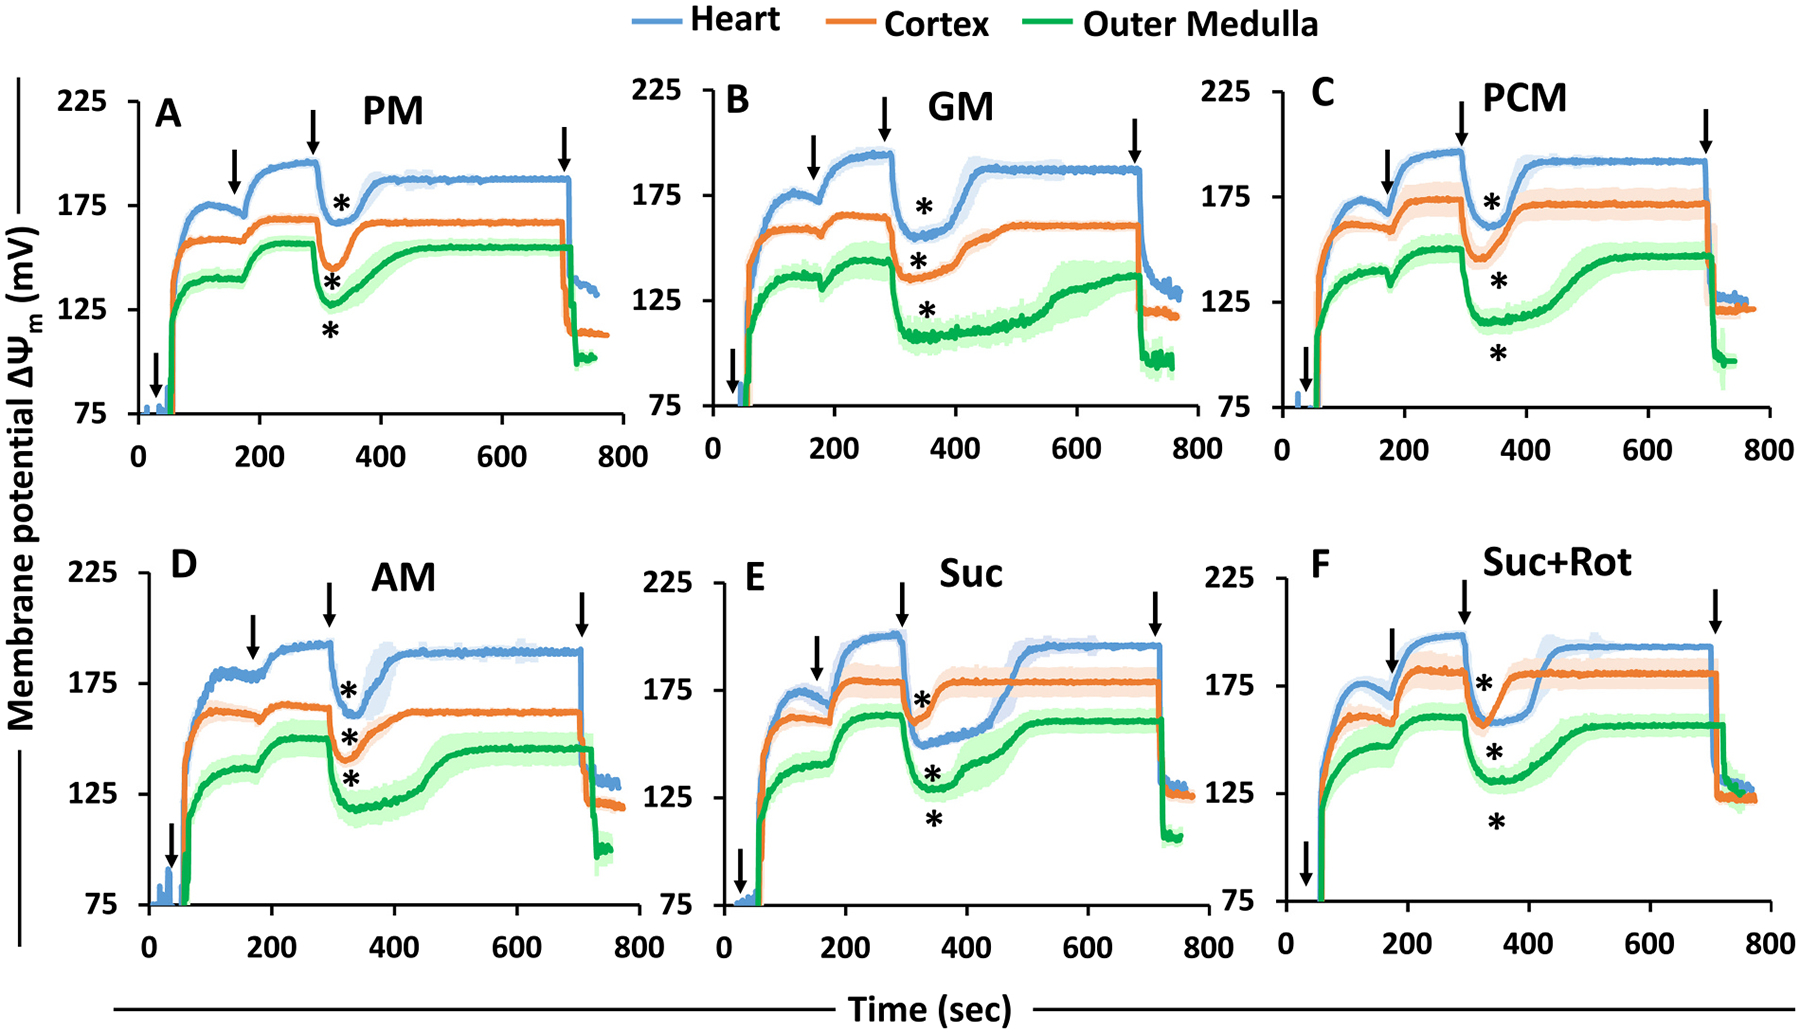
Substrate- and tissue-specific comparisons of the time-courses of isolated mitochondrial membrane potential (ΔΨm in mV; calibrated) for the heart, cortex, and OM transitioning from state 1 to state 5 respiration under different substrates. The timeline experimental protocol is as shown in Fig. 1A. The substrate combinations used are PM (A), GM (B), PCM (C), AM (D), Suc (E), and Suc + Rot (F). The ΔΨm in mV is calibrated from the R123 fluorescent intensity from Supplement Fig. S3. Black arrows show the times (sec) of mitochondria (0.1 mg protein/ml for heart and 0.2 mg protein/ml for cortex and OM), substrates, ADP (200 μM for heart and 100 μM for cortex and OM), and FCCP additions to the PTI spectrofluorometer cuvette in that order. The symbol ‘*’ shows the statistical significance (p < 0.05) of peak state 3 ΔΨm based on one-way ANOVA with repeated measures.
3.4. Succinate-fueled tissue-specific mitochondrial bioenergetics and H2O2 emission
Mitochondrial reactive oxygen species (ROS; e.g. superoxide, O2•−; and hydrogen peroxide, H2O2) are known to be predominantly produced by reverse electron transport (RET) via oxidation of reduced ubiquinol (CoQ) at complex I. Given the potential injurious effects of oxidative stress induced by excess ROS production, the factors that contribute to excess ROS production potentially affecting mitochondrial bioenergetics were investigated for different tissues. Specifically, mitochondrial bioenergetics and H2O2 dynamics were determined in the presence of the FADH2-linked complex II substrate Suc (±Rot) following the timeline protocol of Fig. 1A.
As shown in Fig. 6A, the ADP-stimulated state 3 respiration of heart mitochondria was small when energized with Suc but was significantly increased following addition of the complex I inhibitor Rot. In contrast, for both cortex and OM mitochondria, the ADP-stimulated respiration (state 3) in the presence of Suc with or without Rot were similar (Fig. 6B, C).
Fig. 6.
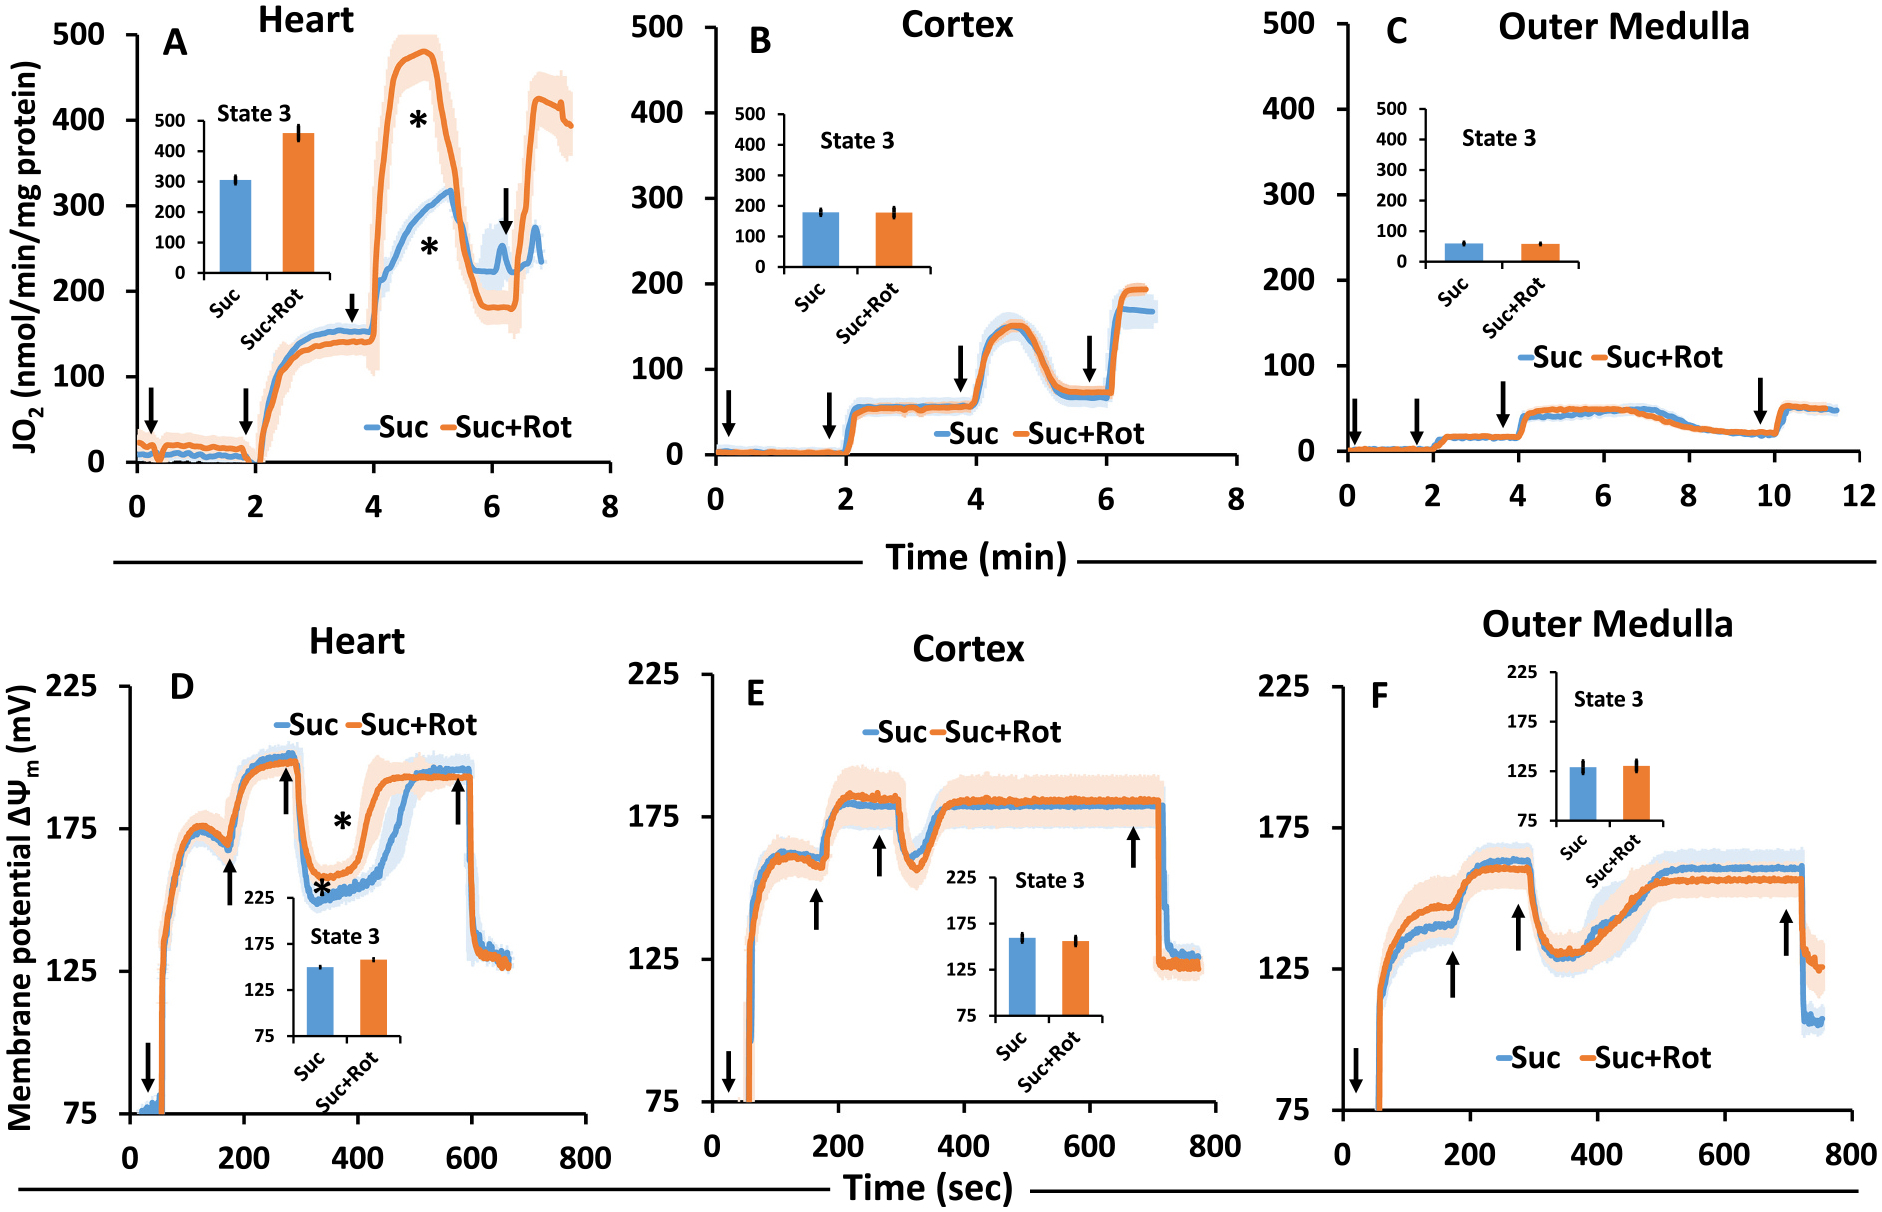
Comparison of the time-courses of isolated mitochondrial respiration (A–C) and corresponding membrane potential (ΔΨm in mV) (D–F) transitioning from state 1 to state 5 respiration in the presence of the Suc ± Rot for the heart, cortex, and OM. Black arrows show the times of mitochondria, substrate, ADP, and FCCP additions in this order. The symbol ‘*’ shows the statistical significance (p < 0.05) of peak state 3 levels based on one-way ANOVA with repeated measures.
To demonstrate ΔΨm responses under the above-mentioned conditions, heart mitochondria showed a higher ΔΨm value (less depolarized) when ADP was added in the presence of Suc + Rot (~160 mV) than with Suc alone (~150 mV; Fig. 6D). Dynamic ΔΨm measurements also showed that heart mitochondrial depolarization (state 3 duration) was more prolonged to recover from the depolarization upon ADP addition (state 4) in the presence of Suc than in the presence of Suc + Rot. On the other hand, state 3 duration calculated from the dynamic ΔΨm measurements were similar in the presence of Suc ± Rot for cortex and OM mitochondria (Fig. 6E, F).
To demonstrate H2O2 responses under the above-mentioned conditions, tissue-specific mitochondrial H2O2 emission was measured during respiratory state 1 to state 5 for heart, cortex, and OM, while the mitochondria were fueled by Suc ± Rot following the timeline protocol of Fig. 1A. The resulting time course data on H2O2 concentrations in the buffer are shown in Fig. 7(A–C) and the corresponding summary of H2O2 emission rates during different respiratory states are shown in Fig. 7 (D–J). The amplex red and HRP-induced resorufin fluorescence was calibrated to H2O2 concentration (standard curve), as shown in Supplemental Fig. S1. Heart mitochondria demonstrated distinctly different H2O2 emission profiles compared to kidney cortex and OM mitochondria with Suc ± Rot as substrate (Fig. 7(A–C)). Specifically, heart mitochondria showed the highest H2O2 emission rate when they were fueled by Suc in the absence of Rot. However, when they were fueled by Suc in the presence of Rot, mitochondrial H2O2 emission decreased immensely, indicating that the increased H2O2 emission with Suc only was through RET and not through FET from complex II to complex III (Fig. 7(A, D)). Surprisingly, OM mitochondria followed a similar trend as that for heart mitochondria for H2O2 emission with Suc ± Rot substrates, but to a very lower extent (Fig. 7(C, F)). In contrast, cortex mitochondria did not show distinctly different H2O2 emission profiles between Suc and Suc + Rot substrates (Fig. 7(B, E)). Furthermore, heart mitochondrial H2O2 emission was reduced significantly during ADP-induced state 3 respiration with Suc, which did not return to state 2 level of H2O2 emission upon reaching state 4 after phosphorylation of the added ADP (Fig. 7D). This is in contrast to OM mitochondrial H2O2 emission with Suc, which decreased significantly during state 3 respiration but returned to state 2 level of H2O2 emission upon returning to state 4 after phosphorylation of the added ADP (Fig. 7F). In contrast, cortex mitochondrial H2O2 emission with Suc did not vary appreciably during different states of respiration (Fig. 7E). In all tissues studied, mitochondrial H2O2 emission with Suc decreased significantly during the uncoupler FCCP-induced state 5 respiration. Interestingly, for all tissues studied, mitochondrial H2O2 emission rates with Suc + Rot did not vary appreciably during different states of respiration, which were significantly lower in heart mitochondria compared to cortex and OM mitochondria. For clarity, the tissue-specific mitochondrial H2O2 emission rates for different respiratory states are shown in Fig. 7(G–J), which further quantify and compare H2O2 emission rates between different respiratory states and different tissues.
Fig. 7.
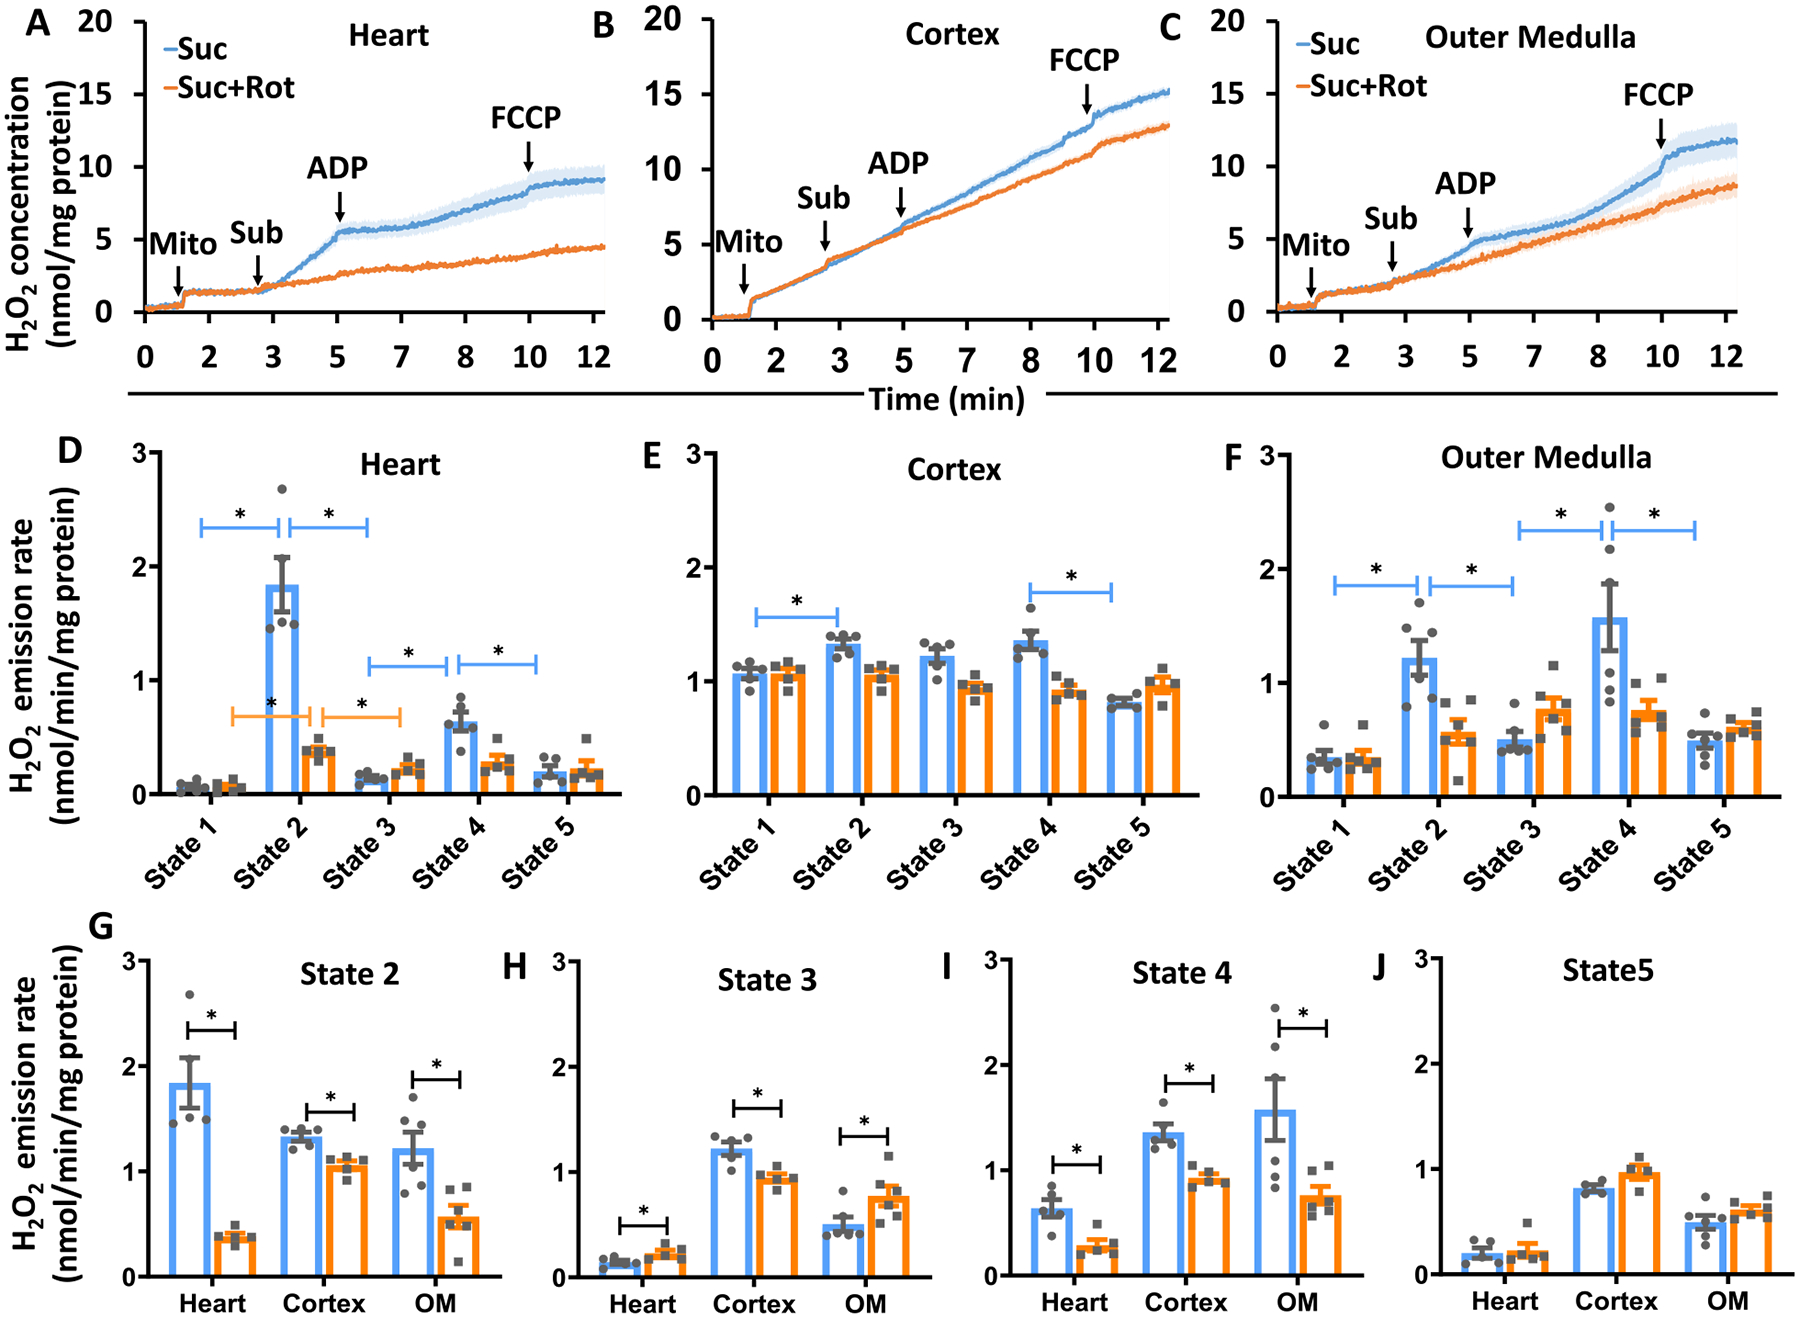
Tissue-specific mitochondrial H2O2 emission in the presence of Suc ± Rot following the timeline protocol of Fig. 1A. (A–C) Comparison of the time-courses of isolated mitochondrial H2O2 emission transitioning from state 1 to state 5 respiration for heart, cortex and OM. Black arrows show the times of mitochondria, substrate, ADP, and FCCP additions to the PTI spectrofluorometer cuvette in this order. (D–F) Comparison of isolated mitochondrial H2O2 emission rates under different respiration states (state 1 to state 5) for heart, cortex and OM. (G–J) Tissue-specific isolated mitochondrial H2O2 emission at different respiratory states (state 2 to stae 5) for heart, cortex and OM. Suc ± Rot: succinate±rotenone. Data are shown as average over n = 5 independent replicates ± S.E. for each substrate and tissue. The symbol ‘*’ shows the statistical significance (p < 0.05) on one-way ANOVA with repeated measures. Figures were generated using GraphPad Prism 9 software.
3.5. Tissue and substrate-specific differences in mitochondrial respiratory rates with sequential increases in ADP concentration
Dynamic responses in mitochondrial state 3 O2 consumption rates (OCR; JO2) were measured following sequential increases in ADP concentrations (25, 50, 75, 100, 150, and 250 μM) to a given mitochondrial suspension in the presence of different substrate combinations following the timeline protocol of Fig. 1B. This enabled the assessment of the substrate and/or tissue dependency of mitochondrial state 3 respiration with varying ADP concentrations. Fig. 8 shows the representative time courses of heart, cortex, and OM mitochondrial respiration in the presence of different substrate combinations following the protocol shown in Fig. 1B. Fig. 9 and Supplemental Fig. S4 show the summary of the substrate- and tissue-specific comparisons of state 3 OCR and the calculated respiratory control ratio (RCR) as functions of added ADP concentrations derived from the dynamic data exemplified in Fig. 8. The values of the substrate and tissue-specific apparent Vmax and Km of ADP estimated from the ADP concentration-dependent OCR data are shown in the Supplemental Fig. S5.
Fig. 8.
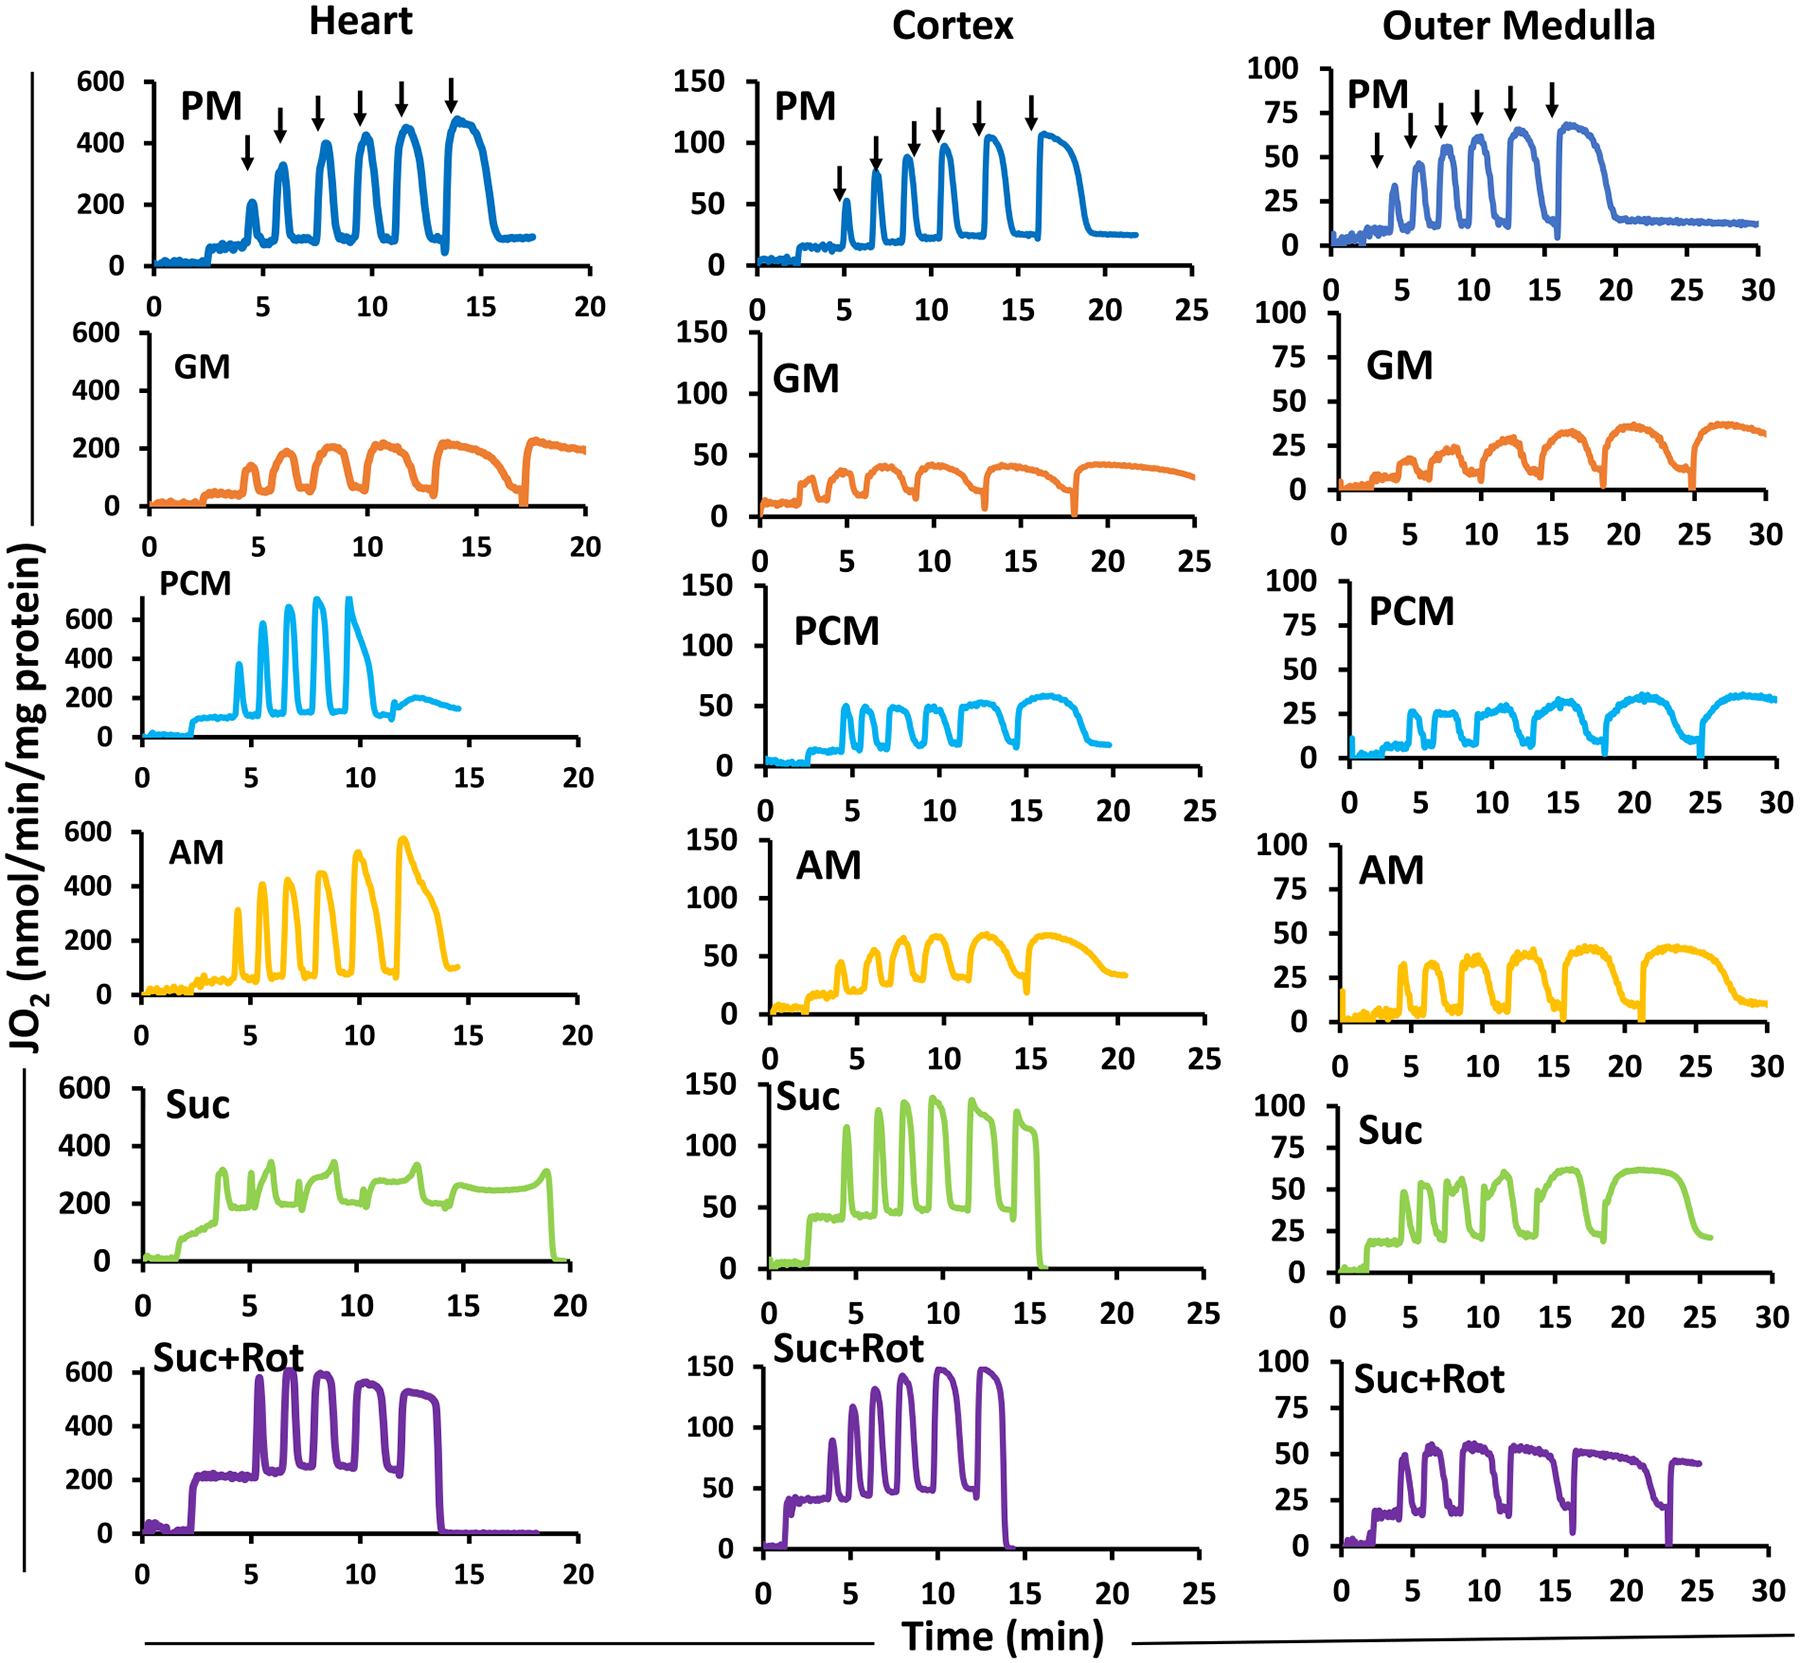
Representative time-courses of isolated mitochondrial respiration for the heart, cortex, and OM during sequential additions of incremental ADP concentrations in the presence of different substrates. The timeline experimental protocol is as described in Fig. 1B. The respiratory rates (O2 consumption rates; JO2) are expressed as nmol/min/mg mitochondrial protein. Isolated mitochondria (0.05 mg protein/ml for heart and 0.2 mg protein/ml for cortex and OM) were suspended in the respiration buffer (2 ml) at time t = 0 min and was energized by different substrate combinations (PM, GM, PCM, AM, or Suc ± Rot) at time t = 2 min. This was followed by sequential additions of incremental ADP concentrations until maximal respiration is reached. Black arrows indicate the times of ADP additions (25, 50, 75, 100, 150, and 250 μM) to the energized mitochondria in the Oroboros chamber. The rows are for different tissues and the columns are for different substrates. PM: pyruvate+malate, GM: glutamate+malate, PCM: palmitoyl-carnitine+malate, AM: alpha-ketoglutarate+malate, and Suc ± Rot: succinate±rotenone.
Fig. 9.
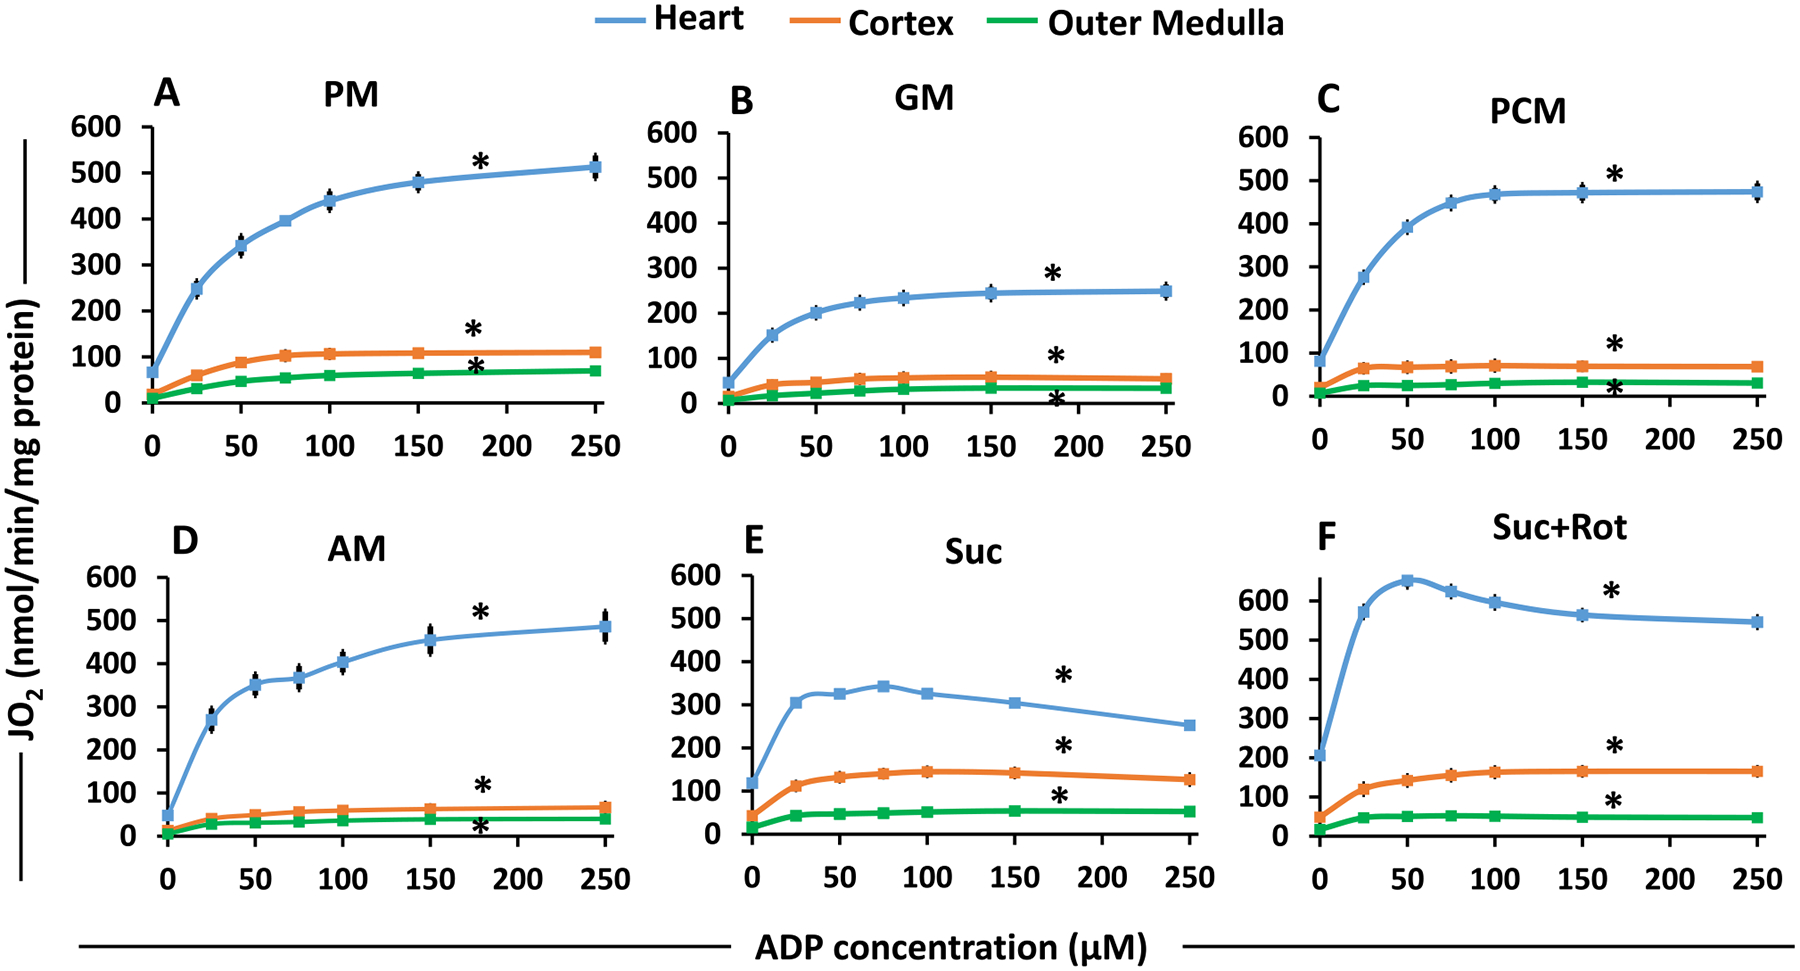
Substrate- and tissue-specific comparisons of isolated mitochondrial state 3 respiration for the heart, cortex and OM as functions of ADP concentrations for different substrates. These data are derived from the dynamic OCR (JO2) data shown in Fig. 7 with sequential additions of incremental ADP concentrations with different substrates. The substrate combinations used are PM (A), GM (B), PCM (C), AM (D), Suc (E), and Suc + Rot (F). Each plot shows the comparisons of state 3 OCR among the heart, cortex and OM mitochondria. Data are shown as average of n = 4–6 independent replicates with ± SE for each substrate and tissue. The symbol ‘*’ shows the statistical significance (p < 0.05) based on one-way ANOVA with repeated measures.
State 3 OCR was highest in heart mitochondria as compared to that in kidney mitochondria for all substrates studied (Fig. 9). In addition, for all substrates and all tissues studied, state 3 OCR increased with increasing ADP concentrations, reaching maximal value at saturating ADP concentrations. Additionally, GM resulted in the lowest state 3 OCR for all three tissues (Fig. 8B) and Suc + Rot resulted in the highest state 3 OCR for heart mitochondria (Fig. 9F). Note that state 3 OCR was not measurable at maximal ADP concentration (250 μM) in the presence of PCM and Suc ± Rot substrates for heart mitochondria due to high states 2 and 4 OCR which led to depletion of O2 from the O2k chamber (Fig. 8). For these substrates, state 3 OCR at ADP = 250 μM was assumed to be approximately equal to that at ADP = 150 μM.
The data from Fig. 9 was used to calculate RCR as a function of added ADP concentrations for each substrate and each tissue studied (Supplemental Fig. S4). It was calculated as the ratio of state 3 OCR at any given ADP to state 2 OCR at ADP = 0 and is considered an index of the efficiency of mitochondrial OxPhos to utilize a particular substrate to synthesize ATP from ADP and Pi. For all substrates and all tissues studied, RCR also increased with increasing ADP concentrations, reaching maximal value at saturating ADP concentrations. These maximal RCR values are close to the RCR values reported in Fig. 4D for different substrates and different tissue mitochondria with the addition of a single ADP concentration protocol.
Heart mitochondria showed the highest OCR (Fig. 9) and RCR/OxPhos efficiency (Supplement Fig. S4) for all substrate combinations studied (except Suc ± Rot) in comparison to kidney mitochondria (cortex and OM). Interestingly, OCRs of cortex mitochondria were higher than those for OM mitochondria (Fig. 9), but the efficiencies of OxPhos or RCRs in OM mitochondria were higher than those in cortex mitochondria (Supplement Fig. S4). In addition, the efficiencies of OxPhos or RCRs were higher for PM and AM but significantly lower for PCM, GM and Suc ± Rot. The RCRs with AM were markedly different between the heart, cortex, and OM mitochondria (Supplement Fig. S4 (D)), indicating that mitochondria of these different tissues utilize AM substrate very differently.
Further quantitative analysis of the data shown in Fig. 9 was performed using Michaelis-Menten equation (Eq. (1)) to estimate the tissue-specific apparent maximal state 3 respiratory rates (Vmax) and the corresponding values of Km of ADP in the presence of different substrate combinations (Supplement Fig. S5). The Vmax for different substrates for heart mitochondria were predictably higher than kidney (cortex and OM) mitochondria (Supplement Fig. S5(A)). The Vmax for the GM substrate was the lowest for mitochondria isolated from all three tissues as apparent from state 3 respiratory rates with saturated ADP concentrations (Figs. 4B and 9B). Also, higher Vmax was obtained when Suc was provided in the presence of Rot to heart mitochondria rather than only Suc, which was not the case for kidney cortex and OM mitochondria. The estimated values of Vmax and Km of ADP for heart and kidney mitochondria indicate that although Vmax values are much higher for the heart mitochondria than the kidney mitochondria, the Km of ADP values are quite similar for all tissues (Supplement Fig. S5(B)). The Km of ADP values for PM, GM, PCM, and AM substrates are predicted higher than Suc ± Rot substrates.
4. Discussion
Characterization of mitochondrial bioenergetic functions in different tissue types in the presence of different respiratory substrates and different ADP concentrations is essential for assessing the kinetics and efficiency of mitochondrial OxPhos of a given tissue and variations between tissues under physiological and pathophysiological conditions. The objective of the present study was therefore to characterize mitochondrial respiration and membrane potential (ΔΨm in mV) in the heart and kidneys (cortex and OM) of the same animal in response to perturbations of different ADP concentrations in the presence of different substrate combinations (PM, GM, PCM, AM, and Suc ± Rot). The results show that heart mitochondria had the highest respiratory rates (states 2–5) and highest OxPhos efficiencies for all substrate combinations studied in comparison to kidney cortex and OM mitochondria. The respiratory rates of cortex mitochondria were higher than OM mitochondria, but the efficiencies of OxPhos of OM mitochondria were higher than cortex mitochondria. In addition, distinct quantitative differences were observed in the rates of mitochondrial respiration and H2O2 emission and ΔΨm with Suc ± Rot substrate in these tissues. The quantification of these mitochondrial bioenergetic responses under well-defined and controlled conditions is of fundamental importance to understanding the relationships between substrate and energy metabolism in the heart and kidney (cortex and OM), and also essential for developing computational models that can predict the emergent properties of mitochondria bioenergetics of these vital organs under physiological and pathophysiological conditions.
4.1. Tissue-specific citrate synthase (CS) specific activity and functional integrity of isolated mitochondria from heart and kidney tissues
The crude mitochondrial pellet from a given tissue may contain non-mitochondrial or other subcellular organelles with similar density to mitochondria and the cellular contamination in the mitochondrial pellet may not be identical among different tissues and extractions [39]. As such, the mitochondrial respiratory rates are most commonly scaled by the amount of protein used in the experiment to normalize the data between isolations from the same tissue type. Additionally, the CS specific activity has been shown to be highly correlated with the mitochondrial content and the cristae density [40] and is one of the standards for normalization of the respiratory rates of mitochondria isolated from different tissues. However, when applied, this normalization method must be validated by comparing bioenergetic parameters measured in tissues with different functions and metabolic demands as carried out in the present studies. In this context, we found that mitochondria isolated from the heart (an organ with the highest energetic demand) predictably demonstrated the highest maximal respiration rates using nearly every substrate compared to kidney cortex and OM mitochondria (Figs. 3, 4, 8 and 9). However, the heart mitochondria showed only about 1.5 times higher CS specific activity than the kidney mitochondria (Fig. 2B). It is worth noting that the differences in the CS specific activity for the heart and kidney cortex and OM mitochondria are comparable to the differences in the RCR values for these tissues, as shown in Fig. 2A, which characterizes the functional integrity and intactness of isolated mitochondria.
In contrast to conventional thoughts, McLaughlin et al. [41] suggested that mitochondrial function is the result of the integration of several complex pathways, so the activity of any single enzyme (CS here) cannot be used to represent the overall mitochondrial content of tissues with different energy demands. They showed that the CS specific activity was not significantly correlated with the mitochondrial enrichment factor that was quantified by using a mass spectrometry-based method, i.e. mitochondrial-targeted LC-MS/MS. The method provided an unbiased comparison of mitochondrial functional parameters for metabolically distinct tissues. The CS specific activity data in literature varies with sample preparation, study treatments, and data representation. This includes tissue homogenate [42–44], mitochondrial isolation preparation, and ways of data normalization [45–48], among others. The mitochondrial respiratory rates presented in our study were normalized to per mg protein and not to the CS specific activity, as we presented the tissue and substrate-specific mitochondrial respiration rates and tissue-specific CS activity as separate parameters. Never-the-less, as mentioned above, the CS specific activity for the heart and kidney cortex and OM mitochondria correlated well with the corresponding RCR, suggesting minimal differences between the mitochondrial contents and the functional integrity and intactness of isolated mitochondria from these tissues in our studies.
4.2. Mitochondrial respiratory rate substrate response differences between heart and kidney tissues with addition of a fixed ADP concentration
Since organs and tissue types such as the heart and kidney have different energy demands, it is not surprising that their mitochondrial OxPhos capacities and efficiencies are different [1,49]. Yet, systematic and quantitative studies have not been carried out to determine the reasons for the differences in the OxPhos capacities and efficiencies of these organs and tissues. It is also interesting that the mitochondrial bioenergetics of the heart and kidney have not been determined together from mitochondria obtained from the same animal. It is important to establish certain baseline data to enable meaningful assessment of how mitochondrial disorders, which involve OxPhos, may alter the overall bioenergetics state of an organism [4]. It is therefore important to obtain the data from different organs from the same organism. In order to dissect the functionality of OxPhos, we also employed substrates that enter the TCA cycle through different mitochondrial substrate transport systems and utilize different dehydrogenases, and that donate their reducing equivalents to selective sites in the ETC. The addition of a fixed ADP concentration to isolated mitochondria in the presence of different substrate combinations enabled us to determine and compare tissue and substrate-specific respiratory states and rates subjected to an identical stimulus.
The classical work of Chance and coworker [50–53] on the kinetics of OxPhos introduced different states of mitochondrial respiration. These studies also suggested that a real steady state does not exist due to continuous changes in the ATP/ADP ratio where ADP is constantly converted to ATP. In our study, interestingly, state 2 respiration was significantly higher in the presence of the FADH2-linked substrate Suc ± Rot in comparison to the NADH-linked substrates studied for all tissue mitochondria (Fig. 4A), due to differential electron flow and proton pumping. This in turn led to differential mitochondrial energization with these different substrates. In contrast, state 3 respiration was highest in the presence of PM followed by Suc + Rot, PCM, AM, and GM in heart mitochondria, and it was highest in the presence of Suc ± Rot followed by PM, PCM, AM, and GM in cortex and OM mitochondria (Fig. 4B), indicating differential efficiency of mitochondrial OxPhos with different respiratory substrates in different tissues. GM is one substrate combination which showed the lowest state 3 respiration and OxPhos efficiency for all tissue mitochondria, and hence the longest state 3 duration. Moreover, heart mitochondria showed highest RCR, whereas cortex mitochondria showed lowest RCR and OM mitochondria showed intermediate RCR (Fig. 4D). This result is consistent with the observation that mitochondrial OxPhos efficiency in different regions of the kidney depends on varying transport functions of specific nephron segments [54]. Our data are also consistent with the evidence suggesting that the higher OxPhos efficiency and O2 affinity of renal medullary mitochondria as compared to those of cortex mitochondria evolved as an adaptation required to function under near hypoxic in vivo conditions [55].
The ratio of added ADP to the amount of O2 utilized during the resulting state 3 respiration is called the P/O ratio for OxPhos. In other words, it is the ATP produced per O2 consumed by the mitochondrial electron transport chain (ETC) and is known to have fractional values based on the chemiosmotic theory [56,57]. Hinkle et al. [58–60] proposed mechanistic P/O ratios of ~2.5 for the NADH-linked substrates (e. g., PM) and ~1.5 for the FADH2-linked substrates (e.g., Suc). In the present study, for all three tissues, P/O ratios were similar averaging 1.5 (±0.1) in the presence of Suc (Fig. 4F). For heart but not cortex and OM mitochondria, the P/O ratio was slightly higher in the presence of Suc + Rot (~1.8 ± 0.1) as compared to that in the presence of Suc. The P/O ratios for the NADH-linked substrates averaged 2.5 (±0.3) for all three tissues, consistent with the published literature [58–60].
The effects of substrate and tissue-specific mitochondrial uncoupling were determined by adding the uncoupler FCCP after state 4 respiration was reached. Overall, our data show a differential regulation of respiration (state 5) in the presence of FCCP due to differences in the metabolic environment. For all three tissues studied, a substantial increase in the OCR upon uncoupling was observed only when the PM substrate was provided (Fig. 4C). State 5 OCR for all other substrates was lower than state 3. These observations are consistent with those obtained using rat cancer cell lines [61] that demonstrated significant cell-specific responses to uncoupling, with the highest OCR achieved in the presence of glutamine and pyruvate as FCCP substantially decreased the influx of these substrates into the mitochondrial matrix. The study by Chowdhury et al. [62] also found OCR with PM to be stable after FCCP addition but not in the presence of GM at higher FCCP concentrations. A feature of the glutamate-aspartate antiporter is that it is not electroneutral, and hence the uncoupling effect may be impaired due to the symport of glutamate−-H+ coupled to glutamate-aspartate carrier. This may explain the different OCR values upon FCCP addition in the presence of PM and GM [63]. Our data regarding lower state 5 respiration rates than state 3 respiration rates for all substrates except PM can be explained as evidenced by others [64] that suggested a defect in the ETC and not in any structure of the OxPhos system.
4.3. Mitochondrial membrane potential substrate response differences between heart and kidney tissues with addition of a fixed ADP concentration
Upon the addition of a respiratory substrate, mitochondria produce the reducing equivalents NADH and FADH2 through the Krebs cycle for serial reduction of redox centers in the ETC. These redox reactions release protons (H+) from the mitochondrial matrix into the intermembrane space (IMS), thereby generating a proton motive force (Δp) comprised of ΔΨm and ΔpH [57,65]. This Δp is crucial for inward proton pumping at complex V (F1F0-ATPase) facilitating ATP production from ADP and Pi, and hence it is coupled to increased OCR. Thus, Δp is an important regulating factor of mitochondrial respiration [66]. In the present study, we were able to characterize the tissue and substrate-specific variations in ΔΨm under different respiratory states using the R123 fluorescent probe. The quantitative relationship between ΔΨm and R123 fluorescence intensity was determined by the application of a computational model that accounts for experimentally measured dye self-quenching, its transport across the IMM, and its partitioning into the mitochondrial matrix [38].
As seen in Fig. 5, variations in ΔΨm in response to the addition of substrates, ADP, and uncouplers to mitochondrial suspension of all three tissues were qualitatively quite similar, but significant quantitative differences were observed. The addition of a fixed ADP concentration (200 μM for heart and 100 μM for cortex and OM) showed different levels of maximal state 3 ΔΨm depolarization for heart, cortex and OM mitochondria. The heart mitochondria were least depolarized for all substrates studied with the exception of the FADH2-linked substrate Suc in the absence of Rot. In contrast, mitochondria from OM were the most depolarized for all substrates. The substrate combination GM took the longest to achieve repolarization after ADP addition for all tissues. This is also evident from the values of state 3 respiration and state 3 duration attained in the presence of GM, where the heart, cortex and OM mitochondria took the longest time to phosphorylate the added ADP. Tissue-specific differences in ΔΨm were apparent with Suc ± Rot, where the heart ΔΨm was more depolarized with Suc (~150 ± 2 mV) upon ADP addition, but not with Suc + Rot (~160 ± 1 mV). The time to recover the ADP-induced depolarization in heart mitochondria was less when complex I was inhibited by Rot. In contrast, the repolarization after ADP addition was similar for mitochondria from cortex and OM.
4.4. Succinate-fueled tissue-specific mitochondrial bioenergetics and H2O2 emission
Suc is not only a substrate for succinate dehydrogenase (SDH) enzyme donating two hydrogen ions to the ETC, but also an important metabolite localized at the crossroads of metabolic pathways and a product of substrate-level phosphorylation that occurs in the TCA cycle [67]. As such, SDH (i.e. complex II) couples two major pathways in the mitochondria, the TCA cycle and the ETC, both of which are crucial for OxPhos [68]. The present study provides novel data that is imperative to obtain a comprehensive understanding of Suc-driven tissue-specific mitochondrial bioenergetics and H2O2 emission by measuring key mitochondrial functional parameters such as OCR, ΔΨm and H2O2 emission in the presence of Suc ± Rot.
The present study suggests that heart mitochondria do not synthesize ATP efficiently from ADP with Suc in the absence of Rot may be due to i) possible accumulation of OAA and ii) potential occurrence of RET (Fig. 6A). In contrast, cortex and OM mitochondria achieved the same respiratory states with Suc ± Rot suggesting that efficient conversion of ADP to ATP by kidney mitochondria can occur in the presence of substrate Suc (Fig. 6B, C). These observations are also evident in Fig. 9(E, F), in which ADP was added sequentially and incrementally to mitochondrial suspension in the presence of Suc ± Rot. Based on existing studies, it appears that these differences can be explained by differing levels of oxaloacetate (OAA, an intermediate of the TCA cycle) accumulation, which inhibits succinate dehydrogenase (SDH) within complex II with high affinity (Kd ~ 10−8 M) in the presence of Suc alone [28,69–73]. These mechanisms are illustrated in Fig. 10 indicating that Rot inhibits the oxidation of NADH to NAD+, which blocks the conversion of malate to OAA as this reaction reduces NAD+ to NADH. As OAA is an inhibitor of the SDH enzyme, the addition of Rot increases the oxidation of Suc [74] and has been observed in heart and skeletal muscle mitochondria [75].
Fig. 10.
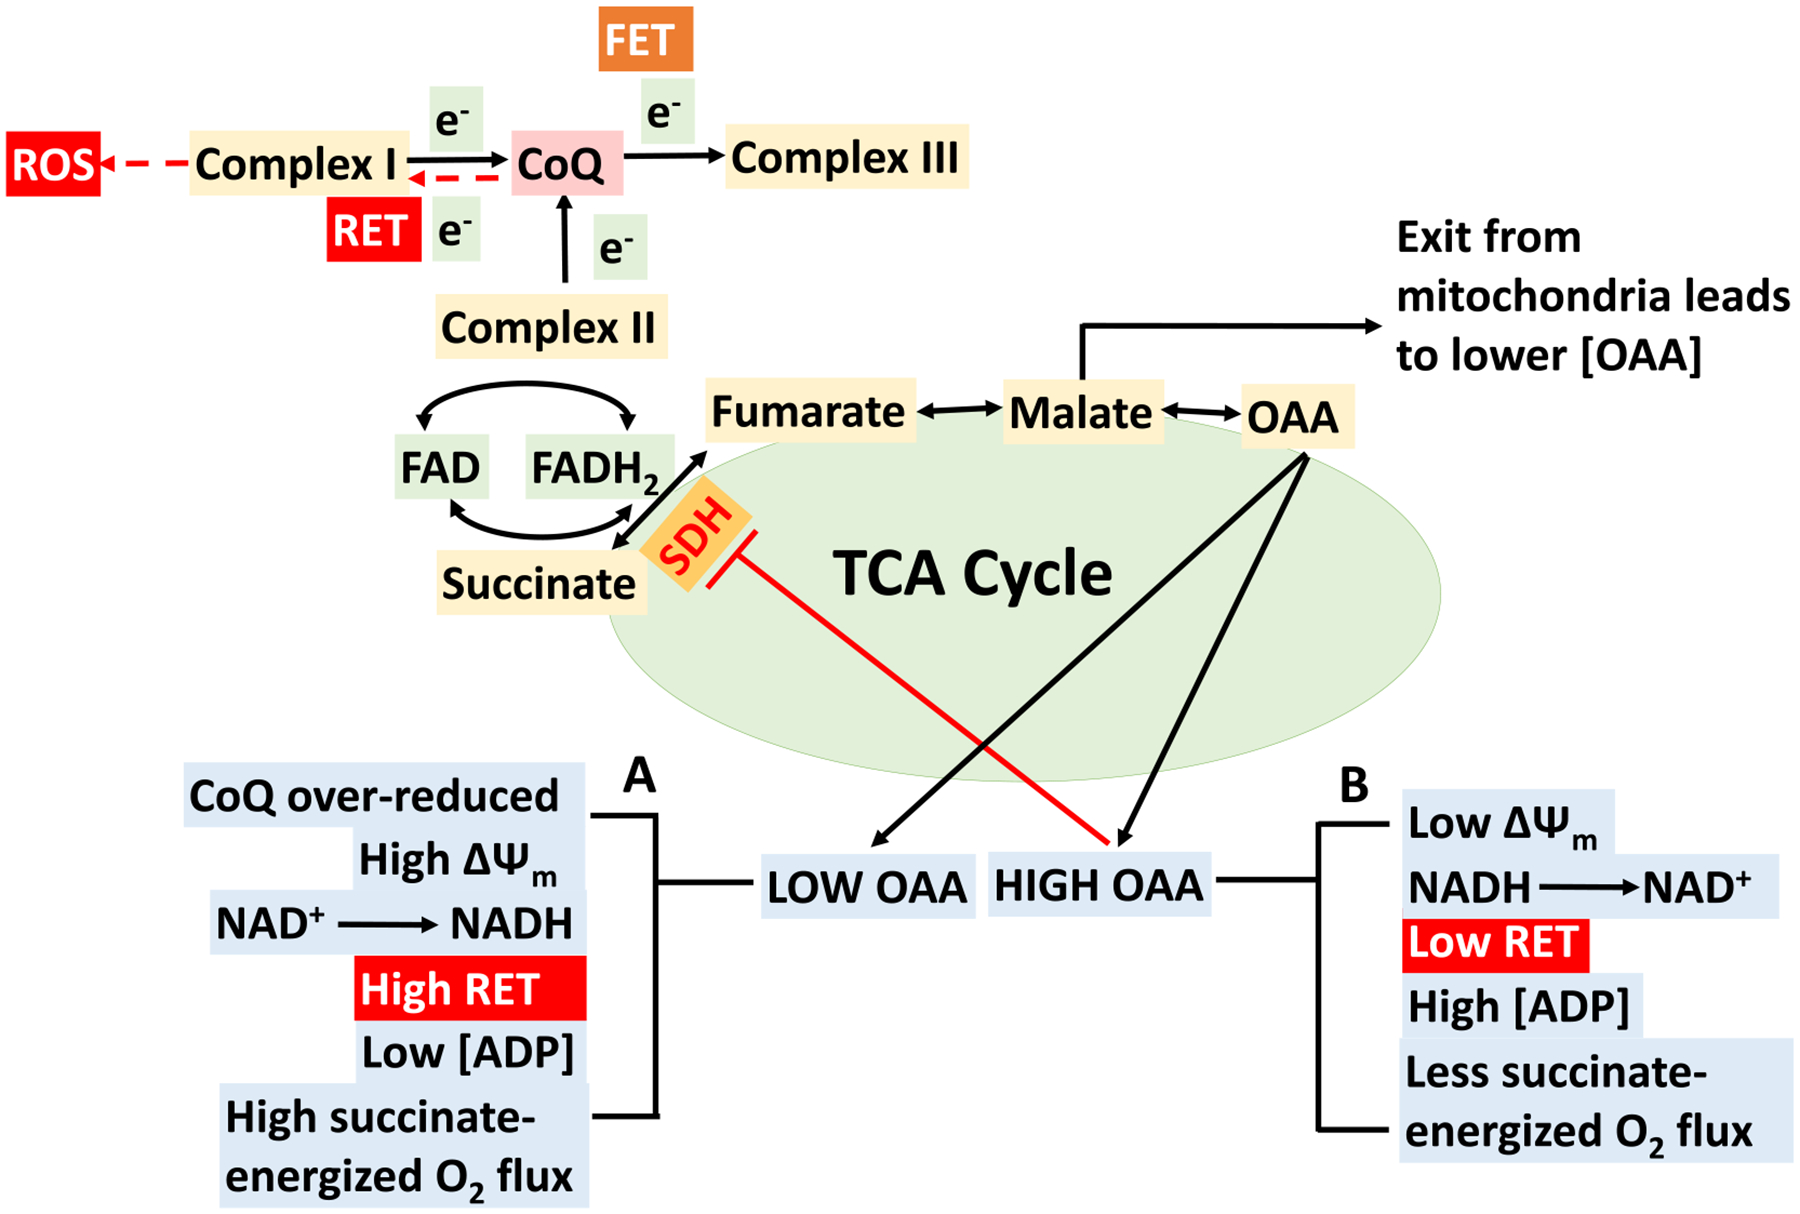
Schematics depicting postulated mechanisms behind the oxaloacetic acid (OAA) driven regulation of succinate-energized isolated cardiac mitochondrial bioenergetics. There are two scenarios: (A) low OAA and (B) high OAA. (A) Low OAA (due to minimal conversion of malate to OAA) does not hamper enzyme succinate dehydrogenase (SDH) catalytic activity to convert succinate into fumarate and complex II gets enough electrons to achieve sufficient succinate-energized mitochondrial respiration (O2 flux). The extent of O2 flux is regulated by the overall effects of mitochondrial membrane potential (ΔΨm) and reduction of NAD+. In this case, CoQ becomes over-reduced and higher ΔΨm favors reverse electron transfer (RET) from ubiquinol to complex I. Electron may leak at either IF/IQ site within complex I and generates RET-induced superoxide. Complex I (IQ site) inhibition by rotenone (Rot) in our experiment during RET prevents CoQ from transferring electrons back to complex I and thus reduces ROS production. RET prevents complex V making ATP, hence less ATP production at this stage. (B) Higher OAA accumulation occurs with addition of higher ADP concentration (200 μM for heart mitochondria in our study), leading to lower succinate-driven O2 flux. Higher concentration of ADP leads to drop in ΔΨm, which favors forward electron transfer (FET) enabling NADH providing electrons at complex I which abolishes RET. OAA accumulation is sufficient enough to inhibit SDH and thereby succinate-driven mitochondrial respiration.
A biphasic respiratory response (O2 flux; OCR; JO2) is observed upon the addition of a single ADP concentration or additions of sequential increases in ADP concentrations to heart mitochondria in the presence of Suc (see Figs. 3 and 8; traces with substrate Suc). As illustrated in Fig. 10, this biphasic response in the heart mitochondria is thought to be explained by the levels of oxaloacetate (OAA). High OAA is associated with low ΔΨm, greater oxidation of NADH to NAD+, higher concentrations of ADP, and less succinate-energized O2 flux. Conversely, low OAA is associated with greater reduction of CoQ, high ΔΨm, reduction of NAD+ to NADH, reduced levels of ADP, and high levels of Suc-energized O2 flux. Thus, respiration would diminish when ΔΨm decreases sufficiently to result in OAA accumulation and thereby account for the biphasic pattern of Suc-energized respiration in isolated cardiac mitochondria. Such effects of higher concentrations of OAA on lowering the SDH activity have been reported in previous studies using extracts of mouse skeletal muscle and interscapular brown adipose tissue mitochondria [75–77]. However, OAA accumulation can indirectly be reduced by adding the complex I inhibitor Rot which blocks re-oxidation of NADH to NAD+. Higher NADH level prevents the oxidation of malate by the enzyme malate dehydrogenase. Another important factor of lower complex II activity is the concentration of Suc itself. Since Suc is an intermediate of the TCA cycle, its steady-state concentration under normal conditions is low, indicating that complex II does not function at maximal velocity under normal conditions. Supporting the results for Suc-driven heart mitochondrial respiration, we found that the heart ΔΨm was lower (~150 mV) upon ADP addition in the presence of Suc only. When Suc was added in the presence of Rot, less time was required for the membrane to repolarize (Fig. 6D). Interestingly, in contrast to the heart, this observation is not prominent in either the cortex or OM of the kidney mitochondria, an important difference defining these two organs. This suggests that different tissues might have differential accumulation of OAA which inhibits SDH differentially and as a result state 3 mitochondrial respiration gets impacted at high ADP concentration [73,78,79].
Suc is also involved in the formation and elimination of ROS. There are many sites of ROS production in mitochondria. Complex I can generate ROS either through forward electron transfer (FET), i.e. NADH to Q, or through reverse electron transfer (RET), i.e. QH2 to NAD+ [80]. To elaborate, mitochondria exhibit higher ΔΨm when provided saturating levels of Suc. A few electrons from Suc can go in reverse through complex I and lead to the reduction of NAD+ to NADH. Under RET conditions, electrons from Suc are not only transferred from complex II to coenzyme Q (CoQ, ubiquinone) and then directed to O2 via complex III and cytochrome c oxidase, but can also partially go to complex I and ultimately reducing NAD+ to NADH [81]. During RET, electrons leak at either complex IF or IQ and generates a significant amount of superoxide. Therefore, mtROS production by RET can be inhibited by using the complex I inhibitor Rot [82]. RET in isolated mitochondria was first described in the 1960s [83], but the physiological relevance has been uncertain. ROS production in the presence of NADH-linked substrates is low, whereas FADH2-linked substrate Suc-supported respiration results in high rates of H2O2 production [84,85]. The ability of the FADH2-linked substrate Suc to drive RET was first demonstrated by Boveris et al. [86]. Other studies showed that Suc-driven respiration produces ~100-fold mitochondrial ROS (mtROS) compared to NADH-linked substrates [87–90].
It has been previously found that simultaneous oxidation of Suc and NADH-dependent substrates resulted in a higher mtROS production than with Suc alone in isolated mitochondria of skeletal muscle [91] and brain mitochondria [92]. The lack of RET in the presence of other substrates minimizes the risk of oxidative stress and damage by mtROS. This is important since different cell types differentially utilize various substrates such as fatty acids. In the current study, H2O2 emission data during state 2 suggest differential levels of RET-mediated H2O2 emission between tissues, with the heart mitochondrial showing the highest RET-mediated H2O2 emission, OM mitochondria showing the intermediate, and cortex mitochondria showing the lowest (Fig. 7). In addition, the H2O2 emission data during state 2 to state 4 transition suggest significantly reduced H2O2 emission during state 4 compared to state 2 in the heart mitochondria, but not in the kidney OM and cortex mitochondria. This is consistent with the observed differences in the responses of respiration and ΔΨm between the tissues during state 2 to state 4 transition (Fig. 6).
The contribution of mitochondrial complex II to the generation of mitochondrial ROS is of current interest [93]. Mitochondrial complex II oxidizes Suc to fumarate in the TCA cycle and reduces ubiquinone in the ETC. Suc oxidation kinetically and thermodynamically feeds electrons to the CoQ pool in mitochondria and generates a high proton motive force [94]. This indicates that Suc is a good substrate for ROS (here H2O2) production. Quinlan et al. [95,96] suggested complex II as a ROS contributor which depends upon the occupancy of the substrate oxidation site and the enzyme’s reduced state, i.e. ROS are only generated when the carboxylate binding site is not occupied and the flavin is reduced. RET generated ROS production can be differentiated from FET by using complex I inhibitor Rot as RET generated ROS is inhibited by adding Rot, however FET generated ROS is not. Of course, mtROS production rates at a given site are tissue-specific. In the current study, we followed the protocol Fig. 1A to measure complex II substrate (Suc) fueled ROS production. Our results confirm earlier observations that Rot, an inhibitor of the Q binding site of complex I (IQ), inhibits H2O2 formation at a higher magnitude, which is driven by RET from QH2 into complex I [97–99]. Our data is consistent with observations by Kwong et al. [84] which suggests that Rot inhibited the rate of Suc-supported H2O2 production in mouse heart, brain and kidney based on the fact that H2O2 generation depended on the sites, substrates choice and amounts of free radical leakage during electron transport in ETC. Our Suc-fueled (±Rot) bioenergetics and H2O2 emission data point to complex mechanisms involving differential RET-mediated H2O2 emission and differential OAA accumulation-induced inhibition of complex II/SDH in the heart and kidney (OM and cortex) mitochondria during state 3 and state 4 respiration induced by high ADP. For a broader picture, differential contributions of TCA cycle intermediates and the occasional removal of endogenous OAA regulate Suc-dependent ROS emission during RET [67,100]. By using a similar approaches to ours, Hoffman and Brookes [101,102] estimated the isolated mtROS production in SD rats under a variety of metabolic conditions and also observed a hyperbolic function of O2 concentration sensitivity (i.e. decreased mtROS at low [O2]) [101].
The present observations are not easily explained based on the classical textbook representation of these pathways which describes the respiratory complexes I, II and III as separate entities within the IMM that are functionally linked via coenzyme Q to transfer electrons from the reduced to the oxidized forms of the complexes [103]. If this representation was accurate, RET within complex I would proceed independently of the source of reduced CoQ resulting in a thermodynamically feasible process. However, there is ample evidence that indicates that mitochondrial CoQ does not form a common pool and is more or less bound to mitochondrial respiratory complexes [104,105]. Although much remains to be clarified regarding these biochemical and ultrastructural events, these constructs may help explain the involvement of respiratory complexes in Suc oxidation and RET occurrence from Suc to NAD+.
4.5. Tissue and substrate-specific differences in mitochondrial respiratory rates with sequential increases in ADP concentration
Cells have the ability to maintain a bioenergetically favorable cytosolic [ATP]/[ADP][Pi] ratio which tightly regulates the relationship between the rate of ATP utilization and the rate of ATP synthesis [106–109]. A few of earlier studies by Chance et al. [110,111] discussed the role of ADP and Pi as a ‘hyperbolic work-cost relationship’ (the velocity of the enzymatic reaction is equal to work) in context of metabolic control of OxPhos. In vivo, mitochondrial O2 consumption and ATP synthesis are determined by the cellular ATP demand, where the feedback by the energy state (cytosolic [ATP]/[ADP][Pi] ratio) is a major regulatory parameter. The consequence of this feedback is that mitochondrial OCR is coupled to the cytosolic [ATP]/[ADP][Pi] ratio [106,112]. For heart mitochondria, the feedback by ADP and Pi has been shown to be sufficient for the regulation of mitochondrial ATP synthesis over a wide range of ATP hydrolysis fluxes as determined in Wistar rats [30]. In the present study, sequential increases of ADP concentration characterized this feedback regulation of mitochondrial OxPhos. This relationship between increased energy demand and increased ADP concentration is important to both the contractile functions of the heart and tubular transport functions of the kidney. In the present study, isolated mitochondria from heart exhibited a substrate-specific maximal state 3 respiratory rate at 150 μM of ADP in the presence of GM and PCM substrates and 250 μM of ADP for the substrates PM and AM, while the cortex and OM mitochondria attained maximal state 3 respiratory rate at a lower ADP concentration of 150 μM for all substrate combinations.
Importantly, renal cortical mitochondria showed the lowest respiratory control ratio (RCR; state 3/state2 OCR) while those of the OM mitochondria exhibited higher levels indicating that mitochondria isolated from OM are more efficient than those of the cortical nephron, consistent with observations of Schiffer et al. [55]. Heart mitochondria clearly exhibited the highest RCR and most efficient rates of respiration (Fig. 9). In this context, heart mitochondria also showed the highest Vmax values for all substrates compared to cortex and OM mitochondria (Supplemental Fig. S5(A)). The estimated values of Vmax and Km of ADP for heart and kidney mitochondria indicate that although Vmax values are much higher for the heart mitochondria than the kidney mitochondria, the Km of ADP values are quite similar for different tissues for most substrates, with Suc ± Rot having the lowest Km of ADP values for all tissues (Supplement Fig. S5(B)). As indicated earlier, tissue O2 levels of the kidney are heterogeneous in different regions with a gradient from cortex to medulla and it appears that the mitochondria from medullary cells have indeed adapted to these near hypoxic in vivo conditions enabling them to sustain the ATP production rate required to reabsorb large amounts of Na+. As anticipated, the sequential increases of ADP concentrations representing an increased workload resulted in corresponding increases in ATP consumption. The increase in ADP concentration and the lower than expected energy state resulted from the increased rate of ATP production. This indicates that OxPhos is not only efficient in ATP production but also has a unique and well-defined capacity to regulate the metabolic energy state of the cell to provide a maintenance of metabolic homeostasis.
5. Conclusion
The present study provides novel quantitative data demonstrating that the choice of respiratory substrates (e.g. NADH or FADH2-linked substrates) profoundly affects mitochondrial respiratory responses and the efficiency of OxPhos in a tissue-specific manner. It is shown that alterations of respiratory substrates lead to dramatically different respiratory rates and membrane potentials of isolated mitochondria from the heart and kidney cortex and OM. The mitochondria of the heart and cortical and OM regions of the kidney utilize different respiratory substrates in synthesizing ATP from ADP and Pi. Our results are consistent with heart mitochondria and cortical mitochondria having the highest and lowest levels of efficiency of OxPhos and ATP synthesis, respectively, for the tissues studied. Furthermore, there are marked differences in the ways mitochondria of the heart and kidney cortex and OM utilize the FADH2-linked substrate succinate (Suc) in the absence and presence of the complex I inhibitor rotenone (Rot). Suc-fueled mitochondrial bioenergetics and H2O2 emission data indicate that complex mechanisms are involved. Our data indicate that both differential RET-mediated H2O2 emission and differential OAA accumulation-induced inhibition of complex II/SDH with high ADP contribute to the distinct tissue mitochondrial responses. The present study provides essential data required for the development of computational models of mitochondrial bioenergetics in the heart and kidney. Such models will provide a mechanistic and quantitative framework for investigating the emergent properties of cardiac and renal mitochondrial metabolic systems as is ongoing in our laboratory.
Supplementary Material
Acknowledgement
This work was supported by the NIH grants R01-HL151587 and P01-HL116264. The authors are thankful to the reviewer for their helpful criticisms which helped in improving the manuscript.
Abbreviations
- AM
alpha-ketoglutarate+malate
- BSA
bovine serum albumin
- CS
citrate synthase
- ETC
electron transport chain
- FET
forward electron transport
- GM
glutamate+malate
- IB
isolation buffer
- IMM
inner mitochondrial membrane
- mTAL
medullary thick ascending limbs of loop of Henle
- O2k
oxygraph-2k
- OAA
oxaloacetate
- OCR
oxygen consumption rate
- OM
outer medulla
- OxPhos
oxidative phosphorylation
- PCM
palmitoyl-carnitine+malate
- PCT
proximal convoluted tubules
- PM
pyruvate+malate
- P/O ratio
ADP consumed to O2 consumed ratio
- R123
rhodamine-123
- RB
respiration buffer
- RCR
respiratory control ratio
- RET
reverse electron transport
- ROS
reactive oxygen species
- Rot
rotenone
- SD
Sprague-Dawley
- SDH
succinate dehydrogenase
- Suc
succinate
- TCA
tricarboxylic acid cycle
- ΔΨm
mitochondrial membrane potential
Footnotes
Declaration of competing interest
The authors declare that they have no known competing financial interests or personal relationships that could have appeared to influence the work reported in this paper.
Appendix A. Supplementary data
Supplementary data to this article can be found online at https://doi.org/10.1016/j.bbabio.2021.148518.
References
- [1].Kunz WS, Different metabolic properties of mitochondrial oxidative phosphorylation in different cell types–important implications for mitochondrial cytopathies, Exp. Physiol 88 (1) (2003) 149–154. [DOI] [PubMed] [Google Scholar]
- [2].Johnson DT, et al. , Functional consequences of mitochondrial proteome heterogeneity, Am. J. Physiol. Cell Physiol 292 (2) (2007) C698–C707. [DOI] [PubMed] [Google Scholar]
- [3].Herbers E, et al. , Tissue specific differences in mitochondrial DNA maintenance and expression, Mitochondrion 44 (2019) 85–92. [DOI] [PubMed] [Google Scholar]
- [4].Rossignol R, et al. , Tissue variation in the control of oxidative phosphorylation: implication for mitochondrial diseases, Biochem. J 347 (Pt 1) (2000) 45–53. [PMC free article] [PubMed] [Google Scholar]
- [5].Pohjoismäki JL, Goffart S, The role of mitochondria in cardiac development and protection, Free Radic. Biol. Med 106 (2017) 345–354. [DOI] [PubMed] [Google Scholar]
- [6].Porter GA Jr., et al. , Bioenergetics, mitochondria, and cardiac myocyte differentiation, Prog. Pediatr. Cardiol 31 (2) (2011) 75–81. [DOI] [PMC free article] [PubMed] [Google Scholar]
- [7].Pagliarini DJ, et al. , A mitochondrial protein compendium elucidates complex I disease biology, Cell 134 (1) (2008) 112–123. [DOI] [PMC free article] [PubMed] [Google Scholar]
- [8].Wang Z, et al. , Specific metabolic rates of major organs and tissues across adulthood: evaluation by mechanistic model of resting energy expenditure, Am. J. Clin. Nutr 92 (6) (2010) 1369–1377. [DOI] [PMC free article] [PubMed] [Google Scholar]
- [9].Forbes JM, Mitochondria-power players in kidney Function? Trends Endocrinol Metab 27 (7) (2016) 441–442. [DOI] [PubMed] [Google Scholar]
- [10].Bhargava P, Schnellmann RG, Mitochondrial energetics in the kidney, Nat Rev Nephrol 13 (10) (2017) 629–646. [DOI] [PMC free article] [PubMed] [Google Scholar]
- [11].Tian Z, Liang M, Renal metabolism and hypertension, Nat Commun 12 (1) (2021) 963. [DOI] [PMC free article] [PubMed] [Google Scholar]
- [12].Di Lullo L, et al. , Chronic kidney disease and cardiovascular complications, Heart Fail. Rev 20 (3) (2015) 259–272. [DOI] [PubMed] [Google Scholar]
- [13].Ronco C, et al. , The cardiorenal syndrome, Blood Purif. 27 (1) (2009) 114–126. [DOI] [PubMed] [Google Scholar]
- [14].Eirin A, Lerman A, Lerman LO, Mitochondrial injury and dysfunction in hypertension-induced cardiac damage, Eur. Heart J 35 (46) (2014) 3258–3266. [DOI] [PMC free article] [PubMed] [Google Scholar]
- [15].Hillege HL, et al. , Renal function as a predictor of outcome in a broad spectrum of patients with heart failure, Circulation 113 (5) (2006) 671–678. [DOI] [PubMed] [Google Scholar]
- [16].Neely JR, Rovetto MJ, Oram JF, Myocardial utilization of carbohydrate and lipids, Prog. Cardiovasc. Dis 15 (3) (1972) 289–329. [DOI] [PubMed] [Google Scholar]
- [17].Mandel LJ, Metabolic substrates, cellular energy production, and the regulation of proximal tubular transport, Annu. Rev. Physiol 47 (1985) 85–101. [DOI] [PubMed] [Google Scholar]
- [18].Soltoff SP, ATP and the regulation of renal cell function, Annu. Rev. Physiol 48 (1986) 9–31. [DOI] [PubMed] [Google Scholar]
- [19].Katz AI, Distribution and function of classes of ATPases along the nephron, Kidney Int. 29 (1) (1986) 21–31. [DOI] [PubMed] [Google Scholar]
- [20].Doucet A, Katz AI, Morel F, Determination of na-K-ATPase activity in single segments of the mammalian nephron, Am. J. Phys 237 (2) (1979) F105–F113. [DOI] [PubMed] [Google Scholar]
- [21].Hall AM, et al. , Multiphoton imaging reveals differences in mitochondrial function between nephron segments, J Am Soc Nephrol 20 (6) (2009) 1293–1302. [DOI] [PMC free article] [PubMed] [Google Scholar]
- [22].Pfaller W, Rittinger M, Quantitative morphology of the rat kidney, Int J Biochem 12 (1–2) (1980) 17–22. [DOI] [PubMed] [Google Scholar]
- [23].Hall AM, Unwin RJ, The not so ‘mighty chondrion’: emergence of renal diseases due to mitochondrial dysfunction, Nephron Physiol 105 (1) (2007) 1–10. [DOI] [PubMed] [Google Scholar]
- [24].Singh P, Thomson SC, M. AA, Metabolic basis of solute transport, in: Yu A (Ed.), Brenner and Rector’s The Kidney, 11 ed, 2019. [Google Scholar]
- [25].C. G Yu Alan, Luyckx Valerie, Marsden Philip, Skorecki Karl, Taal Maarten, Brenner & Rector’s The Kidney 11 ed., 2, Elsevier, 2019. [Google Scholar]
- [26].Evans RG, et al. , Intrarenal oxygenation: unique challenges and the biophysical basis of homeostasis, Am. J. Physiol. Renal Physiol 295 (5) (2008) F1259–F1270. [DOI] [PubMed] [Google Scholar]
- [27].De Meis L, et al. , Brown adipose tissue mitochondria: modulation by GDP and fatty acids depends on the respiratory substrates, Biosci. Rep 32 (1) (2012) 53–59. [DOI] [PMC free article] [PubMed] [Google Scholar]
- [28].Agarwal B, et al. , Isoflurane modulates cardiac mitochondrial bioenergetics by selectively attenuating respiratory complexes, Biochim. Biophys. Acta 1837 (3) (2014) 354–365. [DOI] [PMC free article] [PubMed] [Google Scholar]
- [29].Agarwal B, et al. , Enhanced charge-independent mitochondrial free Ca(2+) and attenuated ADP-induced NADH oxidation by isoflurane: implications for cardioprotection, Biochim. Biophys. Acta 1817 (3) (2012) 453–465. [DOI] [PMC free article] [PubMed] [Google Scholar]
- [30].Vinnakota KC, et al. , Feedback regulation and time hierarchy of oxidative phosphorylation in cardiac mitochondria, Biophys. J 110 (4) (2016) 972–980. [DOI] [PMC free article] [PubMed] [Google Scholar]
- [31].Vinnakota KC, Dash RK, Beard DA, Stimulatory effects of calcium on respiration and NAD(P)H synthesis in intact rat heart mitochondria utilizing physiological substrates cannot explain respiratory control in vivo, J. Biol. Chem 286 (35) (2011) 30816–30822. [DOI] [PMC free article] [PubMed] [Google Scholar]
- [32].Bradford MM, A rapid and sensitive method for the quantitation of microgram quantities of protein utilizing the principle of protein-dye binding, Anal. Biochem 72 (1976) 248–254. [DOI] [PubMed] [Google Scholar]
- [33].Srere PA, Citrate Synthase, Methods Enzymol. (1969) 3–11. [Google Scholar]
- [34].Eigentler A, Draxl A, Gnaiger E, Laboratory protocol: citrate synthase, A mitochondrial marker enzyme, in: MiPNet 17:1–11 17.04, Mitochondrial Physiology Network, 2020, pp. 1–12. [Google Scholar]
- [35].Scaduto RC Jr., Grotyohann LW, Measurement of mitochondrial membrane potential using fluorescent rhodamine derivatives, Biophys. J 76 (1 Pt 1) (1999) 469–477. [DOI] [PMC free article] [PubMed] [Google Scholar]
- [36].Baracca A, et al. , Rhodamine 123 as a probe of mitochondrial membrane potential: evaluation of proton flux through F(0) during ATP synthesis, Biochim. Biophys. Acta 1606 (1–3) (2003) 137–146. [DOI] [PubMed] [Google Scholar]
- [37].Agarwal B, et al. , Enhanced charge-independent mitochondrial free Ca2+ and attenuated ADP-induced NADH oxidation by isoflurane: implications for cardioprotection, Biochim. Biophys. Acta - Bioenerg 1817 (3) (2012) 453–465. [DOI] [PMC free article] [PubMed] [Google Scholar]
- [38].Huang M, et al. , Mitochondrial inner membrane electrophysiology assessed by rhodamine-123 transport and fluorescence, Ann. Biomed. Eng 35 (7) (2007) 1276–1285. [DOI] [PMC free article] [PubMed] [Google Scholar]
- [39].van der Walt G, Louw R, Novel mitochondrial and cytosolic purification pipeline for compartment-specific metabolomics in mammalian disease model tissues, Metabolomics 16 (7) (2020) 78. [DOI] [PubMed] [Google Scholar]
- [40].Larsen S, et al. , Biomarkers of mitochondrial content in skeletal muscle of healthy young human subjects, J. Physiol 590 (14) (2012) 3349–3360. [DOI] [PMC free article] [PubMed] [Google Scholar]
- [41].McLaughlin KL, et al. , Novel approach to quantify mitochondrial content and intrinsic bioenergetic efficiency across organs, Sci. Rep 10 (1) (2020) 17599. [DOI] [PMC free article] [PubMed] [Google Scholar]
- [42].Papatheodorou I, et al. , Cardioprotective effects of PPARbeta/delta activation against Ischemia/Reperfusion injury in rat heart are associated with ALDH2 upregulation, amelioration of oxidative stress and preservation of mitochondrial energy production, Int. J. Mol. Sci 22 (12) (2021). [DOI] [PMC free article] [PubMed] [Google Scholar]
- [43].Jespersen NR, et al. , Cardioprotective effect of succinate dehydrogenase inhibition in rat hearts and human myocardium with and without diabetes mellitus, Sci. Rep 10 (1) (2020) 10344. [DOI] [PMC free article] [PubMed] [Google Scholar]
- [44].Barton GP, et al. , Mitochondrial and metabolic gene expression in the aged rat heart, Front. Physiol 7 (2016) 352. [DOI] [PMC free article] [PubMed] [Google Scholar]
- [45].Bagul PK, et al. , SIRT-3 modulation by resveratrol improves mitochondrial oxidative phosphorylation in diabetic heart through deacetylation of TFAM, Cells 7 (12) (2018). [DOI] [PMC free article] [PubMed] [Google Scholar]
- [46].Schwarzer M, et al. , Pressure overload differentially affects respiratory capacity in interfibrillar and subsarcolemmal mitochondria, Am. J. Physiol. Heart Circ. Physiol 304 (4) (2013) H529–H537. [DOI] [PubMed] [Google Scholar]
- [47].Zungu M, et al. , Genomic modulation of mitochondrial respiratory genes in the hypertrophied heart reflects adaptive changes in mitochondrial and contractile function, Am. J. Physiol. Heart Circ. Physiol 293 (5) (2007) H2819–H2825. [DOI] [PubMed] [Google Scholar]
- [48].Siu PM, et al. , Citrate synthase expression and enzyme activity after endurance training in cardiac and skeletal muscles, J. Appl. Physiol 94 (2) (2003) 555–560. [DOI] [PubMed] [Google Scholar]
- [49].Leverve XM, Fontaine E, Role of substrates in the regulation of mitochondrial function in situ, IUBMB Life 52 (3–5) (2001) 221–229. [DOI] [PubMed] [Google Scholar]
- [50].Chance B, Williams GR, Respiratory enzymes in oxidative phosphorylation. I. Kinetics of oxygen utilization, J. Biol. Chem 217 (1) (1955) 383–393. [PubMed] [Google Scholar]
- [51].Chance B, Williams GR, Respiratory enzymes in oxidative phosphorylation. III. The steady state, J. Biol. Chem 217 (1) (1955) 409–427. [PubMed] [Google Scholar]
- [52].Chance B, Williams GR, Respiratory enzymes in oxidative phosphorylation. IV. The respiratory chain, J. Biol. Chem 217 (1) (1955) 429–438. [PubMed] [Google Scholar]
- [53].Chance B, et al. , Respiratory enzymes in oxidative phosphorylation. V. A mechanism for oxidative phosphorylation, J. Biol. Chem 217 (1) (1955) 439–451. [PubMed] [Google Scholar]
- [54].Epstein FH, Agmon Y, Brezis M, Physiology of renal hypoxia, Ann N Y Acad Sci 718 (1994) 72–81, discussion 81-2. [PubMed] [Google Scholar]
- [55].Schiffer TA, Gustafsson H, Palm F, Kidney outer medulla mitochondria are more efficient compared with cortex mitochondria as a strategy to sustain ATP production in a suboptimal environment, Am J Physiol Renal Physiol 315 (3) (2018) F677–F681. [DOI] [PubMed] [Google Scholar]
- [56].Mitchell P, Coupling of phosphorylation to electron and hydrogen transfer by a chemi-osmotic type of mechanism, Nature 191 (1961) 144–148. [DOI] [PubMed] [Google Scholar]
- [57].Mitchell P, Moyle J, Chemiosmotic hypothesis of oxidative phosphorylation, Nature 213 (5072) (1967) 137–139. [DOI] [PubMed] [Google Scholar]
- [58].Hinkle PC, P/O ratios of mitochondrial oxidative phosphorylation, Biochim. Biophys. Acta 1706 (1–2) (2005) 1–11. [DOI] [PubMed] [Google Scholar]
- [59].Hinkle PC, Yu ML, The phosphorus/oxygen ratio of mitochondrial oxidative phosphorylation, J. Biol. Chem 254 (7) (1979) 2450–2455. [PubMed] [Google Scholar]
- [60].Hinkle PC, et al. , Mechanistic stoichiometry of mitochondrial oxidative phosphorylation, Biochemistry 30 (14) (1991) 3576–3582. [DOI] [PubMed] [Google Scholar]
- [61].Zhdanov AV, et al. , Availability of the key metabolic substrates dictates the respiratory response of cancer cells to the mitochondrial uncoupling, Biochim. Biophys. Acta 1837 (1) (2014) 51–62. [DOI] [PubMed] [Google Scholar]
- [62].Chowdhury SR, et al. , Simultaneous evaluation of substrate-dependent oxygen consumption rates and mitochondrial membrane potential by TMRM and safranin in cortical mitochondria, Biosci. Rep 36 (1) (2015), e00286. [DOI] [PMC free article] [PubMed] [Google Scholar]
- [63].LaNoue KF, Tischler ME, Electrogenic characteristics of the mitochondrial glutamate-aspartate antiporter, J. Biol. Chem 249 (23) (1974) 7522–7528. [PubMed] [Google Scholar]
- [64].Rosca MG, et al. , Cardiac mitochondria in heart failure: decrease in respirasomes and oxidative phosphorylation, Cardiovasc. Res 80 (1) (2008) 30–39. [DOI] [PMC free article] [PubMed] [Google Scholar]
- [65].Nicholls DG, Mitochondrial membrane potential and aging, Aging Cell 3 (1) (2004) 35–40. [DOI] [PubMed] [Google Scholar]
- [66].Brown GC, Lakin-Thomas PL, Brand MD, Control of respiration and oxidative phosphorylation in isolated rat liver cells, Eur. J. Biochem 192 (2) (1990) 355–362. [DOI] [PubMed] [Google Scholar]
- [67].Tretter L, Patocs A, Chinopoulos C, Succinate, an intermediate in metabolism, signal transduction, ROS, hypoxia, and tumorigenesis, Biochim. Biophys. Acta 1857 (8) (2016) 1086–1101. [DOI] [PubMed] [Google Scholar]
- [68].Bezawork-Geleta A, et al. , Mitochondrial complex II: at the crossroads, Trends Biochem. Sci 42 (4) (2017) 312–325. [DOI] [PMC free article] [PubMed] [Google Scholar]
- [69].Schollmeyer P, Klingenberg M, Oxaloacetate and adenosinetriphosphate levels during inhibition and activation of succinate oxidation, Biochem. Biophys. Res. Commun 4 (1961) 43–47. [DOI] [PubMed] [Google Scholar]
- [70].Chance B, Hagihara B, Activation and inhibition of succinate oxidation following adenosine diphosphate supplements to pigeon heart mitochondria, J. Biol. Chem 237 (1962) 3540–3545. [PubMed] [Google Scholar]
- [71].Panov AV, et al. , Metabolic and functional differences between brain and spinal cord mitochondria underlie different predisposition to pathology, Am. J. Physiol. Regul. Integr. Comp. Physiol 300 (4) (2011) R844–R854. [DOI] [PMC free article] [PubMed] [Google Scholar]
- [72].Azzone GF, Ernster L, Klingenberg M, Energetic aspects of the mitochondrial oxidation of succinate, Nature 188 (1960) 552–555. [DOI] [PubMed] [Google Scholar]
- [73].Stepanova A, et al. , Differential susceptibility of mitochondrial complex II to inhibition by oxaloacetate in brain and heart, Biochim. Biophys. Acta 1857 (9) (2016) 1561–1568. [DOI] [PMC free article] [PubMed] [Google Scholar]
- [74].Papa S, et al. , Mechanism of inhibition by uncouples of succinate oxidation in isolated mitochondria, Biochim. Biophys. Acta 180 (1) (1969) 35–44. [DOI] [PubMed] [Google Scholar]
- [75].Fink BD, Yu L, Sivitz WI, Modulation of complex II-energized respiration in muscle, heart, and brown adipose mitochondria by oxaloacetate and complex I electron flow, FASEB J. 33 (11) (2019) 11696–11705. [DOI] [PMC free article] [PubMed] [Google Scholar]
- [76].Fink BD, et al. , Oxaloacetic acid mediates ADP-dependent inhibition of mitochondrial complex II-driven respiration, J. Biol. Chem 293 (51) (2018) 19932–19941. [DOI] [PMC free article] [PubMed] [Google Scholar]
- [77].Gutman M, Kearney EB, Singer TP, Control of succinate dehydrogenase in mitochondria, Biochemistry 10 (25) (1971) 4763–4770. [DOI] [PubMed] [Google Scholar]
- [78].Kotlyar AB, Vinogradov AD, Interaction of the membrane-bound succinate dehydrogenase with substrate and competitive inhibitors, Biochim. Biophys. Acta 784 (1) (1984) 24–34. [DOI] [PubMed] [Google Scholar]
- [79].Armstrong C, Staples JF, The role of succinate dehydrogenase and oxaloacetate in metabolic suppression during hibernation and arousal, J. Comp. Physiol. B 180 (5) (2010) 775–783. [DOI] [PubMed] [Google Scholar]
- [80].Kushnareva Y, Murphy AN, Andreyev A, Complex I-mediated reactive oxygen species generation: modulation by cytochrome c and NAD(P)+ oxidation-reduction state, Biochem. J 368 (Pt 2) (2002) 545–553. [DOI] [PMC free article] [PubMed] [Google Scholar]
- [81].Stepanova A, et al. , Reverse electron transfer results in a loss of flavin from mitochondrial complex I: potential mechanism for brain ischemia reperfusion injury, J. Cereb. Blood Flow Metab 37 (12) (2017) 3649–3658. [DOI] [PMC free article] [PubMed] [Google Scholar]
- [82].Lambert AJ, Brand MD, Inhibitors of the quinone-binding site allow rapid superoxide production from mitochondrial NADH:ubiquinone oxidoreductase (complex I), J. Biol. Chem 279 (38) (2004) 39414–39420. [DOI] [PubMed] [Google Scholar]
- [83].Chance B, The interaction of energy and electron transfer reactions in mitochondria. II. General properties of adenosine triphosphate-linked oxidation of cytochrome and reduction of pyridine nucleotide, J. Biol. Chem 236 (1961) 1544–1554. [PubMed] [Google Scholar]
- [84].Kwong LK, Sohal RS, Substrate and site specificity of hydrogen peroxide generation in mouse mitochondria, Arch. Biochem. Biophys 350 (1) (1998) 118–126. [DOI] [PubMed] [Google Scholar]
- [85].Ross T, et al. , Reverse electron flow-mediated ROS generation in ischemia-damaged mitochondria: role of complex I inhibition vs. Depolarization of inner mitochondrial membrane, Biochim. Biophys. Acta 1830 (10) (2013) 4537–4542. [DOI] [PMC free article] [PubMed] [Google Scholar]
- [86].Boveris A, Oshino N, Chance B, The cellular production of hydrogen peroxide, Biochem. J 128 (3) (1972) 617–630. [DOI] [PMC free article] [PubMed] [Google Scholar]
- [87].Chouchani ET, et al. , A unifying mechanism for mitochondrial superoxide production during ischemia-reperfusion injury, Cell Metab. 23 (2) (2016) 254–263. [DOI] [PubMed] [Google Scholar]
- [88].Chouchani ET, et al. , Ischaemic accumulation of succinate controls reperfusion injury through mitochondrial ROS, Nature 515 (7527) (2014) 431–435. [DOI] [PMC free article] [PubMed] [Google Scholar]
- [89].Quinlan CL, et al. , Sites of reactive oxygen species generation by mitochondria oxidizing different substrates, Redox Biol. 1 (2013) 304–312. [DOI] [PMC free article] [PubMed] [Google Scholar]
- [90].Starkov AA, The role of mitochondria in reactive oxygen species metabolism and signaling, Ann. N. Y. Acad. Sci 1147 (2008) 37–52. [DOI] [PMC free article] [PubMed] [Google Scholar]
- [91].Muller FL, et al. , High rates of superoxide production in skeletal-muscle mitochondria respiring on both complex I- and complex II-linked substrates, Biochem. J 409 (2) (2008) 491–499. [DOI] [PubMed] [Google Scholar]
- [92].Panov A, et al. , The neuromediator glutamate, through specific substrate interactions, enhances mitochondrial ATP production and reactive oxygen species generation in nonsynaptic brain mitochondria, J. Biol. Chem 284 (21) (2009) 14448–14456. [DOI] [PMC free article] [PubMed] [Google Scholar]
- [93].Audi SH, et al. , Detection of hydrogen peroxide production in the isolated rat lung using amplex red, Free Radic. Res 52 (9) (2018) 1052–1062. [DOI] [PMC free article] [PubMed] [Google Scholar]
- [94].Chen YR, Zweier JL, Cardiac mitochondria and reactive oxygen species generation, Circ. Res 114 (3) (2014) 524–537. [DOI] [PMC free article] [PubMed] [Google Scholar]
- [95].Quinlan CL, et al. , Mitochondrial complex II can generate reactive oxygen species at high rates in both the forward and reverse reactions, J. Biol. Chem 287 (32) (2012) 27255–27264. [DOI] [PMC free article] [PubMed] [Google Scholar]
- [96].Quinlan CL, et al. , The determination and analysis of site-specific rates of mitochondrial reactive oxygen species production, Methods Enzymol. 526 (2013) 189–217. [DOI] [PMC free article] [PubMed] [Google Scholar]
- [97].St-Pierre J, et al. , Topology of superoxide production from different sites in the mitochondrial electron transport chain, J. Biol. Chem 277 (47) (2002) 44784–44790. [DOI] [PubMed] [Google Scholar]
- [98].Hansford RG, Hogue BA, Mildaziene V, Dependence of H2O2 formation by rat heart mitochondria on substrate availability and donor age, J. Bioenerg. Biomembr 29 (1) (1997) 89–95. [DOI] [PubMed] [Google Scholar]
- [99].Brand MD, The sites and topology of mitochondrial superoxide production, Exp. Gerontol 45 (7–8) (2010) 466–472. [DOI] [PMC free article] [PubMed] [Google Scholar]
- [100].Drose S, Differential effects of complex II on mitochondrial ROS production and their relation to cardioprotective pre- and postconditioning, Biochim. Biophys. Acta 1827 (5) (2013) 578–587. [DOI] [PubMed] [Google Scholar]
- [101].Hoffman DL, Brookes PS, Oxygen sensitivity of mitochondrial reactive oxygen species generation depends on metabolic conditions, J. Biol. Chem 284 (24) (2009) 16236–16245. [DOI] [PMC free article] [PubMed] [Google Scholar]
- [102].Hoffman DL, Salter JD, Brookes PS, Response of mitochondrial reactive oxygen species generation to steady-state oxygen tension: implications for hypoxic cell signaling, Am. J. Physiol. Heart Circ. Physiol 292 (1) (2007) H101–H108. [DOI] [PubMed] [Google Scholar]
- [103].Nicholls DG, Ferguson SJ, Bioenergetics 3, Biochem. Mosc 69 (2004) 818–819. [Google Scholar]
- [104].Lenaz G, et al. , The role of coenzyme Q in mitochondrial electron transport, Mitochondrion 7 (Suppl) (2007) S8–S33. [DOI] [PubMed] [Google Scholar]
- [105].Lenaz G, Genova ML, Structural and functional organization of the mitochondrial respiratory chain: a dynamic super-assembly, Int. J. Biochem. Cell Biol 41 (10) (2009) 1750–1772. [DOI] [PubMed] [Google Scholar]
- [106].Wilson DF, Oxidative phosphorylation: regulation and role in cellular and tissue metabolism, J. Physiol 595 (23) (2017) 7023–7038. [DOI] [PMC free article] [PubMed] [Google Scholar]
- [107].Gibbs C, Respiratory control in normal and hypertrophic hearts, Cardiovasc. Res 42 (3) (1999) 567–570. [DOI] [PubMed] [Google Scholar]
- [108].Balaban RS, Regulation of oxidative phosphorylation in the mammalian cell, Am. J. Phys 258 (3 Pt 1) (1990) C377–C389. [DOI] [PubMed] [Google Scholar]
- [109].Harris DA, Das AM, Control of mitochondrial ATP synthesis in the heart, Biochem. J 280 (Pt 3) (1991) 561–573. [DOI] [PMC free article] [PubMed] [Google Scholar]
- [110].Chance B, et al. , Control of oxidative metabolism and oxygen delivery in human skeletal muscle: a steady-state analysis of the work/energy cost transfer function, Proc. Natl. Acad. Sci. U. S. A 82 (24) (1985) 8384–8388. [DOI] [PMC free article] [PubMed] [Google Scholar]
- [111].Chance B, et al. , Multiple controls of oxidative metabolism in living tissues as studied by phosphorus magnetic resonance, Proc. Natl. Acad. Sci. U. S. A 83 (24) (1986) 9458–9462. [DOI] [PMC free article] [PubMed] [Google Scholar]
- [112].Wilson DF, Oxidative phosphorylation: unique regulatory mechanism and role in metabolic homeostasis, J. Appl. Physiol 122 (3) (1985) 611–619. [DOI] [PubMed] [Google Scholar]
Associated Data
This section collects any data citations, data availability statements, or supplementary materials included in this article.